

Comparison of a capillary blood collection device and standard venepuncture for routine clinical biochemistry assays: developing reasonable adjustment phlebotomy for patients with learning disabilities
Abstract
Attending a phlebotomy appointment can cause high levels of anxiety, especially in patients with learning disabilities (LD). This project explores the validation of blood tests using capillary blood versus routine venepuncture samples and looks at reducing healthcare inequalities in our local population by providing painless capillary blood testing. Aim: To validate reduced total serum volume required for 23 biochemistry tests, to investigate comparability of results from capillary blood using an upper arm device versus standard venous collection. A secondary aim was to determine the feasibility of capillary blood collection in a community-based population with LD and needle phobia. Materials & methods: Total serum sample volume was reduced until Beckman Coulter AU5800 and DXI800 automated analyzers flagged insufficient sample at a rate of <5% for 23 routine biochemistry tests. Venous and contemporary capillary collections were made from 74 primary care patient volunteers undergoing routine health checks, following informed consent. Comparative statistical analysis (Pearson/Spearman correlation, Bland–Altman) was used to determine interchangeability between the two sets of results. Supervised capillary sampling was then piloted in 20 patients with LD and needle phobia in a community setting. Questionnaires were provided for assessing user acceptability. Results: Total serum volume used for analysis was reduced by up to 30% for some assays. Interchangeability of results was seen with total bilirubin, ALT, ALP, total protein, phosphate, total, LDL and HDL cholesterol, triglycerides, vitamin B12, folate, TSH and prolactin. Further tests, while not completely interchangeable proved useful in longitudinal health monitoring. Conclusion: We have optimized testing capabilities within our laboratory by validating capillary blood for routine testing of commonly requested analytes. Microsamples obtained by capillary access provide a viable alternative to venous phlebotomy in patients with LD and needle phobia.
Plain language summary
This article is about testing to see if blood samples taken from a patient using an upper arm capillary sampling device, gives the same results as a blood sample taken from a traditional venepuncture. Once this was done, we also tested the end to end process of requesting tests, taking a blood sample and returning to the central hospital laboratory for measurement to ensuring accurate results were delivered back to the requesting clinician. We looked at the feasibility of the process in our patient group with learning disabilities and needle phobia, to see how they felt about the capillary blood sampling process and if it was acceptable for them.
We demonstrated that most biochemical tests investigated using capillary blood sampling, gave results that were comparable to those obtained by traditional venepuncture methods. Our learning disabilities patient group and their carers gave us positive feedback on their experience using the capillary sampling device. This means we can offer a basic blood testing alternative for patients who have not been able to access blood tests for routine health checks for years, and sometimes at all. This opens an important new development in breaking down health inequalities in this patient group.
For patients with learning disabilities (LD), the skills and patience the phlebotomist must have to build trust with their patient before being able to deliver a comfortable and reliable sample collection procedure are critical to enabling access to essential blood tests. Health inequalities and access to healthcare, in particular diagnostic testing has been addressed by Public Health England with a report entitled ‘Blood Tests for people with learning disabilities: making reasonable adjustments’ [1]. Under the Equalities Act 2010 public services should put in place ‘reasonable adjustments’ to help people with LD use phlebotomy services [2].
There are approximately 1.3 million people with a learning disability in England, including over 950,000 adults aged 18 or over [3]. It is clear from Learning Disability Mortality Review reports commissioned by NHS England since 2017 that there are premature avoidable deaths occurring at a rate greater in this vulnerable population. Delay in diagnosis was one of the reasons identified for some of the premature deaths. Specifically, diagnoses may be delayed where blood tests play a vital role, leading to a lack of timely diagnoses and treatment [4,5]. Providing reasonable adjustments for this patient group to access blood testing can potentially reduce lengthy and expensive de-sensitization programmes, which are often stressful for patient, carer and healthcare professional to deliver. Finding a painless method by which blood can be obtained in this population has the potential to reduce anxiety and facilitate continued engagement in healthcare.
Capillary blood sampling, usually involving finger prick sampling, is already part of routine care for many patient groups. Although there can be differences in results between venepuncture and capillary bloods, such as hematocrit, hemoglobin and platelet counts, the two are generally comparable in terms of the quality of sample if the capillary blood sample is collected correctly. Microsampling techniques (<100 μl) such as dried blood spot sampling and volumetric absorptive microsampling are attractive tools for use in therapeutic drug monitoring, remote sampling for patients in clinical trials and pediatric blood sampling. There are many studies published employing such techniques using specialized devices for postal delivery to the laboratory [6]. However, these applications rely on sample processing procedures often not established, fully automated or available to routine clinical laboratories. They have however, proved effective for specialist tests using techniques involving chromatography and mass spectrometry. Furthermore, many published, clinically applicable microsample measurements are focused on individual analytes or a small panel relevant to specific treatment [7,8]. Upper arm, transdermal capillary collection devices are a good option for patients who struggle with venepuncture, or who require remote access to blood tests because of difficulty attending phlebotomy clinics for whatever reason and who require routine chemistry measurements.
The Touch Activated Phlebotomy devices TAP® II or TAP Microselect from YourBio Health (Medford, MA, USA; recently acquired by Hims Inc., USA) have been shown to produce biochemical results comparable to venepuncture in different patient populations [9–13]. This is an upper arm, transdermal phlebotomy device, which provides a larger blood volume than a finger prick, with less pain. By using reduced total sample volume on our automated analyzers, we can maximize the number of tests available from one microsample. Tests most commonly requested by our local Learning Disability Health Team include: thyroid function tests, liver, renal and lipid profiles, prolactin, cortisol, HbA1c, ferritin, B12 and folate. To provide all these tests on one sample would be difficult and obtaining multiple microsamples on LD patients may be limited. Being able to offer some tests on such patients, who avoid phlebotomy, may make a big difference in their long term healthcare. We have demonstrated here what is realistically possible on a routine automated analyzer in a general hospital-based blood sciences laboratory.
We aimed to (a) establish the absolute minimum volume required to run routine biochemical tests and test profiles on the Beckman DXI800 and Beckman AU5800 (Beckman Coulter, Inc., UK) with <5% rejection rate due to inadequate sample volume, (b) compare analytical precision of microsamples with reduced total sample volume against standard volume blood collection and recommended total volumes on each analyzer for a variety of routine analytes, (c) run patient comparisons using TAP II devices against contemporary venous blood collection, to determine any analytical bias against samples collected for routine measurement, using existing sample delivery methods from a GP practice and (d) to run a pilot project in 20 patients with LD with supervised patient centered capillary sample collection to test feasibility and end to end connectivity of a testing pathway for this patient group.
Materials & methods
Reducing total test volume
Blood analysis was performed using the Beckman DXI800 and Beckman AU5800 (Beckman Coulter, Inc.) and the TOSOH G11 HLC-723 for HbA1c (EDTA samples) after ensuring routine, daily internal quality control (IQC) checks were acceptable for each individual analyte. All methods used are ISO15189 accredited for serum or whole blood in the case of HbA1c (from venepuncture). A selection of clinically relevant analytes was chosen by our local mental health service to support annual health checks in patients with LD (Table 1). Calculating the minimum acceptable volume for each test, as per the manufacturer Operator Guide includes sample assay volume + system dead volume + sample pipettor overdraw + sample container dead volume. To maximize use of very small serum samples obtained from capillary collections, the minimum achievable volume (going outside of the manufacturer’s guidelines) was established. This was done by titrating total serum volume down from the manufacturer stated minimum volume for individual tests (immunoassay methods; sample volume reduced in 5 μl steps) and test groups for routine biochemistry (sample volume reduced in 2 μl steps). IQC material in Monoject sample cups (13 mm × 1.0 ml; Covidien, dead volume of 50 μl) was used for this stage. Within batch imprecision (n = 20 replicates) was established for the reduced total volume where analyzer rejection rate of 5% was reached due to insufficient volume. The volume giving imprecision values comparable to the manufacturer claims stated in the instruction for use and a rejection rate of <5% was then used for further validation with pooled patient serum to account for any matrix effect (Figure 1). Table 1 shows the percent reduction in total sample volume achieving acceptable imprecision and for each analyte tested.
| Biochemistry test group | Analytes to be compared (units) | Method | Recommended sample volume (excl. container dead volume; μl) | Minimum volume (<5% rejection rate; μl) | Reduction in total volume for TAP® II samples (%) |
|---|---|---|---|---|---|
| Renal profile† | Sodium (mmol/l) | Ion selective electrode | 84 | 75 | 11 |
| Potassium (mmol/l) | Ion selective electrode | ||||
| Urea (mmol/l) | Enzymatic (urease + glutamate dehydrogenase) | ||||
| Creatinine (μmol/l) | Compensated Jaffe | ||||
| Liver function test† | Bilirubin (μmol/l) | Diazo (DPD) + caffeine | 69 | 69 | 0 |
| ALT (IU/l) | Enzymatic (IFCC recommended; contains pyridoxal phosphate) | ||||
| ALP (IU/l) | Enzymatic (IFCC recommended) | ||||
| Total protein (g/l) | Colorimetric (Biuret) | ||||
| Albumin (g/l) | Colorimetric (Bromocresol Green) | ||||
| Bone profile† | Calcium (mmol/l) | Colorimetric (Arenazo III) | 61 | 57 | 7 |
| Albumin (g/l) | As for liver profile albumin | ||||
| Phosphate (mmol/l) | Colorimetric molybdate (acid complex) | ||||
| Lipid profile† | Total cholesterol (mmol/l) | Enzymatic (cholesterol esterase and oxidase) | 56 | 35 | 37.5 |
| HDL cholesterol (mmol/l) | Enzymatic (with β lipoprotein complexing) | ||||
| Triglycerides (mmol/l) | Enzymatic (lipase, Glycerol kinase) | ||||
| LDL cholesterol (mmol/l) | Friedewald calculation | ||||
| HbA1c‡ | (mmol/mol) | Anion Exchange HPLC | No changes made as this test required a separate EDTA sample | ||
| Hematinics§ | Vitamin B12 (ng/l) | Competitive immunoenzymatic | 175 | 120 | 32 |
| Folate (μg/l) | Chemiluminescent immunoassay | 175 | 125 | 28.5 | |
| Ferritin (μg/l) | Turbidimetry (latex agglutination) | 190 | 120 | 37 | |
| Endocrine§ | TSH (mU/l) | Two-site immunoenzymatic (3rd gen) | 185 | 130 | 30 |
| FT4 (pmol/l) | Two-step enzyme immunoassay | 380 | 150 | 7 | |
| Cortisol (nmol/l) | Competitive immunoenzymatic | 155 | 105 | 32 | |
| Prolactin (mU/l) | Sandwich immunoenzymatic | 155 | 105 | 32 | |
†
Beckman Coulter AU5800.
‡
TOSOH G11.
§
Beckman Coulter DXI800.
The reduction in recommended sample volume was achieved when the sample volume demonstrated <5% rejection rate, flagged as insufficient by the analyzer. Test groups and analytes were selected for sample type comparison to support blood testing in patients with learning disabilities.
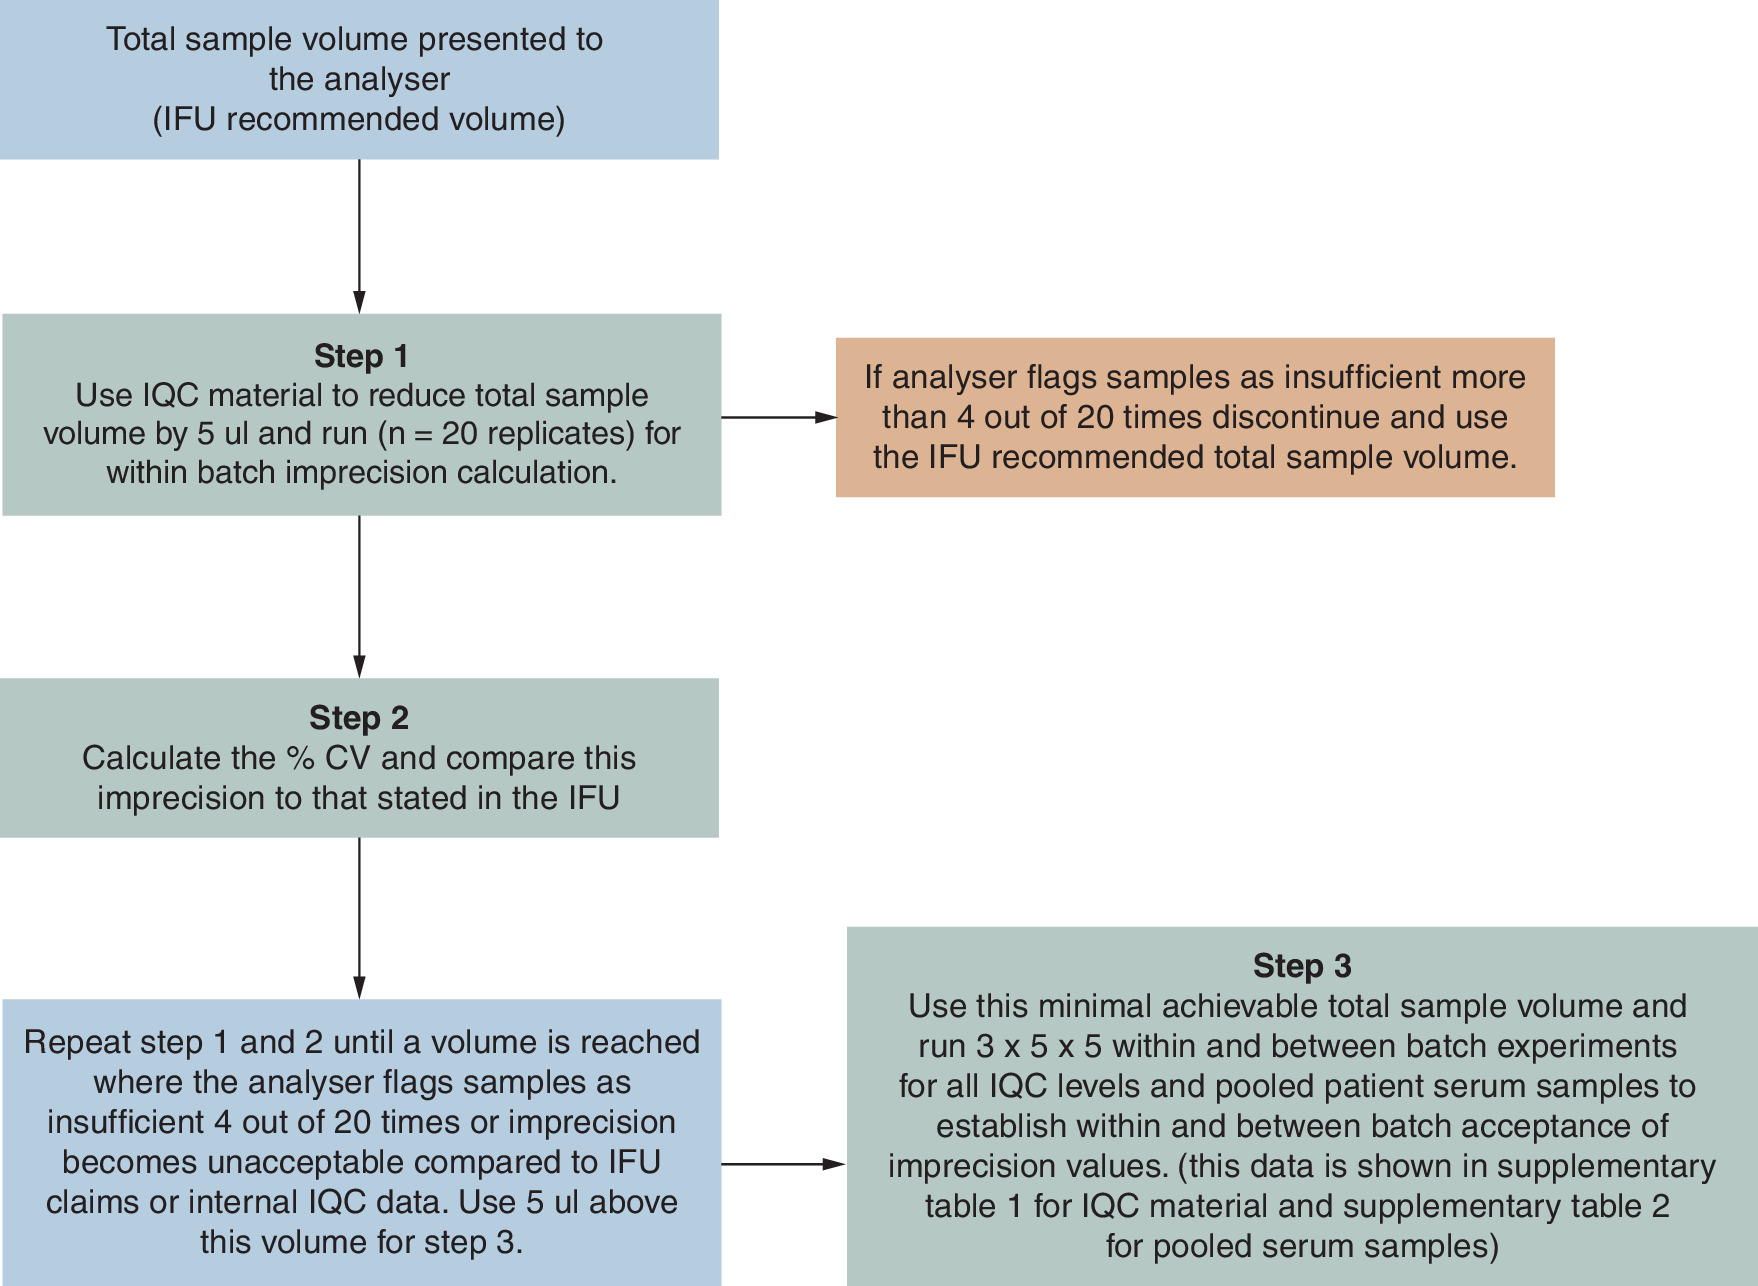
Figure 1. Flow diagram showing experiment designed for assessing minimum achievable total serum volume to maximize use of small capillary serum collections on the DXI800 immunoassay analyzer.
CV: Cumulative variance; IFU: Instructions for use; IQC: Internal quality control.
Between batch imprecision for each analyte using the minimum achievable volumes was determined using anonymized pooled patient serum from venepuncture at concentrations across the measuring range or around relevant clinical decision limits. A 3 × 5 × 5 design was used (3 different concentrations, 5 replicates of each test run on 5 separate days) as per CLSI guidelines, EP15-A3 [14]. The use of capillary serum for these steps was unfeasible due to the small sample size obtained from a capillary blood collection.
Validation study design
A flow diagram of the study design is shown in Figure 2. Participants were all registered patients at the Lunesdale GP Surgery, Kirkby Lonsdale, Cumbria, UK. Eighty-eight adult patients (>18 years old) who had pending appointments for health checks, were approached to see if they would like to participate. All participants were without impaired ability to consent and without needle phobia or difficulty providing venous access. Fourteen patients declined due to time pressures, care commitments or other reasons. Seventy-four patients (41 females and 33 males, aged 19 to 91 years old) participated by providing venous samples for their routine care (Vacutainer, Becton Dickinson, BD Diagnostics, Plymouth, UK) and contemporary samples acquired using TAP II devices (no more than 2 devices per patient, EDTA and serum separator devices) following informed consent. Due to ethical limitations we could only perform tests that formed part of routine healthcare for each individual (i.e., no patient had all the analytes in Table 1 tested, but only those which applied to their current healthcare plan). We aimed for n = 20 paired samples for each analyte, but had to work within ethical, realistic time and funding constraints. Therefore results presented in Table 2 show variable numbers of paired samples for each analyte listed (74 patients participated overall but each patient had variation in tests required for their routine clinical assessment).
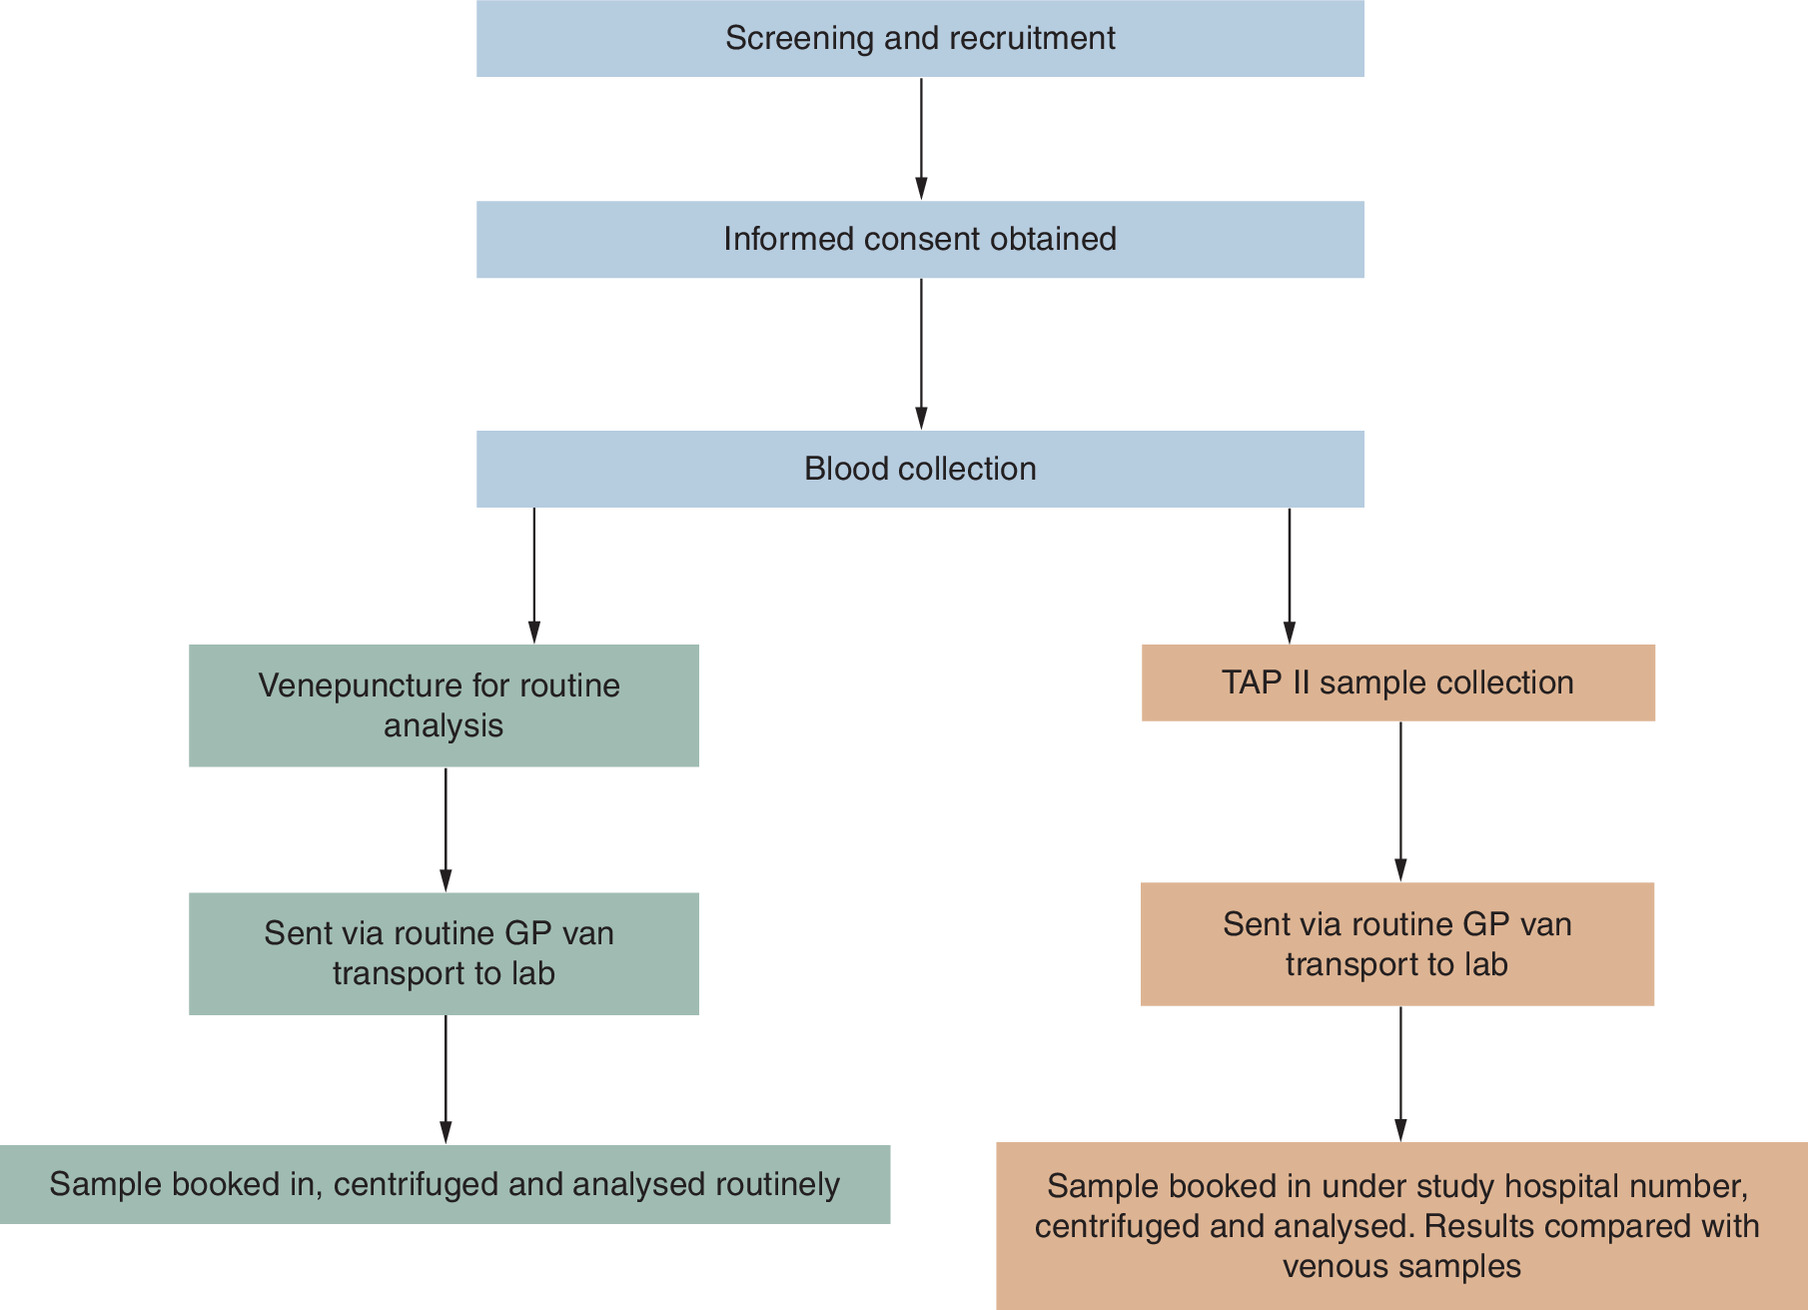
Figure 2. Validation study design.
GP: General practitioner.
This was not a power calculated study, therefore there may be limitations in the statistical validity of the data presented here.
The TAP II and TAP microselect devices are manufactured by YourBioHealth (Medford, MA, USA). Capillary blood is collected by first warming the upper arm with a heat pack provided with the device for about 5 mins. These transdermal capillary sampling devices utilize a ring of microfiber needles to pierce the skin and gentle vacuum pressure to collect capillary blood into pre-determined collection tube (TAP II) or BD microtainer of choice (TAP microselect). Once the device is stuck to the upper arm and activated by depressing the plunger, blood collection takes about 2 mins.
All blood samples were kept at ambient temperature at the GP surgery and were delivered along with all other routine samples from the surgery via daily scheduled van transport to the laboratory. Samples were delivered within 4–5 h of collection. Both venous and capillary collections (serum separator tubes) were centrifuged (5 min, 3000 g) upon receipt in the lab. Whole blood samples (EDTA collections) were used directly for HbA1c measurement. Serum volume from capillary collections were measured using single channel, microvolume pipettes (100 and 10 μl; Gilson PIPETMAN) and serum aliquoted into Monoject sample cups (13 mm × 1.0 ml; Covidien, dead volume of 50 μl) for measurement. All samples were assessed for quality using the hemolytic, icterus and lipemia (HIL) indices as reported by the analyzers, prior to analysis. The TOSOH G11 was run using the dilution protocol (Tosoh HLC-723 G11 user manual) whereby 10 μl whole blood is pre-diluted with 1.99 ml hemolysis and diluent buffer prior to analysis in a standard Hitachi 2.5 ml cup (serial number: ZM160600). Routine use of the dilution protocol for HbA1c was already established in our laboratory for pediatric postal HbA1c samples to enable remote monitoring of our pediatric diabetic population during the SARS-CoV pandemic, 2020.
All analytes were measured according to manufacturer’s recommendations with the exception of the reduced serum total sample volume applied to all capillary serum samples.
Statistical analysis
All data was anonymized once routine results had been validated and clinically authorized prior to statistical analysis. Analyze-IT statistical software (version 2.10 for Microsoft Excel; www.analyse-it.com) was used to compare measurements from venous and capillary samples. Tests for normality were applied to pairs of variables and nonparametric tests (Spearman’s Rank) were applied to non Gaussian distributed data. Results were analyzed with respect to Pearson/Spearman Correlation (r), slope from Passing Bablok regression analysis and mean bias from Bland–Altman plots (absolute and relative). Comparing paired results from both sample types gives statistical significance of any variation between results but does not give any indication of clinical acceptability of any differences. For this reason, we used the reference change value (RCV) as the maximum permitted difference for each analyte to compare against the 95% limit of agreement (mean ± 1.96 × the standard deviation of the difference). RCV was calculated using within subject biological coefficient of variation (CVb) data from the European Federation of Laboratory Medicine and analytical coefficient of variation (CVa) from our imprecision data using minimum achievable sample volume in this study (except for HbA1c which used the CVa from our contemporary IQC data from that month) [14,15].
If the 95% limits of agreement from Bland–Altman analysis was less than the maximum permitted difference (RCV), this demonstrated the capillary sample device to be reliable and clinically useful for the particular analyte in question. Total allowable error (TEa) was also established for comparison with the observed bias between venepuncture and capillary results. Desirable and minimum TEa was derived from the European Federation of Laboratory Medicine database [16].
Pilot study design
Twenty patients on the Milnthorpe and Carnforth Primary Care Network LD registers were offered phlebotomy using the TAP Microselect device (this device employs BD Microtainers which are standard within our laboratory for pediatric blood collection). These patients all had suboptimal phlebotomy history due to lack of understanding of the procedure and fear/anxiety possibly exacerbated by previous attempts.
Sample requesting was established electronically through the GP order comms system (tQuest and EMIS web). Special capillary testing codes were devised to distinguish these results from capillary samples against those done on previous routine venepuncture samples. Request forms were developed to enable the requesting clinician to prioritize the tests that were most needed in the event of a very small sample. This enables the laboratory to avoid automated assignment to analytical platforms and to manually prioritise testing according to the request and sample size. A qualitative and quantitative evaluation of the service user experience was collected using accessible questionnaires.
Results
Verification of reduced sample volume
All analytes listed in Table 1 were assessed for imprecision using the reduced total sample volume. The percentage cumulative variance (%CV) for each analyte was calculated and compared against the IQC monthly target mean for routine sample volumes or in the case of patient pooled serum samples, the manufacturer's claimed between and within batch %CV. Two to three patient serum pools were used for each analyte at concentrations that covered the measuring range or relevant clinical decision limits. All imprecision assessments met targets used within our routine clinical laboratory for standard volume, venepuncture samples (Supplementary Tables 1 & 2).
Patient sample volumes & quality
Seventy-four patients were recruited for the study. Four out of the 74 TAP II samples were insufficient for any analysis (5% of total). Six samples had no sample volume recorded due to a temporary change in the lab staff processing the microsamples. All samples were checked for quality according to indices measurement (HIL) on the AU5800 prior to analysis. One capillary sample produced a hemolysis index outside acceptable limits for phosphate and potassium. The corresponding paired venous sample did not breach the indices assessment limits. No other indices assessments were significant on any samples. The range of sample serum volumes obtained from the TAP II devices is shown in Figure 3.
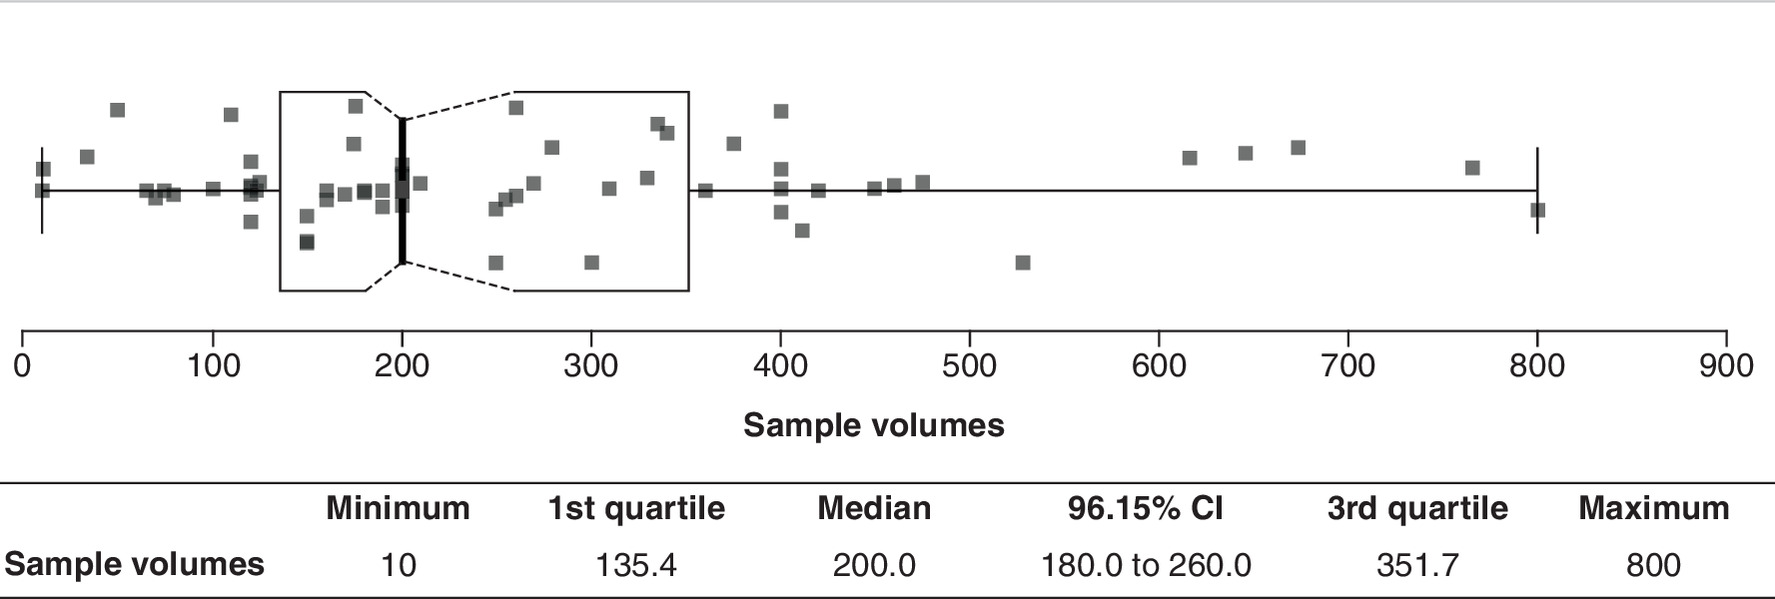
Figure 3. Range of serum sample volumes (μl) obtained from the TAP II capillary collections (N = 68).
CI: Confidence interval.
Agreement of capillary versus venous blood results
Table 2 shows the number of paired samples used for comparison of individual analytes, which were run as test groups as listed in Table 1. Manual judgement was used to prioritize analysis of capillary samples, depending on serum volume obtained to maximize the number of requested tests completed.
| Biochemistry test | Paired samples, n | Correlation Pearson’s r/Spearman’s rs [95% CI] | Mean difference, % [95% CI] | Reference change value (RCV; %)† | Desirable TEa, % | Within TEa/within RCV? |
|---|---|---|---|---|---|---|
| Sodium | 32 | 0.886 [0.778 to 0.943] | -0.47 [-2.81 to 1.87] | 2.86 | 0.7 | No, but within RCV limits |
| Potassium | 31 | 0.575 [0.277 to 0.772] | 13.28 [-0.87 to 27.42] | 12.16 | 4.9 | No |
| Urea | 32 | 0.993 [0.986 to 0.997] | 1.91 [-5.3 to 9.12] | 39.91 | 16.8 | Yes |
| Creatinine | 32 | 0.989 [0.978 to 0.995] | -2.42 [-13.9 to 9.06] | 15.32 | 7.7 (minimum = 11.6) | No, but within RCV limits |
| Bilirubin | 24 | 1.000 [0.999 to 1.000] | -2.18 [-12.76 to 8.41] | 16.16 | 24.7 | Yes |
| ALT | 24 | 1.000 [0.999 to 1.000] | 0.18 [-14.69 to 15.05] | 15.41 | 18.5 | Yes |
| ALP | 26 | 0.998 [0.996 to 0.999] | -2.15 [-8.39 to 4.10] | 9.62 | 10.4 | yes |
| Total Protein | 26 | 0.907 [0.802 to 0.958] | -2.13 [-8.21 to 3.95] | 8.06 | 9.3 | Yes |
| Albumin | 25 | 0.723 [0.459 to 0.870] | -2.52 [-10.86 to 5.82] | 8.16 | 3.3 | No |
| Calcium (adjusted) | 20 | 0.873 [0.700 to 0.949] | -1.43 [-4.78 to 1.92] | 6.04 | 2.2 (minimum = 3.3) | No, but within RCV limits |
| Phosphate | 19 | 0.972 [0.927 to 0.989] | 1.26 [-6.31 to 8.82] | 23.12 | 9.6 | Yes |
| Total cholesterol | 21 | 0.992 [0.981 to 0.997] | -1.91 [-6.44 to 2.62] | 15.70 | 8.5 | Yes |
| HDL cholesterol | 21 | 0.992 [0.980 to 0.997] | -1.55 [-6.24 to 3.14] | 17.34 | 10.2 | Yes |
| Triglycerides | 20 | 0.990 [0.976 to 0.996] | -1.22 [-10.63 to 8.19] | 56.47 | 26.2 | Yes |
| LDL cholesterol | 20 | 0.989 [0.971 to 0.996] | -1.65 [-11.2 to 7.92] | 22.30‡ | 12.0 | Yes |
| HbA1c | 20 | 0.962 [0.904 to 0.985] | 0.24 [- 5.75 to 6.24] | 6.11 | 3.3 (minimum = 4.9) | No, but within RCV limits |
| Vitamin B12 | 17 | 0.981 [0.945 to 0.993] | -0.15 [-12.61 to 12.32] | 26.09 | 15.4 | Yes |
| Folate | 18 | 0.971 [0.922 to 0.989] | 5.08 [-19.26 to 29.43] | 38.68 | 16.4 | Yes |
| Ferritin | 15 | 0.998 [0.995 to 1.000] | 2.90 [- 13.57 to 19.38] | 37.71 | 13.9 (minimum = 20.8) | No, but within RCV limits |
| TSH | 22 | 0.996 [0.989 to 0.998] | -4.20 [-10.30 to 1.91] | 15.24 | 24.7 | Yes |
| FT4 | 21 | 0.928 [0.828 to 0.971] | 1.9 [-13.56 to 17.35] | 20.43 | 6.3 (minimum = 9.4) | No, but within RCV limits |
| Cortisol | 19 | 0.871 [0.690 to 0.950] | -3.88 [-34.32 to 26.56] | 50.61 | 21.8 (minimum = 32.7) | No, but within RCV limits |
| Prolactin | 19 | 0.954 [0.883 to 0.983] | 2.20 [-19.15 to 23.55] | 83.99 | 56.7 | Yes |
TEa = 0.25×(CVi2+ CVg2 )0.5 + 1.65 × 0.5×Cvi.
†
RCV calculated as .
‡
RCV for LDL calculated using combined CVa for HDL, total cholesterol and triglycerides and the EFLM Biological variation website RCV calculator.
CI: Confidence interval; TEa: Total allowable error.
Clinical acceptability
Statistical analysis showed that 14 out of 23 analytes assessed, met all the criteria to determine acceptable interchangeability with venous blood (Table 2). All analytes had correlation ratios greater than 0.8, except for potassium (r = 0.575) and albumin (r = 0.723). Corresponding Passing Bablok charts for all analytes investigated can be found in Supplementary Figures 1–7. Analysis of bias showed small relative mean bias for all analytes except potassium (Figure 4).
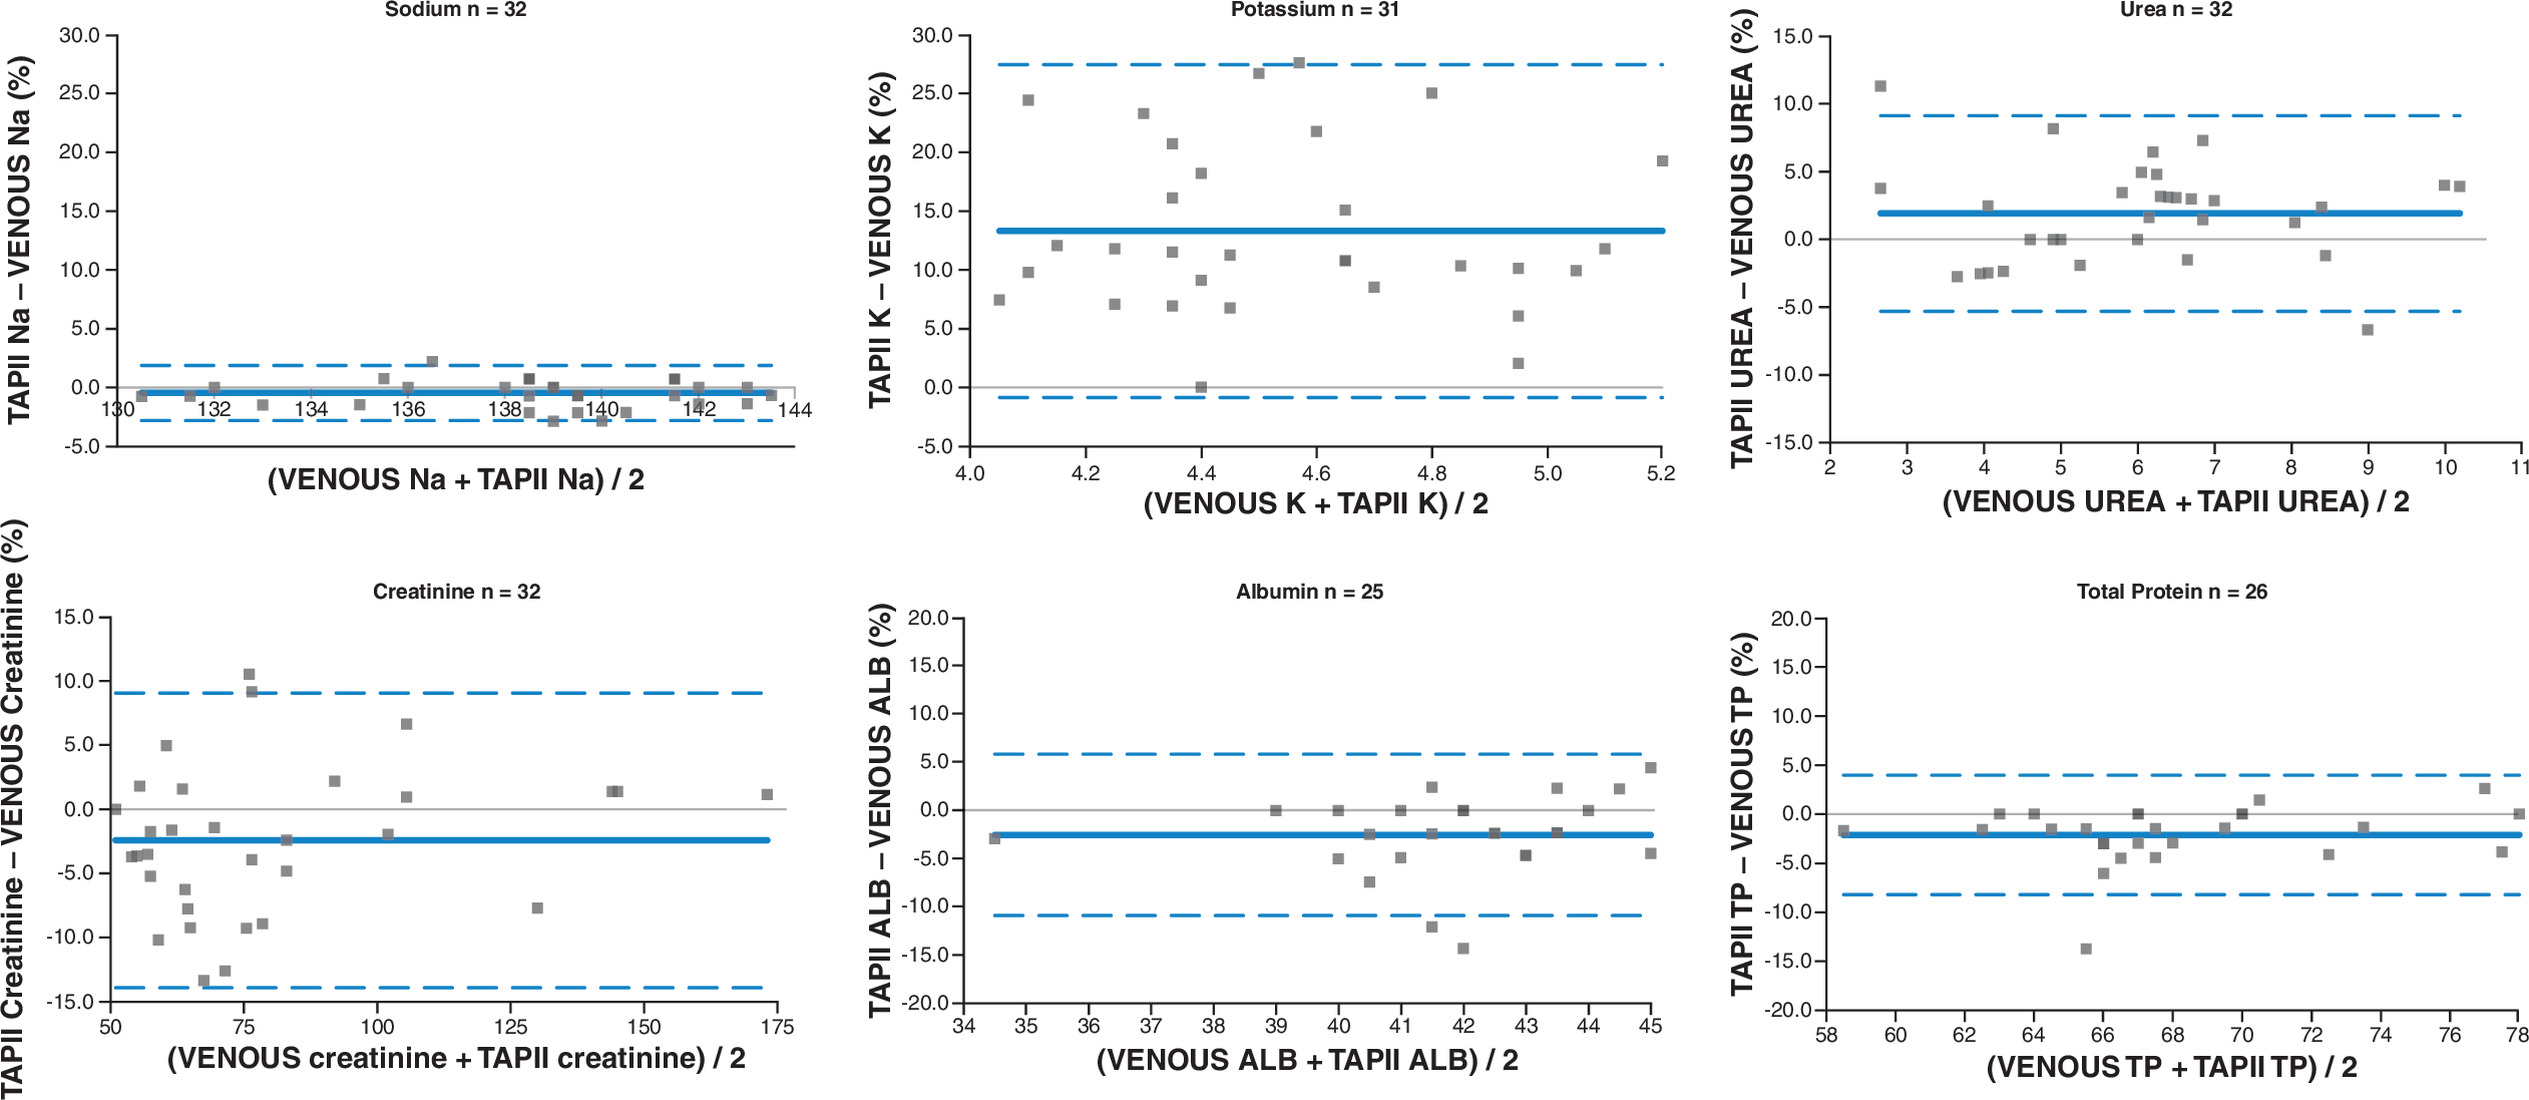
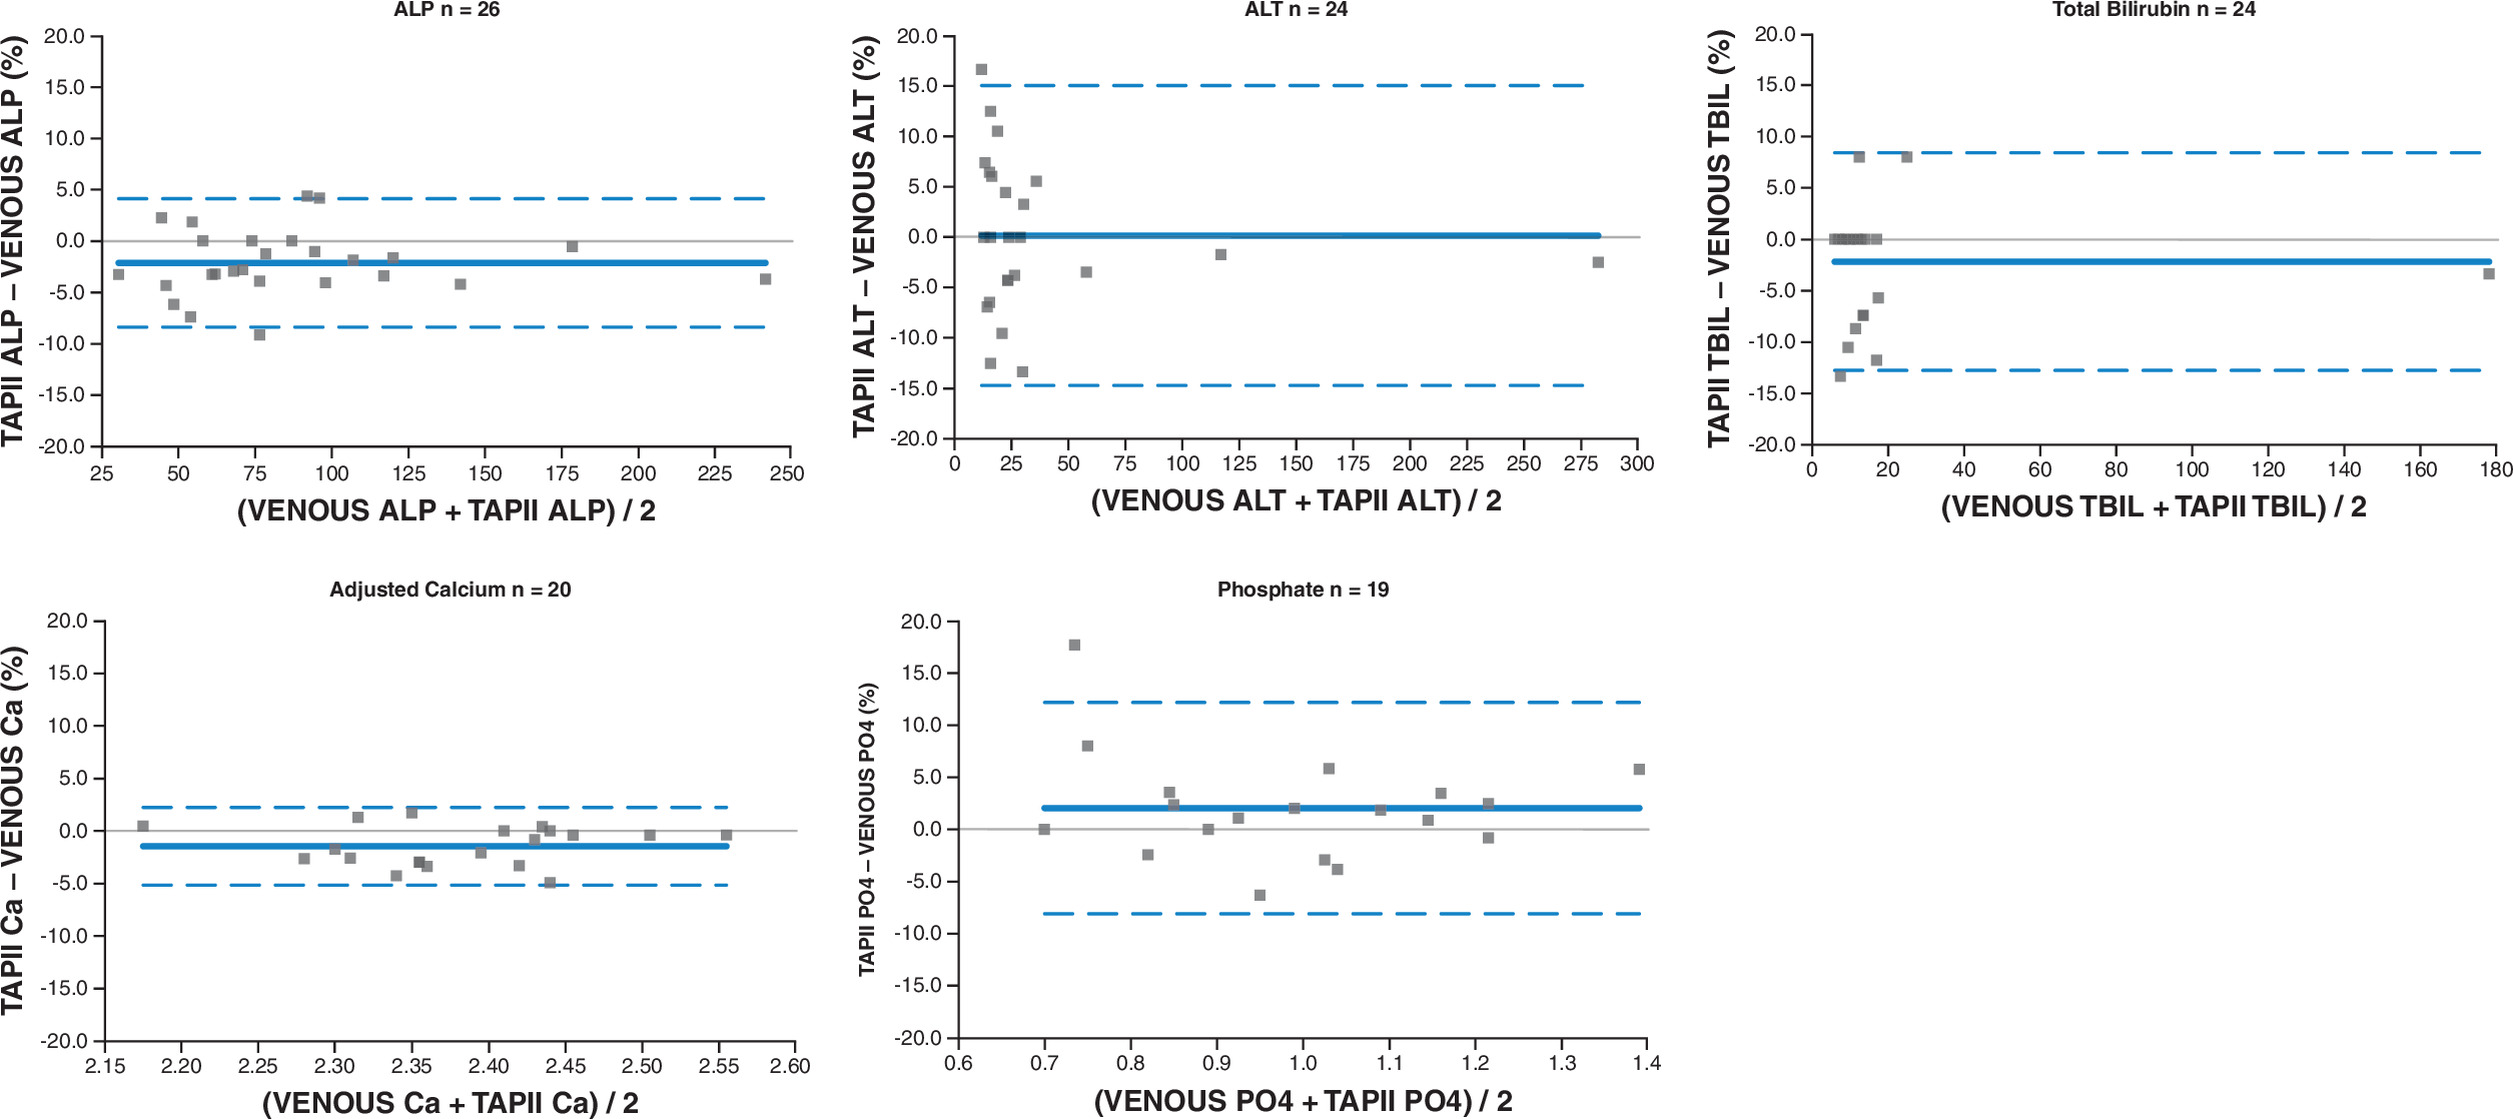
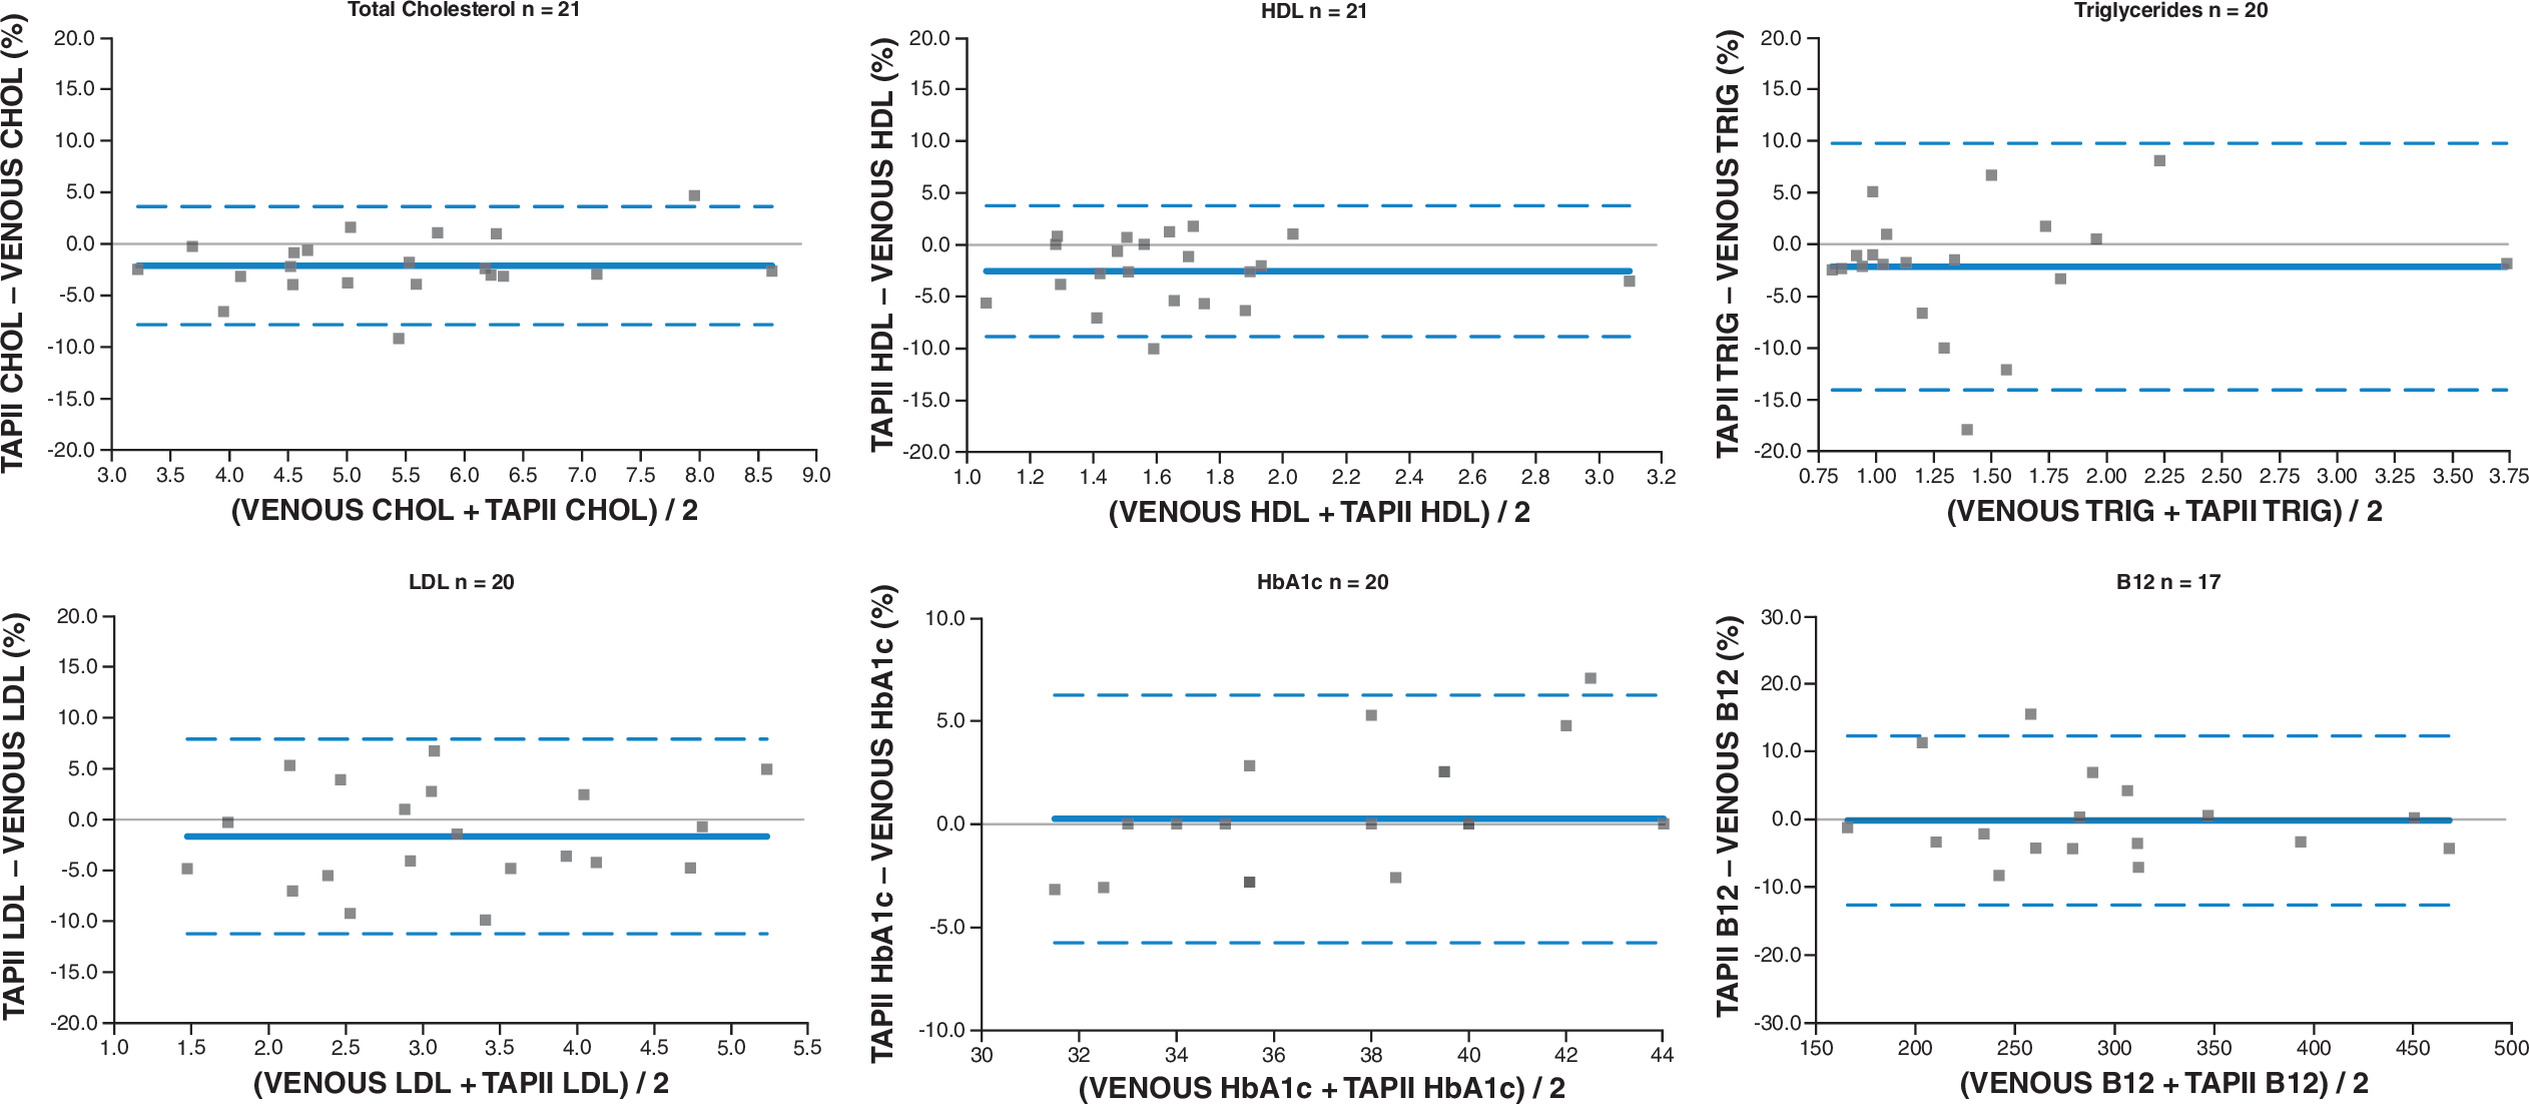
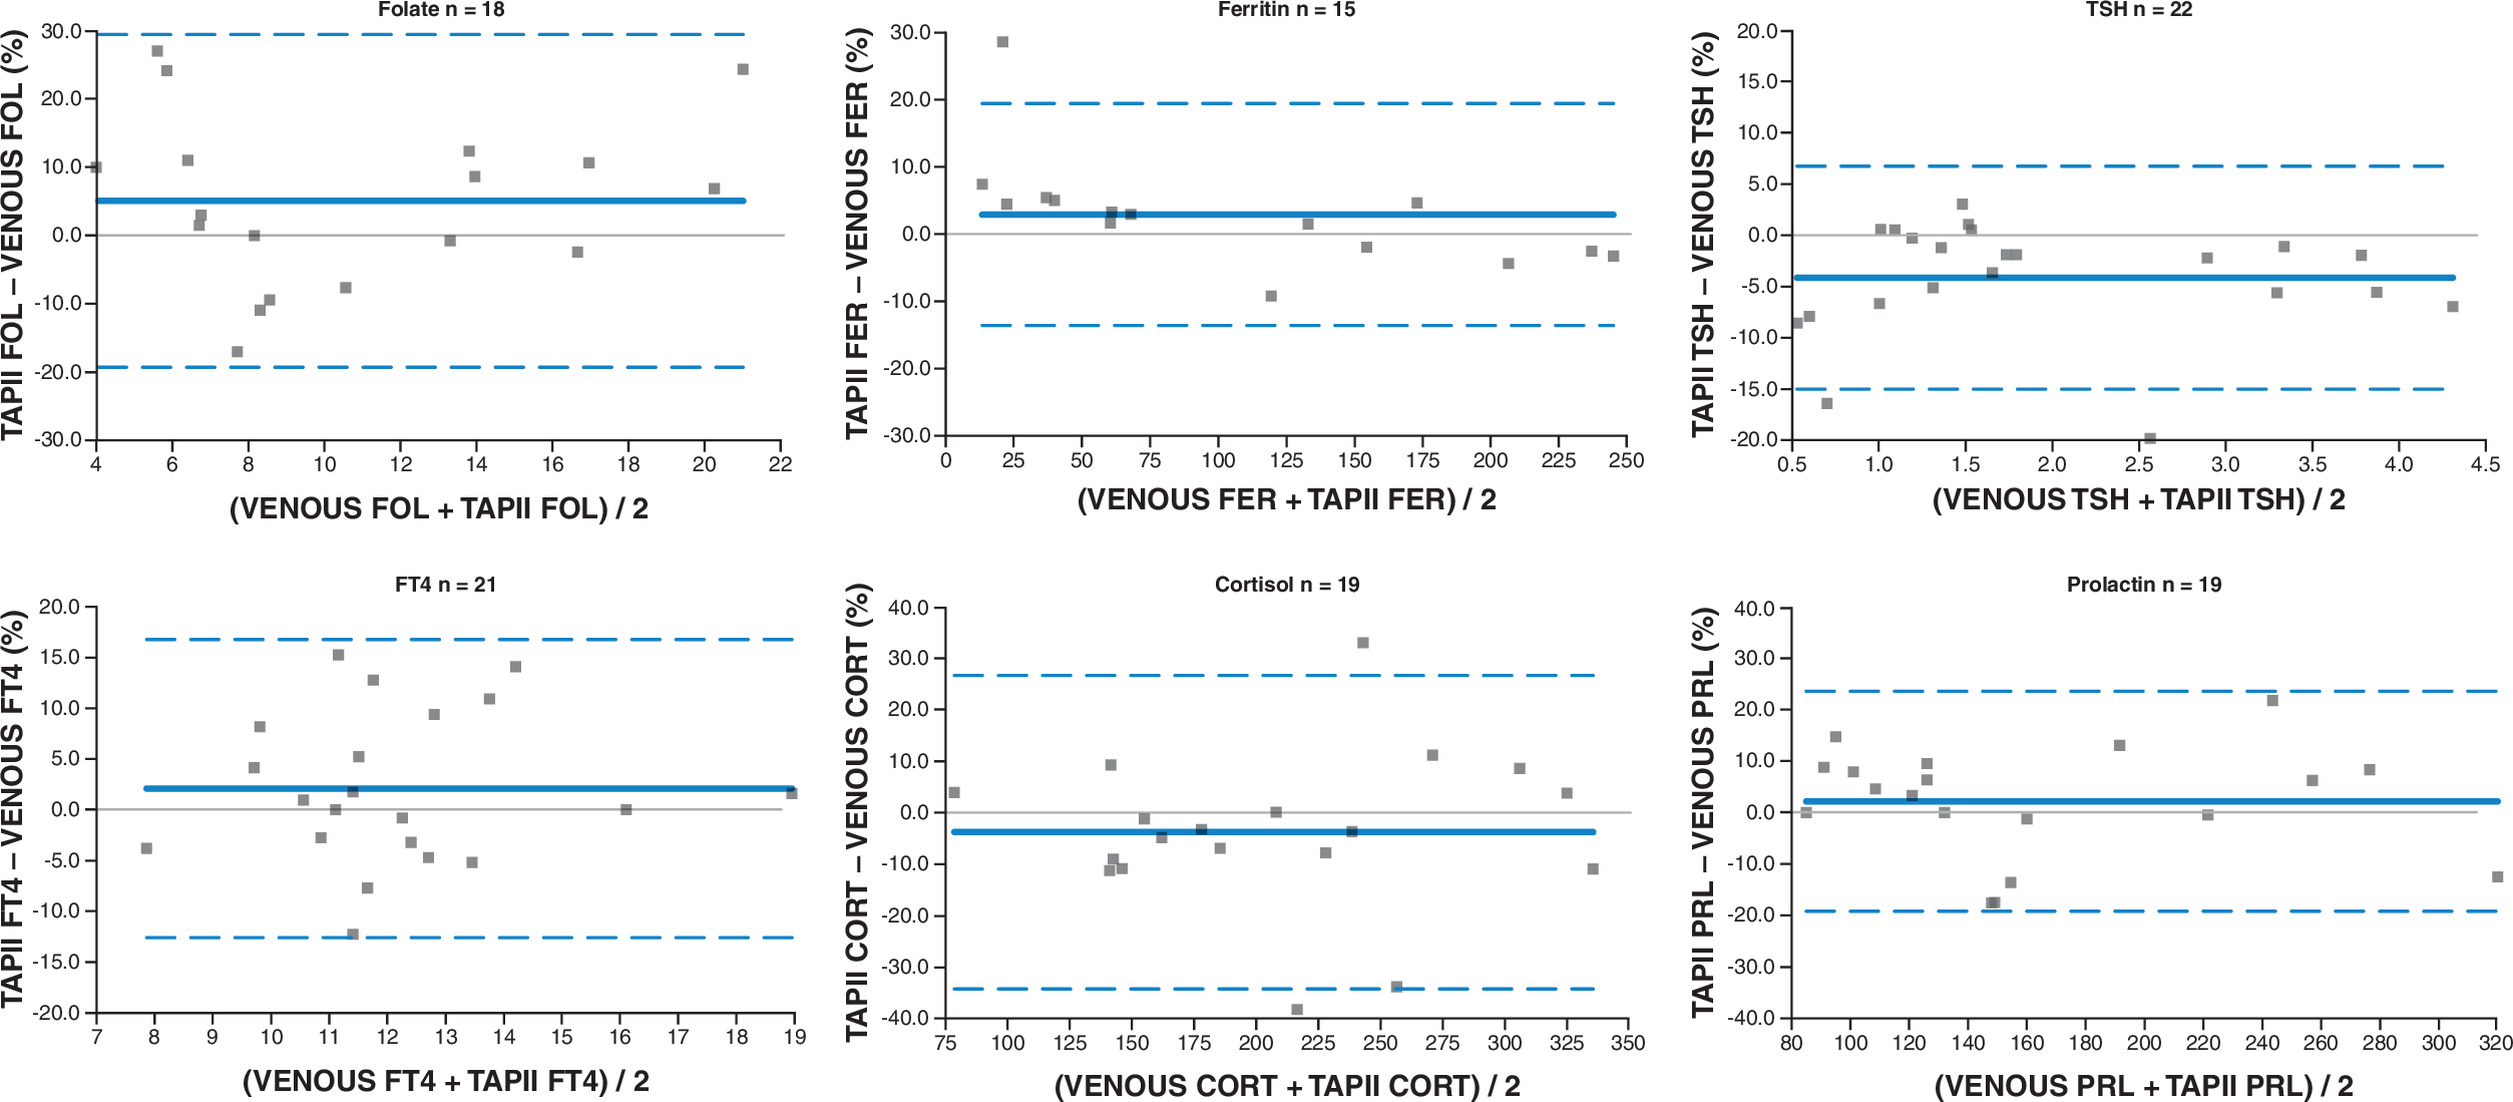
Figure 4. Bland–Altman plots for individual analytes shown as % differences between capillary and venous derived serum samples (units of measurement and number of pairs of samples compared).
Solid blue line shows the mean difference between capillary and venous results. Dashed lines show 95% confidence intervals.
The mean percent bias (±95% CI) for all analytes fell within the calculated RCV, except for potassium and albumin. Potassium was the only analyte out of all those tested to completely fail any of the comparability criteria and is unreliable compared with venous blood. Sodium had an acceptable correlation coefficient (r = 0.886) and % bias was within the RCV limit; however, desirable and minimal TEa were exceeded.
Albumin showed poor correlation with venous samples and had wide limits of agreement using Bland–Altman analysis, but is close to RCV limits. The Bland–Altman plot (in Figure 4) shows data points clustered around the mean % bias. There are 2 out of 25 data points outside the 95% CI lines and there is little date for Albumin concentrations below 40 g/l, as the volunteers were all reasonably healthy GP patients. Interestingly, data for adjusted calcium has acceptable correlation coefficient and falls within RCV limits. The mean % bias (±95% CI) falls just short of being within desirable TEa limits, but does fall mostly within minimum TEa limits and strong correlation with venepuncture results and so could be useful for monitoring disease, but should be used with caution for diagnostic purposes. Increased data points across the measuring range for both albumin and adjusted calcium would be beneficial for better determining reliability and concordance with venepuncture samples.
Creatinine measured in capillary samples showed good correlation with that from venepuncture (r = 0.989) and the mean % bias spread was within RCV. Like sodium, the desirable TEa limit was not achieved. However, the data presented here indicates suitable use for monitoring renal function, but not for diagnosis of renal impairment, especially in a population who struggle to access any kind of blood testing, without considerable resource and assistance.
Ferritin (r = 0.998), Free T4 (r = 0.928) and cortisol (r = 0.871) displayed good correlation with venepuncture results. While results fell within RCV limits, the desirable TEa limits were not achieved. However, like creatinine, sodium and adjusted calcium the spread of the % bias data was close to the minimal TEa leaving these analytes potentially suitable for monitoring but not diagnostic purposes.
Diluted whole blood was used for measurement of HbA1c. Bias seen between capillary collection and venepuncture collection fell within minimum TEa and RCV limits, but the bias plot indicates possible proportional bias, with higher HbA1c concentration in capillary samples being slightly positively biased against venepuncture collection.
Although the present investigation was not a stability study, we incorporated transport time from a GP practice that is approximately 21 miles (34 km); a 35–45 min drive from the laboratory and samples were transported together with contemporary venepuncture samples via routine scheduled transport twice a day (as per usual service provision within our NHS Trust). Samples were received at the laboratory within 4–5 h of collection.
Patient feasibility study (Pilot study)
The feasibility of the capillary sampling service was centered at one GP practice, with some outreach to locations that were comfortable depending on the patient needs. Twenty patients were identified on the Practice LD register and were selected due to their difficulties providing recent blood samples for routine health monitoring. The age range was 18–53 years old and there was 8:12 male to female ratio. Thirteen patients were able to provide consent and seven patients had ‘best interest decision’ to proceed. Three patients had never given a blood sample before (except under general anesthetic) and six patients had not given a blood sample for over 5 years, as shown in Figure 5.
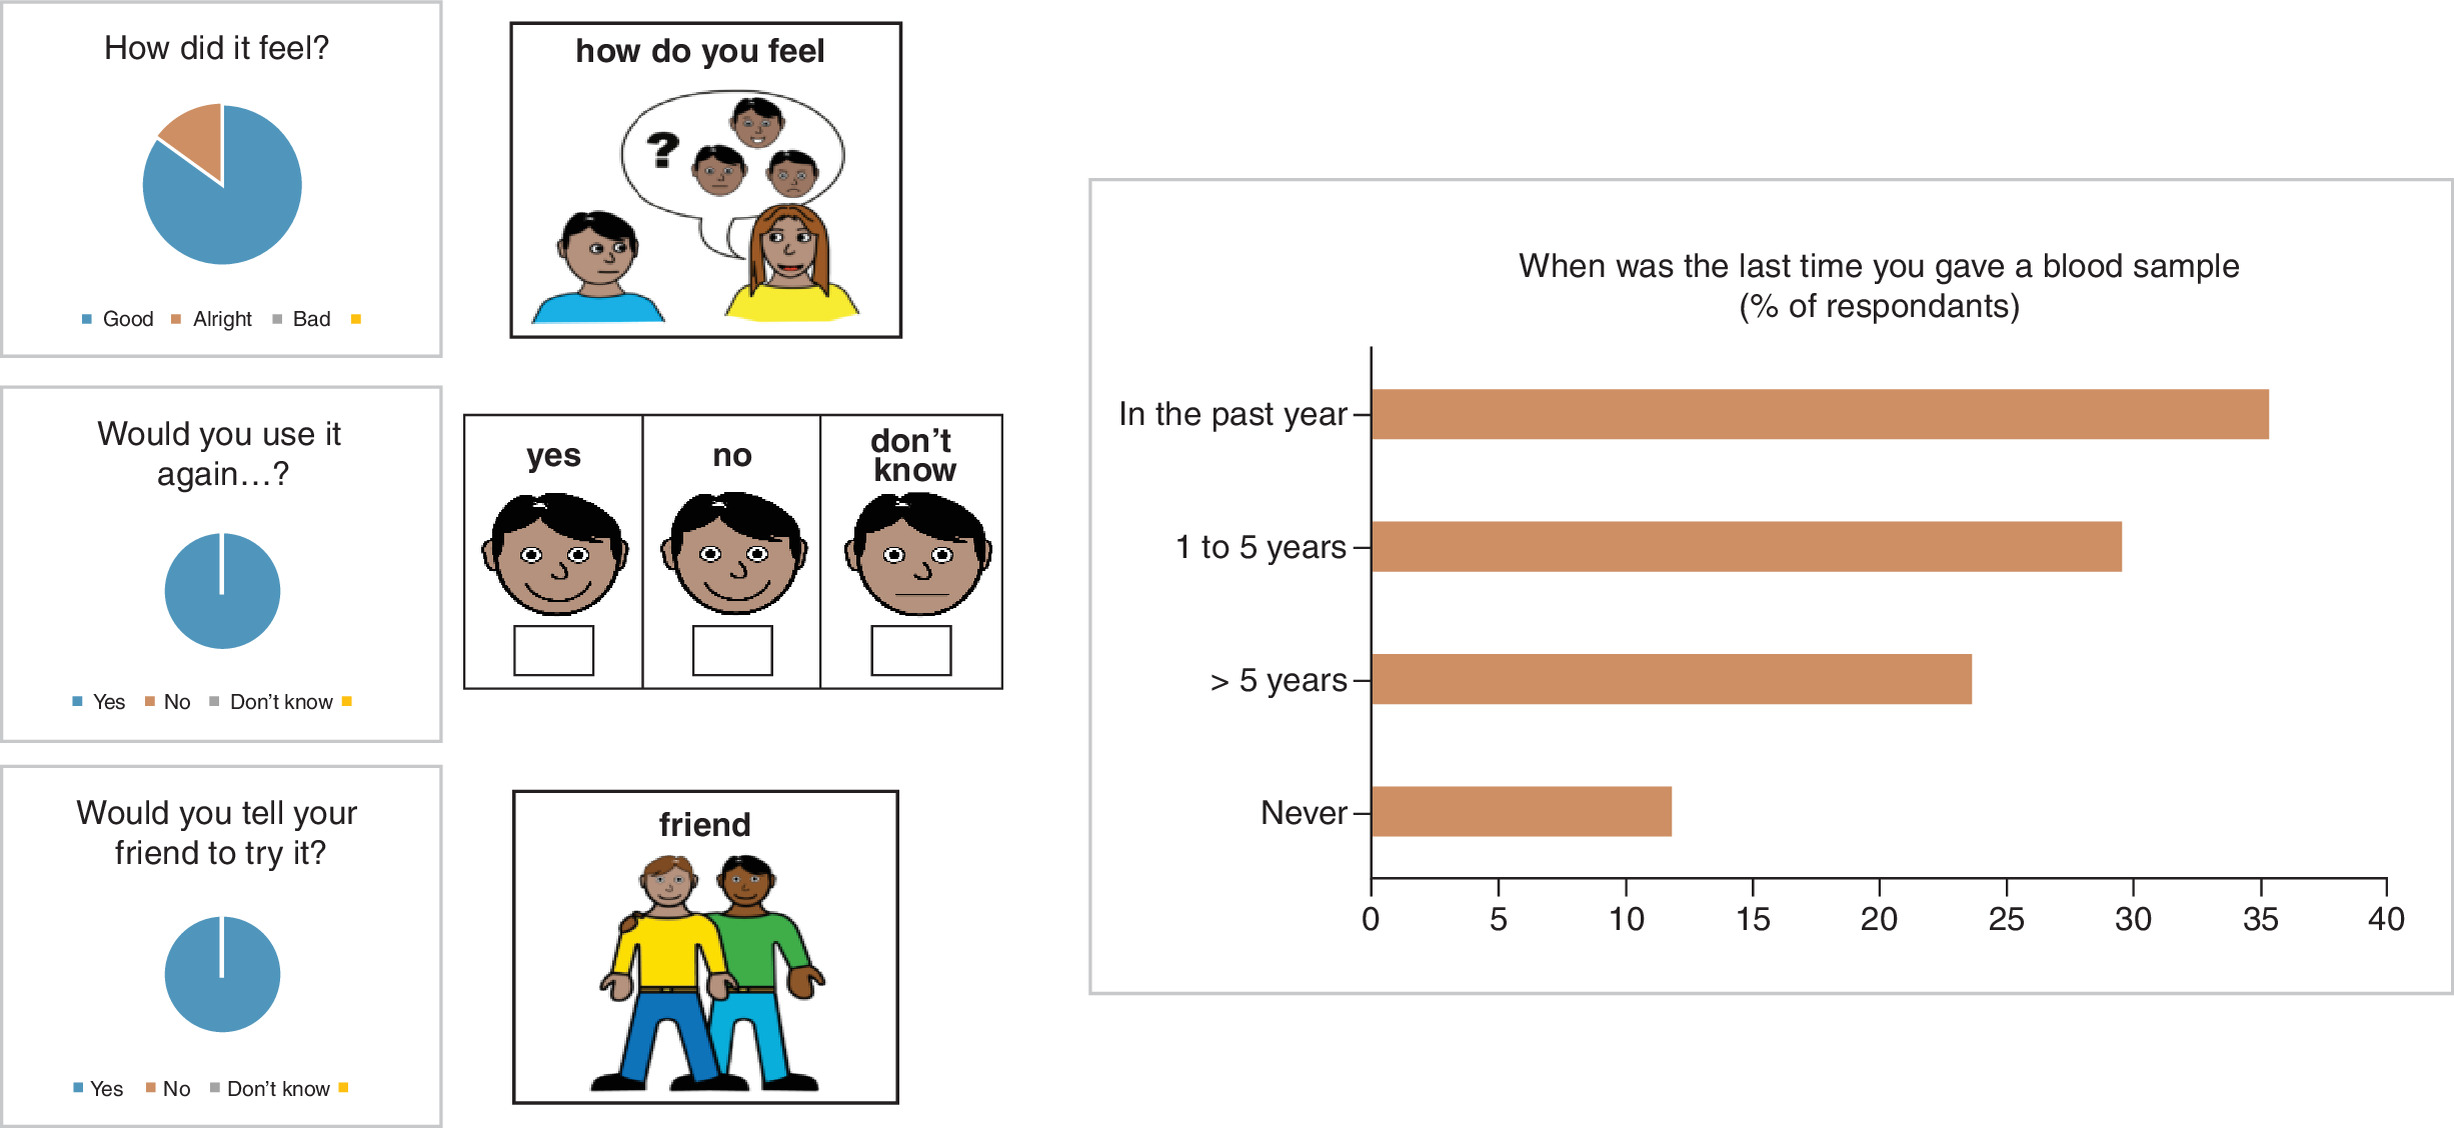
Figure 5. An accessible ‘Easy Read’ questionnaire was given to participants and their carers.
17/20 participants replied.
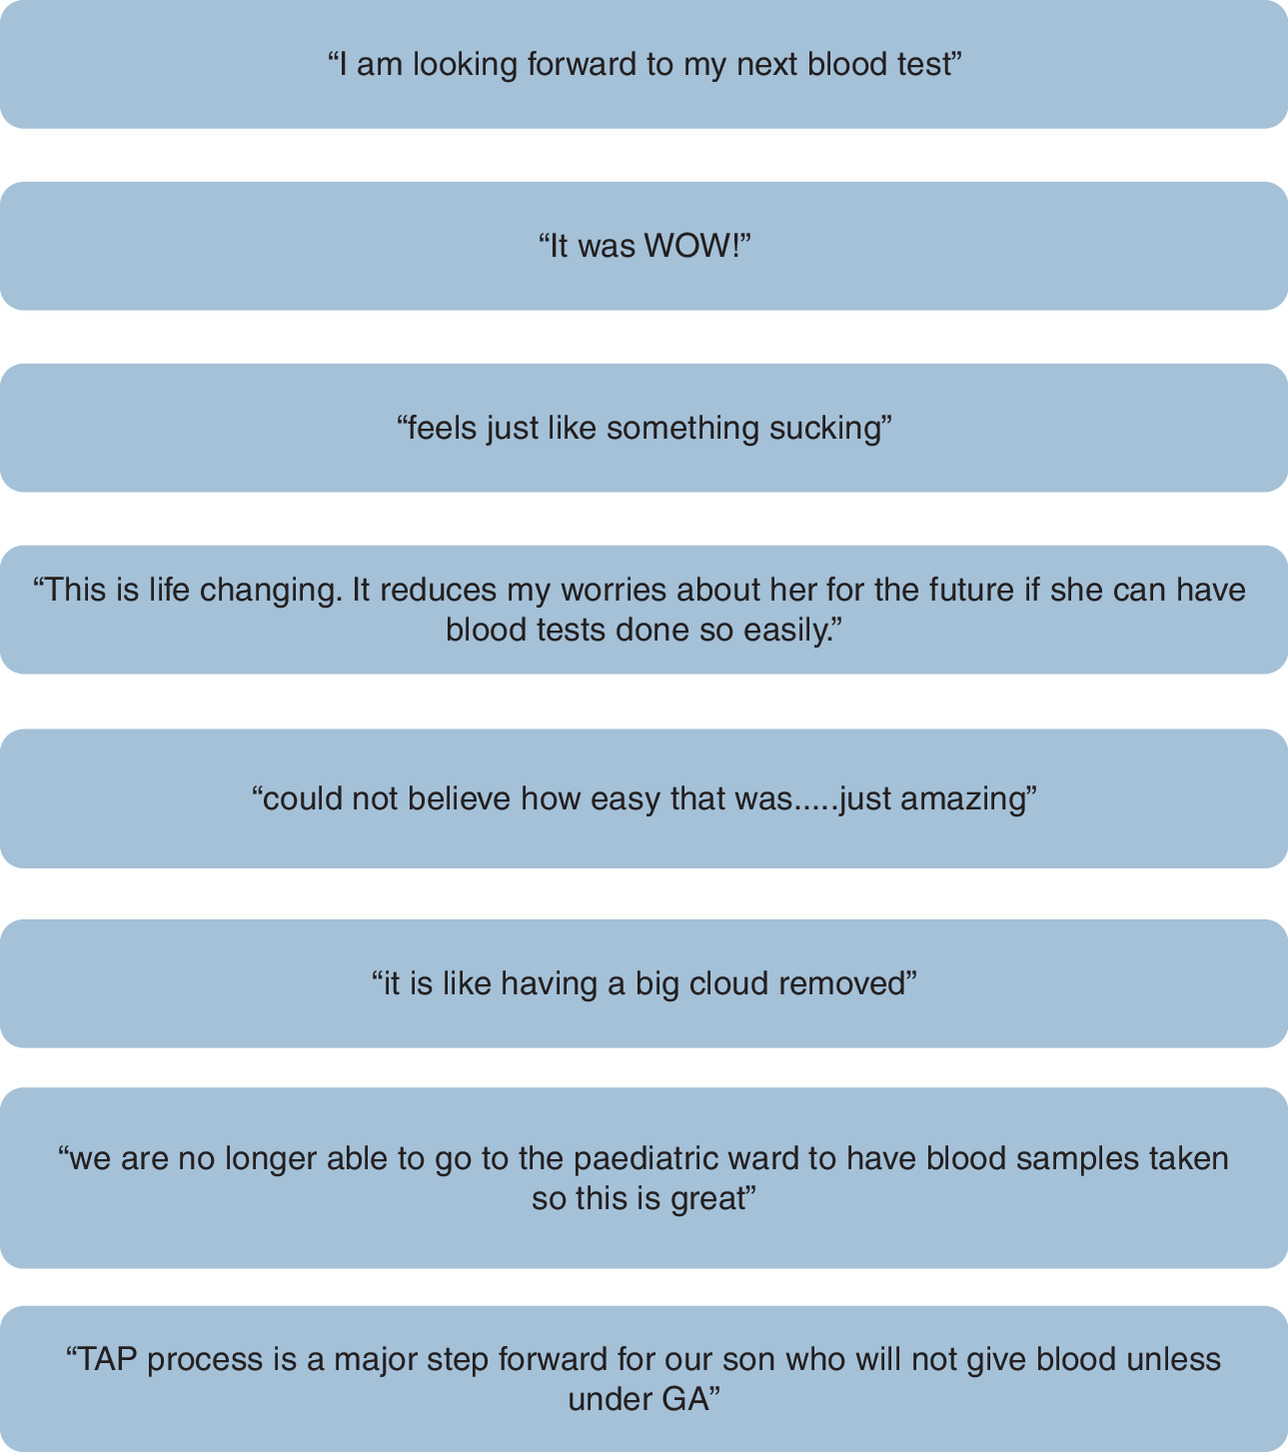
All patients were able to successfully provide capillary blood samples using the TAP II device and 17 patients were able to give more than one sample using more than one device (for extra EDTA sample to analyse HbA1c or repeat thyroid monitoring). Figure 5 shows ratings of subjective experience and Figure 6 gives some testimonials from patients and carers from their experience with TAP II capillary sampling.
Discussion
This study describes the development of a reasonable adjustment for routine phlebotomy in patients with LD and needle phobia. We have described the validation of 23 routine biochemistry tests within a clinical laboratory setting, using capillary blood obtained at a remote site with the TAP micro-sampling device. Pre-analytical factors such as transport from a GP practice, centrifugation and sample quality assessment of hemolysis, icterus and lipemia were all incorporated as part of the study protocol to enable true comparison of a blood collection from patients seen in a GP clinic using standard venous blood collections compared with transdermal capillary collections. This study did not address self-collection as described in other recent studies using similar collection methods [11,17,18] but was run with the intention that the device could be piloted as a reasonable adjustment made for patients with LD in a clinic setting, who require blood testing for routine healthcare.
Clinical acceptability was assessed through sample quality, bias limits set to be within RCVs, acceptable correlation and the absolute clinical need to be able to access blood test results for medication monitoring or long term disease monitoring in a patient population who present with serious difficulties providing a blood sample [19].
Sample quality from capillary collection was no different to venous collections in the initial validation project using routine health check patients at our local GP practice. We saw this as a success due to the pre-analytical process involving some samples being collected around 9 to 10 am and not arriving in the laboratory for centrifugation about 4 h later. This reflected our routine transport collections from the practice participating in this study and shows a clinic using transdermal capillary collections here could be logistically and analytically possible.
One aim of this study was to reduce the total sample volume required for analysis. This reflects the need to be able to optimize information gained from a sample collection that is difficult to repeat. The Beckman Coulter DXI800 requires relatively large total sample volumes for immunoassay tests (200–300 μl) whereas automated analyzers from other manufacturers such as Roche Cobas and Siemens Atellica stipulate smaller total sample volumes (<200 μl). We used this approach to maximize the number of tests obtainable from a very small sample collection specifically for the DXI800 analyzer. Imprecision was investigated using pooled patient serum which demonstrated clinically acceptable within and between batch imprecision, giving us confidence that while using sample volumes below those recommended by the manufacturer, we can provide accurate results for all analytes tested in this way.
Assay sensitivity/limit of detection (LOD) was not assessed here using specifically capillary-derived serum. Obtaining enough capillary serum or whole blood to pool for LOD experiments is extremely difficult. LOD experiments can be run as described in CLSI EP17 [20]. This has been described by other authors who have validated automated capillary blood assays [21]. Furthermore the detection capabilities of the assay equipment, calibrators or reagents remain unchanged, implicating no differences in detection limits to those seen with routine laboratory use with serum from venepuncture samples.
Our study presented here covers a broad menu of general chemistry analytes with 14 of the 23 analytes investigated demonstrating full clinical interchangeability and seven proving suitable for long term monitoring. We found two serum analytes showed high levels of variation and did not meet the interchangeability criteria. Potassium failed all interchangeability criteria making it clinically unreliable in capillary blood. This has also been shown by other investigators using similar capillary collections. Collier et al. showed similar findings with regards to lack of agreement between TAP II capillary venous collections for potassium, calcium and total protein [11] but they used samples separated within 1 h at the site of collection. Our study adds to these observations by extending the preanalytical phase to include ambient transport and significant increased time delay between TAP II collection and sample separation. Ansari et al. also demonstrated good sample integrity over extended periods of time [18]. Investigations using the TASSO device (a similar upper arm capillary collection method) also found potassium to have poor concordance with venous sample collection [9]. Nwankwo et al. demonstrated that potassium obtained from finger prick samples failed all three of their assessment criteria and a significant positive bias was seen, similar to observations in our study [17]. This may be attributable to the vacuum pressure applied through these types of devices or finger squeezing, in order to draw blood from the skin puncture into the collection tube, causing red cell membrane fragility or incorporation of increased amounts of interstitial fluid into the sample. This theory was also described by Hosseini et al. to explain clinical differences between calcium and phosphorus seen in their comparison using the TASSO device [22].
Albumin also fell outside acceptable clinical limits. However, this difference was not entirely reflected in the adjusted calcium measurements which showed correlation and bias were acceptable. With 20 data pairs for comparison of adjusted calcium, further data collection across a wider concentration range for this parameter may further clarify any significant differences between collection methods. We should interpret adjusted calcium with some caution in a clinical setting using capillary collections at this stage.
A number of tests showed strong correlation with venous samples and bias within the limits of the RCVs. This demonstrates good usability of these analytes in clinical situations for long term monitoring, but caution should always be applied in a diagnostic situation. Further work is needed, using a broader range of concentrations for all analytes tested. Collections were made from relatively healthy GP patients attending clinic for routine healthcare monitoring of long term, well managed conditions. TSH results ranged from 0.5 to 3.7 IU/l (laboratory reference interval: 0.57 to 3.6 IU/l). Assessment of TSH outside this range would be advantageous to a population with higher prevalence of poor thyroid function. Similarly, HbA1c testing range in this study was limited to well-controlled nondiabetic patients. Our dataset is small with whole blood samples only obtained from well controlled diabetics with HbA1c within a small part of the measuring range. Our laboratory has previously demonstrated good concordance with fingerprick HbA1c collection and using the dilution protocol for the TOSOH G11 provides a good indication of raised HbA1c for monitoring. There are clear limitations based on this small dataset for diagnostic use of capillary blood collection of HbA1c, but could benefit needle phobic patients when used for monitoring treatment or indication for further assessment for possible diabetes.
A variety of capillary collection device applications have been documented in different patient populations, many of which focus on a small number of analytes, specific for particular clinical assessments or therapeutic drug monitoring. For example, COVID-19 serology, fertility clinics, renal patients, hepatic monitoring and in a paediatric setting [9,12,22–24]. We have covered a broad range of biochemical blood tests, useful for monitoring long term disease or relevant medication reviews. Venepuncture remains the gold standard for collecting a high quality blood sample, but there is definitely a place for capillary blood collection using a transdermal device, such as that described in this study. Special consideration should be given to the appropriateness of a more patient-centred approach using capillary collection devices to assess if the benefits of reduced pain, remote sample collection and convenience to the patient outweigh the risks and challenges experienced by the laboratory (small samples and more manual processing, plus increased cost of consumables [25]). However this is an early adoption stage and the risks and cost will decline as more work is done and uptake increases over time [26].
Pilot study
The risks of not doing anything to improve access to blood testing for people with LD creates continued health inequalities. This inequality is based on unrecognized pathology, suboptimal drug monitoring and missed opportunities to influence health outcomes [5,27]. ‘Quality in healthcare’ has been defined as care that is safe, effective, patient centred, timely, efficient and equitable [28]. Improving access to appropriate blood sampling to the significant minority of patients with LD who struggle to have this vital service, fulfils all these aspects of healthcare quality improvement. Our study demonstrates that microsamples obtained by TAP devices provide a viable alternative to standard venous phlebotomy and painful finger prick collections.
Qualitative analysis of comments provided by both the participants and carers has identified common themes: (1) ‘The ease of the procedure’. The majority of comments mentioned that this method was ‘easy’ and ‘pain free’. (2) ‘The reduction of anxiety for future blood sampling procedures’. Traumatic experiences from the past were mentioned when venepuncture had been attempted. Carers' emotions were one of relief that in future this method may be available. (3) ‘Convenience’. Many carers mentioned the benefit of having this blood sampling procedure at the local Primary Care surgery and delight at the prospect this may be performed in the person's home, if necessary in future. This study demonstrates the potential of patient centric sampling to our local underserved learning disability population and answers Public Health England requirements for reasonable adjustments in this population [28–30]. Our project demonstrates wider potential acceptability for general patients with needle phobia. Needle phobia presents a great barrier to accessing healthcare and remaining engaged in regular health monitoring due to the fear of requiring a blood sample at each appointment. Approximately 1 in 10 adults in the UK suffer from needle phobia [31] and with an aging population with increased requirements for chronic disease monitoring, our study could potentially offer an alternative to routine venepuncture, providing another tool in the phlebotomist’s toolkit for accessing blood samples.
Summary points
•
Health inequalities exist for patients with learning disabilities (LD). This inequality is based on unrecognized pathology, suboptimal drug monitoring and missed opportunities to influence health outcomes.
•
We aimed to validate upper arm capillary blood collection against routine venepuncture in a generally healthy community-based population and to pilot this approach as a potential adjustment for blood collection in patients with LD and needle phobia.
•
Twenty-three routine chemistry tests in capillary blood collections were investigated for concordance with routine venepuncture samples. Sample quality was maintained in the capillary collections.
•
Potassium gave unreliable results from capillary blood and albumin showed a high degree of variability. Sixty percent of the tests demonstrated full clinical interchangeability with results from venepuncture samples and 30% proved suitable for use in long term monitoring.
•
The use of upper arm capillary sampling in our pilot population with LD and needle phobia, was reported by our patients as being pain free with greatly reduced anxiety and very convenient where sampling was done in a situation that was comfortable for the patient – a truly patient centric experience.
Author contributions
K Perkins and A Brown conceived the study. K Perkins received the grant award, undertook the data analysis and wrote the first draft of the manuscript. J Kilkenny carried laboratory-based practical work. T Jamieson undertook volunteer recruitment and sample collection. J Smith, J Pratt and S Duffin trained staff to use TAP devices and developed qualitative feedback questionnaire. All authors reviewed and edited the manuscript and approved the final version.
Acknowledgments
Without our patient volunteers, none of this could have happened. Many thanks to Chelsea-Anne Raines for assistance with sample processing and analysis and to Patricia Holman (previously at YourBioHealth) for training in TAP phlebotomy.
Financial disclosure
The project was funded by the Association for Clinical Biochemistry Research and Innovation Grant, UK and by Morecambe Bay Hospitals Charitable Fund, UK. The authors have received no other financial and/or material support for this research or the creation of this work apart from that disclosed.
Competing interests disclosure
The authors have no competing interests or relevant affiliations with any organization or entity with the subject matter or materials discussed in the manuscript. This includes employment, consultancies, honoraria, stock ownership or options, expert testimony, grants or patents received or pending, or royalties.
Writing disclosure
No funded writing assistance was utilized in the production of this manuscript.
Ethical conduct of research
The authors state that they have obtained appropriate institutional review board approval from the Ethics Committee of London – Dulwich HRA REC reference ID 22/PR/1568. The authors state that they have obtained verbal and written informed consent from the patient/patients for the inclusion of their medical and treatment history within this case report.
Data transparency statement
The authors certify that this manuscript reports the original results of a real-world evidence study. A prespecified study protocol was developed and is available in the manuscript. The study was preregistered at IRAS (319511). Deidentified data underlying the findings of this study are available and provided in the article as supplementary data tables and figures.
Open access
This work is licensed under the Attribution-NonCommercial-NoDerivatives 4.0 Unported License. To view a copy of this license, visit https://creativecommons.org/licenses/by-nc-nd/4.0/
Supplementary Material
File (supplementary materials.pptx)
References
1.
Public Health England. Blood tests for people with learning disabilities: making reasonable adjustments. (2017). https://assets.publishing.service.gov.uk/government/uploads/system/uploads/attachment_data/file/646489/Blood_tests_for_people_with_learning_disabilities.pdf
2.
UK Parliament (2010) Equality Act 2010. (2010). http://www.legislation.gov.uk/ukpga/2010/15/pdfs/ukpga_20100015_en.pdf
3.
Public Health England Guidance: Learning disability – applying All Our Health, Updated March 2023. (2023). https://www.gov.uk/government/publications/learning-disability-applying-all-our-health/learning-disabilities-applying-all-our-health#:∼:text=There%20are%20approximately%201.3%20million,adults%20aged%2018%20or%20over
4.
Public Health England Guidance: annual health checks for people with learning disabilities. (2016). https://www.gov.uk/government/publications/annual-health-checks-and-people-with-learning-disabilities/annual-health-checks-and-people-with-learning-disabilities
5.
Learning from lives and deaths – people with a learning disability and autistic people (LeDeR). (2021). https://www.kcl.ac.uk/research/leder
6.
Protti M, Mandrioli R, Mercolini L. Tutorial: volumetric absorptive microsampling (VAMS). Analytica Chimica Acta 1046, 32–47 (2019).
7.
Marshall DJ, Kim JJ, Brand S, Bryne C, Keevil BG. Assessment of tacrolimus and creatinine concentration collected using Mitra microsampling devices. Ann. Clin. Biochem. 57(5), 389–396 (2020).
8.
Lattin MT et al. Painless needle-free capillary blood collection for fertility hormone monitoring. Fertil. Steril. 124(5 Pt 2), 1124–1126 (2025).
9.
Zarbi J, Eimer E, Gigg C et al. Remote self-collection of capillary blood using upper arm devices for autoantibody analysis in patients with immune-mediated inflammatory rheumatic diseases. Rheumatic Skeletal Dis. 8, e002641 (2022).
10.
Voigt KR, Wullaert L, Verhoef C, Grunhagen DJ, Ramakers C. Reliable capillary sampling of carcinoembryonic antigen at home: CASA feasibility study. Colorectal Dis. 25, 1163–1168 (2023).
11.
Collier BB, Brandon WC, Chappell MR, Kovach PM, Grant RP. Maximising microsampling: measurement of comprehensive metabolic and lipid panels using a novel capillary blood collection device. J. Appl. Lab. Med. 8(6), 1115–1126 (2023).
12.
Silliman E, Chung EH, Fitzpatrick E et al. Evaluation of at-home serum anti-mullerian hormone testing: a head-to-head comparison study. Reprod. Biol. Endocrinol. 20, 113 (2022).
13.
Besser REJ, Long AE, Owen KR et al. Transdermal sampling for c-peptide is a minimally invasive, reliable alternative to venous sampling in children and adults with type 1 diabetes. Diabetes Care 47, 239–245 (2024).
14.
EP15-A3. User Verification of Precision and Estimation of bias, Approved Guideline – (3rd Edition). Clinical and Laboratory Standards Institute (2014).
15.
McCormack JP, Holmes DT. Your results may vary: the imprecision of medical measurements. Br. Med. J. 368, 1–5 (2020).
16.
Aarsand A, Fernandez-Calle P, Webster C et al. The EFLM biological variation database. (2022). https://biologicalvariation.eu/
17.
Nwankwo L, McLaren K, Donovan J et al. Utilisation of remote capillary blood testing in an outpatient clinic setting to improve shared decision making and patient and clinical experience: a validation and pilot study. BMJ Open Qual. 10, e001192 (2021).
18.
Ansari S, Abdel-Malek M, Kenkre J et al. The use of whole blood capillary samples to measure 15 analytes for a home-collect biochemistry service during the SARS-CoV-2 pandemic: a proposed model form North West London Pathology. Ann. Clin. Biochem. 58(5), 411–421 (2021).
19.
Thue G, Sandberg S. Analytical performance specifications based on how clinicians use laboratory tests. Experiences from a post-analytical external quality assessment programme. Clin. Chem. Lab Med. 53(6), 857–862 (2015).
20.
CLSI. Evaluation of detection caPAbility for clinical laboratory measurement procedures. 2nd Ed. CLSI document EP 17-A2. Clinical and Laboratory Standards Institute, PA, USA (2012).
21.
DiPasquale C, Christenson RH, Donnelly JG et al. Equivalence between capillary blood and venous blood test results using miniaturised assays and novel collection methods to support routine blood work. J. Appl. Lab. Med. 10(5), 1090–1140 (2025).
22.
Hosseini B, Dasari H, Smyrnova A et al. Concordance in COVID-19 serology, bone mineralization and inflammatory analytes between venous and self-collected capillary blood samples exposed to various pre-analytical conditions. Ann. Clin. Biochem. Int. J. Lab. Med. 60(4), 259–269 (2023).
23.
Wickremsinhe E, Fanatana A, Berthier E et al. Standard venipuncture vs a capillary blood collection device for the prospective determination of abnormal liver chemistry. J. Appl. Lab. Med. 8(3), 535–550 (2023).
24.
Marshall DJ, Kim JJ, Brand S, Bryne C, Keevil BG. Assessment of tacrolimus and creatinine concentration collected using Mitra microsampling devices. Ann. Clin. Biochem. 57(5), 389–396 (2020).
25.
Spooner N, Baker D, Carling RS et al. Patient centric blood sampling and analysis for diagnostics and laboratory medicine. Bioanalysis 17, 20 (2025).
26.
Woolley T, Hepburn S, Perkins K. Automatic for the people: an introduction to self-collected capillary blood testing. J.Patient Centricity. (2026). https://doi.org/10.57264/jpc-2026-0002
27.
Heslop P, Blair P, Flemming P et al. Confidential inquiry into premature deaths of people with learning disabilities (CIPOLD). (2013). (Accessed 4 April 2024). https://www.hqip.org.uk/resource/confidential-enquiry-into-deaths-of-people-with-learning-disabilities-cipold-2013/
28.
Boarden R, Harvey G, Moxham C, Proudlove N. NHS Institute for Innovation and Improvement, Coventry House, University of Warwick Campus, Coventry, CV4 7AL. Quality improvement: theory and practice in Healthcare. NHS Institute for Innovation and Improvement. (2008).
29.
Malik R, Giles C. Supporting people with learning disabilities to have blood tests. Learning Disability Practice 23(1), 18–25 (2020).
30.
NHS England CORE20PLUS5 (adults) – an approach to reducing healthcare inequalities. (Accessed December 2023). https://www.england.nhs.uk/about/equality/equality-hub/national-healthcare-inequalities-improvement-programme/core20plus5/ .
31.
Jarvis S. PatientInfo.com. Overcoming a fear of needles (needle phobia) (2019). https://patient.info/features/mental-health/overcoming-your-fear-of-needles
Information & Authors
Information
Published In
Copyright
© 2026 The authors. This work is licensed under the Attribution-NonCommercial-NoDerivatives 4.0 Unported License
History
Received: 18 March 2026
Accepted: 22 July 2026
Published online: 20 August 2026
Keywords:
Authors
Metrics & Citations
Metrics
Article Usage
Article usage data only available from February 2023. Historical article usage data, showing the number of article downloads, is available upon request.
Citations
How to Cite
Comparison of a capillary blood collection device and standard venepuncture for routine clinical biochemistry assays: developing reasonable adjustment phlebotomy for patients with learning disabilities. (2026) Journal of Patient Centricity. DOI: 10.57264/jpc-2026-0009
Export citation
Select the citation format you wish to export for this article or chapter.