Breast-conserving surgery versus mastectomy for older women with triple-negative breast cancer: population-based study
Publication: Journal of Comparative Effectiveness Research
Abstract
Purpose: To assess whether the poor prognosis of triple-negative breast cancer (TNBC) necessitates a more aggressive surgical approach. Methods: We examined the association of: breast-conserving surgery (BCS); BCS plus radiotherapy; mastectomy; and mastectomy plus radiotherapy with overall and breast cancer-specific survival of stage I–III TNBC patients aged 66 years and older. We used unweighted and inverse probability of treatment weighted Cox proportional hazards regression and the Fine and Gray sub-distribution model. Results: Among 4333 women, individuals who were selected for BCS, mastectomy or mastectomy plus radiotherapy had lower adjusted overall and breast cancer-specific survival compared with women who had BCS plus radiotherapy. Conclusion: In this population-based study, women with TNBC treated with BCS plus radiotherapy have a better prognosis than those treated with BCS, mastectomy or mastectomy plus radiotherapy. Given the poor prognosis of TNBC and selection bias inherent in observational studies, these findings should be confirmed in further studies such as randomized clinical trials.
Breast cancer is the most commonly diagnosed cancer among women in the USA. Triple-negative breast cancer (TNBC) is a breast cancer subtype associated with an aggressive clinical course, characterized by lack of expression of estrogen receptor, progesterone receptor and HER2 [1,2]. TNBC accounts for 12–15% of all invasive breast cancer cases in the USA and is more likely to be diagnosed among Black women [3]. Compared with other subtypes, TNBC has the highest recurrence rates and poorest survival rates, is usually of higher grade and has larger tumor size at diagnosis [1,4]. Because TNBC tumors do not express HER2 or the progesterone or estrogen receptors, neither hormone therapy nor medications that work by blocking HER2 are used to treat patients with TNBC [3]. This raises the question of whether the poor prognosis of TNBC warrants a more aggressive surgical approach and whether there is value in expanded use of radiation therapy among women with TNBC who receive mastectomy.
Breast-conserving surgery (BCS) and mastectomy are the two surgical options for breast cancer patients. Guidelines recommend that BCS should be followed by radiotherapy (RT) (i.e., BCS + RT) [5]. While patients who receive mastectomy can receive RT, it is generally only recommended for cases with positive surgical margins or lymph node involvement [6]. The National Comprehensive Cancer Network surgical guidelines for breast cancer do not vary by breast cancer subtype [6]. While randomized trials have shown that breast cancer patients undergoing BCS + RT or mastectomy have similar survival rates [7–9], to our knowledge no randomized trials have compared different surgical treatments for TNBC.
Several observational studies have explored the use of surgery and RT for TNBC but have produced conflicting findings. Two population-based studies found that patients with TNBC treated with BCS + RT had superior breast cancer-specific survival and overall survival (OS) compared with those who received mastectomy or mastectomy plus RT [10,11]. However, the studies had only 3 years of follow-up and did not adjust for comorbidities that may impact surgical treatment for breast cancer [12]. Two single-institution studies also found that patients with TNBC who received BCS + RT had higher OS compared with those who received mastectomy or mastectomy plus RT [13,14]. However, other single-institution studies found no difference in OS among patients with TNBC undergoing BCS + RT or mastectomy [15,16].
Our study aims to examine whether the poor prognosis of TNBC necessitates a more aggressive surgical approach (i.e., mastectomy instead of BCS) and whether RT after BCS or mastectomy improves OS and breast cancer-specific survival among older women in the USA. The goal is to inform guidelines for surgical treatment in this population.
Patients & methods
Data
We used the National Cancer Institute’s linked Surveillance Epidemiology and End Results (SEER)–Medicare database, which combines SEER population-based cancer registries data and Medicare claims. The SEER cancer registries provide population-based cancer surveillance data covering approximately 30% of the USA [17]. SEER data include patient sociodemographic and tumor characteristics, first course of treatment and follow-up vital statistics. Medicare is a federally funded insurance program that provides coverage to 97% of the US population aged 65 years and older. SEER–Medicare links 93% of eligible cancer cases to their Medicare claims [18].
Study population
The study cohort included women aged 66 years or older diagnosed with stage I–III triple-negative breast cancer as their first or only cancer between 2010 and 2015 and who received surgery. Medicare claims for most individuals in SEER–Medicare are not available before age 65 years. Requiring individuals to be 66 years or older ensured we had at least 1 year of Medicare claims to assess comorbidities before cancer diagnosis. We required the women to be enrolled in Medicare fee-for-service for at least 12 months before and after cancer diagnosis or until death. This ensured that women had complete claims. We excluded women who did not have a known month of diagnosis and whose diagnosis was based on autopsy or death certificate (Supplementary Table 1).
Patient characteristics
Patient demographic characteristics obtained from Medicare included age at diagnosis, race and comorbidity. Other sociodemographic variables included US census region and census median household income. We used the Charlson comorbidity score to calculate comorbidity and categorized it as 0, 1, 2 or 3+ [19]. Patient-level tumor characteristics obtained from SEER included tumor size and stage at diagnosis.
Treatment
The four treatments considered were: breast-conserving surgery (BCS); BCS plus radiotherapy; mastectomy; and mastectomy plus radiotherapy. We used MedPAR, Outpatient and Carrier files to identify the treatments (Supplementary Table 2) [20–22].
Outcome
Our outcomes were breast cancer-specific survival (BCSS) and overall survival (OS). Survival was defined as number of months from cancer diagnosis to death. Cause and date of death information were obtained from SEER. We used SEER’s death date because it is linked to cause of death information. Observations were censored at the date of death or end of the observation period (31 December 2015).
Statistical analysis
We used Pearson’s χ-square test to compare clinical and sociodemographic characteristics among the four treatment groups.
Overall survival
The Kaplan–Meier method was used to assess the cumulative incidence of all-cause mortality by treatment. The log rank test was used to test differences between the survival curves. Cox proportional hazards regression was used to evaluate the effect of treatment method on OS, controlling for tumor size, tumor stage, age at diagnosis, race, census tract median household income, US census region and Charlson comorbidity score.
Inverse probability of treatment weighting
Separately, we also used an inverse probability of treatment weighting (IPTW) Cox proportional hazards regression to evaluate the effect of treatment method on OS. To reduce treatment selection bias, we estimated propensity scores and used them in IPTW. Weighting patients by the inverse probability of the treatment received is another way to remove the association between the baseline covariates and treatment received [23]. We used polytomous logistic regression to estimate the probability of treatment conditional on these baseline variables: tumor size, tumor stage, age at diagnosis, race, census tract median household income, US census region and Charlson comorbidity score. The inverse of each person’s estimated probability of getting each treatment is the IPTW. We stabilized and truncated the IPTW to reduce variance induced by patients with extreme weights [24,25]. Stabilized IPTW was calculated by multiplying the IPTW by the estimated probability of receiving the treatment that each individual received [26]. The stabilized IPTWs were truncated at the 1st and 99th percentile [24]. After IPTW, we used Pearson’s χ-square to test the balance of the baseline variables and all variables were balanced.
Breast cancer-specific survival
We used the Fine and Gray competing risk approach, where death due to breast cancer was the event of interest and death from other causes was considered a competing risk [27]. We used a competing risk approach because individuals dying from other causes impacts the number of individuals who can die from breast cancer [28]. Cumulative incidence functions (CIFs) were used to estimate the incidence of death due to breast cancer by treatment. Gray’s test was used to test differences between the CIFs. We used a Fine and Gray subdistribution hazard model to evaluate the effect of treatment method on BCSS while controlling for demographic and clinical characteristics. Separately, we also used an IPTW Fine and Gray subdistribution hazard model to evaluate the effect of treatment method on BCSS. The stabilized and truncated IPTW method is described above.
We assessed the proportional hazard assumption in each analysis by specifying an interaction of treatment with survival time. The proportional hazard assumption was not violated.
Treatment pair comparisons & effect by stage
For each of the OS and BCSS models, we did pairwise comparisons to determine whether pairs of treatments differed, using Tukey’s multiple comparison test to compare each pair and adjust for multiple comparisons. To examine whether the overall treatment effects were the same within each stage, we split the dataset by stage (I, II and III) and redid the analysis described above.
Sensitivity analysis
We conducted a series of sensitivity analyses to confirm that our findings did not vary based on analytic decisions. First, we confirmed that removing the <11 individuals who survived for less than 1 month after diagnosis did not impact model estimates. We report the number of women excluded as ‘<11’ to comply with the SEER–Medicare data use agreement which does not allow reporting of numbers less than 11 [29]. Second, we assessed whether using specific age and tumor size categories impacted our results. We tested this by running the models described above with age as a continuous predictor, and categorizing the tumor sizes into smaller subcategories (≤2, >2 and ≤5, >5 and ≤10, and >10 cm).
Chemotherapy receipt
We conducted an analysis to examine whether our findings differed depending on chemotherapy receipt. First, the Kaplan–Meier method was used to assess the cumulative incidence of all-cause mortality by treatment and chemotherapy receipt. The log rank test was used to test differences between the survival curves. Second, CIFs were used to estimate the incidence of death due to breast cancer by treatment and chemotherapy receipt. Gray’s test was used to test differences between the CIFs. Third, we further adjusted for chemotherapy in the Cox proportional hazards regression and Fine and Gray subdistribution hazard models described above.
Factors associated with utilization of radiotherapy after BCS
Multivariate logistic regression was used to examine factors associated with receipt of RT after BCS.
All statistical tests were two-sided, and the level of significance was set at p < 0.05. All analyses used SAS (PC SAS 9.4, SAS Institute, Inc., NC, USA).
Results
Population description
A total of 4598 women met our inclusion criteria (Supplementary Table 1). Of these, 94% (n = 4333) received surgery (mastectomy or breast-conserving surgery). Of the 4333, 49% (n = 2110) were treated with BCS + radiotherapy, 28% (n = 1219) with mastectomy, 14% (n = 602) with mastectomy + RT and 9% (n = 402) with BCS. All the sociodemographic and clinical characteristics differed by treatment group except race. However, all the characteristics were balanced when we used stabilized and truncated inverse probability of treatment weightings (IPTWs; all p > 0.05). Compared with women who received other treatments, women who received BCS + RT were younger, more likely to have stage I disease, had smaller tumors (≤2 cm), had lower Charlson comorbidity scores and were more likely to live in the northeast US census region and to be in the highest census tract median household income grouping (>US$60,000) (Table 1).
| Characteristics | BCS (n = 402) | BCS + RT (n = 2110) | Mastectomy (n = 1219) | Mastectomy + RT (n = 602) | p-value† | IPTW p-value† | ||||
|---|---|---|---|---|---|---|---|---|---|---|
| n | % | n | % | n | % | n | % | |||
| Age at diagnosis (years) | <0.0001 | 0.86 | ||||||||
| 66–74 | 135 | 33.58 | 1254 | 59.43 | 533 | 43.72 | 348 | 57.81 | ||
| 75–84 | 139 | 34.58 | 716 | 33.93 | 474 | 38.88 | 185 | 30.73 | ||
| 85+ | 128 | 31.84 | 140 | 6.64 | 212 | 17.39 | 69 | 11.46 | ||
| Race | 0.35 | 0.72 | ||||||||
| White | 331 | 82.34 | 1746 | 82.75 | 994 | 81.54 | 499 | 82.89 | ||
| Black | 50 | 12.44 | 283 | 13.41 | 156 | 12.80 | 77 | 12.79 | ||
| Other | 21 | 5.22 | 81 | 3.84 | 69 | 5.66 | 26 | 4.32 | ||
| Region | <0.0001 | 0.21 | ||||||||
| Midwest | 57 | 14.18 | 268 | 12.70 | 166 | 13.62 | 92 | 15.28 | ||
| Northeast | 71 | 17.66 | 479 | 22.70 | 188 | 15.42 | 110 | 18.27 | ||
| South | 107 | 26.62 | 486 | 23.03 | 376 | 30.84 | 165 | 27.41 | ||
| West | 167 | 41.54 | 877 | 41.56 | 489 | 40.11 | 235 | 39.04 | ||
| Stage | <0.0001 | 0.29 | ||||||||
| I | 199 | 49.50 | 1274 | 60.38 | 428 | 35.11 | 51 | 8.47 | ||
| II | 173 | 43.03 | 731 | 34.64 | 623 | 51.11 | 231 | 38.37 | ||
| III | 30 | 7.46 | 105 | 4.98 | 168 | 13.78 | 320 | 53.16 | ||
| Tumor size | <0.0001 | 0.42 | ||||||||
| ≤2 cm | 211 | 52.49 | 1370 | 64.93 | 481 | 39.46 | 120 | 19.93 | ||
| >2 and ≤5 cm | 164 | 40.80 | 665 | 31.52 | 586 | 48.07 | 277 | 46.01 | ||
| >5 cm | 27 | 6.72 | 75 | 3.55 | 152 | 12.47 | 205 | 34.05 | ||
| Charlson comorbidity score | <0.0001 | 0.37 | ||||||||
| 0 | 245 | 60.95 | 1569 | 74.36 | 810 | 66.45 | 443 | 73.59 | ||
| 1 | 84 | 20.90 | 331 | 15.69 | 203 | 16.65 | 95 | 15.78 | ||
| 2 | 30 | 7.46 | 111 | 5.26 | 118 | 9.68 | 38 | 6.31 | ||
| 3+ | 43 | 10.70 | 99 | 4.69 | 88 | 7.22 | 26 | 4.32 | ||
| Census tract median household income | <0.0001 | 0.99 | ||||||||
| <US$40,000 | 87 | 21.64 | 346 | 16.40 | 281 | 23.05 | 111 | 18.44 | ||
| US$40,001–50,000 | 69 | 17.16 | 280 | 13.27 | 191 | 15.67 | 105 | 17.44 | ||
| US$50,001–60,000 | 60 | 14.93 | 325 | 15.40 | 197 | 16.16 | 95 | 15.78 | ||
| >US$60,000 | 156 | 38.81 | 1055 | 50.00 | 462 | 37.90 | 257 | 42.69 | ||
| Missing | 30 | 7.46 | 104 | 4.93 | 88 | 7.22 | 34 | 5.65 | ||
†
p-values based on Pearson χ2.
BCS: Breast-conserving surgery; IPTW: Inverse probability of treatment weighting; RT: Radiotherapy.
Overall survival
The treatment groups differed significantly according to the Kaplan–Meier curves (p < 0.0001) (Figure 1). The unadjusted Kaplan–Meier curves show higher overall survival (OS) for women who were selected for BCS + RT compared with those who were selected for BCS, mastectomy or mastectomy + RT. Specifically, the 5-year OS rates for women who underwent BCS + RT, mastectomy, mastectomy + RT, and BCS were 81.44, 57.16, 47.18 and 51.07%, respectively (Table 2).
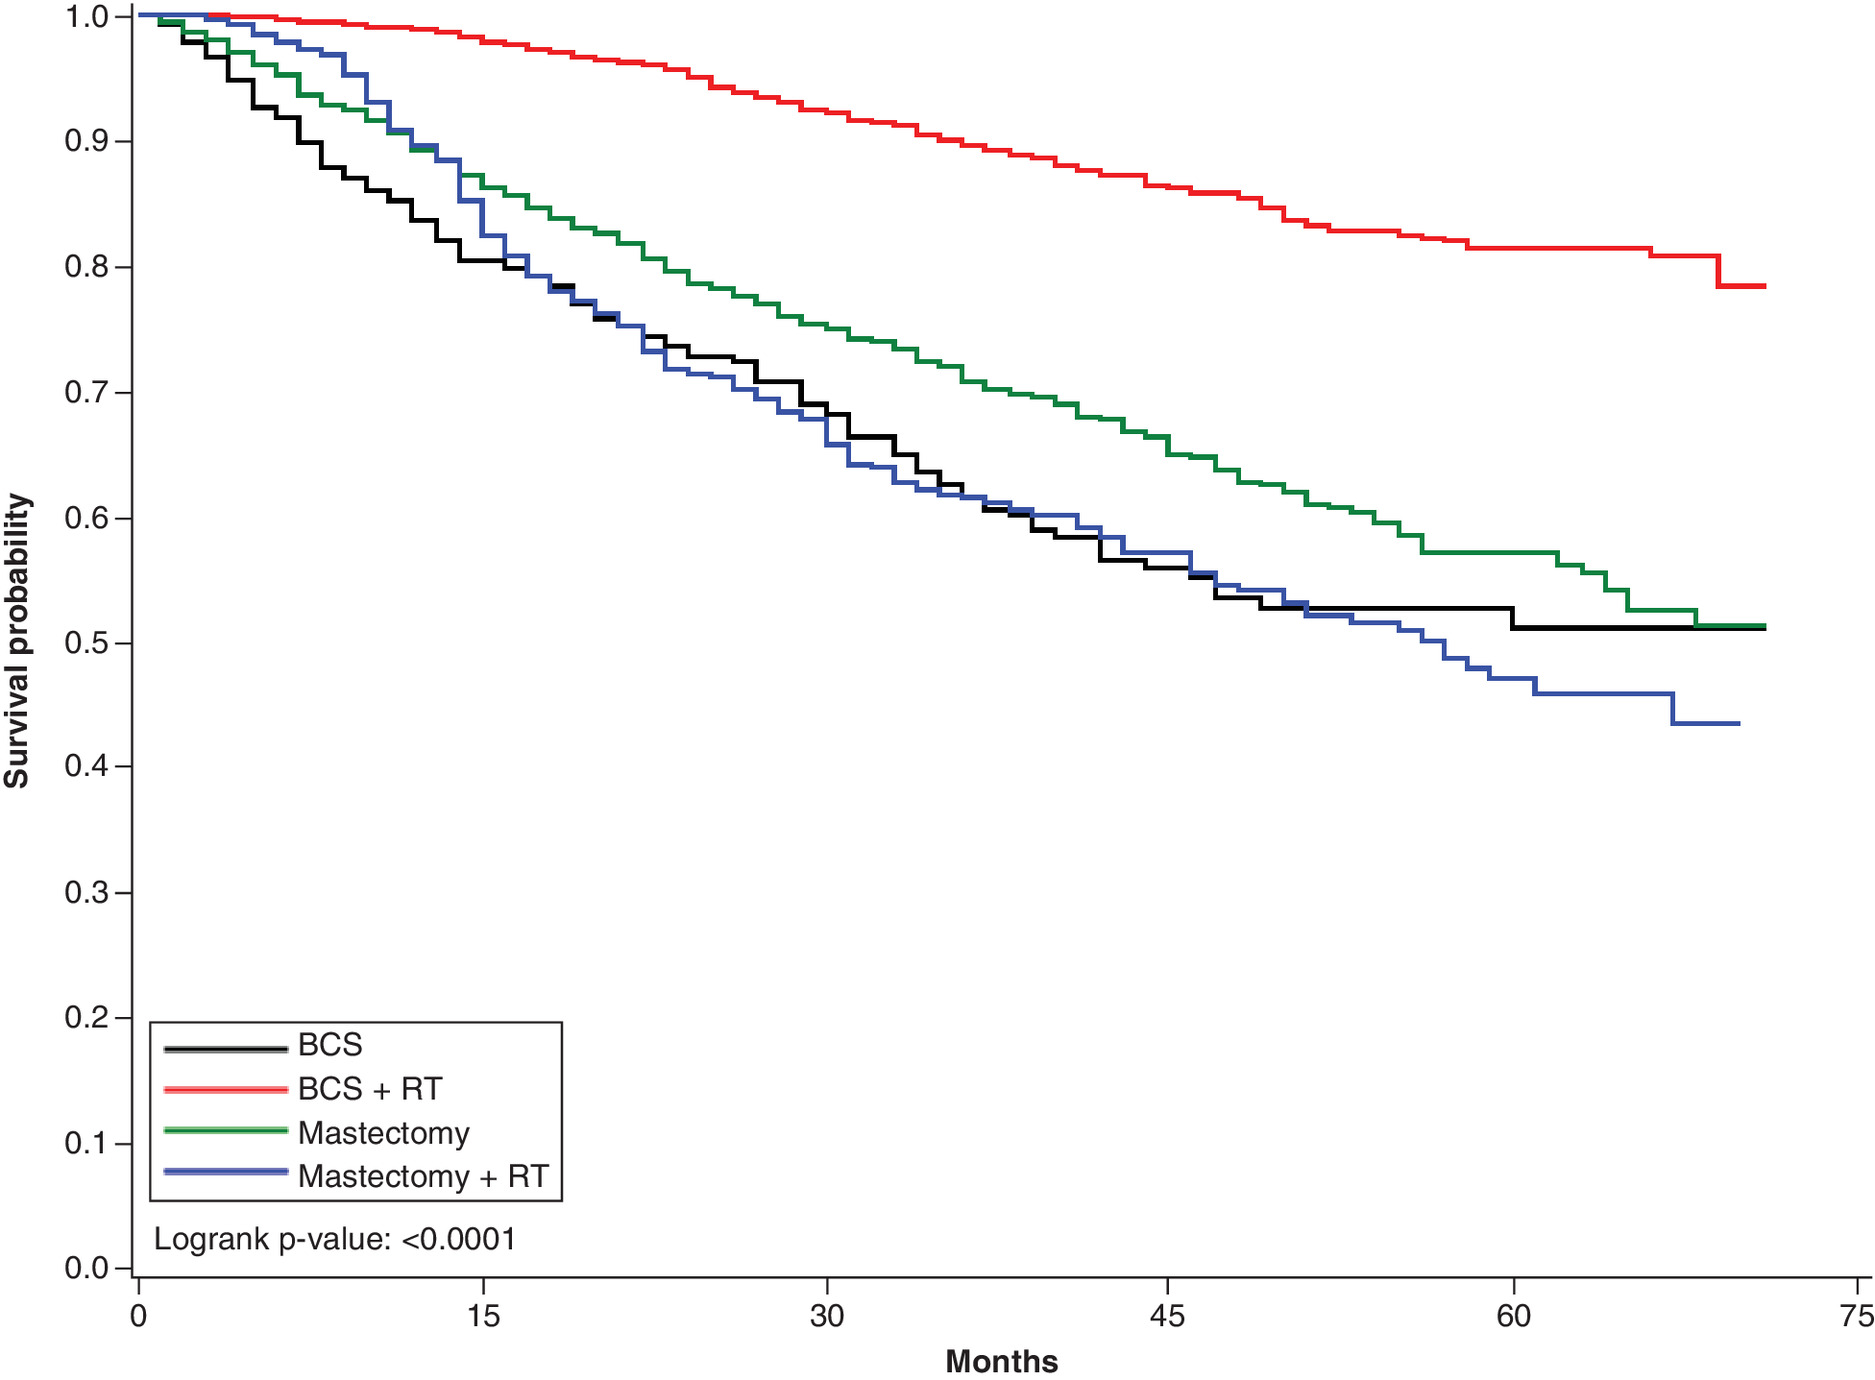
Figure 1. Overall survival: Kaplan–Meier curves by treatment.
Kaplan–Meier survival curves for each of the four treatments: breast-conserving surgery, breast-conserving surgery + radiotherapy, mastectomy and mastectomy + radiotherapy.
BCS: Breast-conserving surgery; RT: Radiotherapy.
| BCS + RT | Mastectomy | Mastectomy + RT | BCS | ||
|---|---|---|---|---|---|
| 5-year overall survival (%) | All patients | 81.44 | 57.16 | 47.18 | 51.07 |
| Received chemotherapy | 84.33 | 67.98 | 54.34 | 63.94 | |
| No chemotherapy receipt | 77.54 | 49.01 | 22.62 | 45.78 | |
| 5-year cumulative incidence of death due to breast cancer (%) | All patients | 8.35 | 18.56 | 36.02 | 20.44 |
| Received chemotherapy | 9.84 | 18.7 | 34.12 | 19.33 | |
| No chemotherapy receipt | 6.36 | 18.59 | 42.63 | 21.21 | |
| 5-year cumulative incidence of death due to other causes (%) | All patients | 10.21 | 24.28 | 16.81 | 28.49 |
| Received chemotherapy | 5.83 | 13.32 | 11.54 | 16.72 | |
| No chemotherapy receipt | 16.1 | 32.4 | 34.75 | 33.02 |
BCS: Breast-conserving surgery; RT: Radiotherapy.
Findings from our multivariate and IPTW Cox proportional hazard models were similar (Table 3 & Supplementary Table 3). Here we present output from the multivariate Cox proportional hazard models. The three other treatments differed significantly from BCS + RT after controlling for sociodemographic and clinical characteristics. Women who received BCS, mastectomy or mastectomy + RT had significantly higher hazard of death compared with women who had BCS + RT (hazard ratios [HRs]: 3.05 [95% CI: 2.43–3.83], 2.03 [95% CI: 1.70–2.43] and 1.74 [95% CI:1.39–2.17], respectively) (Table 3). In pairwise comparisons adjusted for multiple comparisons (Table 4), five pairs of treatments differed significantly. Women who had BCS or mastectomy or mastectomy+ RT had significantly higher hazard of death compared with those who had BCS + RT (adjusted p-values <0.0001), and women who had BCS had significantly higher hazards of death compared with those who had mastectomy or mastectomy + RT (HRs: 1.50 [adjusted p = 0.0008] and 1.75 [adjusted p = 0.0001], respectively). However, the hazard of death did not differ between those who had mastectomy versus mastectomy + RT (adjusted p = 0.39).
| HR | 95% CI | p-value | |
|---|---|---|---|
| Treatment | |||
| BCS + RT | 1.00 (Reference) | ||
| BCS | 3.05 | 2.43–3.83 | <0.0001 |
| Mastectomy | 2.03 | 1.70–2.43 | <0.0001 |
| Mastectomy + RT | 1.74 | 1.39–2.17 | <0.0001 |
| Tumor size | |||
| ≤2 cm | 1.00 (Reference) | ||
| >2 and ≤5 cm | 1.09 | 0.85–1.41 | 0.49 |
| >5 cm | 1.61 | 1.23–2.10 | 0.0005 |
| Stage | |||
| I | 1.00 (Reference) | ||
| II | 2.03 | 1.54–2.68 | <0.0001 |
| III | 4.10 | 3.06–5.50 | <0.0001 |
| Age at diagnosis (years) | |||
| 66–74 | 1.00 (Reference) | ||
| 75–84 | 1.52 | 1.30–1.77 | <0.0001 |
| 85+ | 2.49 | 2.08–2.98 | <0.0001 |
| Race | |||
| White | 1.00 (Reference) | ||
| Black | 0.89 | 0.72–1.09 | 0.24 |
| Other | 0.98 | 0.71–1.35 | 0.90 |
| Charlson comorbidity score | |||
| 0 | 1.00 (Reference) | ||
| 1 | 1.26 | 1.05–1.50 | 0.01 |
| 2 | 1.49 | 1.18–1.89 | 0.001 |
| 3+ | 2.30 | 1.85–2.87 | <0.0001 |
| Census tract median household income | |||
| <US$40,000 | 1.00 (Reference) | ||
| US$40,001–50,000 | 1.07 | 0.87–1.33 | 0.52 |
| US$50,001–60,000 | 1.00 | 0.80–1.24 | 0.97 |
| >US$60,000 | 0.90 | 0.75–1.09 | 0.29 |
| Missing | 1.02 | 0.76–1.35 | 0.92 |
| Region | |||
| Midwest | 1.24 | 1.02–1.52 | 0.03 |
| Northeast | 0.97 | 0.80–1.18 | 0.74 |
| South | 1.21 | 1.02–1.44 | 0.03 |
| West | 1.00 (Reference) | ||
BCS: Breast-conserving surgery; HR: Hazard ratio; RT: Radiotherapy.
| Treatment | HR | 95% CI | p-value† |
|---|---|---|---|
| BCS vs BCS + RT | 3.05 | 2.43–3.84 | <0.0001 |
| BCS vs mastectomy + RT | 1.75 | 1.35–2.27 | 0.0001 |
| BCS vs mastectomy | 1.50 | 1.22–1.85 | 0.0008 |
| Mastectomy + RT vs BCS + RT | 1.74 | 1.39–2.17 | <0.0001 |
| Mastectomy vs BCS + RT | 2.03 | 1.70–2.43 | <0.0001 |
| Mastectomy vs mastectomy + RT | 1.17 | 0.96–1.42 | 0.39 |
Covariates adjusted for included tumor size, tumor stage, age at diagnosis, race, census tract median household income, US census region and Charlson comorbidity score.
†
The Tukey multiple comparison test was used to compare each pair and adjust for multiple comparisons.
BCS: Breast-conserving surgery; HR: Hazard ratio; RT: Radiotherapy.
Several factors were independent predictors of increased hazard of death (Table 3). Women with tumor size >5 cm had higher hazard of death than those whose tumor size was ≤2 cm (HR: 1.61; 95% CI: 1.23–2.10). Women whose tumors were stage II or III had higher hazard of death than those whose tumors were stage I (HR: 2.03 [95% CI: 1.54–2.68] and HR: 4.10 [95% CI: 3.06–5.50], respectively). Lastly, older women (75–84 and 85+ years) had a higher hazard of death than younger women (66–74 years); women with higher Charlson comorbidity score had a higher hazard of death than those with lower scores; and women who lived in the midwest and south US census regions had a higher hazard of death compared with those who lived in the west.
Breast cancer-specific survival
Gray’s test indicated that the treatment groups differed significantly in their cumulative incidence functions (CIFs; p < 0.0001) (Figure 2). The unadjusted CIFs showed lower cumulative incidence of death due to breast cancer for women who received BCS + RT compared with those who received mastectomy, mastectomy + RT, or BCS. The 5-year cumulative incidences of death due to breast cancer for women who underwent BCS + RT, mastectomy, mastectomy + RT, and BCS were 8.35, 18.56, 36.02 and 20.44%, respectively (Table 2).
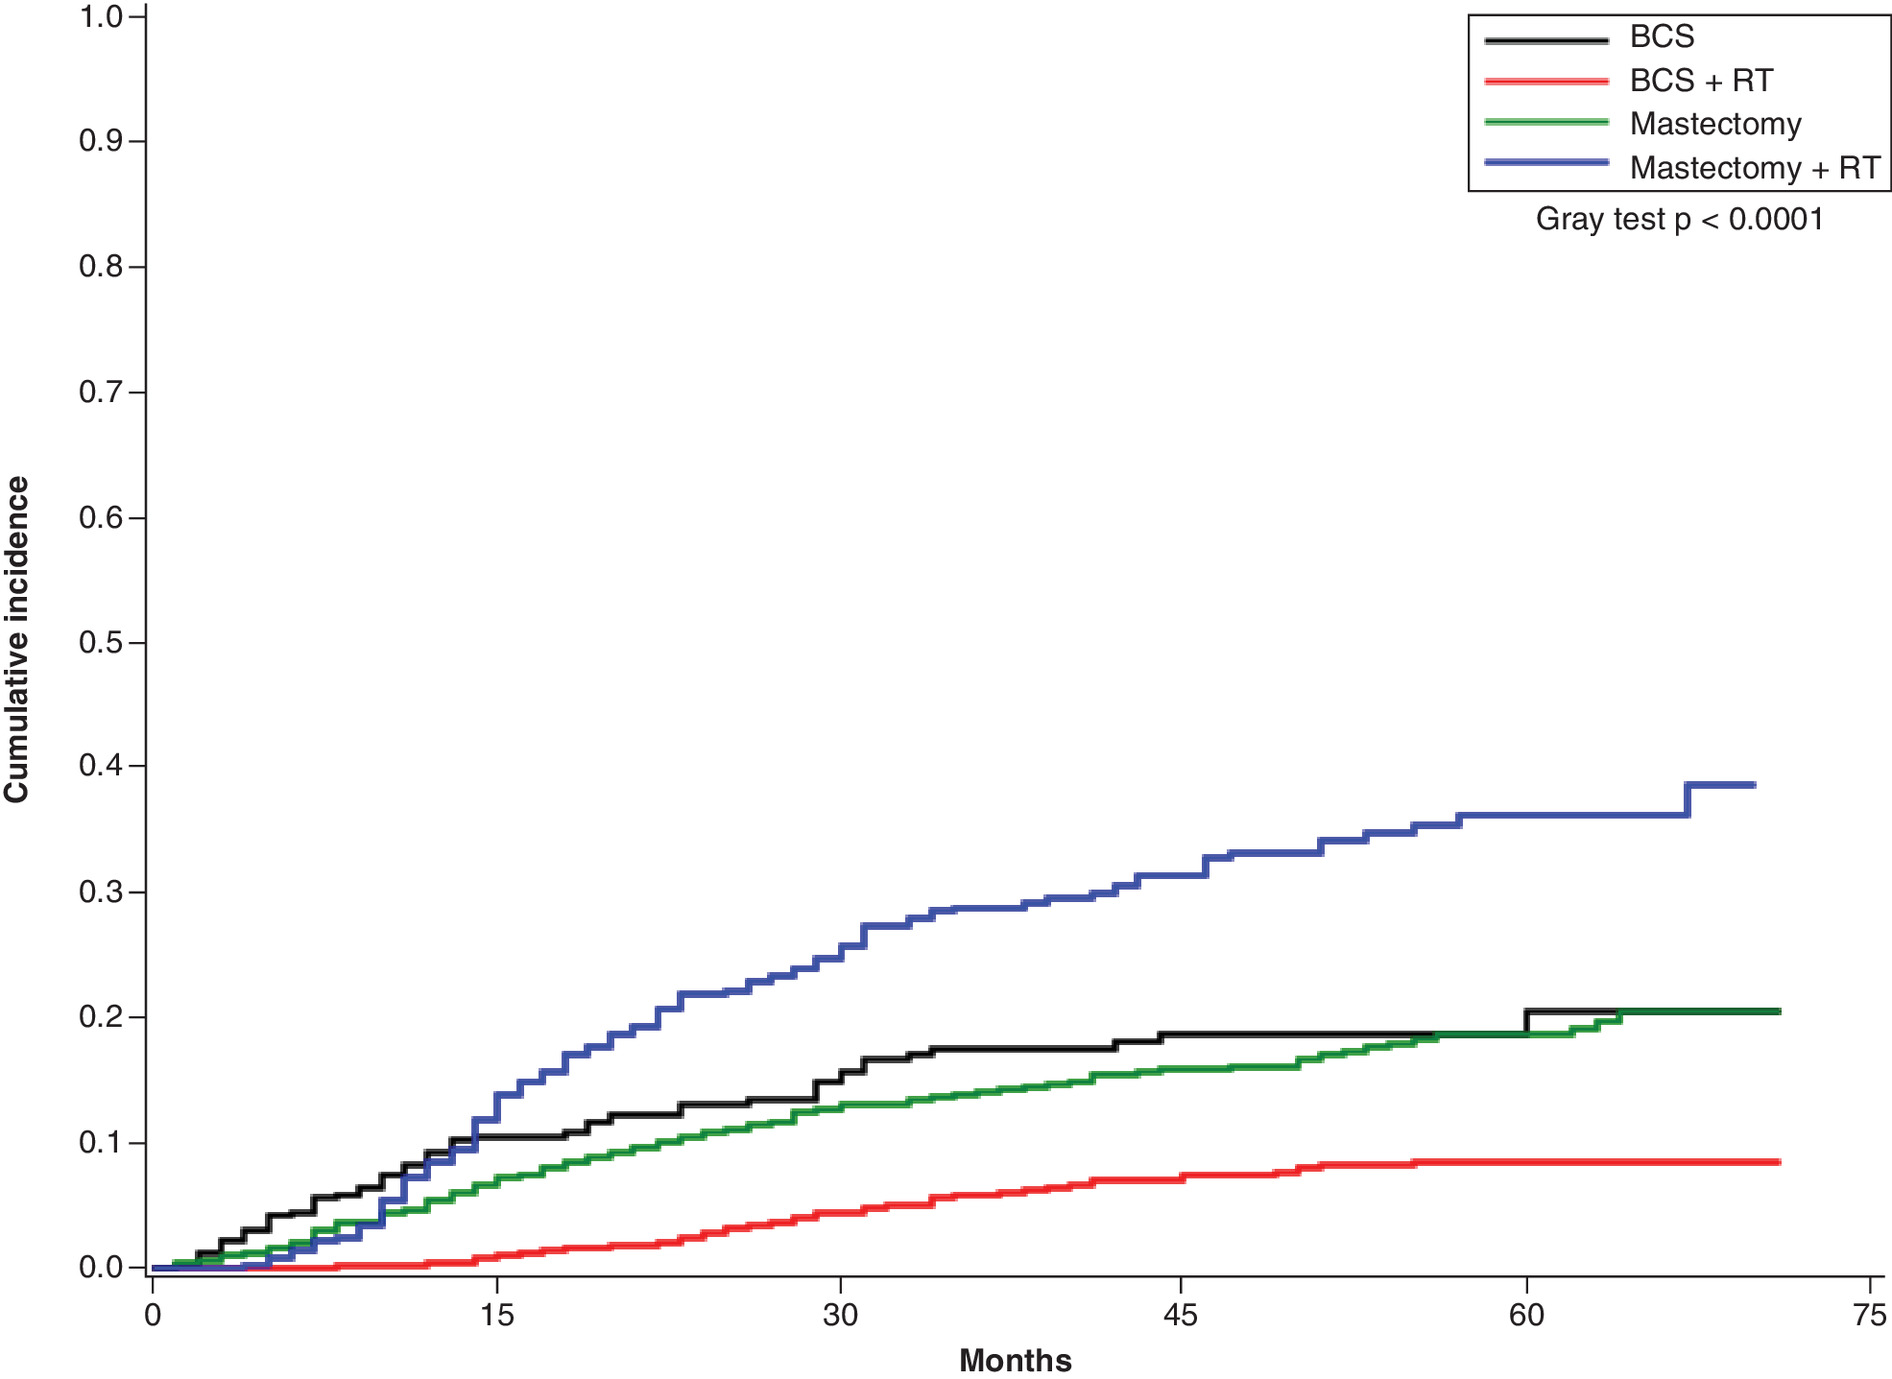
Figure 2. Cumulative incidence of death due to breast cancer.
Cumulative incidence function curves for each of the four treatments: breast-conserving surgery, breast-conserving surgery + radiotherapy, mastectomy and mastectomy and radiotherapy.
BCS: Breast-conserving surgery; RT: Radiotherapy.
As with OS, findings were similar from our multivariate and IPTW Fine and Gray subdistribution hazard models (Table 5 & Supplementary Table 4). Here we present output from the multivariate Fine and Gray subdistribution hazard model. The three other treatments differed significantly from BCS + RT after controlling for sociodemographic and clinical characteristics. Women who had BCS, mastectomy or mastectomy + RT had significantly higher hazard of death due to breast cancer compared with women who had BCS + RT (subdistribution hazard ratios [sHRs]: 2.67 [95% CI: 1.88–3.80], 1.64 [95% CI: 1.26–2.12], 1.95 [95% CI: 1.45–2.63], respectively) (Table 5).
| sHR | 95% CI | p-value | |
|---|---|---|---|
| Treatment | |||
| BCS + RT | 1.00 (Reference) | ||
| BCS | 2.67 | 1.88–3.80 | <0.0001 |
| Mastectomy | 1.64 | 1.26–2.12 | 0.0002 |
| Mastectomy + RT | 1.95 | 1.45–2.63 | <0.0001 |
| Tumor size | |||
| ≤2 cm | 1.00 (Reference) | ||
| >2 and ≤5 cm | 1.15 | 0.82–1.61 | 0.41 |
| >5 cm | 1.69 | 1.20–2.39 | 0.003 |
| Stage | |||
| I | 1.00 (Reference) | ||
| II | 3.04 | 2.03–4.54 | <0.0001 |
| III | 6.67 | 4.38–10.15 | <0.0001 |
| Age at diagnosis (years) | |||
| 66–74 | 1.00 (Reference) | ||
| 75–84 | 1.13 | 0.92–1.40 | 0.25 |
| 85+ | 1.51 | 1.16–1.97 | 0.003 |
| Race | |||
| White | 1.00 (Reference) | ||
| Black | 0.74 | 0.55–1.02 | 0.06 |
| Other | 0.64 | 0.38–1.08 | 0.09 |
| Charlson comorbidity score | |||
| 0 | 1.00 (Reference) | ||
| 1 | 0.96 | 0.74–1.25 | 0.76 |
| 2 | 1.30 | 0.94–1.80 | 0.12 |
| 3+ | 1.23 | 0.84–1.81 | 0.29 |
| Census tract median household income | |||
| <US$40,000 | 1.00 (Reference) | ||
| US$40,001–50,000 | 1.03 | 0.76–1.40 | 0.85 |
| US$50,001–60,000 | 1.03 | 0.76–1.39 | 0.85 |
| >US$60,000 | 0.85 | 0.65–1.11 | 0.22 |
| Missing | 1.01 | 0.67–1.52 | 0.97 |
| Region | |||
| Midwest | 1.32 | 1.00–1.73 | 0.05 |
| Northeast | 0.89 | 0.63–1.18 | 0.41 |
| South | 1.26 | 1.00–1.60 | 0.05 |
| West | 1.00 (Reference) | ||
BCS: Breast-conserving surgery; RT: Radiotherapy; sHR: Subdistribution hazard ratio.
In pairwise comparisons adjusted for multiple comparisons (Table 6), four pairs of treatments differed. Women who had BCS, mastectomy or mastectomy + RT had a significantly higher hazard of death due to breast cancer compared with those who had BCS + RT (adjusted p < 0.0001, 0.001 and <0.0001, respectively). Also, women who had BCS had a significantly higher hazard of death due to breast cancer compared with those who had a mastectomy (sHR: 1.63; adjusted p = 0.02). However, the hazard of death due to breast cancer did not differ significantly for those who had a mastectomy versus mastectomy + RT or BCS versus mastectomy + RT (adjusted p = 0.56 and 0.40, respectively).
| sHR | 95% CI | p-value† | |
|---|---|---|---|
| BCS vs BCS + RT | 2.67 | 1.88–3.80 | <0.0001 |
| BCS vs mastectomy + RT | 1.37 | 0.93–2.03 | 0.40 |
| BCS vs mastectomy | 1.63 | 1.18–2.27 | 0.02 |
| Mastectomy + RT vs BCS + RT | 1.95 | 1.45–2.63 | <0.0001 |
| Mastectomy vs BCS + RT | 1.64 | 1.26–2.12 | 0.001 |
| Mastectomy vs mastectomy + RT | 0.84 | 0.64–1.09 | 0.56 |
Covariates adjusted for included tumor size, tumor stage, age at diagnosis, race, census tract median household income, US census region and Charlson comorbidity score.
†
The Tukey multiple comparison test was used to compare each pair and adjust for multiple comparisons.
BCS: Breast-conserving surgery; RT: Radiotherapy; sHR: Subdistribution hazard ratio.
Several factors were independent predictors of increased hazard of death due to breast cancer (Table 5). Women with tumor size >5 cm had higher hazard of death due to breast cancer than those whose tumor size was ≤2 cm (sHR: 1.69; 95% CI: 1.20–2.39). Women whose tumors were stage II or III had higher hazard of death due to breast cancer than those whose tumors were stage I (sHRs: 3.04 [95% CI: 2.03–4.54] and 6.67 [95% CI: 4.38–10.15], respectively). Lastly, women aged 85+ years had higher hazard of death due to breast cancer than those whose aged 66–74 years.
Treatment effect by stage
The overall pattern persisted when we divided the data into three subsets defined by stage. In stages I and II, BCS + RT was associated with significantly higher OS and breast cancer-specific survival compared with BCS, mastectomy or mastectomy + RT. However, among women with stage III disease, BCS + RT, mastectomy or mastectomy + RT did not differ significantly in breast cancer-specific survival, while BCS + RT and mastectomy + RT did not differ significantly in OS (Tables 7–10).
| Stage I | Stage II | Stage III | |||||||
|---|---|---|---|---|---|---|---|---|---|
| HR | 95% CI | p-value | HR | 95% CI | p-value | HR | 95% CI | p-value | |
| Treatment | |||||||||
| BCS + RT | 1.00 (Reference) | 1.00 (Reference) | 1.00 (Reference) | ||||||
| BCS | 2.69 | 1.82–3.97 | <0.0001 | 2.61 | 1.88–3.62 | <0.0001 | 6.50 | 3.5–11.93 | <0.0001 |
| Mastectomy | 1.84 | 1.31–2.58 | 0.0005 | 1.98 | 1.55–2.55 | <0.0001 | 2.57 | 1.64–4.03 | <0.0001 |
| Mastectomy + RT | 3.34 | 1.76–6.34 | 0.0002 | 2.22 | 1.60–3.09 | <0.0001 | 1.45 | 0.96–2.20 | 0.09 |
Covariates adjusted for included tumor size, tumor stage, age at diagnosis, race, census tract median household income, US census region and Charlson comorbidity score.
BCS: Breast-conserving surgery; HR: Hazard ratio; RT: Radiotherapy.
| Stage I | Stage II | Stage III | |||||||
|---|---|---|---|---|---|---|---|---|---|
| HR | 95% CI | p-value† | HR | 95% CI | p-value† | HR | 95% CI | p-value† | |
| Treatment | |||||||||
| BCS vs BCS + RT | 2.69 | 1.82–3.97 | <0.0001 | 2.61 | 1.88–3.62 | <0.0001 | 6.50 | 3.54–11.93 | <0.0001 |
| BCS vs mastectomy + RT | 0.80 | 0.4–1.60 | 0.93 | 1.17 | 0.81–1.70 | 0.84 | 4.47 | 2.71–7.39 | <0.0001 |
| BCS vs mastectomy | 1.46 | 0.98–2.19 | 0.25 | 1.31 | 0.98–1.76 | 0.26 | 2.53 | 1.54–4.16 | 0.002 |
| Mastectomy + RT vs BCS + RT | 3.34 | 1.76–6.34 | 0.001 | 2.22 | 1.60–3.09 | <0.0001 | 1.45 | 0.96–2.20 | 0.3 |
| Mastectomy vs BCS + RT | 1.84 | 1.31–2.58 | 0.003 | 1.98 | 1.55–2.55 | <0.0001 | 2.57 | 1.64–4.03 | 0.0002 |
| Mastectomy vs mastectomy + RT | 0.55 | 0.29–1.06 | 0.28 | 0.89 | 0.66–1.20 | 0.88 | 1.77 | 1.33–2.35 | 0.0005 |
Covariates adjusted for included tumor size, tumor stage, age at diagnosis, race, census tract median household income, US census region and Charlson comorbidity score.
†
The Tukey multiple comparison test was used to compare each pair and adjust for multiple comparisons.
BCS: Breast-conserving surgery; HR: Hazard ratio; RT: Radiotherapy.
| Stage I | Stage II | Stage III | |||||||
|---|---|---|---|---|---|---|---|---|---|
| sHR | 95% CI | p-value | sHR | 95% CI | p-value | sHR | 95% CI | p-value | |
| Treatment | |||||||||
| BCS + RT | 1.00 (Reference) | 1.00 (Reference) | 1.00 (Reference) | ||||||
| BCS | 2.46 | 1.15–5.27 | 0.02 | 1.97 | 1.19–3.25 | 0.01 | 5.35 | 2.40–11.91 | <0.0001 |
| Mastectomy | 1.35 | 0.71–2.58 | 0.36 | 1.65 | 1.17–2.33 | 0.004 | 1.78 | 1.01–3.14 | 0.05 |
| Mastectomy + RT | 4.87 | 1.88–12.58 | 0.001 | 2.25 | 1.48–3.42 | 0.0002 | 1.71 | 1.04–2.81 | 0.03 |
Covariates adjusted for included tumor size, tumor stage, age at diagnosis, race, census tract median household income, US census region and Charlson comorbidity score.
BCS: Breast-conserving surgery; RT: Radiotherapy; sHR: Subdistribution hazard ratio.
| Stage I | Stage II | Stage III | |||||||
|---|---|---|---|---|---|---|---|---|---|
| sHR | 95% CI | p-value† | sHR | 95% CI | p-value† | sHR | 95% CI | p-value† | |
| Treatment | |||||||||
| BCS vs BCS + RT | 2.46 | 1.15–5.27 | 0.09 | 1.97 | 1.19–3.25 | 0.04 | 5.35 | 2.40–11.91 | 0.0002 |
| BCS vs mastectomy + RT | 0.51 | 0.17–1.48 | 0.60 | 0.88 | 0.50–1.53 | 0.97 | 3.12 | 1.59–6.15 | 0.01 |
| BCS vs mastectomy | 1.82 | 0.82–4.05 | 0.45 | 1.19 | 0.75–1.90 | 0.88 | 3.01 | 1.50–6.01 | 0.01 |
| Mastectomy + RT vs BCS + RT | 4.87 | 1.88–12.58 | 0.006 | 2.25 | 1.48–3.42 | 0.0009 | 1.71 | 1.04–2.81 | 0.14 |
| Mastectomy vs BCS + RT | 1.35 | 0.71–2.58 | 0.80 | 1.65 | 1.17–2.33 | 0.02 | 1.78 | 1.01–3.14 | 0.19 |
| Mastectomy vs mastectomy + RT | 0.28 | 0.10–0.74 | 0.06 | 0.74 | 0.49–1.10 | 0.43 | 1.04 | 0.72–1.51 | 0.99 |
Covariates adjusted for included tumor size, tumor stage, age at diagnosis, race, census tract median household income, US census region and Charlson comorbidity score.
†
The Tukey multiple comparison test was used to compare each pair and adjust for multiple comparisons.
BCS: Breast-conserving surgery; RT: Radiotherapy; sHR: Subdistribution hazard ratio.
Sensitivity analysis
Excluding individuals who survived for less than a month, using age at diagnosis as continuous and smaller tumor size categories did not change our findings (Supplementary Tables 5A & B, 6A & B, 7A & B & 8A & B).
Chemotherapy receipt
Overall, just over one-half (56%; n = 2425) of patients received chemotherapy; 29.35% of BCS, 60.66% of BCS + RT, 45.04% of mastectomy and 79.40% of mastectomy + RT patients received chemotherapy (Supplementary Table 9). Chemotherapy receipt was associated with higher unadjusted 5-year OS in all the four treatments (BCS, BCS + RT, mastectomy and mastectomy + RT; Table 2). Similar to the overall analysis, the unadjusted Kaplan–Meier curves show higher OS for women who received BCS + RT compared with those who received BCS, mastectomy or mastectomy + RT regardless of chemotherapy receipt (Supplementary Figures 1 & 2). Chemotherapy receipt was associated with higher unadjusted 5-year cumulative incidence of death due to breast cancer among BCS + RT or mastectomy patients and lower unadjusted 5-year cumulative incidence of death due to breast cancer among those who had mastectomy + RT or BCS (Table 2). Similar to the overall analysis, the unadjusted CIFs showed lower cumulative incidence of death due to breast cancer for women who received BCS + RT compared with those who received mastectomy, mastectomy + RT, or BCS regardless of chemotherapy receipt (Supplementary Figures 3 & 4). Adjusting for chemotherapy in the main models did not change our findings (Supplementary Tables 10A & B & 11A & B).
Factors associated with utilization of RT after BCS
Of the BCS patients, 16% did not receive RT after BCS. On multivariate analysis, individuals aged 75–84 and 85+ years had a lower likelihood of receiving RT after BCS compared with individuals aged 66–74 years (odds ratios: 0.57 [95% CI: 0.44–0.73] and 0.11 [95% CI: 0.08–0.16], respectively). Patients with census tract median household income >US$60,000 were more likely to receive RT after BCS compared with those with a census tract median household income <US$40,000 (odds ratio: 1.65; 95% CI: 1.18–2.32). Higher comorbidity score was associated with less likelihood of receiving RT after BCS (Supplementary Table 12).
Discussion
This population-based study of women diagnosed with stage I–III TNBC found that being selected for BCS + RT was associated with lower 5-year cumulative incidence of all-cause and breast cancer-specific death compared with mastectomy, mastectomy + RT or BCS. These findings persisted in the multivariate and IPTW Cox proportional and Fine and Gray subdistribution hazard models, in which individuals who had BCS + RT had a lower hazard of all-cause and breast cancer-specific mortality compared with those who had mastectomy, mastectomy + RT or BCS. Similar patterns were observed in stage-specific analysis. Being selected for BCS + RT was associated with significantly higher OS and BCSS among women who had stage I or stage II disease. Although BCS + RT did not differ significantly from mastectomy and mastectomy + RT in stage III, women who selected for BCS + RT had better OS and BCSS than did women who received other treatments. We note that the analysis of stage III, where the sample size was only 623, had lower statistical power compared with stage I (n = 1952) and stage II (n = 1758). Similar to the overall analysis, individuals selected for BCS + RT had lower unadjusted 5-year cumulative incidence of all-cause and breast cancer-specific death compared with individuals selected for mastectomy, mastectomy + RT or BCS, regardless of chemotherapy receipt. Adjusting for chemotherapy in our analysis did not change our findings. This could be because the National Comprehensive Cancer Network guidelines do not consider the type of surgery the patient received when determining whether they should also receive chemotherapy.
Based on results from randomized trials of surgical treatment for breast cancer, we would have expected women undergoing BCS + RT or mastectomy to have similar hazards of death after accounting for clinical and demographic factors [7–9]. Our finding of worse OS and BCSS for women receiving mastectomy than for those receiving BCS + RT suggests other factors could have differed between these groups of women that were not accounted for in our analyses. Several factors determine receipt of surgical and radiation treatment; we took steps to reduce the effect of these factors on our findings. In our study, patients who underwent mastectomy or mastectomy + RT tended to be older and to have higher stage and larger tumor size compared with those who underwent BCS or BCS + RT. We accounted for these differences in our multivariate and IPTW analysis. Older patients, who generally have more comorbidities, were more likely to receive mastectomy than BCS + RT [12]. To account for comorbidities, we adjusted for the Charlson comorbidity score [19]. Patients who received mastectomy had higher 5-year other-cause mortality compared with those who had BCS + RT, further suggesting that patients undergoing mastectomy are different from those undergoing BCS + RT. To address this issue, we assessed BCSS, which does not include deaths due to other causes and is thus a better estimator of treatment effect. However, there are other potential confounders that we could not account for; therefore, residual selection bias contributes to some of our findings. We lacked information such as lymphovascular invasion and surgical margins, which may be associated with poorer prognosis [30,31]. We also lacked information on provider and patient preferences, which impact treatment receipt [32]. Another explanation for better survival rates among those who were selected for BCS + RT compared with mastectomy is our outcomes of interest: OS and BCSS. Two observational studies found that among early-stage patients with TNBC, BCS + RT and mastectomy did not differ in terms of locoregional recurrence [14–16]. Unfortunately, we could not assess recurrence in our study because the Surveillance, Epidemiology and End Results (SEER) Medicare data do not include information about recurrence. However, our finding that BCS + RT was associated with improved survival is consistent with conclusions from other population-based observational studies in early breast cancer in general [33–36] and among patients with TNBC [10,11,37].
Our study, which used the SEER–Medicare database, has several advantages over the Chen et al. [10] and Wang et al. [11] studies, which used SEER data. These advantages include adjustment for patient comorbidity, which may impact the treatment received [12], accounting for competing risks of death from non-breast cancer causes, and longer follow-up time (5 vs 3 years). Also, the sensitivity of the SEER data in identifying radiation therapy is low, so using SEER–Medicare data allowed us to have more complete and accurate radiation information [38]. Lastly, unlike in previous studies on TNBC surgical and RT treatments [10,11,13–16], we assessed all surgical and RT combination options available to patients with TNBC, thus providing a more comprehensive understanding of the effectiveness of these treatments.
The National Comprehensive Cancer Network guidelines recommend that early-stage breast cancer patients receive radiation therapy following BCS because omitting RT after BCS is associated with an increased risk of recurrence and mortality [39]. However, 16% of patients who received BCS did not receive RT, which is similar to the proportion reported in previous studies [40,41]. In our study, predictors for not receiving RT after BCS included older age, higher comorbidity and lower census tract median household income. Our findings confirm previously published studies which found that lack of RT after BCS is more common in elderly individuals and those with lower socioeconomic status [42,43]. As expected, in the multivariate analysis, women who received BCS without RT had the lowest OS and BCSS. In our study, most women who received BCS without RT had smaller tumors that were diagnosed at an earlier stage. Early-stage smaller tumors, which have a lower risk of recurrence, may have contributed to these women not receiving radiation after BCS. However, given that radiation after BCS reduces recurrence even among women with tumors of better prognosis (e.g., early-stage and estrogen receptor-positive tumors) [44] and the aggressive biology of TNBC, omission of RT after BCS is problematic and needs to be addressed urgently.
In our study we did not observe any differences by race in survival outcomes after controlling for treatment, sociodemographic and clinical characteristics. These findings are consistent with several studies that found that among patients with TNBC, racial groups did not differ in OS and BCSS after controlling for treatment and sociodemographic characteristics [10,11,15,45,46]. Although we did not find racial disparities in survival, it is important to note that TNBC is more likely to be diagnosed among Black women and has a worse prognosis than other subtypes, so there is still an urgent need for better treatment strategies for TNBC [1].
This study had several limitations. First, we only included individuals who were at least 66 years old and enrolled in Medicare fee-for-service, so our findings may not generalize to a younger population or those enrolled in health maintenance organizations. Second, we were unable to assess recurrence because SEER does not collect this information. Third, we could not control for some clinical factors such as margin status, family history/genetic risk and nonclinical factors such as patient and physician preferences, which may impact both treatment receipt and outcome. Although we used IPTW and multivariate analysis to address selection bias, this remains a concern in observational studies such as ours. Despite these limitations, our study, which used population-based data and is a nationally representative sample of elderly individuals, contributes valuable new information on the effectiveness of surgical treatment for TNBC in this population.
Conclusion
This population-based cohort study of older patients with triple-negative breast cancer found that breast-conserving surgery (BCS) followed by radiotherapy is associated with better survival outcomes compared with BCS only, mastectomy only or mastectomy plus radiation. Residual selection bias is a concern in our study; therefore further investigation, for example in randomized clinical trials, is warranted to confirm our findings. The decision between BCS and mastectomy is complicated, and shared decision-making between patients and clinicians is necessary. Other factors to consider in the decision-making include availability of breast reconstruction surgery, contraindications for radiotherapy, complications of radiotherapy and better cosmetic outcomes of BCS compared with mastectomy.
•
The poor prognosis of triple-negative breast cancer (TNBC) raises the question whether mastectomy (the most aggressive surgical approach) is associated with better prognosis compared with breast-conserving surgery (BCS) among patients with TNBC.
•
Using the Surveillance, Epidemiology and End Results–Medicare linked database, we identified women aged 66 years and older diagnosed with stage I–III TNBC between 2010 and 2015.
•
In a sample of 4333 women, 49% were treated with BCS + radiotherapy (RT), 28% with mastectomy, 14% with mastectomy + RT and 9% with BCS.
•
Women who received BCS, mastectomy or mastectomy + RT had significantly higher hazard of death compared with women who had BCS + RT.
•
Similarly, women who had BCS, mastectomy or mastectomy + RT had significantly higher hazard of death due to breast cancer compared with women who had BCS + RT.
•
In this population-based study, women with TNBC treated with BCS + RT have a better prognosis compared with those treated with BCS, mastectomy or mastectomy + RT.
•
Our findings, consistent with previous observational studies, suggest that BCS + RT is associated with better prognosis in patients with early-stage TNBC. However, it was not possible to control for all potential confounders; thus there is a need to confirm our findings in a randomized clinical trial.
Financial & competing interests disclosure
The authors have no relevant affiliations or financial involvement with any organization or entity with a financial interest in or financial conflict with the subject matter or materials discussed in the manuscript. This includes employment, consultancies, honoraria, stock ownership or options, expert testimony, grants or patents received or pending, or royalties.
No writing assistance was utilized in the production of this manuscript.
Ethical conduct of research
The authors state that they have obtained appropriate institutional review board approval or have followed the principles outlined in the Declaration of Helsinki for all human or animal experimental investigations. In addition, for investigations involving human subjects, informed consent has been obtained from the participants involved.
Supplementary Material
References
Papers of special note have been highlighted as: • of interest; •• of considerable interest
1.
Metzger-Filho O, Sun Z, Viale G et al. Patterns of recurrence and outcome according to breast cancer subtypes in lymph node-negative disease: results from international breast cancer study group trials VIII and IX. J. Clin. Oncol. 31(25), 3083–3090 (2013).
2.
Russnes HG, Lingjaerde OC, Borresen-Dale AL, Caldas C. Breast cancer molecular stratification: from intrinsic subtypes to integrative clusters. Am. J. Pathol. 187(10), 2152–2162 (2017).
3.
Foulkes WD, Smith IE, Reis-Filho JS. Triple-negative breast cancer. N. Engl. J. Med. 363(20), 1938–1948 (2010).
•• Review of the molecular characteristics and treatment of triple-negative breast cancer.
4.
Plasilova ML, Hayse B, Killelea BK, Horowitz NR, Chagpar AB, Lannin DR. Features of triple-negative breast cancer: analysis of 38,813 cases from the national cancer database. Medicine 95(35), e4614 (2016).
5.
Warburton R, Chiu CG, Roberts A et al. Current surgical management of breast cancer. Br. Columbia Med. J. 60, 92–98 (2018).
6.
National Comprehensive Cancer Network. NCCN Guidelines. www.nccn.org/professionals/physician_gls/default.aspx
7.
Lichter AS, Lippman ME, Danforth DN Jr et al. Mastectomy versus breast-conserving therapy in the treatment of stage I and II carcinoma of the breast: a randomized trial at the National Cancer Institute. J. Clin. Oncol. 10(6), 976–983 (1992).
8.
Veronesi U, Cascinelli N, Mariani L et al. Twenty-year follow-up of a randomized study comparing breast-conserving surgery with radical mastectomy for early breast cancer. N. Engl. J. Med. 347(16), 1227–1232 (2002).
9.
Fisher B, Anderson S, Bryant J et al. Twenty-year follow-up of a randomized trial comparing total mastectomy, lumpectomy, and lumpectomy plus irradiation for the treatment of invasive breast cancer. N. Engl. J. Med. 347(16), 1233–1241 (2002).
10.
Chen Q-X, Wang X-X, Lin P-Y et al. The different outcomes between breast-conserving surgery and mastectomy in triple-negative breast cancer: a population-based study from the SEER 18 database. Oncotarget 8(3), 4773–4780 (2016).
• Population-based study showing that patients treated with breast-conserving surgery followed by radiotherapy had better outcomes than patients treated with mastectomy.
11.
Wang SE, Sun YD, Zhao SJ, Wei F, Yang G. Breast conserving surgery (BCS) with adjuvant radiation therapy showed improved prognosis compared with mastectomy for early staged triple negative breast cancer patients. Math. Biosci. Eng. 17(1), 92–104 (2019).
• Population-based study showing that patients treated with breast-conserving surgery followed by radiotherapy had better outcomes than patients treated with mastectomy or mastectomy and radiotherapy.
12.
Zhou J, Enewold L, Zahm SH et al. Breast conserving surgery versus mastectomy: the influence of comorbidities on choice of surgical operation in the Department of Defense health care system. Am. J. Surg. 206(3), 393–399 (2013).
13.
Abdulkarim BS, Cuartero J, Hanson J, Deschenes J, Lesniak D, Sabri S. Increased risk of locoregional recurrence for women with T1–2N0 triple-negative breast cancer treated with modified radical mastectomy without adjuvant radiation therapy compared with breast-conserving therapy. J. Clin. Oncol. 29(21), 2852–2858 (2011).
14.
Adkins FC, Gonzalez-Angulo AM, Lei X et al. Triple-negative breast cancer is not a contraindication for breast conservation. Ann. Surg. Oncol. 18(11), 3164–3173 (2011).
15.
Zumsteg ZS, Morrow M, Arnold B et al. Breast-conserving therapy achieves locoregional outcomes comparable to mastectomy in women with T1–2N0 triple-negative breast cancer. Ann. Surg. Oncol. 20(11), 3469–3476 (2013).
16.
Parker CC, Ampil F, Burton G, Li BDL, Chu QD. Is breast conservation therapy a viable option for patients with triple-receptor negative breast cancer? Surgery 148(2), 386–391 (2010).
17.
Duggan MA, Anderson WF, Altekruse S, Penberthy L, Sherman ME. The Surveillance, Epidemiology, and End Results (SEER) program and pathology: toward strengthening the critical relationship. Am. J. Surg. Pathol. 40(12), e94–e102 (2016).
18.
Warren JL, Klabunde CN, Schrag D, Bach PB, Riley GF. Overview of the SEER–Medicare data: content, research applications, and generalizability to the United States elderly population. Med. Care 40(Suppl. 8), IV-3-18 (2002).
19.
National Cancer Institute. Comorbidity SAS Macro (2014 version). https://healthcaredelivery.cancer.gov/seermedicare/considerations/macro-2014.html
20.
Dieguez G, Ferro C, Rotter D. The cost burden of blood cancer care. A longitudinal analysis of commercially insured patients diagnosed with blood cancer (2018). www.lls.org/sites/default/files/Milliman%20study%20cost%20burden%20of%20blood%20cancer%20care.pdf
21.
Gibson DC, Chou L-N, Raji MA, Baillargeon JG, Kuo Y-F. Opioid prescribing trends in women following mastectomy or breast-conserving surgery before and after the 2014 federal reclassification of hydrocodone. Oncologist 25(4), 281–289 (2020).
22.
Killelea BK, Long JB, Chagpar AB et al. Trends and clinical implications of preoperative breast MRI in Medicare beneficiaries with breast cancer. Breast Cancer Res. Treat. 141(1), 155–163 (2013).
23.
Austin PC, Stuart EA. Moving towards best practice when using inverse probability of treatment weighting (IPTW) using the propensity score to estimate causal treatment effects in observational studies. Stat. Med. 34(28), 3661–3679 (2015).
24.
Cole SR, Hernán MA. Constructing inverse probability weights for marginal structural models. Am. J. Epidemiol. 168(6), 656–664 (2008).
25.
Xu S, Ross C, Raebel MA, Shetterly S, Blanchette C, Smith D. Use of stabilized inverse propensity scores as weights to directly estimate relative risk and its confidence intervals. Value Health 13(2), 273–277 (2010).
26.
Pezzi A, Cavo M, Biggeri A, Zamagni E, Nanni O. Inverse probability weighting to estimate causal effect of a singular phase in a multiphase randomized clinical trial for multiple myeloma. BMC Med. Res. Methodol. 16(1), 150 (2016).
27.
Fine JP, Gray RJ. A proportional hazards model for the subdistribution of a competing risk. J. Am. Stat. Assoc. 94(446), 496–509 (1999).
28.
Bolch CA, Chu H, Jarosek S, Cole SR, Elliott S, Virnig B. Inverse probability of treatment-weighted competing risks analysis: an application on long-term risk of urinary adverse events after prostate cancer treatments. BMC Med. Res. Methodol. 17(1), 93 (2017).
29.
National Cancer Institute. SEER–Medicare data use agreement (DUA). https://healthcaredelivery.cancer.gov/seermedicare/obtain/seerdua.pdf
30.
Houssami N, Macaskill P, Marinovich ML et al. Meta-analysis of the impact of surgical margins on local recurrence in women with early-stage invasive breast cancer treated with breast-conserving therapy. Eur J Cancer 46(18), 3219–3232 (2010).
31.
Schoppmann SF, Bayer G, Aumayr K et al. Prognostic value of lymphangiogenesis and lymphovascular invasion in invasive breast cancer. Ann Surg. 240, 306–312 (2004).
32.
Gu J, Groot G, Boden C, Busch A, Holtslander L, Lim H. Review of factors influencing women’s choice of mastectomy versus breast conserving therapy in early stage breast cancer: a systematic review. Clin. Breast Cancer 18(4), e539–e554 (2018).
33.
Agarwal S, Pappas L, Neumayer L, Kokeny K, Agarwal J. Effect of breast conservation therapy vs mastectomy on disease-specific survival for early-stage breast cancer. JAMA Surg. 149(3), 267–274 (2014).
• Population-based study showing that patients with invasive breast cancer who received breast-conserving surgery and radiotherapy had better outcomes than those who received mastectomy or mastectomy and radiotherapy.
34.
Hwang ES, Lichtensztajn DY, Gomez SL, Fowble B, Clarke CA. Survival after lumpectomy and mastectomy for early stage invasive breast cancer: the effect of age and hormone receptor status. Cancer 119(7), 1402–1411 (2013).
35.
Van Maaren MC, De Munck L, De Bock GH et al. 10 year survival after breast-conserving surgery plus radiotherapy compared with mastectomy in early breast cancer in the Netherlands: a population-based study. Lancet Oncol. 17(8), 1158–1170 (2016).
36.
Boniface JD, Szulkin R, Johansson ALV. Survival after breast conservation vs mastectomy adjusted for comorbidity and socioeconomic status: a Swedish national 6-year follow-up of 48,986 women. JAMA Surg. 156(7), 628–637 (2021).
• Recent large population-based study adjusted for comorbidities and socioeconomic factors. Found patients with invasive breast cancer treated with breast-conserving surgery had better outcomes than those treated with mastectomy alone or mastectomy and radiotherapy.
37.
Kim K, Park HJ, Shin KH et al. Breast conservation therapy versus mastectomy in patients with t1-2n1 triple-negative breast cancer: pooled analysis of KROG 14-18 and 14-23. Cancer Res. Treat. 50(4), 1316–1323 (2018).
38.
Noone A-M, Lund JL, Mariotto A et al. Comparison of SEER treatment data with Medicare claims. Med. Care 54(9), e55–e64 (2016).
39.
Vinh-Hung V, Verschraegen C. Breast-conserving surgery with or without radiotherapy: pooled-analysis for risks of ipsilateral breast tumor recurrence and mortality. J. Natl Cancer Inst. 96(2), 115–121 (2004).
40.
Longacre C, Neprash H, Shippee N, Tuttle T, Virnig B. Travel, treatment choice, and survival among breast cancer patients: a population-based analysis. Womens Health Rep. 2(1), 1–10 (2021).
41.
Guidolin K, Lock M, Vogt K et al. Recurrence and mortality after breast-conserving surgery without radiation. Curr. Oncol. 26(6), 380–388 (2019).
42.
Dragun AE, Huang B, Tucker TC, Spanos WJ. Disparities in the application of adjuvant radiotherapy after breast-conserving surgery for early stage breast cancer: impact on overall survival. Cancer 117(12), 2590–2598 (2011).
43.
Dreyer MS, Nattinger AB, Mcginley EL, Pezzin LE. Socioeconomic status and breast cancer treatment. Breast Cancer Res. Treat. 167(1), 1–8 (2018).
44.
Viani GA, Stefano EJ, Afonso SL et al. Breast-conserving surgery with or without radiotherapy in women with ductal carcinoma in situ: a meta-analysis of randomized trials. Radiat. Oncol. 2, 28 (2007).
45.
Pacheco JM, Gao F, Bumb C, Ellis MJ, Ma CX. Racial differences in outcomes of triple-negative breast cancer. Breast Cancer Res. Treat. 138(1), 281–289 (2013).
46.
Warner ET, Tamimi RM, Hughes ME et al. Racial and ethnic differences in breast cancer survival: mediating effect of tumor characteristics and sociodemographic and treatment factors. J. Clin. Oncol. 33(20), 2254–2261 (2015).
Information & Authors
Information
Published In
Pages: 953 - 967
PubMed: 35894095
Copyright
© 2022 Future Medicine Ltd.
History
Received: 2 November 2021
Accepted: 27 June 2022
Published online: 27 July 2022
Keywords:
Topics
Authors
Metrics & Citations
Metrics
Article Usage
Article usage data only available from February 2023. Historical article usage data, showing the number of article downloads, is available upon request.
Citations
How to Cite
Breast-conserving surgery versus mastectomy for older women with triple-negative breast cancer: population-based study. (2022) Journal of Comparative Effectiveness Research. DOI: 10.2217/cer-2021-0273
Export citation
Select the citation format you wish to export for this article or chapter.
Citing Literature
- Daniela Fulginiti, Sabrina S Domene, Carla Isabella Miret Durazo, Vanessa Boosahda, Thomas Campos Carmona, Karla Lora-Tavarez, Hrachya Ajamyan, Haya Al Shakkakee, Pallavi Shekhawat, Oxiris Yexalen Garcia Gonzalez, Breast-Conserving Surgery vs Mastectomy for Non-metastatic Breast Cancer: A Systematic Review and Meta-Analysis of Observational Studies, Cureus, 10.7759/cureus.88612, (2025).
- Buraq Ahmed, Qutaiba Al-Khames Aga, Kwok-Leung Cheung, Jana de Boniface, Michael Gnant, Maria-Joao Cardoso, Emad Rakha, Thiraviyam Elumalai, Nadia Harbeck, Orit Kaidar-Person, Amit Agrawal, Treatment strategies for triple-negative primary breast cancer in older women: a systematic review, JNCI Cancer Spectrum, 10.1093/jncics/pkaf049, 9, 3, (2025).
- Hsuan-Wen Lai, Yu-An Chen, Ka-Wai Tam, Surgical treatments for older breast cancer patients: A systematic review and meta-analysis of real-world evidence, Surgery, 10.1016/j.surg.2024.08.045, 176, 6, (1576-1590), (2024).
- Kiran K Rajan, Katherine Fairhurst, Beth Birkbeck, Shonnelly Novintan, Rebecca Wilson, Jelena Savović, Chris Holcombe, Shelley Potter, Overall survival after mastectomy versus breast-conserving surgery with adjuvant radiotherapy for early-stage breast cancer: meta-analysis , BJS Open, 10.1093/bjsopen/zrae040, 8, 3, (2024).
- Ottavia Amato, Valentina Guarneri, Fabio Girardi, Epidemiology trends and progress in breast cancer survival: earlier diagnosis, new therapeutics, Current Opinion in Oncology, 10.1097/CCO.0000000000000991, 35, 6, (612-619), (2023).
- Konstantinos Venetis, Elham Sajjadi, Mariia Ivanova, Silvia Andaloro, Simona Pessina, Chiara Zanetti, Alberto Ranghiero, Gabriele Citelli, Chiara Rossi, Marco Lucioni, Umberto Malapelle, Fabio Pagni, Massimo Barberis, Elena Guerini‐Rocco, Giuseppe Viale, Nicola Fusco, The molecular landscape of breast mucoepidermoid carcinoma, Cancer Medicine, 10.1002/cam4.5754, 12, 9, (10725-10737), (2023).