Tralokinumab as a cost-saving treatment option for adults and adolescents with moderate-to-severe atopic dermatitis enrolled in US health insurance plans: a budget impact analysis
Publication: Journal of Comparative Effectiveness Research
Abstract
Background: Atopic dermatitis (AD) is a chronic and burdensome condition that causes intense itching and painful skin lesions and affects around 10% of adults and adolescents across the US. Potent systemic treatments, such as tralokinumab, are needed to treat patients with moderate-to-severe disease who have experienced inadequate symptom control using topical therapies. Novel systemic treatments can not only provide effective relief for these patients but can also be cost saving. Aim: To evaluate the budgetary implications of tralokinumab as a treatment for moderate-to-severe AD in a hypothetical US commercial healthcare plan with 1 million (M) members. Materials & methods: A budget impact model was developed to estimate the difference in total systemic treatment costs between two scenarios: one in which dupilumab, lebrikizumab, nemolizumab, abrocitinib and upadacitinib are assumed to be the only treatments available, and one in which tralokinumab is assumed to be an additional option. The analysis took the perspective of a US commercial payer and estimated total treatment costs over a 3-year time horizon. Patients were distributed to treatments based on forecasted market share data and could switch from dupilumab to other systemic treatments in the model at any time. Switching rates were also informed using forecasting data. Adult patients receiving tralokinumab and adults or adolescents receiving lebrikizumab and nemolizumab could switch to a lower frequency administration schedule if they achieved clear or almost clear skin, reducing the number of doses received and consequently the treatment costs. Treatment costs were informed by 2025 wholesale acquisition costs. Results: Total costs when tralokinumab was not available were estimated to be $21.0 M, $27.7 M and $35.9 M in years 1–3, respectively. When tralokinumab was available, estimates were $20.6 M (Δ-0.5 M) in year 1, $26.6 M (Δ-1.1 M) in year 2 and $34.1 M (Δ-1.8 M) in year 3. Therefore, availability of tralokinumab led to cumulative cost savings of $3.4 M across all 3 years ($2.3 M in adults and $1.1 M in adolescents). Cumulative treatment costs per plan member at year 3 also reduced from $84.68 to $81.26 (Δ-3.42) due to tralokinumab. Lastly, cumulative per patient treatment costs across the 653 patients estimated to receive systematic therapy over the 3 years reduced from $129,794 to $124,556 when tralokinumab was available. Conclusion: Tralokinumab is a cost-saving therapy when used for the treatment of moderate-to-severe AD in both adult and adolescent populations, with cost savings driven by competitive skin clearance rates, low monthly treatment costs and flexible dosing options in adults (i.e., Q2W → Q4W).
Plain language summary: Tralokinumab can reduce treatment costs for adult & adolescent patients with moderate-to-severe eczema
What is this article about?
This article reports the estimated cost implications of providing tralokinumab as a treatment option for patients with moderate-to-severe eczema; a debilitating condition that affects many adults and adolescents in the US.
What were the results?
Costs were estimated and compared for two scenarios: one where tralokinumab was available and one where it was not. The differences in total costs between these scenarios represented the cost implications associated with tralokinumab use. Results showed that tralokinumab had the potential to reduce total treatment costs for moderate-to-severe eczema for both adults and adolescents by a cumulative total of $3.4 million over a 3-year period.
Why is this important?
Eczema treatments that provide cost savings are important as they help to manage the ever-increasing healthcare costs associated with the disease, which put pressure on the budgets of commercial and public healthcare providers. The evidence provided by this research suggests that tralokinumab has cost-saving potential and our findings can be used to inform decisions around which treatments are offered to patients with moderate-to-severe eczema.
Atopic dermatitis (AD) is a chronic inflammatory condition characterized by intense itching, redness, dry skin and recurring eczematous lesions [1]. Patients affected by AD often experience symptoms early in life which has led AD to historically be considered a pediatric disease. However, prevalence of AD in adults is also considerable, with up to 10% of adults in the US experiencing the condition; estimated prevalence among adolescents is similar [2,3]. Patients with lesions that cover a high proportion of their body surface area and who experience severe symptoms are commonly considered to have moderate-to-severe disease [2,4–10].
The burden of AD is substantial with detriments to patients’ physical, psychological and social wellbeing, as well as their quality of life [11,12]. One study even suggests that AD has the highest burden of any skin condition in terms of loss of disability-adjusted life years and also ranks in the top 15 most burdensome non-fatal diseases [11]. The economic burden of AD is also considerable and has been estimated at $5 billion annually in the US, as of 2016 [13,14]. When inflated to 2025 $USD, this would equate to approximately $6.7 bn, with $1.6 bn attributed to direct medical costs, $1.0 bn associated with indirect costs and productivity loss and $4.2 bn associated with ‘intangible’ costs due to negative quality of life impact [13–16].
Traditionally, moderate-to-severe AD has been treated with topical therapies such as corticosteroids (TCS) and emollients and systemic treatments such as oral corticosteroids and immunosuppressive drugs, including methotrexate, cyclosporine and azathioprine [17]. Systemic immunosuppressive drugs and oral corticosteroids are known to have poor safety profiles and are therefore not strongly recommended by treatment guidelines [17–20]. TCS are the most common first-line treatment but are known to have limited efficacy, and a high proportion of patients (up to 61%) report that their symptoms stop responding to treatment after long-term use [21]. TCS have also been associated with high rates of adverse events (AEs) that contribute to poor adherence and treatment discontinuation [21,22]. Additionally, long-term use of high potency TCS can cause painful topical steroid withdrawal syndrome as the patient attempts to stop treatment [21,23,24].
Topical treatments may not be medically advisable in some instances, such as when disease presents in sensitive areas, or when skin atrophy is present [25]. Therefore, alternative treatment options are required in patients for whom topical treatments have not been effective, or are contraindicated. New innovative AD treatments have recently been developed to serve this unmet need in systemic treatments such as biologics and Janus Kinase inhibitors (JAKi) [4,6–10,25,26]. As per US FDA labeling, biologics are intended to be prescribed first in patients with moderate-to-severe disease whose disease is not adequately controlled with topical therapies, or when those therapies are not advisable [27–30]. JAKi therapies are recommended as a subsequent systemic treatment option should biologics also provide inadequate disease control or when biologics are also inadvisable [31,32]. While systemic treatments serve a critical unmet need, the benefits of these treatments need to be balanced with costs to achieve a therapeutic strategy that is effective in managing AD, while controlling the ever-increasing economic burden of AD treatment.
Tralokinumab has been shown to be an effective systemic treatment option in both adults and adolescents with moderate-to-severe AD in instances where topical treatment has failed to adequately control a patient's disease, or when these therapies are not advisable [5,7]. To explore the cost implications of introducing tralokinumab as a treatment option for adults and adolescents with moderate-to-severe AD in US commercial healthcare plans, we conducted a budget impact analysis which evaluates the change in total treatment costs of biologic and JAKi treatments over a 3-year period when tralokinumab is added to the available treatments.
Materials & methods
Model structure, model perspective, time horizon & cycle length
The model was developed using Microsoft Excel® and takes the perspective of a commercial US healthcare payer to estimate the annual costs of systemic therapy for moderate-to-severe AD under a hypothetical US commercial healthcare plan. A 3-year time horizon was used for the model, with a baseline year defined at model start and total annual costs projected for the following 3 years. Each model year comprised 13 cycles, each 28 days in length. Patients were assumed to enter the model at a constant rate in each cycle of the model, based on the number of new patients anticipated to start systemic treatment in that year. Patients were followed up until the end of year 3 in the model, irrespective of when patients actually began treatment (e.g., the last cohort beginning therapy in the budget impact model [BIM] is followed for only 28 days [1 cycle]).
Budgetary impact was estimated by comparing two alternative scenarios of care – in one scenario, dupilumab (Dupixent®), lebrikizumab (Ebglyss®), nemolizumab (Nemluvio®), abrocitinib (Cibinqo®) and upadacitinib (Rinvoq®) were assumed to be the only available treatment options for adult and adolescent patients with moderate-to-severe AD refractory to prescription topical therapy (‘no tralokinumab’). In the alternative scenario, tralokinumab (Adbry®) is assumed to be an additional treatment option available to these patients (‘including tralokinumab’). Supplementary Figure 1 presents an overview of the modelling approach.
Model population
The model population comprised of adults aged ≥18 years and adolescents aged 12–17 years enrolled in a hypothetical US commercial healthcare plan with a total of 1 million members. Data from an IQVIA Longitudinal Prescription and Medical Claims report, as well as US Census data were used to determine the proportion of adult and adolescent patients that comprise the eligible patient population of the model [33,34]. In the baseline year of the model, 256 adult and 71 adolescent patients (total 327) were estimated to be receiving systemic therapy for moderate-to-severe AD. The annual growth in the number of patients eligible for treatment was 25.8% for adults and 26.2% for adolescents based on trends observed in the aforementioned IQVIA longitudinal dataset [34]. A summary of the inputs used to characterize the model population is presented in Supplementary Table 1 with a breakdown of the eligible patient population calculations provided in Table 1 below.
| Model population inputs | Adults | Adolescents | Ref. | |
|---|---|---|---|---|
| Total plan membership | 1,000,000 | |||
| Estimated plan membership (adults and adolescents) | 776,000 (77.6%) | 78,000 (7.8%) | [33] | |
| Persons with moderate-to-severe AD receiving systemic therapy, % | 256 (0.033%) | 71 (0.091%) | [34] | |
| Annual growth in number of patients with moderate-to-severe AD receiving systemic therapy, % | Year 1 | 66 (25.8%) | 19 (26.2%) | [34] |
| Year 2 | 83 (25.8%) | 23 (26.2%) | ||
| Year 3 | 105 (25.8%) | 30 (26.2%) | ||
| Total cumulative plan membership at end of year 3 | 510 | 143 | ||
| Total cumulative plan membership at end of year 3 (combined) | 653 | |||
Patient counts rounded to the nearest integer.
Intervention
Tralokinumab was included as a treatment option for both adult and adolescent populations in line with its FDA label [28]. Upon initiation of tralokinumab treatment, all patients received a one-time loading dose (600 mg in adults and 300 mg in adolescents) [28]. Thereafter, dosing options for adults include 300 mg Q2W (every 2 weeks) and 300 mg Q4W (every 4 weeks) administered via pre-filled syringe or autoinjector; dosing for adolescents is limited to 150 mg Q2W administered via pre-filled syringe only (Supplementary Table 2).
Comparators
The BIM included both biologics and JAKis as comparators, including dupilumab, lebrikizumab, nemolizumab, abrocitinib and upadacitinib. These systemic treatments are all recommended for the treatment of moderate-to-severe AD as part of the Journal of the American Academy of Dermatologists clinical guidelines [17,35] and are approved as therapy options for both adult and adolescent populations, as per their respective FDA labels [27,29–32]. The dosing of these treatments in the BIM is aligned to their FDA prescribing information (Supplementary Table 2). Recommended dosing for adolescents receiving dupilumab, lebrikizumab and upadacitinib is dependent upon body weight and therefore the average weight of an adolescent patient in the model is assumed to be 59.0 kg based on data from the EZCTRA 6 clinical trial [5,27,29–32].
Concomitant use of topical corticosteroids
Tralokinumab and lebrikizumab can be given in monotherapy or in combination with TCS [28–30]. To align with the clinical data used to inform switching between dosing regimens for these treatments (Table 4) and to ensure these treatments were modeled consistently, both treatments were assumed to be given in combination with TCS. Dupilumab can also be given with or without TCS [27], however, this has no impact on modelling assumptions given no TCS costs are applied and no clinical data for dupilumab are used to inform the model. Nemolizumab can only be given in combination with TCS [30].
Treatment market shares & treatment switching
The distribution of patients by treatment at model start, as well as those beginning treatment in each year of the model, was informed by forecasting data for market shares of the relevant treatments (Table 2) [36].
| Treatment | Patients already receiving systemic therapy | Patients initiating systemic therapy | Patients already receiving systemic therapy | Patients initiating systemic therapy | Ref. | ||||
|---|---|---|---|---|---|---|---|---|---|
| ‘Incl. tralokinumab’ scenario | ‘No tralokinumab’ scenario† | [36] | |||||||
| Model start | Year 1 | Year 2 | Year 3 | Model start | Year 1 | Year 2 | Year 3 | ||
| Dupilumab | 88.9% | 69.7% | 67.7% | 66.6% | 92.4% | 73.4% | 70.6% | 69.2% | |
| Tralokinumab | 3.8% | 5.1% | 4.1% | 3.8% | 0.0% | 0.0% | 0.0% | 0.0% | |
| Abrocitinib | 0.7% | 3.3% | 3.6% | 3.9% | 0.7% | 3.5% | 3.8% | 4.1% | |
| Upadacitinib | 6.5% | 11.4% | 12.0% | 12.8% | 6.8% | 12.0% | 12.5% | 13.3% | |
| Lebrikizumab | 0.1% | 7.6% | 9.0% | 9.2% | 0.1% | 8.0% | 9.4% | 9.6% | |
| Nemolizumab | 0.0% | 2.9% | 3.6% | 3.7% | 0.0% | 3.1% | 3.8% | 3.8% | |
†
In the ‘no tralokinumab’ scenario, the market share of tralokinumab is manually set to 0.0% and tralokinumab’s market share is redistributed proportionally to remaining treatments based on their relative market shares.
A split of adult patients receiving tralokinumab via pre-filled syringe or autoinjector was assumed in each year with the proportion of patients receiving administration via autoinjector increasing each year. This was assumed based on the added convenience of the autoinjector, as well as the high proportion of the general population with a phobia of needles that would likely prefer the autoinjector over the pre-filled syringe [37]. The costs of the pre-filled syringe and autoinjector were the same, however, and therefore this split did not impact total expenditures [38].
Given dupilumab has been marketed for considerably longer than other treatments, sufficient data were only available to characterize treatment switching from dupilumab to other systemic therapies. Patients receiving dupilumab were able to switch in any cycle, in any year of the model to any other treatment. These switching rates were informed using forecasting models (Table 3) [36]. Additionally, JAKi therapies such as abrocitinib and upadacitinib are only indicated for patients who have already received biologic treatment and have not achieved sufficient disease control [31,32]. Therefore, it was not appropriate to model switching from these treatments to biologic therapies.
| Treatment | Year 1 | Year 2 | Year 3 | Ref. |
|---|---|---|---|---|
| Patients receiving dupilumab switching to: | [36] | |||
| Tralokinumab | 3.7% | 3.7% | 5.0% | |
| Abrocitinib | 1.0% | 1.0% | 0.5% | |
| Upadacitinib | 5.4% | 5.4% | 5.4% | |
| Lebrikizumab | 0.0% | 0.0% | 0.0% | |
| Nemolizumab | 0.0% | 0.0% | 0.0% | |
Eligibility for alternative dosing regimens
As per the FDA labels for tralokinumab, lebrikizumab and nemolizumab, patients who achieve clear or almost clear skin may be eligible to reduce the frequency of treatment administration (e.g., Q2W → Q4W) [28–30]. Only adult patients are eligible for tralokinumab Q4W and patients must weigh less than 100 kg (84.1% of adult patients are assumed to weigh less than 100 kg in the model – see Table 4) [28,39]. In Phase III clinical trials of the respective treatments, the proportion of patients achieving either 75% improvement in the Eczema Area and Severity Index (EASI-75) or Investigator’s Global Assessment (IGA) score of 0/1 (with ≥2 unit improvement from baseline for lebrikizumab and nemolizumab) was used as a proxy for achieving clear or almost clear skin. These data were used to inform the percentage of patients who would switch to less frequent dosing regimens in the model [4,6–10].
| Eligibility for tralokinumab Q4W maintenance therapy† | Value | Ref. | |
|---|---|---|---|
| Patients achieving clear or almost clear skin, % | EASI-75 | IGA 0/1 | |
| At 16 weeks§ | 56.0% | 38.9% | [7] |
| At 32 weeks§ (in patients who did not respond at 16 weeks) | 55.8% | 30.5% | [7] |
| Patients with body weight <100 kg, %‡ | 84.1% | [39] | |
| Proportion of patients receiving Q4W in model: | |||
| 16 weeks§ | 47.1% | 32.7% | |
| 32 weeks§ (in addition to those already on Q4W at 16 weeks) | 24.8% | 17.2% | |
| Remain on Q4W after 32 weeks§ (combined total) | 71.9% | 50.0% | |
| Eligibility for lebrikizumab Q4W maintenance therapy | |||
| Patients achieving clear or almost clear skin, % | EASI-75 | IGA 0/1 | |
| Lebrikizumab + TCS | |||
| At 16 weeks§ | 69.5% | 41.2% | [9] |
| At 32 weeks (in patients who did not respond at 16 weeks)§ | Data not available | Data not available | |
| Lebrikizumab monotherapy | |||
| At 16 weeks§ | 55.4% | 38.1% | [10] |
| At 32 weeks§ (in patients who did not respond at 16 weeks) | 64.6% | 28.0% | [4] |
| Proportion of patients receiving Q4W in model: | |||
| Lebrikizumab + TCS | |||
| 16 weeks§ | 69.5% | 41.2% | |
| 32 weeks§ (in addition to those already on Q4W at 16 weeks) | Data not available | Data not available | |
| Remain on Q4W after 32 weeks§ (combined total) | 69.5% | 41.2% | |
| Lebrikizumab monotherapy | |||
| 16 weeks§ | 55.4% | 38.1% | |
| 32 weeks§ (in addition to those already on Q4W at 16 weeks) | 28.8% | 17.3% | |
| Remain on Q4W after 32 weeks§ (combined total) | 84.2% | 55.4% | |
| Eligibility for nemolizumab Q8W maintenance therapy† | |||
| Patients achieving clear or almost clear skin, % | EASI-75 | IGA 0/1 | |
| At 16 weeks§ | 42.9% | 36.6% | [8] |
| At 32 weeks§ (in patients who did not respond at 16 weeks) | Data not available | Data not available | |
| Proportion of patients receiving Q8W in model: | |||
| 16 weeks§ | 42.9% | 36.6% | |
| 32 weeks§ (in addition to those already on Q4W at 16 weeks) | Data not available | Data not available | |
| Remain on Q4W after 32 weeks§ (combined total) | 42.9% | 36.6% | |
| Eligibility for abrocitinib 200 mg therapy | |||
| Patients achieving clear or almost clear skin, % | EASI-75 | IGA 0/1 | |
| At 16 weeks§ | 62.1% | 33.8% | [6] |
| Proportion of patients receiving 200 mg in model | |||
| 16 weeks§ | 37.9% | 66.2% | |
| Remain on Q4W after 16 weeks§ | 37.9% | 66.2% | |
EASI-75: Eczema Area and Severity Index (75% improvement); IGA: Investigator’s Global Assessment; kg: Kilogram; mg: Milligram; Q4W: Every 4 weeks; Q8W: Every 8 weeks; TCS: Topical corticosteroids.
†
Clinical data for tralokinumab + TCS and nemolizumab + TCS used to inform the model.
‡
In addition to achieving clear of almost clear skin, adult patients switching to Q4W tralokinumab treatment must also weigh less than 100 kg as per US FDA prescribing information.
§
Weeks after treatment initiation, n.
For the tralokinumab, lebrikizumab and nemolizumab treatment arms, two opportunities to transition to lower frequency regimens were modeled for patients who achieve clear or almost clear skin: at 16 weeks after treatment initiation and at 32 weeks after treatment initiation (in patients who did not achieve clear skin at week 16). A schematic of the transitions between Q2W and Q4W for tralokinumab is presented in Figure 1. A similar approach was taken to model lebrikizumab Q2W → Q4W switching as well as nemolizumab Q4W → Q8W (every 8 weeks) switching. Trial data were not available for lebrikizumab + TCS or nemolizumab to inform the transition to a less frequent administration regimen at 32 weeks after treatment initiation (in patients who did not achieve clear skin at week 16) in the model (Figure 1). Therefore, the percentage of patients making this transition was set to 0% in the base case for these treatment arms. Data were available for lebrikizumab monotherapy to inform the transition at this timepoint, however, and use of these data was explored in a scenario analysis.
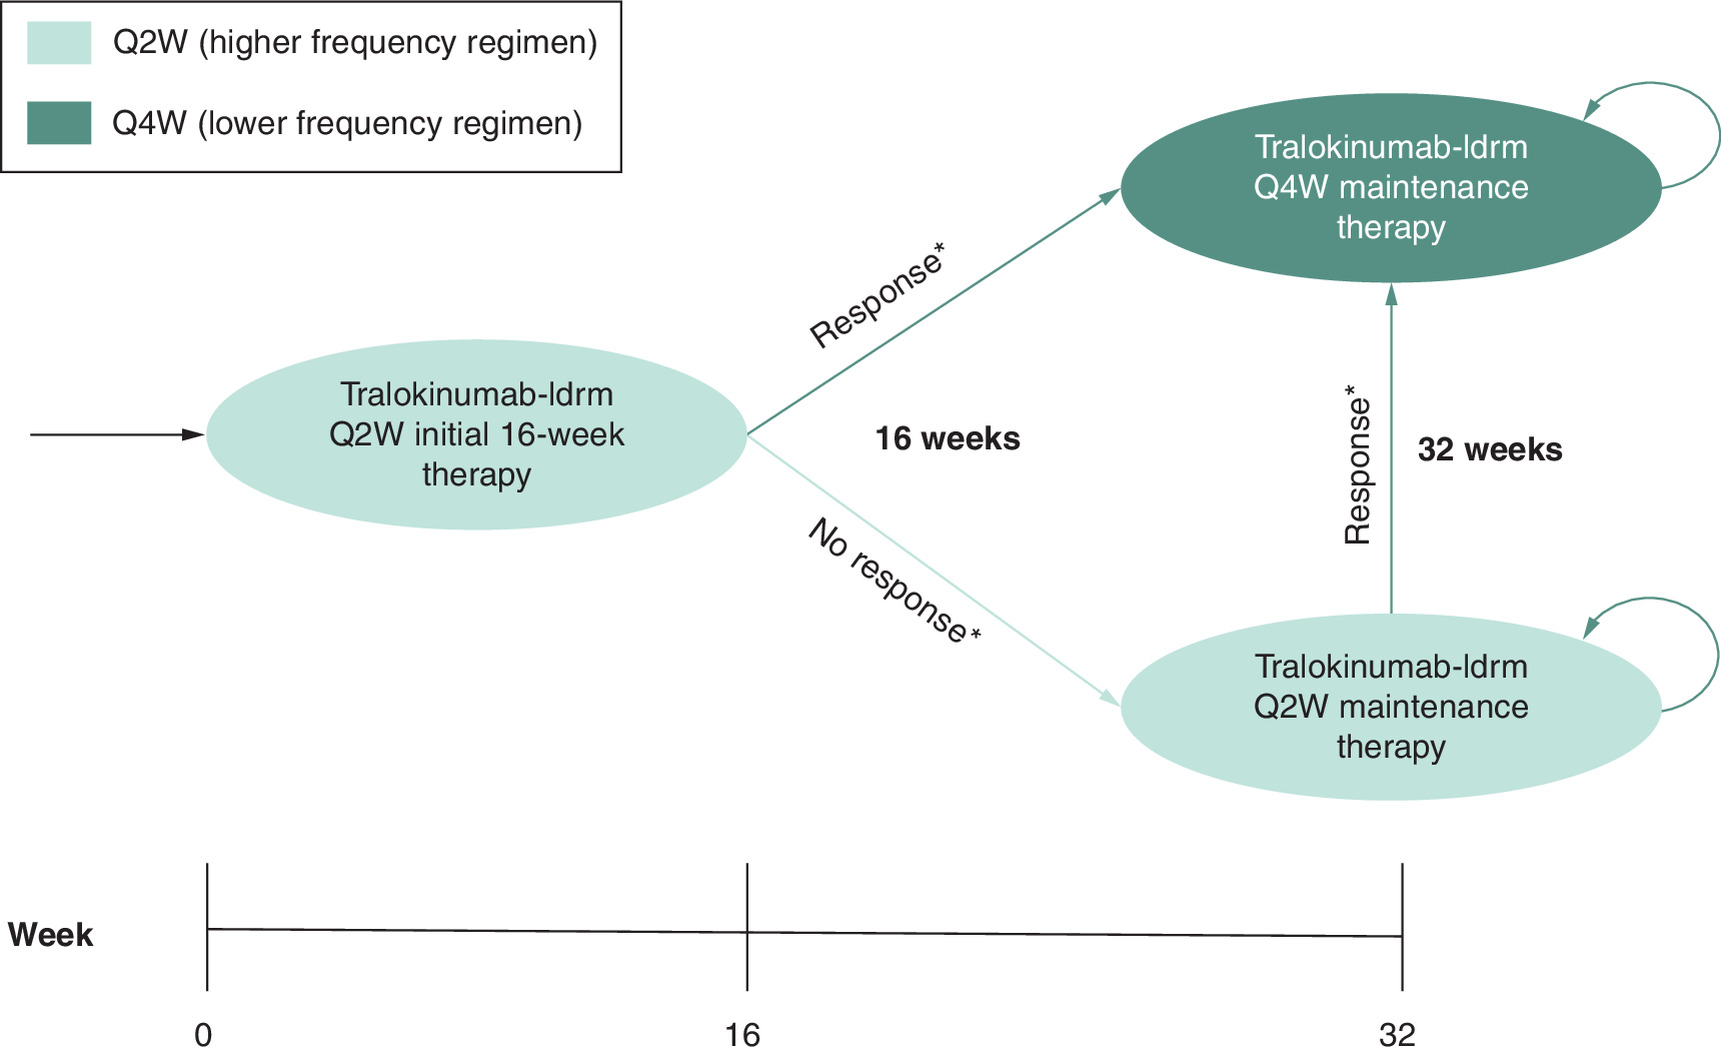
Figure 1. Schematic representation of tralokinumab dose switching (Q2W → Q4W) in model.
Q2W: Once every 2 weeks; Q4W: Once every 4 weeks.
*Clinical response defined as achievement of clear or almost clear skin.
Abrocitinib’s FDA label allows patients who do not achieve clear or almost clear skin to transition from a 100 to a 200 mg dose [32]. However, based on the Micromedex REDBOOK drug costs, the wholesale acquisition cost (WAC) for 100 and 200 mg doses is the same [38] and thus the proportion of patients switching between 100 and 200 mg did not impact total expenditure estimates for abrocitinib.
As per the FDA prescribing information for upadacitinib, patients under the age of 65 who do not achieve an adequate response to the 15 mg daily dose can switch to the 30 mg dose [31]. As this model did not distinguish patients aged over/under 65, it was not possible to implement this dose switching. However, WAC of 15 and 30 mg doses for upadacitinib were shown to be the same [38] and thus this will not have impacted total expenditures.
A summary of the clinical data inputs used in the model, including the calculated estimate for the proportion of patients receiving different dosing regimens is provided in Table 4.
Cost inputs
All treatment acquisition costs (in 2025 US Dollars) were sourced from the Micromedex REDBOOK database [38]. The WAC of treatments were used to calculate a 28-day cycle cost for each treatment in the model (Supplementary Tables 3 & 4). Costs of TCS were assumed to be negligible and therefore no additional costs were applied to treatments assumed to be given in combination with TCS. As any rebates provided by manufacturers to US payers are confidential and unknown, no rebates are applied to treatment costs in this analysis.
AE rates reported for treatments included in this analysis are rare with the most common AEs (≥5% incidence) being mild in nature, such as conjunctivitis, headache, injection site reactions, nausea, nasopharyngitis, upper respiratory tract infections and herpes simplex virus infection [27–32]. Rates of AEs are also similar between treatments with the exception of conjunctivitis which is more commonly associated with biologic treatments [27–32]. However, despite any slight differences in AE rates between some treatments, costs to treat these mild events are expected to be low and therefore differences in these costs between treatment arms would be unlikely to significantly influence results. Additionally, other economic evaluations in AD have shown AE treatment costs to represent a relatively small cost component [40–42], particularly when compared with the high drug costs which are known to comprise the majority of healthcare costs in moderate-to-severe AD [43]. Consequently, the results of these other economic evaluations were largely insensitive to any changes in AE cost inputs [40–42]. Similarly, differences in monitoring costs for treatments in this analysis are assumed to be negligible based on insights from other published budget impact analyses which estimated the additional monitoring costs for JAKis at less than $100 annually per patient on average, accounting for only 0.01% of the overall treatment costs [44]. Therefore, for simplicity, costs associated with AEs and monitoring are not included in this analysis.
All treatments considered in this analysis either comprise an oral formulation or a subcutaneous formulation which can be self-administered by the patient [27–32], therefore no administration costs are included in the model for any treatments.
As is customary for budget impact analyses, costs in future years are not discounted [45].
Outcome measures
The key outcomes calculated by the BIM include the expected number of patients with moderate-to-severe AD receiving systemic therapy over the model horizon, as well as the distribution of patients by treatment across each year of the model. The BIM also reports annual and cumulative expenditures for each scenario of care, by year, per member per year (PMPY), per member per quarter (PMPQ) and per member per month (PMPM). Lastly, cumulative total expenditures at the end of the model horizon are also reported, per patient treated, for each treatment arm.
Base case analysis
For the base case analysis, total expenditures were calculated for the combined adult and adolescent populations, the IGA-based definition of skin clearance was used to inform switching to alternative dosing regimens (Table 4) and efficacy data for lebrikizumab + TCS were used.
Scenario analyses
Three additional scenario analyses were conducted to test the robustness of the analysis:
•
Scenario 1. No treatment switching and equal market shares for all treatments
•
Scenario 2. EASI-75 data used to inform switching to different dosing regimens
•
Scenario 3. Clinical trial data for lebrikizumab monotherapy used to inform the transitions between Q2W and Q4W in the lebrikizumab arm.
Scenario 1 assumed equal market shares for all 6 included treatments (5 in the scenario of care where tralokinumab is not available) and did not allow for treatment switching in order to ensure the same number of patients receive all treatments, for the same treatment duration. This allowed per patient treatment costs to be estimated that fully accounted for the loading doses, monthly treatment costs and alternative dosing regimens of each treatment, which can be directly compared between treatment arms.
Scenario 2 utilizes EASI-75 data from clinical trials to inform the proportion of patients achieving clear or almost clear skin and transitioning to alternative, lower frequency dosing regimens for tralokinumab, abrocitinib, lebrikizumab and nemolizumab treatment arms. This scenario was used to explore any differences in the proportion of patients assumed to be receiving alternative dosing regimens, arising as a result of applying a different, but common alternative definition of clinical response.
Lastly, Scenario 3 utilizes clinical data for lebrikizumab monotherapy, as opposed to data for lebrikizumab + TCS which are used for the base case, in order to inform the proportion of patients transitioning to Q4W lebrikizumab at 32 weeks after initiation (see ‘Eligibility for alternative dosing regimens’), something which could not be informed by clinical data for lebrikizumab + TCS.
Results
Base case analysis
The model population included 776,000 patients aged ≥18 years and 78,000 patients aged 12–17 years. Approximately 327 patients were estimated to be receiving systemic therapy at the beginning of year 1, with 85 patients beginning treatment within that year. In year 2, 107 patients initiated systemic therapy and in year 3, 134 patients initiated therapy, for a total patient count of 653 at the end of the 3 years (Table 5). A full breakdown of the distribution of patient counts by treatment, scenario of care and year is presented in Supplementary Table 5, including proportions of patients continuing treatment from previous years, initiating treatment and switching from other treatments in the model in each year.
| Treatment | Patients already receiving systemic therapy | Patients initiating systemic therapy | Patients already receiving systemic therapy | Patients initiating systemic therapy | ||||
|---|---|---|---|---|---|---|---|---|
| ‘Incl. tralokinumab’ scenario | ‘No tralokinumab’ scenario | |||||||
| Model start | Year 1 | Year 2 | Year 3 | Model start | Year 1 | Year 2 | Year 3 | |
| Dupilumab | 291 | 321 | 361 | 414 | 302 | 334 | 376 | 431 |
| Tralokinumab | 12 | 27 | 44 | 62 | 0 | 0 | 0 | 0 |
| Abrocitinib | 2 | 8 | 15 | 24 | 2 | 10 | 19 | 30 |
| Upadacitinib | 21 | 46 | 76 | 113 | 22 | 58 | 99 | 149 |
| Lebrikizumab | 0 | 7 | 16 | 29 | 0 | 7 | 17 | 30 |
| Nemolizumab | 0 | 2 | 6 | 11 | 0 | 3 | 7 | 12 |
Patient counts are rounded to the nearest integer and therefore total patient counts may seemingly differ between scenarios by approximately 1 patient.
The expected total cost of AD systemic therapies in each year and scenario of care are presented in Table 6 below.
| Year 1 | Year 2 | Year 3 | |||||||
|---|---|---|---|---|---|---|---|---|---|
| No tralokinumab | Including tralokinumab | Difference | No tralokinumab | Including tralokinumab | Difference | No tralokinumab | Including tralokinumab | Difference | |
| Total annual expenditures | |||||||||
| Dupilumab | $16,639,102 | $15,983,323 | -$655,779 | $18,441,929 | $17,696,691 | -$745,238 | $20,846,535 | $20,009,655 | -$836,880 |
| Abrocitinib | $472,793 | $385,600 | -$87,193 | $1,102,694 | $854,920 | -$247,774 | $1,866,875 | $1,438,768 | -$428,107 |
| Upadacitinib | $3,478,195 | $2,908,690 | -$569,505 | $6,874,767 | $5,310,242 | -$1,564,525 | $10,875,215 | $8,196,289 | -$2,678,926 |
| Lebrikizumab | $370,363 | $351,794 | -$18,569 | $1,029,550 | $982,448 | -$47,102 | $1,898,765 | $1,818,024 | -$80,741 |
| Nemolizumab | $80,797 | $76,676 | -$4,121 | $242,493 | $231,371 | -$11,122 | $459,406 | $439,881 | -$19,525 |
| Tralokinumab | – | $857,989 | $857,989 | – | $1,505,093 | $1,505,093 | – | $2,215,241 | $2,215,241 |
| Total | $21,041,250 | $20,564,072 | -$477,178 | $27,691,433 | $26,580,765 | -$1,110,668 | $35,946,796 | $34,117,858 | -$1,828,938 |
| Total expenditures per member (1 million total members) | |||||||||
| Per month | $1.75 | $1.71 | -$0.04 | $2.31 | $2.22 | -$0.09 | $3.00 | $2.84 | -$0.15 |
| Per quarter | $5.26 | $5.03 | -$0.23 | $6.92 | $6.65 | -$0.28 | $8.99 | $8.53 | -$0.46 |
| Per year | $21.04 | $20.56 | -$0.48 | $27.69 | $26.58 | -$1.11 | $35.95 | $34.12 | -$1.83 |
Annual budgetary impact of tralokinumab in bold.
In all years, total expenditures were higher under the ‘no tralokinumab’ scenario of care versus the ‘including tralokinumab’ scenario of care; total expenditures were estimated to total $21.0 million versus $20.6 million in year 1 (Δ-0.4 million), $27.7 million versus $26.6 million in year 2 (Δ-1.1 million) and $35.9 million versus $34.1 million in year 3 (Δ-1.8 million), respectively. Of this total expenditure, approximately 79% of total treatment costs are contributed by the adult population across all years, with costs in the adolescent population contributing the remaining 21%. A full summary of the total expenditures for the adult and adolescent populations by treatment and by scenario of care is presented in the appendix (Supplementary Tables 6 & 7). In the scenario of care where tralokinumab is available, total overall expenditures were estimated to decline by approximately $0.5 million, $1.1 million and $1.8 million in year 1, year 2 and year 3, respectively compared with the ‘no tralokinumab’ scenario of care. A similar trend can be seen in estimates of expenditures on a PMPM, PMPQ and PMPY basis, with increasing cost savings observed over time (Table 6). Cumulative per member total expenditures at year 3 were $84.68 for the ‘no tralokinumab’ scenario of care, reducing to $81.26 in the ‘including tralokinumab’ scenario of care. The cumulative cost savings that arise from the use of tralokinumab over the 3 years of the model were calculated to be $3.4 million (Table 6 & Figure 2).
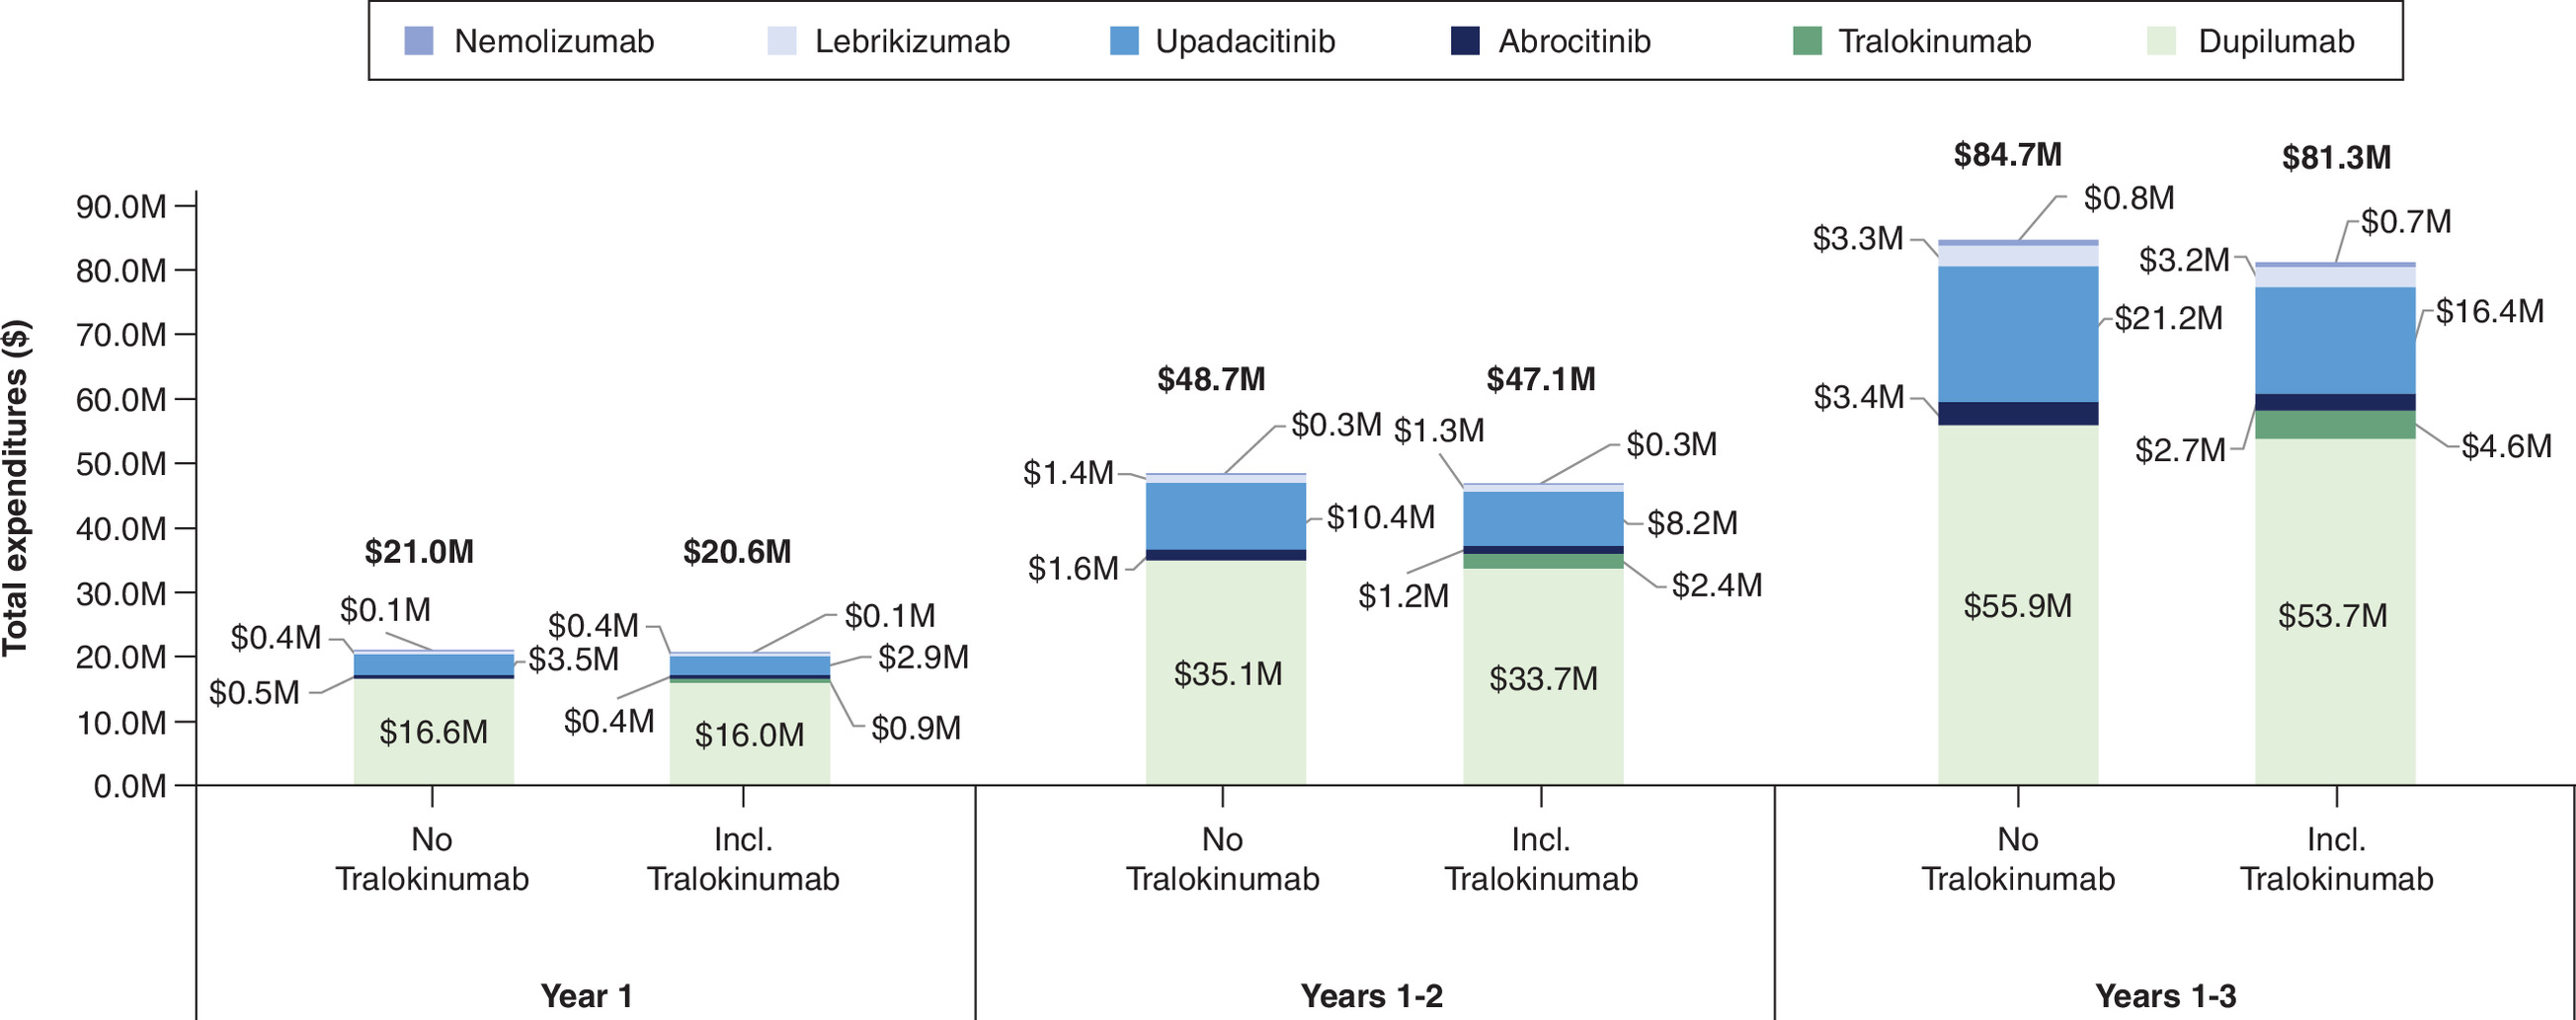
Figure 2. Expected total cumulative expenditures, by year and scenario of care.
Total cumulative expenditure per scenario of care is highlighted in bold above each column.
With an estimated 653 total patients receiving systemic treatment over the 3 years and considering the overall cumulative total expenditures, the cumulative cost per patient treated at year 3 in the ‘no tralokinumab’ scenario of care was $129,794 and reduced to $124,556 when tralokinumab was available.
Additional scenario analyses
No treatment switching & equal market shares assumed for all treatments
To estimate a cost per patient treated while assuming the same treatment duration for all treatments, treatment switching was disabled and equal market shares for all treatments were assumed at all timepoints in the model. At the end of the 3-year period, a cumulative total of 109 patients were estimated to have received each of the 6 treatments. Total overall cumulative expenditures in the ‘no tralokinumab’ scenario of care were $93.1 million and reduced to $86.7 million (Δ-$6.4 million) when tralokinumab was available. The cumulative cost per member at the end of year 3 in this scenario analysis decreased from $93.66 in the ‘no tralokinumab’ scenario of care to $87.19 in the ‘including tralokinumab’ scenario of care. For the ‘including tralokinumab’ scenario of care, at year 3, the cumulative costs per patient treated were $114,957 for dupilumab, $155,700 for abrocitinib, $179,787 for upadacitinib, $161,984 for lebrikizumab, $102,445 for nemolizumab and $84,133 for tralokinumab. This demonstrates that when accounting for loading dose costs, monthly treatment costs and alternative dosing regimens, the cost per patient treated was considerably lower for tralokinumab compared with all other treatments.
EASI-75
When EASI-75 data from clinical trials were used to inform the proportion of patients receiving lower frequency dosing regimens in the tralokinumab, lebrikizumab and nemolizumab arms and different doses in the abrocitinib arm, total annual expenditures remained comparable to the base case. The cumulative cost saving due to tralokinumab introduction in this scenario does; however, increase to $3.8 million, $0.4 million higher than the base case analysis.
Lebrikizumab monotherapy data
Using IGA efficacy data for lebrikizumab monotherapy to inform the switching to Q4W in the lebrikizumab arm of the model allows additional patients to switch to Q4W lebrikizumab 32 weeks after treatment initiation (Table 4) and results in similar total expenditures in each year of the model compared with the base case. Cumulative total expenditure in the lebrikizumab arm in the ‘no tralokinumab’ scenario of care was reduced by approximately 4.1% compared with the base case. Cumulative cost savings due to the introduction of tralokinumab remained unchanged in this scenario analysis relative to the base case, at $3.4 million.
Discussion
Clinical evidence has shown tralokinumab to be a highly effective treatment for moderate-to-severe AD that relieves symptoms and reduces health burden in both adults and adolescents [5,7]. Findings from this analysis demonstrate tralokinumab’s potential as a cost-saving intervention, which can also help to address the high economic burden of AD. The cumulative cost savings estimated in this analysis arising from the inclusion of tralokinumab as a treatment option in a hypothetical commercial US healthcare plan were considerable at $3.4 million, or $3.4 per member, over 3 years; a 4.0% reduction in the cumulative overall treatment costs. As the moderate-to-severe patient population in the US has been estimated at over 2 million patients [46], these cost-savings could be numerically greater, even doubled in the real-world, and even greater if the uptake of tralokinumab increases.
Tralokinumab’s cost savings were largely driven by competitive skin clearance rates and flexible dosing options (i.e., the option to transition from tralokinumab Q2W to Q4W among adults), as well as the low monthly treatment costs of tralokinumab versus other treatments. Specifically, tralokinumab Q2W's monthly treatment costs are lower than abrocitinib, upadacitinib, lebrikizumab (Q2W and Q4W) and nemolizumab (Q4W only). The monthly treatment costs of tralokinumab Q4W are lower than all other comparators in the model including dupilumab. Tralokinumab’s loading dose ($4,069 per patient), the initial dose required in the first cycle for patients initiating treatment, is also much less expensive compared with loading doses for novel high-cost treatments such as lebrikizumab ($14,000 per patient) and nemolizumab ($8,480 per patient) which drives further cost savings (Supplementary Tables 3 & 4) [38].
Real-world data on the use of alternative dosing regimens for biologics (e.g., Q2W vs Q4W) in AD are scarce, however, data for tralokinumab indicate that approximately 30% of patients receive the Q4W regimen in US clinical practice [47]. Though lower than the 50% estimated by the BIM using clinical trial data (Table 4), assuming a 30% rate of Q4W tralokinumab use would only be expected to reduce total cost savings by approximately 12% ($0.4 million). This suggests that the estimated cost savings for tralokinumab are robust and are likely reflective of potential cost savings in US clinical practice. Depending on real-world proportions of patient receiving Q4W, estimated cost savings attributable to tralokinumab could vary between $2.5 million (0% Q4W use assumed) and $4.2 million (100% patients switching to Q4W 16 weeks after treatment initiation).
A 2025 comparative analysis of dupilumab and tralokinumab concluded that Q4W tralokinumab had up to $24,000 lower annual treatment costs per patient compared with dupilumab, which broadly aligns with the findings presented here in terms of relative treatment costs [48]. With 220 patients assumed to receive dupilumab, and a scenario in which half (i.e., 110 patients) switch to tralokinumab, with 5% of those patients (i.e., around 6 patients) receiving Q4W treatment, researchers estimated a cost saving of $220k over the first 2 years after the switch [48]. Based on clinical trial data (Table 4), and other RWE [47], a 5% proportion of patients receiving Q4W tralokinumab appears to be a conservative assumption, however. Actual rates of Q4W use could be between 30 and 50%, meaning cost savings could be 6–10x higher than the $220k estimated previously (our base case suggests $1.6 M cumulative cost saving after 2 years attributable to tralokinumab use, including savings attributable to tralokinumab Q4W) [7,39,47,48].
The Institute for Clinical and Economic Review (ICER) previously conducted a budget impact analysis which established tralokinumab as an attractive treatment option in moderate-to-severe AD with low budgetary impact compared with other biologics and JAKis [46]. However, ICER’s analysis considered a wider population, as we consider patients eligible for tralokinumab only. Therefore, patients in this analysis were assumed to receive systemic treatments only, in contrast to ICER’s analysis whereby patients receiving ‘SOC’ comprised 10% receiving dupilumab and 90% receiving generic SOC therapies, including topical treatments. Additionally, our analysis utilized the latest drug costs (ICER's earlier analysis used some placeholder costs), an updated treatment landscape including lebrikizumab and nemolizumab but excluding baricitinib (not indicated for AD treatment in the US) [49] and included the latest FDA recommendations relating to alternative dosing regimens for abrocitinib, lebrikizumab, nemolizumab and tralokinumab [28–30,32]. Consequently, due to these differences in modelling approach, the findings of this analysis show tralokinumab to be cost saving with the overall cumulative costs per patient treated at the end of year 3 being approximately $5,000 lower when tralokinumab is available. This differs from ICER’s findings, which showed tralokinumab (and all other treatments) to be cost increasing in terms of cumulative net cost per patient treated when compared with ‘SOC’ [46]. This demonstrates the importance of our analysis which more specifically evaluates tralokinumab’s budget impact in the context of its FDA-indicated patient population, accounting for the latest FDA prescribing information and drug cost information, which allows the cost saving potential of tralokinumab to be recognized.
Limitations
While every effort was made to ensure the modelling approach taken was robust, some limitations still remain and should be noted when considering the findings of this analysis.
Treatment uptake and treatment switching in the model were based on forecasted data and total expenditure estimates are highly dependent on these inputs. Therefore, to the extent that uptake and switching rates for treatments may have been over or underestimated, the total expenditures may have similarly been over or underestimated. However, the forecasting data used were based on past and current market trends and are thus expected to be reflective of future trends regarding treatment uptake. Additionally, the cumulative per patient treatment costs generated in scenario analysis 1 should also allow some inferences to be made regarding how total expenditures may be impacted should real-world market shares and treatment switching rates differ from our assumed values.
The rates of switching between dosing regimens for treatments such as tralokinumab, lebrikizumab and nemolizumab were informed using data for EASI-75 and IGA outcomes. In clinical practice, however, it is suspected that relatively few dermatologists use standardized scoring systems to inform their therapeutic decision making. Therefore, the number of patients who are offered the option to switch to the lower frequency regimens in clinical practice is uncertain.
Due to a lack of available data, only switching from dupilumab could be modeled, which impacted on the distribution of patients by treatment in each year. Without further data describing switching rates from tralokinumab, abrocitinib, upadacitinib, lebrikizumab and nemolizumab in the real-world, the extent to which this may have impacted results is unknown. It should be noted that tralokinumab has been shown to have a lower cost per patient treated than all other treatments in the model, however, and a higher or lower proportion of patients receiving tralokinumab would lead to higher or lower cost savings, respectively. Given that JAKi treatments are indicated for use after biologics, a scenario analysis was considered whereby rates of switching from tralokinumab to upadacitinib and abrocitinib were assumed to be equivalent to rates from dupilumab to these treatments, in order to explore any impact on tralokinumab treatment costs. However, based on clinical and real-world evidence, as well as clinical expert input, it is assumed patients switching from dupilumab commonly do so as a result of the wide range of severe ocular-related AEs which have been reported under treatment with dupilumab and which carry a risk of blindness, such as keratitis, limbitis, uveitis, cornea perforation and retina ablation [27,50]. As these AEs have not been reported under treatment with tralokinumab [28,51], to apply similar treatment switching rates would likely overestimate treatment switching from tralokinumab. Consequently, lack of evidence describing switching rates from tralokinumab and other treatments remains a limitation of this analysis and further studies are encouraged to estimate these switching rates, as well as explore how applying them to this analysis would impact the budget impact of tralokinumab.
As noted in the Cost Inputs section, while drug costs inputs were informed directly by WAC pricing information, confidential manufacturer rebates can be provided to payers which could reduce treatment acquisition costs and impact total expenditures. However, as the size of these rebates is unknown and they differ between treatments, it is not possible to assume rebates or otherwise explore uncertainty associated with rebates in this analysis. Therefore, the inability to account for potential rebates that may be applied in the real world remains a limitation of the analysis.
Total expenditures, as estimated in this analysis, focus entirely on treatment acquisition costs given that research has shown these costs make up the large majority of direct healthcare costs associated with moderate-to-severe AD treatment [43]. However, additional costs may also be relevant such as costs associated with treatment of AEs and additional monitoring costs for treatments such as JAKi. AE costs were not included in this analysis given that AEs reported in clinical trials for modeled treatments have been shown to be rare, mild and reported at similar rates for all treatments, for most AEs. Additionally, AE costs and monitoring costs are likely to be relatively small when compared with treatment acquisition costs, to the extent they would be inconsequential to the results of the analysis and therefore, any differences in these costs for modeled treatments were assumed to be negligible. However, if included, these costs could impact total expenditures in a minor way.
Lastly, data to inform the 32-week transition from ‘higher’ frequency regimen to the ‘lower’ frequency regimen were not available for the lebrikizumab (+TCS) or nemolizumab arms and thus the probability of this transition in the model was set to 0% in the base case. This may have underestimated the proportion of patients receiving the Q4W/Q8W dosing regimens and thus have overestimated the total treatment costs for these treatment arms. However, given the low estimated market shares for these treatments in this analysis, this limitation would be expected to have a limited impact on overall total expenditures and budget impact results.
Conclusion
Tralokinumab is a cost-saving therapy when used for the treatment of moderate-to-severe AD in both adult and adolescent populations. Inclusion of tralokinumab as a treatment option in US commercial healthcare plans could lead to considerable cost savings, dependent on treatment uptake and rates of Q4W use in clinical practice. These savings could help to control the ever-increasing treatment costs of AD, and commercial Payers in the US should consider including tralokinumab as a treatment option in their healthcare plans.
Summary points
•
Atopic dermatitis (AD) is a chronic and burdensome condition that causes intense itching and painful skin lesions and affects around 10% of adults and adolescents across the US.
•
Potent systemic treatments, such as tralokinumab, are needed to treat patients with moderate-to-severe disease who have experienced inadequate symptom control using topical therapies.
•
This study evaluated the cost implications of providing tralokinumab as an available treatment option in commercial healthcare plans, from the perspective of a US commercial healthcare payer.
•
The budget impact model developed for the analysis project total expenditures for a 3-year time horizon and included treatment costs for biologics and Janus Kinase inhibitor therapies.
•
Costs were estimated and compared for two scenarios of care: one in which dupilumab, lebrikizumab, nemolizumab, abrocitinib and upadacitinib are assumed to be the only treatments available, and one in which tralokinumab is assumed to be an additional option. The differences in total costs between the two scenarios of care was then considered the budget impact associated with tralokinumab use.
•
Dosing for all treatments was aligned to FDA prescribing information and adult patients receiving tralokinumab and adults or adolescents receiving lebrikizumab and nemolizumab could switch to a lower frequency administration schedule if they achieved clear or almost clear skin, reducing the number of doses received and consequently the treatment costs.
•
Total costs when tralokinumab was not available were estimated to be $21.0 million (M), $27.7 M and $35.9 M in years 1–3, respectively. When tralokinumab was available, estimates were $20.6 M (Δ-0.5 M) in year 1, $26.6 M (Δ-1.1 M) in year 2 and $34.1 M (Δ-1.8 M) in year 3. Therefore, availability of tralokinumab led to cumulative cost savings of $3.4 M across all 3 years ($2.3 M in adults and $1.1 M in adolescents).
•
Cumulative treatment costs per plan member at year 3 also reduced from $84.68 to $81.26 (Δ-3.42) due to tralokinumab. Lastly, cumulative per patient treatment costs across the 653 patients estimated to receive systematic therapy over the 3 years were reduced from $129,794 to $124,556 when tralokinumab was available.
•
The results of this analysis demonstrate the cost-saving potential of tralokinumab, driven by competitive skin clearance rates, low monthly treatment costs and the option to transition to a less frequent dosing regimen in adults after skin clearance is achieved. These cost savings are highly relevant for payers and can help to manage the ever-increasing costs associated with the treatment of moderate-to-severe AD.
Financial disclosure
LEO Pharma provided funding for this study. LEO Pharma employees provided the study objective and input during the study design process but had no influence upon study execution. LEO Pharma, Inc. (NJ, USA).
Competing interests disclosure
A Bin Sawad, S Balu and S Schneider are all employees of LEO Pharma. R Grindley and L Houde are employees of Avalere Health, a private consultancy contracted by LEO Pharma to conduct this study. The authors have no other competing interests or relevant affiliations with any organization or entity with the subject matter or materials discussed in the manuscript apart from those disclosed.
Writing disclosure
No funded writing assistance was utilized in the production of this manuscript.
Open access
This work is licensed under the Attribution-NonCommercial-NoDerivatives 4.0 Unported License. To view a copy of this license, visit https://creativecommons.org/licenses/by-nc-nd/4.0/
Supplementary Material
References
Papers of special note have been highlighted as: • of interest; •• of considerable interest
1.
Weidinger S, Beck LA, Bieber T, Kabashima K, Irvine AD. Atopic dermatitis. Nature Rev. Dis. Prim. 4(1), 1 (2018).
2.
Silverberg JI, Hanifin JM. Adult eczema prevalence and associations with asthma and other health and demographic factors: a US population-based study. J. Allergy Clin. Immunol. 132(5), 1132–1138 (2013).
3.
Cheng A, Wan J, Chen SC, Yeung H. Atopic dermatitis and bullying among US adolescents. JAMA Dermatol. 159(12), 1395–1397 (2023).
4.
Guttman-Yassky E, Rosmarin D, de Bruin-Weller M et al. The efficacy of longer-term lebrikizumab treatment in patients with moderate-to-severe atopic dermatitis who did not meet protocol-defined response criteria at week 16 in 2 randomized controlled clinical trials. J. Am. Acad. Dermatol. 92(5), 1024–1031 (2025).
5.
Paller AS, Flohr C, Cork M et al. Efficacy and safety of tralokinumab in adolescents with moderate to severe atopic dermatitis: the Phase III ECZTRA 6 randomized clinical trial. JAMA Dermatol. 159(6), 596–605 (2023).
• Clinical trial evidence from the pivotal ECZTRA 3 trial for tralokinumab, conducted in adolescents.
6.
Reich K, Silverberg JI, Papp KA et al. Abrocitinib efficacy and safety in patients with moderate-to-severe atopic dermatitis: results from Phase III studies, including the long-term extension JADE EXTEND study. J. Eur. Acad. Dermatol. Venereol. 37(10), 2056–2066 (2023).
7.
Silverberg JI, Toth D, Bieber T et al. Tralokinumab plus topical corticosteroids for the treatment of moderate-to-severe atopic dermatitis: results from the double-blind, randomized, multicentre, placebo-controlled Phase III ECZTRA III trial. Br. J. Dermatol. 184(3), 450–463 (2021).
• Clinical trial evidence from the pivotal ECZTRA 6 trial for tralokinumab, conducted in adults.
8.
Silverberg JI, Wollenberg A, Reich A et al. Nemolizumab with concomitant topical therapy in adolescents and adults with moderate-to-severe atopic dermatitis (ARCADIA 1 and ARCADIA 2): results from two replicate, double-blind, randomised controlled Phase III trials. Lancet 404(10451), 445–460 (2024).
9.
Simpson EL, Gooderham M, Wollenberg A et al. Efficacy and safety of lebrikizumab in combination with topical corticosteroids in adolescents and adults with moderate-to-severe atopic dermatitis: a randomized clinical trial (ADhere). JAMA Dermatol. 159(2), 182–191 (2023).
10.
Warren RB, Silverberg JI, Guttman-Yassky E et al. P84 Efficacy and safety of lebrikizumab at 16 weeks: pooled analyses from ADvocate1 and ADvocate2 Phase III trials in patients with moderate-to-severe atopic dermatitis. Brit. J. Dermatol. 188(Suppl. 4), ljad113.112 (2023).
11.
Laughter MR, Maymone MBC, Mashayekhi S et al. The global burden of atopic dermatitis: lessons from the Global Burden of Disease Study 1990–2017. Br. J. Dermatol. 184(2), 304–309 (2021).
12.
Fasseeh AN, Elezbawy B, Korra N et al. Burden of atopic dermatitis in adults and adolescents: a systematic literature review. Dermatol. Ther. (Heidelb.) 12(12), 2653–2668 (2022).
•• Systematic review reporting the many dimensions to the burden of atopic dermatitis (AD) and describing the magnitude and debilitating nature of the symptoms.
13.
Adamson AS. The economic impact of atopic dermatitis. In: Management of Atopic Dermatitis: Methods and Challenges. Feldman SR, Strowd LC, Lovell KK (Eds). Springer International Publishing, Switzerland, 91–104 (2024).
•• One of the few comprehensive analyses of the economic burden of AD and its various cost components.
14.
Bickers DR, Lim HW, Margolis D et al. The burden of skin diseases: 2004 a joint project of the American Academy of Dermatology Association and the Society for Investigative Dermatology. J. Am. Acad. Dermatol. 55(3), 490–500 (2006).
15.
Drucker AM, Wang AR, Li W-Q, Sevetson E, Block JK, Qureshi AA. The burden of atopic dermatitis: summary of a report for the national eczema association. J. Invest. Dermatol. 137(1), 26–30 (2017).
16.
U.S. Bureau of Labor Statistics. Consumer price index for all urban consumers (CPI-U) – CUUR0000SAM: medical care in U.S. city average, all urban consumers, not seasonally adjusted (June 2016 – June 2025) 2025. (Accessed 21 October 2025). https://data.bls.gov/timeseries/CUUR0000SAM?output_view=data
17.
Davis DMR, Frazer-Green L, Alikhan A et al. Focused update: guidelines of care for the management of atopic dermatitis in adults. J. Am. Acad. Dermatol. 93(3), 745.e1–745.e7 (2025).
18.
Schram ME, Roekevisch E, Leeflang MMG, Bos JD, Schmitt J, Spuls PI. A randomized trial of methotrexate versus azathioprine for severe atopic eczema. J. Allergy Clin. Immunol. 128(2), 353–359 (2011).
19.
Waljee AK, Rogers MA, Lin P et al. Short term use of oral corticosteroids and related harms among adults in the United States: population based cohort study. Br. Med. J. 357, j1415 (2017).
20.
Pino Lopez J, Kromer C, Herr R, Schmieder A, Bayerl C, Schaarschmidt M-L. Drug survival rates and reasons for drug discontinuation in patients with atopic dermatitis: a retrospective study of adult outpatients. Eur. J. Dermatol. 31(2), 233–238 (2021).
21.
Barta K, Fonacier LS, Hart M et al. Corticosteroid exposure and cumulative effects in patients with eczema: results from a patient survey. Ann. Allergy Asthma Immunol. 130(1), 93.e10–99.e10 (2023).
•• Description of the various risks associated with long-term topical corticosteroids (TCS) use which make TCS a poor treatment choice for long-term symptom management.
22.
Patel NU, D'Ambra V, Feldman SR. Increasing adherence with topical agents for atopic dermatitis. Am. J. Clin. Dermatol. 18(3), 323–332 (2017).
23.
Maskey AR, Sasaki A, Sargen M et al. Breaking the cycle: a comprehensive exploration of topical steroid addiction and withdrawal. Front. Allergy 6, 1547923 (2025).
24.
National Eczema Society. Topical steroid withdrawal (TSW). (2024). (Accessed 18 July 2025). https://eczema.org/information-and-advice/topical-steroid-withdrawal-tsw/
25.
Chu DK, Schneider L, Asiniwasis RN et al. Atopic Dermatitis (Eczema) Guidelines: 2023 American Academy of Allergy, Asthma and Immunology/American College of Allergy, Asthma and Immunology Joint Task Force on Practice Parameters GRADE- and Institute of Medicine-based recommendations. Ann. Allergy Asthma Immunol. 132(3), 274–312 (2024).
26.
Guttman-Yassky E, Teixeira HD, Simpson EL et al. Once-daily upadacitinib versus placebo in adolescents and adults with moderate-to-severe atopic dermatitis (Measure Up 1 and Measure Up 2): results from two replicate double-blind, randomised controlled Phase III trials. Lancet 397(10290), 2151–2168 (2021).
27.
FDA. DUPIXENT (Dupilumab) prescribing information. (2022) (Accessed 18 July 2025). https://www.accessdata.fda.gov/drugsatfda_docs/label/2022/761055s042lbl.pdf
28.
FDA. ADBRY (Tralokinumab-ldrm) prescribing information. (2024). (Accessed 2 May 2025). https://mc-df05ef79-e68e-4c65-8ea2-953494-cdn-endpoint.azureedge.net/-/media/corporatecommunications/us/therapeutic-expertise/our-product/adbrypi.pdf?rev=d8ced7cbd6874a6997427ab88a2093e0
29.
FDA. EGBLYSS (Lebrikizumab) prescribing information. (2024). (Accessed 2 May 2025). https://www.accessdata.fda.gov/drugsatfda_docs/label/2024/761306s000lbledt.pdf
30.
FDA. NEMLUVIO (Nemolizumab) prescribing information. (2024). (Accessed 2 May 2025). https://www.accessdata.fda.gov/drugsatfda_docs/label/2024/761390s000lbl.pdf
31.
FDA. RINVOQ (Upadacitinib) prescribing information. (2023). (Accessed 2 May 2025). https://www.accessdata.fda.gov/drugsatfda_docs/label/2023/211675s015lbl.pdf
32.
FDA. CIBINQO (Abrocitinib) prescribing information. (2023). (Accessed 2 May 2025). https://www.accessdata.fda.gov/drugsatfda_docs/label/2023/213871s001lbl.pdf
33.
U.S. Census Bureau. Age and sex composition in the United States: 2023. Table14. Health insurance status by sex and age. (2023). (Accessed 2 May 2025). https://www.census.gov/data/tables/2023/demo/age-and-sex/2023-age-sex-composition.html
34.
IQVIA. Market Report Data on File. (2022).
35.
Davis DMR, Alikhan A, Bercovitch L et al. Guidelines of care for the management of atopic dermatitis in pediatric patients. J. Am. Acad. Dermatol. doi: (2026) (Epub ahead of print).
36.
LEO Pharma A/S. Atopic Dermatitis Budget Forecast. (2025).
37.
Alsbrooks K, Hoerauf K. Prevalence, causes, impacts, and management of needle phobia: an international survey of a general adult population. PLoS One 17(11), e0276814 (2022).
38.
Micromedex Solutions. RED BOOK®. (2025). (Accessed 20 April 2025). https://www.micromedexsolutions.com/
39.
LEO Pharma A/S. ECZTRA 3 Data on File. (2021).
40.
Zimmermann M, Rind D, Chapman R, Kumar V, Kahn S, Carlson J. Economic evaluation of dupilumab for moderate-to-severe atopic dermatitis: a cost-utility analysis. J. Drugs Dermatol. 17(7), 750–756 (2018).
41.
Antonazzo IC, Girolomoni G, Patruno C et al. Budget impact analysis of lebrikizumab for treating severe atopic dermatitis. Dermatol. Ther. (Heidelb.) 15(9), 2521–2536 (2025).
42.
Kuznik A, Bégo-Le-Bagousse G, Eckert L et al. Economic evaluation of dupilumab for the treatment of moderate-to-severe atopic dermatitis in adults. Dermatol. Ther. (Heidelb.) 7(4), 493–505 (2017).
43.
Wang X, Boytsov NN, Gorritz M, Malatestinic WN, Goldblum OM, Wade RL. US health care utilization and costs in adult patients with atopic dermatitis by disease severity. J. Manag. Care Specialty Pharm. 28(1), 69–77 (2021).
•• Analysis of healthcare utilization and healthcare costs in adults with AD stratified by disease severity.
44.
Fenske DC, Rosettie K, Ferrufino C et al. Budget impact of baricitinib for the treatment of patients with moderate-to-severe atopic dermatitis with inadequate response to topical therapies. Presented at: ISPOR 2021 (Virtual ISPOR Annual Meeting), (17–20 May 2021).
• Budget impact analysis for another JAKi (baricitnib) not included in this analysis but also evaluated for the treatment of moderate-to-severe atopic dermatitis.
45.
Sullivan SD, Mauskopf JA, Augustovski F et al. Budget impact analysis—Principles of good practice: Report of the ISPOR 2012 budget impact analysis good practice II task force. Value Health 17(1), 5–14 (2014).
46.
Institute for Clinical and Economic Review. Final evidence report: JAK inhibitors and monoclonal antibodies for the treatment of atopic dermatitis: effectiveness and value 2023. (Accessed 18 July 2025). https://icer.org/wp-content/uploads/2023/02/Atopic-Dermatitis_Final-Evidence-Report_Unmasked_02272023.pdf
•• Budget impact analysis of biologic and JAKi treatments for the treatment of moderate-to-severe AD which provides one of the closest comparisons to this research available in the literature.
47.
Butler D, Ng V, Guerin A et al. Real-world Q4W dosing among atopic dermatitis patients on tralokinumab: a claims-based analysis. Presented at: The Fall Clinical Dermatology Conference, NV, USA (24–27 October 2024).
48.
Pharmaceutical Strategies Group. State of specialty spend and trend report – 2024 results (Published Summer 2025). (2025). (Accessed 21st August 2025). https://www.psgconsults.com/industry-report/2025-state-of-specialty-spend-and-trend-report/
49.
FDA. OLUMIANT (baricitinib) FDA prescribing information. (2022). (Accessed 12 September 2025). https://www.accessdata.fda.gov/drugsatfda_docs/label/2022/207924s006lbl.pdf
50.
Boesjes CM, Kamphuis E, de Graaf M et al. Long-term effectiveness and reasons for discontinuation of dupilumab in patients with atopic dermatitis. JAMA Dermatol. 160(10), 1044–1055 (2024).
51.
Blauvelt A, Hong HC, Katoh N et al. Long-term safety and efficacy of tralokinumab in patients with moderate-to-severe atopic dermatitis treated for up to 6 years: final results from the open-label extension trial ECZTEND. Dermatol. Ther. (Heidelb.) 16(4), 2001–2018 (2026).
Information & Authors
Information
Published In
Copyright
© 2026 The authors. This work is licensed under the Attribution-NonCommercial-NoDerivatives 4.0 Unported License
History
Received: 12 February 2026
Accepted: 22 May 2026
Published online: 9 June 2026
Keywords:
Topics
Authors
Metrics & Citations
Metrics
Article Usage
Article usage data only available from February 2023. Historical article usage data, showing the number of article downloads, is available upon request.
Citations
How to Cite
Tralokinumab as a cost-saving treatment option for adults and adolescents with moderate-to-severe atopic dermatitis enrolled in US health insurance plans: a budget impact analysis. (2026) Journal of Comparative Effectiveness Research. DOI: 10.57264/cer-2026-0042
Export citation
Select the citation format you wish to export for this article or chapter.