Cost impact of Bruton’s tyrosine kinase inhibitor selection in Medicare patients with chronic lymphocytic leukemia
Publication: Journal of Comparative Effectiveness Research
Abstract
Aim: To estimate cost savings associated with covalent Bruton’s tyrosine kinase inhibitor (cBTKi) choice in patients with treatment-naive (TN) and relapsed/refractory (RR) chronic lymphocytic leukemia (CLL) from a Medicare perspective. Materials & methods: An economic model with Markov structure simulated outcomes in patients with CLL initiating ibrutinib, acalabrutinib or zanubrutinib monotherapy. Modeled population included TN and RR patients who had no prior cBTKi. Treatments were dosed per US FDA label and efficacy assumed identical across cBTKis. Cumulative grade ≥3 adverse event (AE) rates were drawn from extended follow-up of cBTKi phase III clinical trials at similar duration. Costs included drug price per 2024 wholesale acquisition cost and AE management medical costs from literature, adjusted for Medicare reimbursement. Outcomes were total change in payer cost over 1, 3 and 5 years. Results: A cohort of 13,726 patients with CLL was modeled (44% TN, 56% RR). Acalabrutinib’s aggregate grade ≥3 AE rate was 25.8% points less in TN patients (35.8% vs 61.6%) and 8.0% points less in RR patients (75.0% vs 83.0%) compared with ibrutinib, and 20.6% points less in TN patients (35.8% vs 56.4%) and 11.1% points less in RR patients (75.0% vs 86.1%) compared with zanubrutinib. Acalabrutinib saved $15,478 more per patient versus ibrutinib in year 1 due to lower treatment cost (-$12,076) and lower AE cost (-$3402). Acalabrutinib also saved $1901 more per patient versus zanubrutinib as acalabrutinib higher treatment cost (+$1663) was offset by lower AE cost (-$3563). Across all patients, acalabrutinib saved $212 million more versus ibrutinib and $26 million more versus zanubrutinib from a Medicare perspective. Acalabrutinib cost savings persisted over 3 and 5 years. Conclusion: Acalabrutinib yielded cost savings versus ibrutinib and zanubrutinib for patients with CLL in Medicare due to lower treatment cost versus ibrutinib and fewer grade ≥3 AEs versus both ibrutinib and zanubrutinib.
Plain language summary: Impact of Bruton’s tyrosine kinase inhibitor treatment choice on Medicare cost
What was the study aim?
To estimate cost impact to Medicare from the choice of covalent Bruton’s tyrosine kinase inhibitor (cBTKi) for the treatment of patients with chronic lymphocytic leukemia (CLL).
How was the study carried out?
An economic model was built to estimate costs for patients with CLL (both in the treatment-naive and relapsed setting) covered by Medicare who are starting treatment with ibrutinib, acalabrutinib, or zanubrutinib at recommended doses per their US FDA approved drug labels. The rates of severe side effects experienced with each treatment were taken from long-term reports of their major clinical trials. Costs included drug costs and medical costs of managing the severe side effects. Outcomes were total change in cost over 1, 3 and 5 years after starting treatment.
What were the results?
Acalabrutinib saved $15,478 more per patient versus ibrutinib in the first year due to lower treatment cost (-$12,076) and lower toxicity cost (-$3402). Acalabrutinib also saved $1901 more per patient versus zanubrutinib, as higher treatment cost (+$1663) was offset by lower toxicity cost (-$3563). Cost savings with acalabrutinib persisted over 3 and 5 years.
What do the results mean?
Acalabrutinib showed greater cost savings compared with ibrutinib and zanubrutinib in patients with CLL in Medicare due to lower treatment cost than ibrutinib and less toxicity than both ibrutinib and zanubrutinib.
Chronic lymphocytic leukemia (CLL) is a hematologic malignancy characterized by abnormal lymphocyte proliferation [1]. CLL is the most prevalent leukemia in USA adults, with considerable impact on morbidity and mortality [2,3]. There were over 200,000 US individuals living with CLL in 2024 [2,3]; seven in ten patients diagnosed with CLL are aged ≥65 years [3].
Covalent Bruton’s tyrosine kinase inhibitors (cBTKis) – including ibrutinib, acalabrutinib and zanubrutinib – have significantly improved progression-free survival and overall survival over standard chemoimmunotherapy [4]. cBTKis are considered preferred treatment options for both treatment-naive (TN) and relapsed/refractory (RR) CLL [5]. Despite superiority over previous standard of care, treatment efficacy across the three cBKTis has been shown to be generally similar in both TN and RR CLL as demonstrated in both head-to-head trial data [6,7] and matching-adjusted indirect comparisons (MAICs) [8–10].
Beyond efficacy, choice of cBTKi often relies on patient- and drug-specific factors such as comorbidities, cost and safety profiles [4]. Tolerability is a key factor as toxicity is among the most common reasons for discontinuation [4]. First-generation cBTKi ibrutinib is limited by cardiovascular toxicities such as atrial fibrillation and hypertension [11,12] and has shown higher rates of discontinuation in the real world [13]. In contrast, second-generation cBTKis acalabrutinib and zanubrutinib have improved selectivity, demonstrating reduced rates of cardiovascular adverse events (AEs) compared with ibrutinib in clinical trials among patients with RR CLL [6,14]. While there are no head-to-head clinical trials of acalabrutinib and zanubrutinib, MAICs have estimated lower risk of hypertension with acalabrutinib than zanubrutinib in TN CLL, and lower risk of hemorrhage, severe hypertension, serious AE and AE leading to dose reduction with acalabrutinib than zanubrutinib in RR CLL [9,10].
Assessing the implications of cBTKi treatment choice for CLL is essential to optimize both patient outcomes and the sustainability of cancer care systems. While physicians must tailor treatments to the unique needs and preferences of individual patients, the broader impact of treatment decisions on healthcare expenditures cannot be overlooked, particularly by payers such as the Centers for Medicare and Medicaid Services (CMS). Given the high prevalence of CLL among older adults, Medicare reimbursement policies will significantly influence access to these therapies. This highlights the need for value-based prescribing that considers not only patient outcomes but also the economic implications of safety profiles and treatment costs. To address these considerations, this study utilized economic modeling to assess the potential cost savings associated with choice of cBTKi across TN and RR patients with CLL, focusing on the impact of safety-related differences on health and economic outcomes from a Medicare perspective.
Materials & methods
An economic model was constructed to simulate economic outcomes among patients with CLL initiating cBTKi therapy with ibrutinib, acalabrutinib, or zanubrutinib. A US payer perspective – specifically CMS – was used. The modeled population included both patients with TN and RR CLL from a Medicare perspective [5]. TN and RR CLL populations were modeled separately, then pooled to inform estimated change in cost. The TN population consisted of newly diagnosed patients with CLL eligible to initiate treatment; asymptomatic ‘watch-and-wait’ patients were excluded [1]. The RR population consisted of patients with CLL in second-line (2L) or third-line (3L) treatment who have not received prior cBTKi.
Treatment with acalabrutinib was compared with ibrutinib and to zanubrutinib individually. Dosing and duration of therapy was modeled per current US FDA labeling information, which states all three cBTKis may be given indefinitely until disease progression or unacceptable toxicity [15–17]. Outcomes included differences in total, medical and pharmacy cost between cBTKis, per patient and across the Medicare CLL population over 1, 3 and 5 years. Outcomes were additionally estimated across patient subpopulations with CLL of special interest to CMS under the Inflation Reduction Act (i.e., ‘special subpopulations’), including the disabled, terminally ill (<6 months life expectancy), and patients with end-stage renal disease (ESRD) [18]. An expected annualized cost to CMS, combining total annual costs in each year of treatment weighted by real-world TN versus RR and time on treatment distributions, was additionally calculated to estimate the typical total cost to CMS associated with each cBTKi across the cBTKi-eligible Medicare CLL population in any given year.
Model overview
A Markov model approach simulated transitions between four treatment pathway health states in 28-day monthly cycles: cBTKi, venetoclax + rituximab, subsequent treatment (pooled pirtobrutinib, chimeric antigen receptor [CAR] T cell therapy with lisocabtagene maraleucel, and best supportive care [BSC]) and death (Figure 1). The model structure reflects a real-world treatment pathway in accordance with current CLL treatment guidelines [1,5] and validated by clinical subject matter experts (ASK, JMR). In the cBTKi state, patients with CLL who are TN (or RR) start treatment with ibrutinib, acalabrutinib or zanubrutinib, remaining on therapy until discontinuation due to intolerance or progression, or death. cBTKi AE management costs were applied over year 1 of treatment, calculated as a weighted average of monthly management costs for each AE weighted by their cumulative rates over the first 12 cycles. Upon discontinuing cBTKi, patients immediately begin 2 year fixed duration venetoclax + rituximab. Patients may transition to subsequent treatments if disease progresses during or after the fixed duration phase or remain in the state and receive maintenance care. The subsequent treatment state represents a pooled cost of pirtobrutinib, CAR T cell therapy and BSC weighted by their respective uptake. Patients remain in this state until death and can transition to death from any state above.
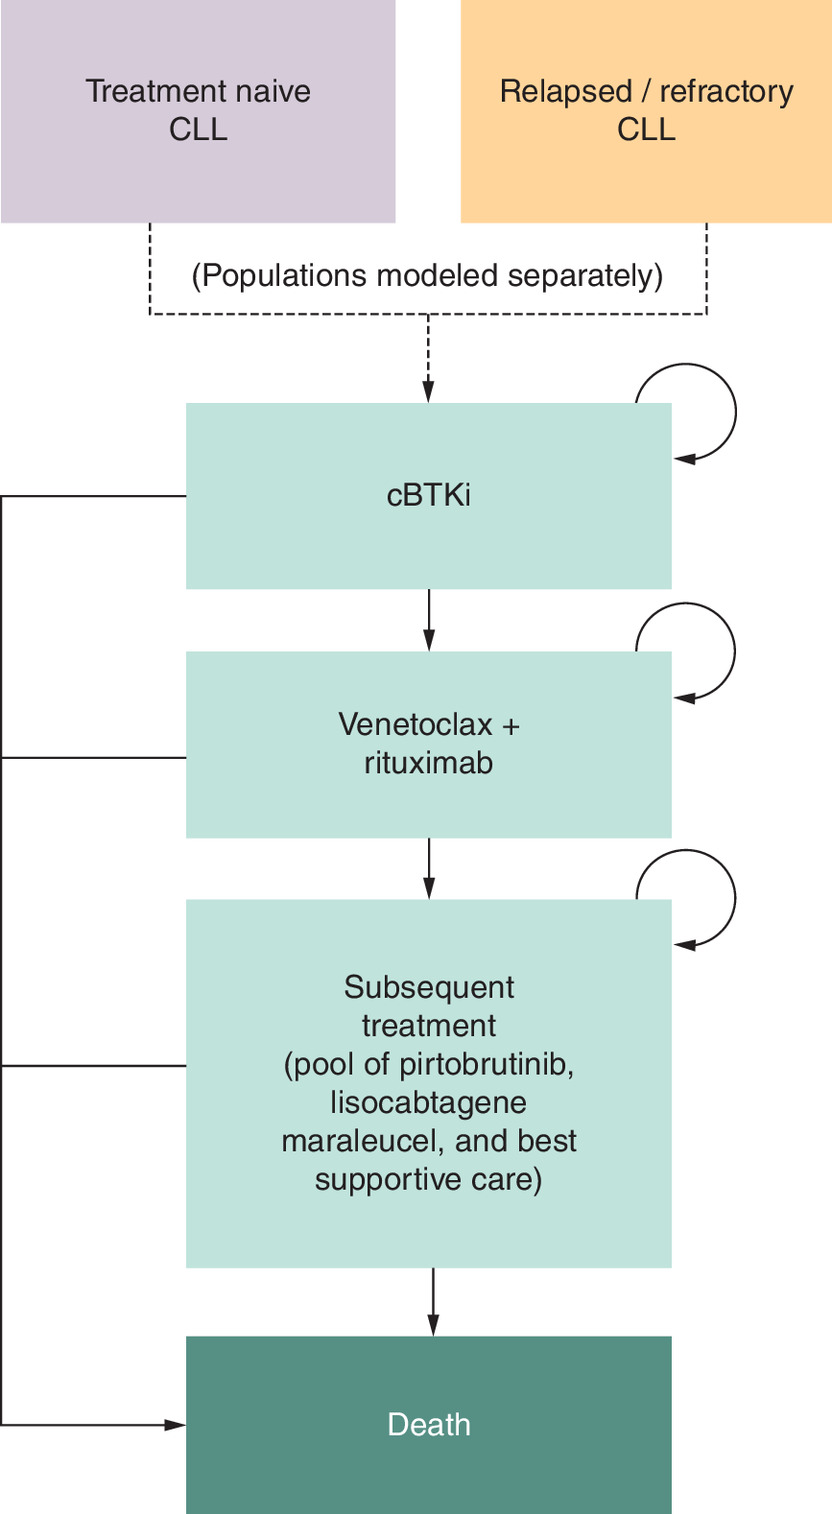
Figure 1. Markov model.
Subsequent treatment state consisted of a pool of pirtobrutinib, lisocabtagene maraleucel and best supportive care, weighted by real-world US distribution.
cBTKi: Covalent Bruton’s tyrosine kinase inhibitors; CLL: Chronic lymphocytic leukemia.
Model inputs
Key model inputs included safety, clinical, cost and epidemiology. (Table 1 & Supplementary Table 1). Safety parameters were used to quantify expected costs incurred from differences in cBTKis safety profiles. Cumulative grade ≥3 AE rates were obtained from extended follow-up data of phase III clinical trials of all cBTKis to ensure similar follow-up duration [7,11,19–22]. Modeled AEs included atrial fibrillation, hypertension, neutropenia, thrombocytopenia, infections, hemorrhage and diarrhea. Given their frequency, potential high costs of management and clinical importance, these grade ≥3 AEs are commonly evaluated across a number of cost–effectiveness analysis of cBTKis and other targeted therapies in CLL [23–28].
| Safety | Value | Ref. | |
|---|---|---|---|
| TN | RR | ||
| Grade ≥3 AE rate, cumulative | |||
| Acalabrutinib | [19,20] | ||
| Neutropenia | 11.2% | 20.0% | |
| Thrombocytopenia | 1.1% | 10.0% | |
| Atrial fibrillation | 1.1% | 5.0% | |
| Hypertension | 2.8% | 4.0% | |
| Hemorrhage | 2.8% | 4.0% | |
| Infections | 16.2% | 31.0% | |
| Diarrhea | 0.6% | 1.0% | |
| Ibrutinib | [11,20,21] | ||
| Neutropenia | 12.6% | 23.0% | |
| Thrombocytopenia | 4.0% | 7.0% | |
| Atrial fibrillation | 5.2% | 4.0% | |
| Hypertension | 8.1% | 9.0% | |
| Hemorrhage | 6.7% | 5.0% | |
| Infections | 20.6% | 30.0% | |
| Diarrhea | 4.4% | 5.0% | |
| Zanubrutinib | [7,22] | ||
| Neutropenia | 12.5% | 22.2% | |
| Thrombocytopenia | 2.1% | 3.7% | |
| Atrial fibrillation | 1.3% | 3.1% | |
| Hypertension | 9.2% | 16.4% | |
| Hemorrhage | 5.8% | 3.7% | |
| Infections | 23.8% | 35.5% | |
| Diarrhea | 1.7% | 1.5% | |
| Clinical | Value | Ref. | |
| TN | RR | ||
| cBTKi Discontinuation rate, monthly | 4.9% | 5.4% | [29,30] |
| cBTKi Mortality rate, monthly | 0.7% | 1.1% | [13,31] |
| Cost | Value, 2024 USD† | Ref. | |
| TN | RR | ||
| cBTKi medical care cost (exclusive of AE costs), monthly | $1110 | [32] | |
| Grade ≥3 AE incremental cost, per event | [33] | ||
| Atrial fibrillation | $32,161 | ||
| Hypertension | $33,652 | ||
| Neutropenia | $21,896 | ||
| Thrombocytopenia | $28,927 | ||
| Infections | $27,947 | ||
| Hemorrhage | $27,861 | ||
| Diarrhea | $21,041 | ||
| Drug acquisition cost, monthly | [34] | ||
| Acalabrutinib | $9770 | ||
| Ibrutinib | $11,165 | ||
| Zanubrutinib | $9578 | ||
| Epidemiology | Value | Ref. | |
| TN | RR | ||
| Incidence of CLL in Medicare | 27.5 per 100,000 | [35] | |
| Newly-diagnosed CLL Pts eligible to initiate treatment | 44% | [36] | |
| Real-world annual relative distribution of TN vs RR CLL | 44% | 56% | [36] |
| Prevalence of disability in CLL | 7.2% | 5.2% | [36] |
| Prevalence of terminal illness in CLL | 13.5% | [37] | |
| Prevalence of end-stage renal disease in CLL | 4.7% | 3.6% | [36] |
†
Cost inputs shown in table are prior to adjustment for Medicare reimbursement using commercial-to-Medicare reimbursement ratios.
AE: Adverse event; cBTKi: Covalent Bruton’s Tyrosine kinase inhibitor; CLL: Chronic lymphocytic leukemia; Pts: Patients; RR: Relapsed/refractory; TN: Treatment-naive; USD: United States dollar.
Clinical parameters were used to populate transition probabilities between health states. Clinical parameters included discontinuation rates for cBTKi and venetoclax + rituximab; uptake distribution of pirtobrutinib, CAR T cell therapy or BSC following discontinuation of venetoclax + rituximab; and mortality rates for cBTKi, venetoclax + rituximab, pirtobrutinib, CAR T cell therapy and BSC. No differences in efficacy among the three cBTKis were modeled; cost differences were driven by differences in treatment cost and cBTKi safety profiles. cBTKi discontinuation and mortality rates were based on real-world data and assumed equal across ibrutinib, acalabrutinib and zanubrutinib [13,29–31]. Clinical inputs for the cBTKi health state used data specific TN and RR populations; however, clinical inputs for post-cBTKi states used the same data between TN and RR as both would be considered refractory after discontinuing cBTKi (Supplementary Table 1). Clinical rates were converted to probabilities assuming a constant proportional hazard.
Cost parameters were used to estimate direct costs per monthly cycle in each health state. Costs in the cBTKi health state were calculated by adjusting the total cost of CLL care for the differential cost impact of different cBTKis AE rates and drug costs. A baseline estimate of total medical care costs (inpatient stays, emergency department [ED] visits, office visits and other outpatient and ancillary care) on targeted CLL therapy exclusive of AE costs [32] was adjusted to incorporate cBTKi AE costs by incrementally adding the expected monthly costs of managing each grade ≥3 AE type [33], weighted by the cumulative grade ≥3 AE rates over the first year of cBTKi treatment. Drug acquisition costs were estimated using 2024 wholesale acquisition costs (WACs) and FDA label dosing schedules [15–17,34], then added to total medical costs to obtain the total cost for each cBTKi in the health state. Costs in post-cBTKi health states were comprised of total medical care cost inclusive of AE costs and drug costs during active treatment (Supplementary Table 1). Costs from commercial payer data sources were adjusted to reflect Medicare reimbursements by applying commercial-to-Medicare reimbursement ratios from literature [38,39] (Supplementary Table 1). All costs were inflated to 2024 USD [40].
Epidemiology parameters were used to construct real-world estimates of expected costs in patients with CLL covered by Medicare who are eligible to start cBTKi, per-patient and nationwide. The real-world annual relative distribution of TN versus RR in CLL, where RR included patients in 2L–3L, was obtained from literature to weight cost estimates per TN and RR patient to derive an overall estimate of cost per patient with CLL [35]. Inputs for annual incidence of CLL in Medicare and proportion of newly diagnosed eligible for therapy (i.e., excludes ‘watch-and-wait’ patients) were obtained from literature and applied to the number of Medicare beneficiaries in 2024 to estimate the total number of patients with CLL eligible for cBTKi to derive the national cost impact to Medicare (refer to Supplementary Matierials for more details) [35,36].
Model assumptions
Modeled patients with CLL were assumed to meet 2023 National Comprehensive Cancer Network (NCCN) criteria for cBTKi therapy [5]. Patients with CLL who are RR were assumed to be cBTKi-naive upon entering the model to permit TN and RR populations to follow the same treatment pathway model structure in accordance with current treatment guidelines [1,5]. Monotherapy with acalabrutinib, ibrutinib or zanubrutinib was modeled as the first and only cBTKi treatment. While cBTKi switching can occur in practice, this assumption permits clear comparison of cost impact attributed to each cBTKi and follows usual clinical practice where cBTKi retreatment following occurrence of a grade ≥3 AE rarely occurs per clinical experts (ASK, JMR, VS). Treatment initiation was assumed to occur immediately after discontinuing the prior treatment, representing treatment pathway progression under ideal care. CLL progression, discontinuation and mortality rates were assumed equal across cBTKis. cBTKi AEs were assumed to occur over the first year of treatment to reflect timing of AEs experienced in real-world practice, including resolution of AEs (or treatment intolerance discontinuation) typically observed by end of year 1 of treatment [13,41].
Data analysis
The parameters were incorporated into a Microsoft Excel calculator model to estimate costs associated with cBTKi treatment choice over 1, 3 and 5 years. Separate Markov chain simulations were constructed for TN and RR populations using 28-day cycles and applying a 3% annual discount rate [42]. Costs were calculated at both per-patient and nationwide CLL population level. Annual incidence of CLL in Medicare was combined with the 2024 Medicare beneficiary count and stratified by real-world TN and RR distribution to determine starting population sizes. For the CMS payer perspective, only direct healthcare costs (medical and pharmacy) were included; indirect costs were not evaluated. Population-level costs for each cBTKi were calculated by summing monthly pharmacy, medical and total costs over 1, 3 and 5 years for TN and RR populations. Per-patient costs were derived by dividing these totals by the respective TN and RR population sizes. Weighted averages based on relative TN versus RR shares were used to estimate overall costs per patient with CLL, which were multiplied by the total Medicare CLL population size to calculate overall population-level costs. The expected annualized cost to CMS in the real-world CLL cohort was calculated an average of total costs of each year on treatment, weighted by the real-world relative distribution of TN versus RR patients and real-world distribution of years since cBTKi start (Supplementary Table 1).
Sensitivity, probabilistic & scenario analyses
A subgroup analysis was conducted to examine outcomes in special subpopulations of patients with CLL in Medicare including the disabled, terminally ill and patients with ESRD [18]. The number of patients comprising the special subpopulations was estimated by applying the proportions of patients with CLL in Medicare who have disability, <6 months life expectancy and ESRD from literature [36,37] to the total population size of patients with CLL eligible for cBTKi therapy in Medicare (Table 1). Total change in number of grade ≥3 AEs, population-level costs and annualized costs were then estimated for each special subpopulation by multiplying per-patient estimates by estimated subpopulation sizes.
Use of observed grade ≥3 AE rates from extended follow-up of pivotal cBTKi clinical trials with similar durations in the base case is transparent and avoids assumptions or extrapolation of trial data. However, when cBTKis are not compared head-to-head, differences in trial populations may impact AE rates and limit comparability. To address this concern, a scenario analysis was conducted using MAIC results to inform AE rates for cBTKi comparisons in TN and RR not available from head-to-head clinical trials. MAIC-adjusted grade ≥3 AE rates for ibrutinib in TN and zanubrutinib in TN and RR were derived by applying the relative differences in AE rates from acalabrutinib estimated in the available published MAICs to the acalabrutinib clinical trial rates used in the base case [8–10] (Supplementary Table 2). Modeled grade ≥3 AE rates for ibrutinib and zanubrutinib not evaluated in the MAICs were assumed equal to acalabrutinib rates. Another scenario analysis examined the impact of alternate TN and RR population specifications on outcomes where: the RR population included 2L only, and all newly diagnosed patients with CLL were assumed eligible to start treatment (i.e., includes ‘watch-and-wait’ patients) and RR included 2L only (Supplementary Table 1). These alternative scenarios address the concern that the baseline population used had above average disease severity since ‘watch-and-wait’ patients were excluded from the modeled TN cohort, and RR patients may be more likely to receive cBTKi treatment in 2L than 3L. A third scenario analysis examined outcomes when varying rates of cBTKi discontinuation from any cause, including potentially toxicity (Supplementary Table 3).
Uncertainty was tested through deterministic sensitivity analysis and probabilistic analysis (DSA, PA). DSA varied key individual safety, clinical and cost parameters +/-20%. PA was performed via Monte Carlo simulations over 5000 iterated scenarios using Microsoft Excel visual basic code. Costs were represented by γ distributions and probabilities by β distributions, with parameter standard deviations assumed 20% of the deterministic value.
Results
Base case
A cohort of 13,726 patients with CLL (44% TN, 56% RR) was modeled to reflect a real-world population with CLL covered by Medicare who are eligible to start cBTKi therapy. Infection was the most common grade ≥3 AE across cBTKis in TN (20.6% ibrutinib, 16.2% acalabrutinib, 23.8% zanubrutinib) and RR (30.0%, 31.0%, 35.5%) patients, followed by neutropenia (TN: 12.6%, 11.2%, 12.5%; RR: 23.0%, 20.0%, 22.2%). Overall, acalabrutinib had the lowest aggregate grade ≥3 AE rate, with reductions of 25.8%-points versus ibrutinib (35.8% vs 61.6%) and 20.6%-points versus zanubrutinib (35.8% vs 56.4%) in TN patients, and reductions of and 8.0%-points versus ibrutinib (75.0% vs 83.0%) and 11.1%-points versus zanubrutinib (75.0% vs 86.1%) in RR patients. Key differences for acalabrutinib included lower rates of grade ≥3 hypertension (2.8% vs 8.1% for ibrutinib and 9.2% for zanubrutinib), infections and atrial fibrillation (1.1% vs 5.2% for ibrutinib) in TN patients, and lower rates of grade ≥3 hypertension (4.0% vs 9.0% for ibrutinib and 16.4% for zanubrutinib), thrombocytopenia (10.0% vs 7.0% for ibrutinib and 3.7% for zanubrutinib) and diarrhea (1.0% acalabrutinib vs 5.0% ibrutinib) in RR patients. Ibrutinib, acalabrutinib and zanubrutinib annual WACs were $213,677, $186,979 and $183,303, respectively.
Combining drug cost and grade ≥3 AE differences, acalabrutinib showed cost savings of $15,478 per patient versus ibrutinib over the first year of treatment, driven by lower treatment cost ($12,076 decrease) and lower AE cost ($3402 decrease) (Figure 2 & Supplementary Table 4). Acalabrutinib also showed cost savings of $1901 per patient versus zanubrutinib over the first year, as higher acalabrutinib treatment cost ($1663 increase) was offset by savings from lower AE cost ($3563 decrease) (Figure 2 & Supplementary Table 4). Cost savings per patient with acalabrutinib versus ibrutinib and zanubrutinib persisted over 3 ($23,735; $764) and 5 ($25,545; $515) years (Figure 2).
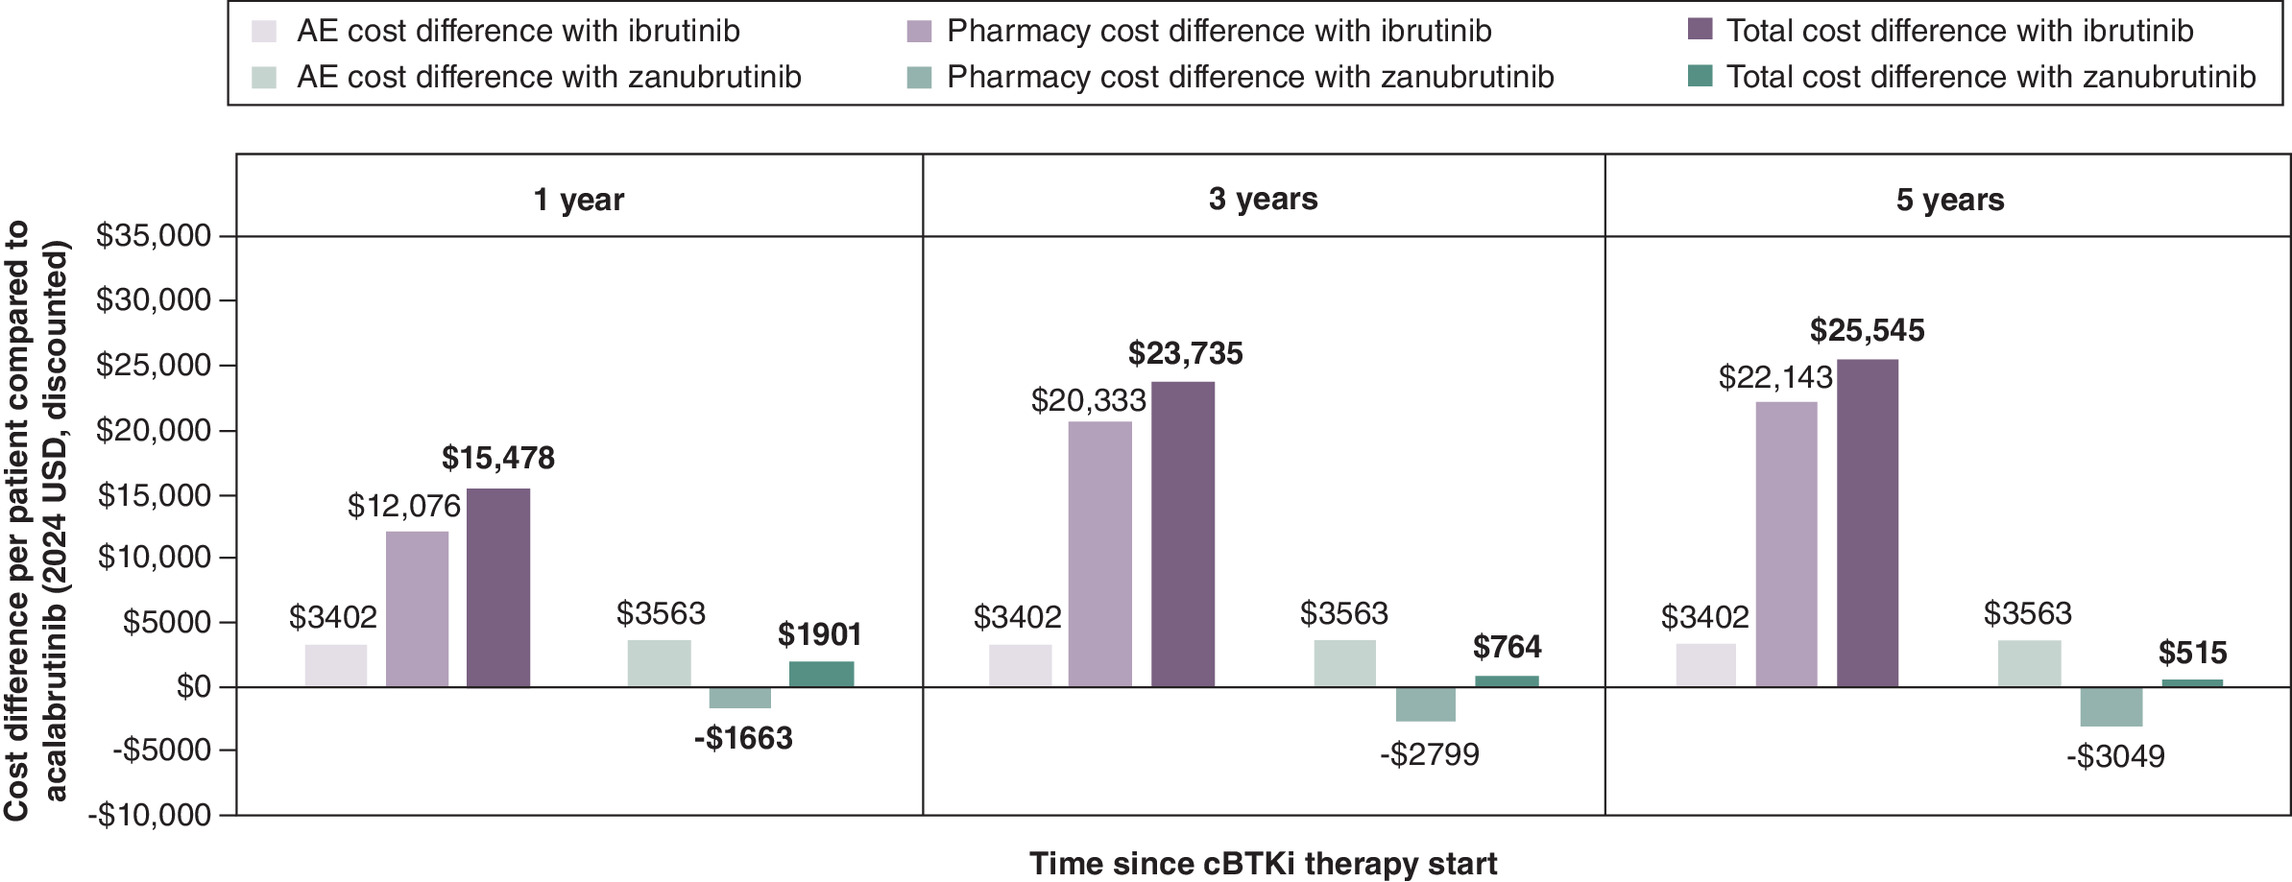
Figure 2. Increase in adverse event, pharmacy and total cost per patient with chronic lymphocytic leukemia with ibrutinib and zanubrutinib compared with acalabrutinib from a Medicare perspective.
Total cost is the sum of direct medical care costs, including cost of AE management, and pharmacy costs associated with the cBTKi therapy. Positive numbers indicate cost saving with acalabrutinib; negative numbers indicate increased cost with acalabrutinib.
AE: Adverse event; cBTKi: Covalent Bruton’s tyrosine kinase inhibitor; CLL: Chronic lymphocytic leukemia; USD: United States dollar.
Across all patients with CLL in Medicare, estimated cost savings with acalabrutinib over 1, 3 and 5 years, respectively, were $212 million, $326 million and $351 million versus ibrutinib, and $26 million, $10 million and $7 million versus zanubrutinib (Figure 3 & Supplementary Table 4). At current drug prices, the CLL population-level annualized cost savings to CMS with acalabrutinib would be $64 million versus ibrutinib and $2 million versus zanubrutinib (Supplementary Table 4).
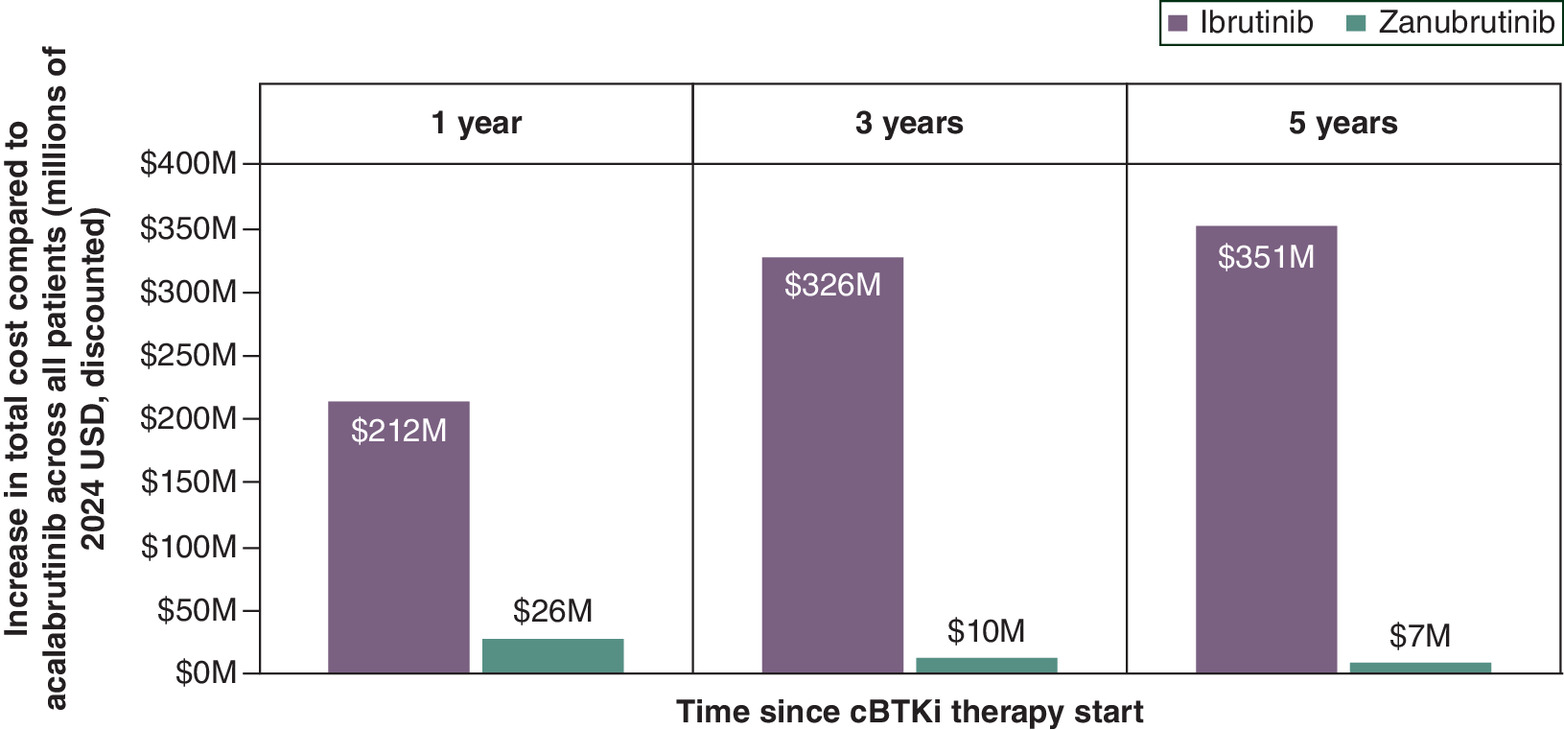
Figure 3. Increase in total cost with ibrutinib and zanubrutinib compared with acalabrutinib across all patients with chronic lymphocytic leukemia from a Medicare perspective.
Total cost is the sum of direct medical care costs, including cost of AE management and pharmacy costs associated with the cBTKi therapy. Positive numbers indicate cost saving with acalabrutinib; negative numbers indicate increased cost with acalabrutinib.
cBTKi: Covalent Bruton’s tyrosine kinase inhibitor; CLL: Chronic lymphocytic leukemia; USD: United States dollar.
Sensitivity, probabilistic & scenario analyses
Among the modeled cohort of 13,726 patients with CLL, 4875 were estimated to be disabled, 560 with ESRD and 1849 terminally ill. Compared with ibrutinib, acalabrutinib was associated with 1186 fewer, 95 fewer and 292 fewer grade ≥3 AEs across disabled, ESRD, terminally ill patients with CLL, respectively, over 1 year (Figure 4 & Supplementary Table 5). Compared with zanubrutinib, acalabrutinib was associated with 966 fewer, 89 fewer and 282 fewer grade ≥3 AEs across disabled, ESRD, terminally ill patients with CLL, respectively. Estimated cost savings with acalabrutinib across disabled, ESRD and terminally ill subpopulations, respectively, of $87–$144 million, $9–$15 million and $29–48 million versus ibrutinib, and $6–$14 million, $0.3–$1 million and $1–$4 million versus zanubrutinib over 1–5 year horizons. At current drug prices, acalabrutinib would result in annualized cost savings across disabled, ESRD and terminally ill subpopulations, respectively, of $26 million, $3 million and $9 million versus ibrutinib, and $1.6 million, $0.1 million and $0.3 million versus zanubrutinib.
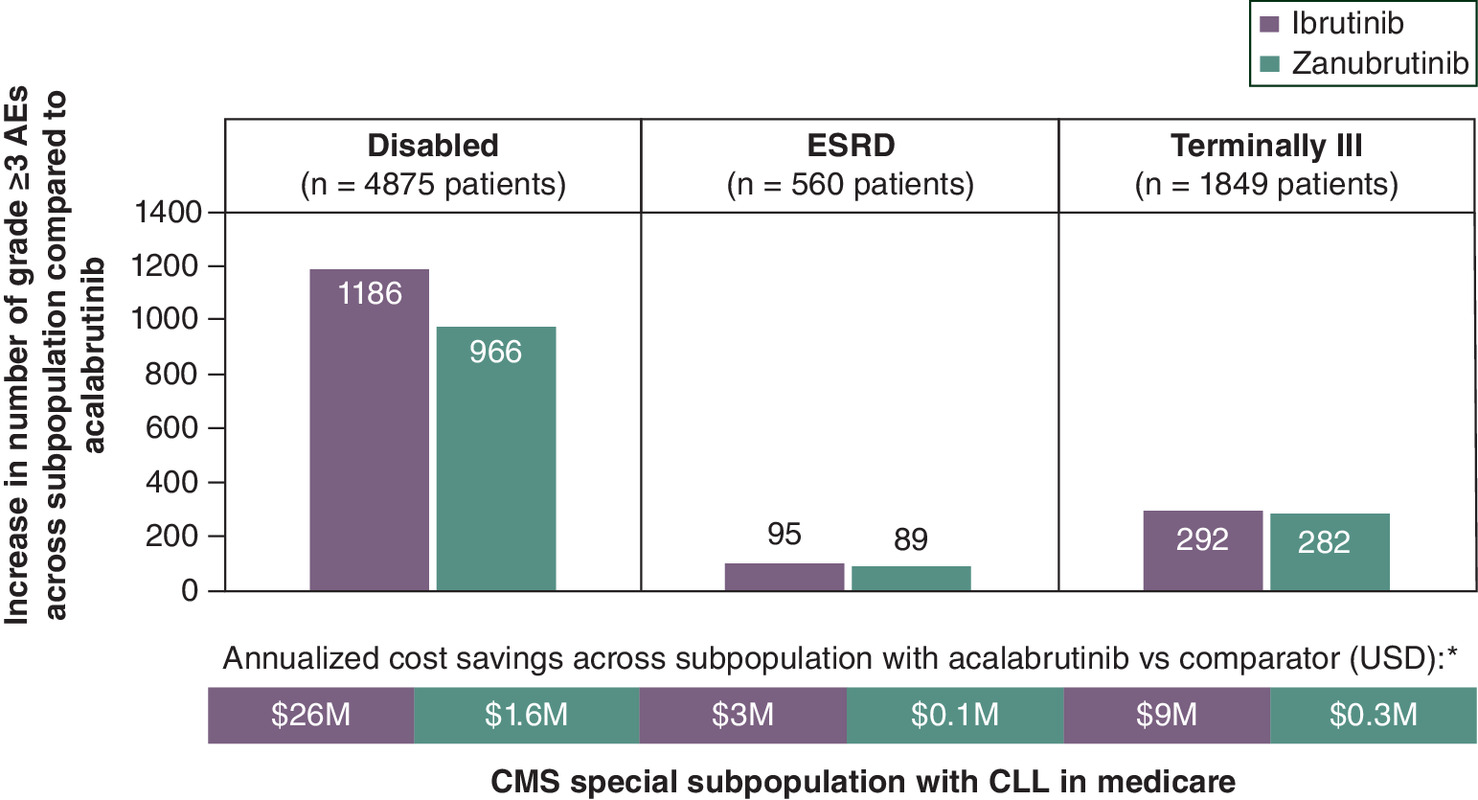
Figure 4. Increase in number of grade ≥3 adverse events in year 1 of covalent Bruton’s tyrosine kinase inhibitor treatment with ibrutinib and zanubrutinib compared with acalabrutinib and total annualized cost savings with acalabrutinib across disabled, ESRD and terminally ill patients with chronic lymphocytic leukemia in Medicare.
*Annualized cost calculated as an average of annual costs weighted by the real-world distributions of TN versus RR and years since cBTKi therapy start across CMS special subpopulation (2024 USD, discounted).
AE: Adverse event; cBTKi: Covalent Bruton’s tyrosine kinase inhibitor; CLL: Chronic lymphocytic leukemia; CMS: Centers for Medicare and Medicaid Services; ESRD: End stage renal disease; RR: Relapsed/refractory; TN: Treatment-naive; USD: United States dollar.
MAIC informed aggregate grade ≥3 AE rates for acalabrutinib were 22.9% points less than ibrutinib and 5.0% points less than zanubrutinib in TN, and 8.0% points less than ibrutinib and 20.1% points less than zanubrutinib in RR. Differences in MAIC-informed AE rates resulted in cost savings with acalabrutinib over 1 year of $15,142 per patient versus ibrutinib and $1501 per patient versus zanubrutinib. In both alternate population scenarios, acalabrutinib resulted in cost savings compared with ibrutinib and zanubrutinib. Savings versus ibrutinib over 1 year were $16,919 per patient, totaling $138 million across all patients in scenario 1 and $313 million in scenario 2. Savings versus zanubrutinib over 1 year were $2529 per patient, totaling $21 million across all patients in scenario 1 and $47 million in scenario 2. Varying cBTKi discontinuation showed 1-year savings of $19,872 and $2267 per patient with acalabrutinib versus ibrutinib and zanubrutinib, respectively. Cost savings were generally maintained over 3 and 5 years (Supplementary Table 6). DSA (Supplementary Figures 1–6) and PA (Figure 5 & Supplementary Figures 7–10) confirmed overall robustness of base case results, with sensitivity observed only to drug prices. Lower AE cost with acalabrutinib versus ibrutinib and zanubrutinib was maintained in all probabilistic scenarios, while lower pharmacy cost was maintained in 68.5% scenarios versus ibrutinib and 46.8% versus zanubrutinib.
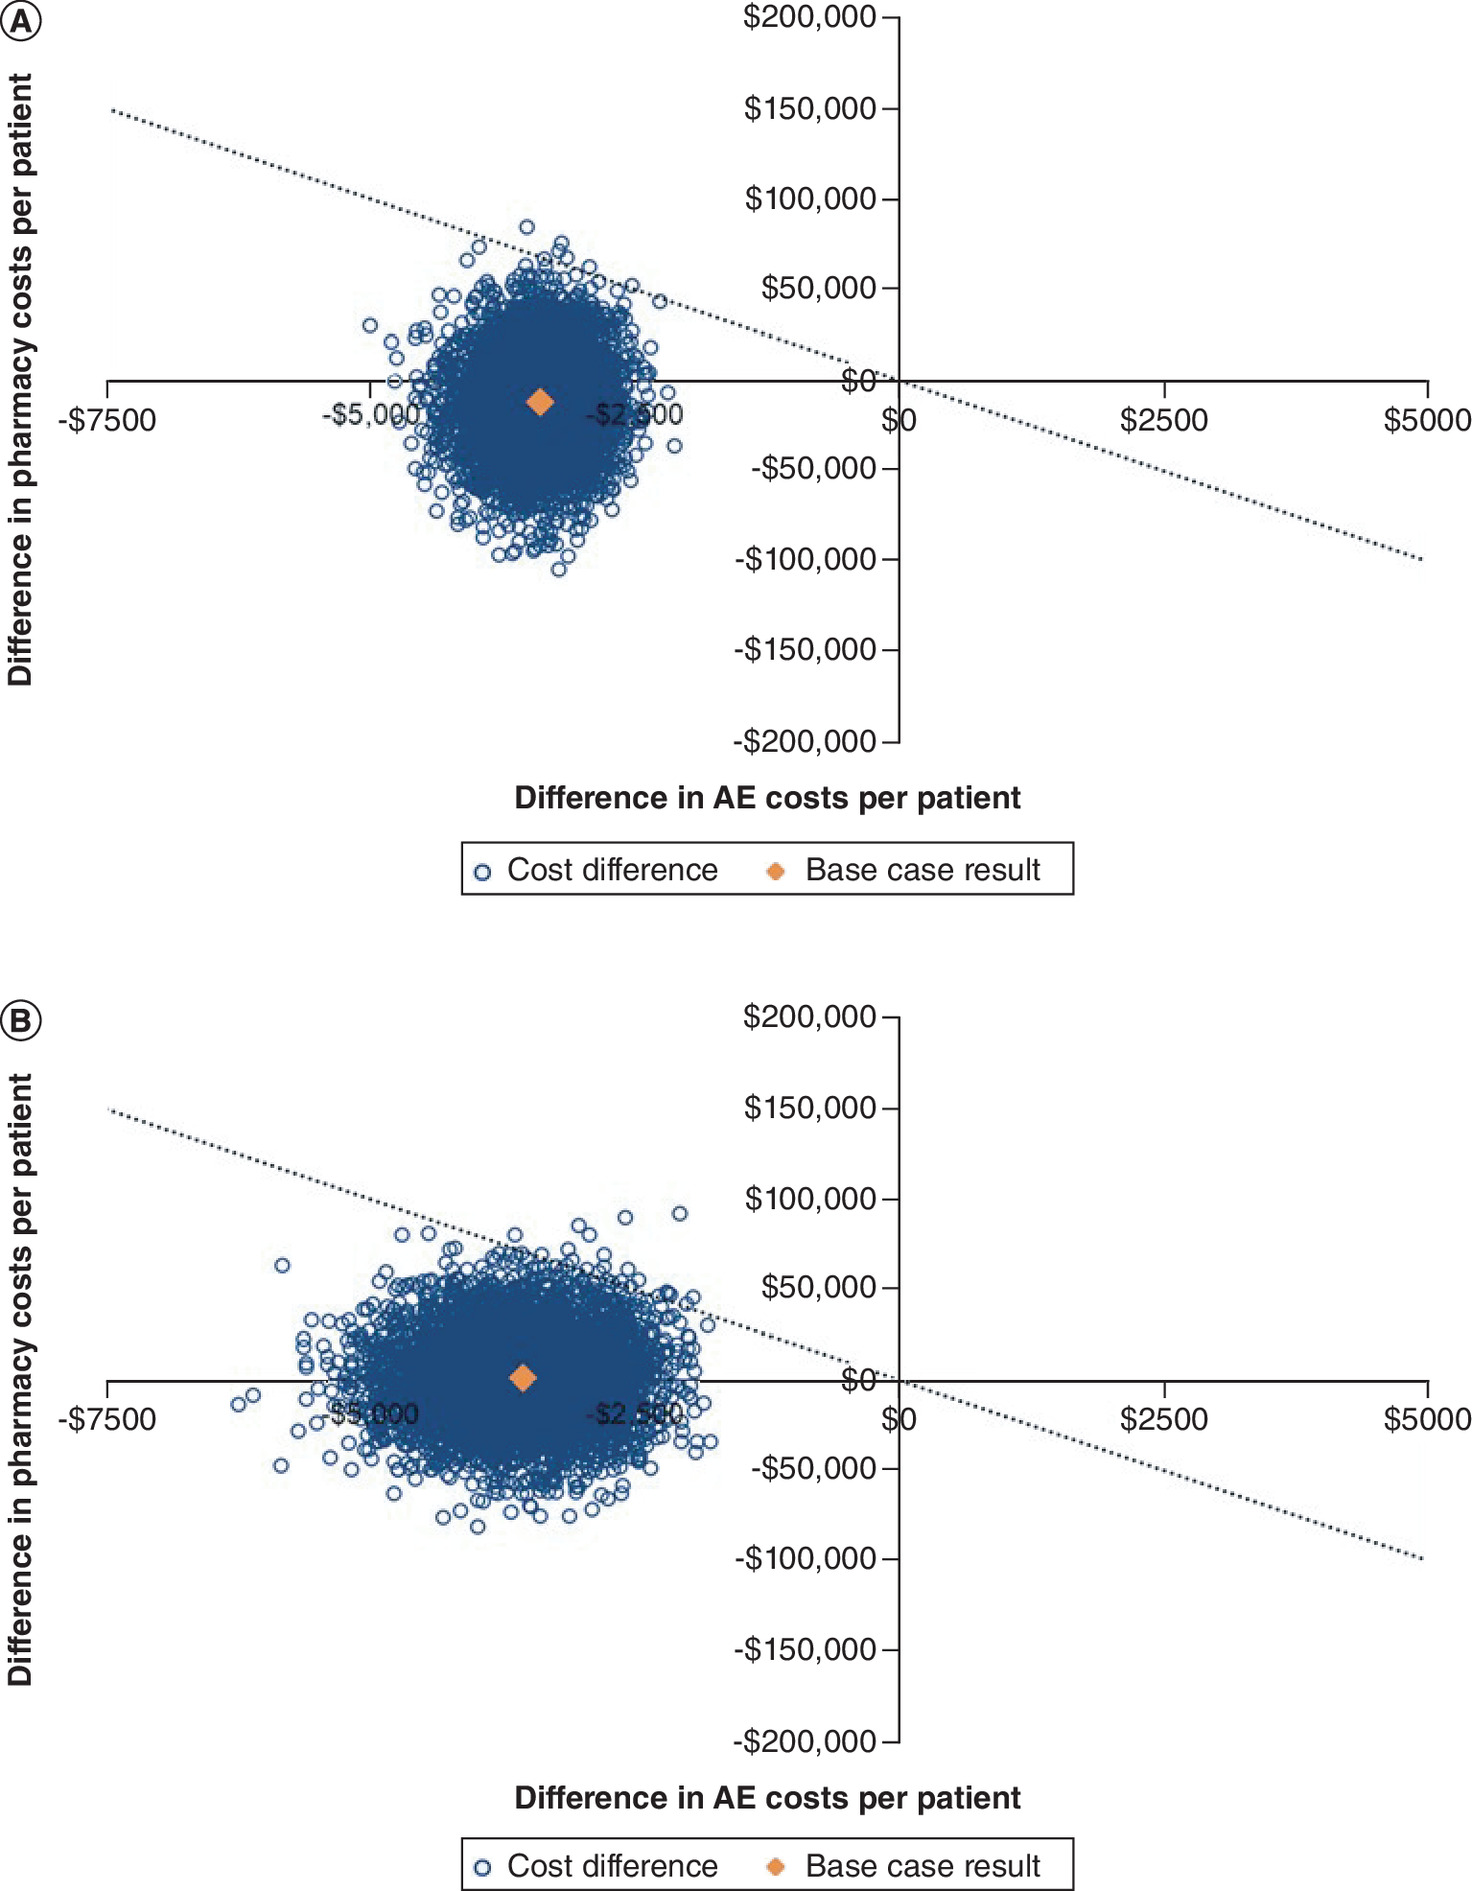
Figure 5. Probabilistic analysis results.
Difference in adverse event costs versus difference in pharmacy costs over 1 year between (A) acalabrutinib versus ibrutinib and (B) acalabrutinib versus zanubrutinib in 5000 iterated scenarios.
AE: Adverse event.
Discussion
Use of acalabrutinib among patients with TN and RR CLL yielded cost savings in comparison to other cBTKis from a CMS payer perspective. Results were driven by current cBTKi drug prices and reduced AE costs over short-term (1 year since cBTKi initiation) and longer-term (3 and 5 years). Acalabrutinib had both lower drug cost and lower grade ≥3 AEs rates than ibrutinib, making acalabrutinib a clear choice over ibrutinib. Although annual acalabrutinib WAC was $3676 more than zanubrutinib, this treatment cost difference was entirely offset by cost savings from lower grade ≥3 AEs rates with acalabrutinib.
This study is not only useful for payer decision-making in general, it can also help inform CMS decision-making under Inflation Reduction Act (IRA)-mandated ‘maximum fair price’ negotiations for select drugs covered under Medicare [18,43]. CLL largely affects the elderly population, meaning widespread adoption of cBTKi treatment can have substantial financial implications for Medicare due to their high cost and ongoing administration. CMS is increasingly focused on value-based healthcare, which aims to optimize health outcomes relative to cost. The safety and tolerability of cBTKis can affect patient adherence and overall treatment success in addition to disease management costs [4,13,32]. Therefore, assessing the value of differences in cBTKi safety profiles is important for informed treatment decisions. The evidence generated in this study can be used to inform CMS national coverage determinations, reimbursement policies and value-based contracts such as through drug price negotiations under IRA, which will have significant implications for access to these cBTKi treatments for most patients with CLL. Negotiations for ibrutinib have already taken place [44]. Under IRA, CMS mandates a drug’s comparative effectiveness relative to existing alternatives; CMS is also required to address unmet medical needs, including for special subpopulations with disabilities, ESRD, the elderly and the terminally ill [18]. Lower incidence of severe AEs with acalabrutinib can address the need for treatments patients can better tolerate, particularly for those sensitive to certain side effects or with comorbidities. Model results showed acalabrutinib was associated with a reduction of thousands of grade ≥3 AEs over 1 year of treatment compared with ibrutinib and zanubrutinib across disabled, ESRD and terminally ill patients with CLL covered by Medicare. Moreover, the total cost implications of choice of cBTKi treatment estimated in this study can be used to inform CMS budget forecasting and resource allocation.
Strengths of this study include modeling separate cohorts for TN and RR patients with CLL and use of safety data from pivotal phase III clinical trials. A pooled estimate across TN and RR patients with CLL was used to inform the cost impact of cBTKis because it is straightforward to interpret and aligns with CMS’s approach of negotiating drug prices at the drug level rather than indication level, considering the cost impact across all users in Medicare. However, this study was subject to limitations. Model health states represented treatment pathways rather than disease progression, and the model structure represented only one possible treatment pathway for both TN and RR CLL [1,5]. However, these treatment pathways were based on NCCN guidelines and validated by clinical experts (ASK, JMR), structured to focus on differential cBTKi cost impacts rather than replicate the broader CLL treatment landscape. This study did not account for efficacy differences across cBTKis. While ALPINE demonstrated superiority of zanubrutinib over ibrutinib in RR CLL [7], this analysis focused on cost-offsets driven by differences in safety profiles rather than clinical efficacy, and cost comparisons between zanubrutinib and ibrutinib were not derived from this model. Assumption of equivalent efficacy conservatively estimates acalabrutinib and zanubrutinib performance relative to ibrutinib. All value differences were based on pharmaceutical cost and medical costs related to cBTKi safety profiles. cBTKi discontinuation was assumed equal in the base case despite toxicity being a frequent cause. However, acalabrutinib cost savings were generally maintained when varying discontinuation in scenario analysis; notably, this evaluation was conservative as the model did not explicitly model any negative health impacts from treatment discontinuation or potential long-term costs or benefits of remaining on cBTKi. Grade ≥3 AE rates from extended follow-up of pivotal cBTKi clinical trials modeled in the base case were not matching-adjusted for differences in trial populations. However, scenario analysis was performed using MAIC-informed AE rates, which agreed with base case findings. Although cBTKis can be used in combination with other treatments like obinutuzumab, cBTKis were evaluated as monotherapy only for ease of comparison across cBTKi treatment options. The model evaluates cost impact of cBTKi choice conditional on eligibility to start cBTKi; thus, results are generalizable to this subpopulation rather than the full Medicare population with CLL. Many patients with CLL are ‘watch-and-wait’ and not included in this analysis; however, those who later require cBTKi would enter the model once eligible. RR population size was approximated using an incident-year framework, which may slightly bias cost offsets upward due to smaller AE differences in RR; however, conclusions are unlikely affected as AE differences are directionally consistent across TN and RR. WAC-based drug prices modeled do not account for negotiated discounts and rebates.
Conclusion
Acalabrutinib yielded cost savings compared with ibrutinib and zanubrutinib for patients with CLL from a Medicare perspective due to lower treatment cost than ibrutinib and fewer grade ≥3 AEs than both ibrutinib and zanubrutinib.
Summary points
•
Chronic lymphocytic leukemia (CLL) affects over 200,000 individuals in the US, with approximately 20,700 new cases, of which 70% aged 65 years or older at diagnosis, and 4500 deaths in 2024.
•
CLL has had a number of recent clinical advancements including US FDA approved covalent Bruton’s tyrosine kinase inhibitors (cBKTis) ibrutinib, acalabrutinib and zanubrutinib.
•
Ibrutinib is limited by cardiovascular toxicities such as atrial fibrillation and hypertension, while acalabrutinib and zanubrutinib have improved selectivity, demonstrating reduced rates of cardiovascular adverse events (AEs) compared with ibrutinib in clinical trials.
•
While there are no head-to-head clinical trials of acalabrutinib and zanubrutinib, matching-adjusted indirect comparisons (MAICs) have estimated significantly lower risk of hypertension, hemorrhage, serious AE and AE leading to dose reduction with acalabrutinib than zanubrutinib.
•
This study constructed an economic model to estimate potential cost impact to Medicare in choice of cBTKi based on differences in safety profiles for treatment of treatment-naive (TN) and relapsed/refractory (RR) patients with CLL.
•
Compared with ibrutinib, acalabrutinib was associated with cost savings of $15,478 per patient over the first year of treatment, driven by lower treatment cost ($12,076 decrease) and lower AE cost ($3402 decrease).
•
Compared with zanubrutinib, acalabrutinib was associated with cost savings of $1901 per patient over the first year of treatment, as higher acalabrutinib treatment cost ($1663 increase) was offset by lower AE cost ($3563 decrease).
•
Cost savings with acalabrutinib versus ibrutinib and zanubrutinib persisted over 3 ($25,615; $1331) and 5 ($27,635; $1053) years.
•
At current drug prices, the CLL population-level annualized cost savings to CMS with acalabrutinib would be $64 million versus ibrutinib and $2 million versus zanubrutinib.
•
Findings of this study can be used to inform Medicare national coverage determinations, reimbursement policies and value-based contracts such as through drug price negotiations under the Inflation Reduction Act, which will have significant implications for access to these cBTKi treatments for the majority of patients with CLL.
Author contributions
AS Kittai, DA Patel, J Shafrin, N Zawadzki and YK Barqawi contributed to study conception and design. J Shafrin and N Zawadzki were responsible for acquisition of data, construction of the economic model and performing the analyses. J Shafrin and N Zawadzki were responsible for drafting and revision of the manuscript. AS Kittai, DA Patel, VS Shetty, YK Barqawi and JM Rhodes contributed to interpretation of data and study findings and provided critical review of the manuscript. All authors reviewed the manuscript and gave final approval of the version to be published. All authors agree to be accountable for all aspects of the work in ensuring that questions related to the accuracy or integrity of any part of the work are appropriately investigated and resolved.
Financial disclosure
This study was supported by research funding from AstraZeneca.
Competing interests disclosure
J Shafrin and N Zawadzki are employees of FTI Consulting, a publicly traded company that provides services to various public and private entities in the healthcare and other industries that received consulting fees from AstraZeneca. DA Patel, VS Shetty and YK Barqawi are employees of AstraZeneca, a publicly traded biopharmaceutical company which develops treatments for major diseases in areas including oncology, cardiovascular, gastrointestinal, infection, neuroscience, respiratory and inflammation. AS Kittai has received research support from AstraZeneca and BeiGene, participated in advisory board or consulting with Abbvie, BMS, Eli-Lilly, Galapagos and received honoraria for speaking engagements with AstraZeneca, Eli-Lilly and Janssen. JM Rhodes has received research support from Acerta, Abbvie, Beigene, Epizyme, Janssen, Loxo Oncology, Oncternal, Pharmacyclics, Velosbios and Merck, participated in advisory board or consulting with Abbvie, AstraZeneca, ADC Therapeutics, Beigene, BMS, Epizyme, Genentech, GenMab, Loxo Oncology, Janssen, Johnson & Johnson, Morphosys, Pharmacyclics, and Pfizer, and received honoraria from Aptitude, Curio Science, MJH Life Sciences and Ideology Health. The authors have no other competing interests or relevant affiliations with any organization or entity with the subject matter or materials discussed in the manuscript apart from those disclosed.
Writing disclosure
No funded writing assistance was utilized in the production of this manuscript.
Open access
This work is licensed under the Attribution-NonCommercial-NoDerivatives 4.0 Unported License. To view a copy of this license, visit https://creativecommons.org/licenses/by-nc-nd/4.0/
Supplementary Material
File (supplementary materials.docx)
- Download
- 570.98 KB
References
Papers of special note have been highlighted as: • of interest
1.
Hallek M, Cheson BD, Catovsky D et al. iwCLL guidelines for diagnosis, indications for treatment, response assessment, and supportive management of CLL. Blood 131(25), 2745–2760 (2018).
2.
SEER*Explorer: an interactive website for SEER cancer statistics [online]. National Cancer Institute, Surveillance Research Program, Accessed 24 November 2024: https://seer.cancer.gov/statistics-network/explorer/
3.
Cancer Stat Facts: Leukemia - Chronic Lymphocytic Leukemia (CLL). Surveillance, epidemiology and end results (SEER) [online]. National Cancer Institute, Accessed 24 November 2024: https://seer.cancer.gov/statfacts/html/clyl.html
4.
Lovell AR, Jammal N, Bose P. Selecting the optimal BTK inhibitor therapy in CLL: rationale and practical considerations. Ther. Adv. Hematol. 1320406207221116577 (2022).
5.
Stephens DM. NCCN guidelines update: chronic lymphocytic leukemia/small lymphocytic lymphoma. J. Natl Compr. Canc. Netw. 21(5.5), 563–566 (2023).
6.
Byrd JC, Hillmen P, Ghia P et al. Acalabrutinib versus ibrutinib in previously treated chronic lymphocytic leukemia: results of the first randomized Phase III trial. J. Clin. Oncol. 39(31), 3441–3452 (2021).
7.
Brown JR, Eichhorst B, Lamanna N et al. Extended follow-up of ALPINE randomized phase III study confirms sustained superior progression-free survival of zanubrutinib versus ibrutinib for treatment of relapsed/refractory chronic lymphocytic leukemia and small lymphocytic lymphoma (R/R CLL/SLL). Blood 142202 (2023). https://www.beigenemedical.com/CongressDocuments/Brown_BGB-3111-305_ASH_Presentation_2023.pdf
• This extended follow-up of the ALPINE phase III trial reports updated efficacy and safety results for zanubrutinib versus ibrutinib for treatment of relapsed/refractory (RR) chronic lymphocytic leukemia/small lymphocytic lymphoma (CLL) at 39 months median follow-up.
8.
Davids MS, Telford C, Abhyankar S, Waweru C, Ringshausen I. Matching-adjusted indirect comparisons of safety and efficacy of acalabrutinib versus other targeted therapies in patients with treatment-naïve chronic lymphocytic leukemia. Leuk. Lymphoma 62(10), 2342–2351 (2021).
• This matching-adjusted indirect comparison (MAIC) study estimates the safety and efficacy of acalabrutinib compared to other targeted therapies (ibrutinib and venetoclax) for treatment-naïve (TN) patients with CLL using data for acalabrutinib from the ELEVATE-TN trial and data for targeted comparators from the RESONATE-2, iLLUMINATE and CLL-14 trials.
9.
Kittai AS, Allan JN, James D et al. An indirect comparison of acalabrutinib with and without obinutuzumab vs zanubrutinib in treatment-naive CLL. Blood Adv. 8(11), 2861–2869 (2024).
• This MAIC estimates the safety and efficacy of acalabrutinib +/- obinutuzumab compared to zanubrutinib for patients with TN CLL/small lymphocytic lymphoma using individual patient data for acalabrutinib +/- obinutuzumab from the ELEVATE-TN trial and published aggregate data for zanubrutinib from the SEQUOIA trial.
10.
Kittai A, Skarbnik A, Miranda M et al. A matching-adjusted indirect comparison (MAIC) of the efficacy and safety of acalabrutinib (acala) versus zanubrutinib (zanu) in relapsed or refractory chronic lymphocytic leukemia (RR CLL). J. Clin. Oncol. 41(Suppl.16), 7540 (2023).
• This MAIC estimatesthe safety and efficacy of acalabrutinib compared with zanubrutinib for patients with relapsed/refactory CLLusing individual patient data for acalabrutinib from the ASCEND trial and published aggregate data for zanubrutinib from the ALPINE trial.
11.
Burger JA, Barr PM, Robak T et al. Long-term efficacy and safety of first-line ibrutinib treatment for patients with CLL/SLL: 5 years of follow-up from the phase III RESONATE-2 study. Leukemia 34(3), 787–798 (2020).
• Reports updated efficacy and safety results at up to 5 years of follow-up of the RESONATE-2 phase III trial of first-line ibrutinib versus chlorambucil in CLL/small lymphocytic lymphoma.
12.
Byrd JC, Hillmen P, O'Brien S et al. Long-term follow-up of the RESONATE phase III trial of ibrutinib vs ofatumumab. Blood 133(19), 2031–2042 (2019).
13.
Mato AR, Nabhan C, Thompson MC et al. Toxicities and outcomes of 616 ibrutinib-treated patients in the United States: a real-world analysis. Haematologica 103(5), 874 (2018).
14.
Brown JR, Eichhorst B, Hillmen P et al. Zanubrutinib or ibrutinib in relapsed or refractory chronic lymphocytic leukemia. N. Engl. J. Med. 388(4), 319–332 (2023).
15.
AstraZeneca Pharmaceuticals LP. Calquence (acalabrutinib) [package insert]. U.S. Food and Drug Administration website. https://nctr-crs.fda.gov/fdalabel/services/spl/set-ids/b1409184-3267-4d8c-8f17-4e01f69828b1/spl-doc?hl=acalabrutinib Revised January 2025. Accessed 11 February 2025.
16.
Pharmacyclics LLC. Imbruvica (ibrutinib) [package insert]. U.S. Food and Drug Administration website. https://nctr-crs.fda.gov/fdalabel/services/spl/set-ids/0dfd0279-ff17-4ea9-89be-9803c71bab44/spl-doc?hl=ibrutinib Revised December 2024. Accessed 11 February 2025.
17.
Beigene USA, Inc. Brukinsa (zanubrutinib) [package insert]. U.S. Food and Drug Administration website. https://nctr-crs.fda.gov/fdalabel/services/spl/set-ids/3e08fe23-d70e-424c-bc51-1222e320f902/spl-doc?hl=zanubrutinib Revised January 2025. Accessed 11 February 2025.
18.
Guidance on the Medicare Drug Price Negotiation Program. Accessed 24 November 2024: https://www.cms.gov/files/document/medicare-drug-price-negotiation-draft-guidance-ipay-2027-and-manufacturer-effectuation-mfp-2026-2027.pdf
19.
Sharman JP, Egyed M, Jurczak W et al. Efficacy and safety in a 4-year follow-up of the ELEVATE-TN study comparing acalabrutinib with or without obinutuzumab versus obinutuzumab plus chlorambucil in treatment-naïve chronic lymphocytic leukemia. Leukemia 36(4), 1171–1175 (2022).
• Reports the 4-year follow-up results from the ELEVATE-TN phase III trial assessing the efficacy and safety of acalabrutinib, alone or with obinutuzumab, compared with chlorambucil-obinutuzumab for treatment of patients with TN CLL.
20.
Seymour JF, Byrd JC, Ghia P et al. Detailed safety profile of acalabrutinib vs ibrutinib in previously treated chronic lymphocytic leukemia in the ELEVATE-RR trial. Blood 142(8), 687–699 (2023).
• This post hoc analysis of the ELEVATE-RR trial compared the safety profiles of acalabrutinib and ibrutinib for treatment of RR CLL at approximately 41 months median follow-up.
21.
Coutre SE, Byrd JC, Hillmen P et al. Long-term safety of single-agent ibrutinib in patients with chronic lymphocytic leukemia in 3 pivotal studies. Blood Adv. 3(12), 1799–1807 (2019).
22.
Shadman M, Munir T, Robak T et al. Zanubrutinib vs bendamustine + rituximab in patients with treatment-naive chronic lymphocytic leukemia/small lymphocytic lymphoma: extended follow-up of the SEQUOIA study. (2023). https://www.beigenemedical.com/CongressDocuments/Shadman_BGB-3111-304_ICML_Presentation_2023.pdf
• This extended follow-up of the SEQUOIA phase III trial reports updated efficacy and safety results for zanubrutinib versus bendamustine + rituximab in patients with TN CLL/small lymphocytic lymphoma at approximately 4 years follow-up.
23.
Alrawashdh N, McBride A, Erstad B, Sweasy J, Persky DO, Abraham I. Cost-effectiveness and economic burden analyses on all first-line treatments of chronic lymphocytic leukemia. Value Health 25(10), 1685–1695 (2022).
24.
Barnes JI, Divi V, Begaye A et al. Cost-effectiveness of ibrutinib as first-line therapy for chronic lymphocytic leukemia in older adults without deletion 17p. Blood Adv. 2(15), 1946–1956 (2018).
25.
Vreman RA, Geenen JW, Hövels AM et al. Phase I/II clinical trial-based early economic evaluation of acalabrutinib for relapsed chronic lymphocytic leukaemia. App. Health Econ. Health Pol. 17(6), 883–893 (2019).
26.
Sorensen S, Peng S, Dorman E et al. The cost-effectiveness of ibrutinib in treatment of relapsed or refractory chronic lymphocytic leukemia. Health Econ. Outcome Res. 2(121), 2 (2016).
27.
Munir T, Gaitonde P, Waweru C. Cost-effectiveness of acalabrutinib monotherapy compared with chlorambucil plus obinutuzumab for previously untreated chronic lymphocytic leukemia. Blood 136(Suppl. 1), 13–14 (2020).
28.
Chatterjee A, Shapouri S, Manzoor BS et al. Cost-effectiveness of a 12-month fixed-duration venetoclax treatment in combination with obinutuzumab in first-line, unfit chronic lymphocytic leukemia in the United States. J. Manag. Care Specialty Pharm. 27(11), 1532–1544 (2021).
29.
Ghosh N, Manzoor BS, Fakhri B et al. Real-world comparative effectiveness of venetoclax-obinutuzumab versus Bruton tyrosine kinase inhibitors for frontline chronic lymphocytic leukaemia. Br. J. Haematol. 205(4), 1395–1403 (2024).
30.
Huntington SF, Manzoor BS, Puckett JT et al. Real-world adherence and discontinuation among Medicare beneficiaries initiating venetoclax vs. BTKis in relapsed/refractory chronic lymphocytic leukemia. Leuk. Lymphoma 64(14), 2316–2323 (2023).
31.
Archibald WJ, Barcellos A, Ambrose J et al. Real-world first-line treatment and outcomes of patients with chronic lymphocytic leukemia (CLL) treated with Bruton tyrosine kinase inhibitor (BTKi) or B-cell lymphoma 2 (BCL2) therapy. Blood 140(Suppl. 1), 4142–4143 (2022).
32.
Kabadi SM, Goyal RK, Nagar SP, Kaye JA, Davis KL. Treatment patterns, adverse events, and economic burden in a privately insured population of patients with chronic lymphocytic leukemia in the United States. Cancer Med. 8(8), 3803–3810 (2019).
33.
Wong W, Yim YM, Kim A et al. Assessment of costs associated with adverse events in patients with cancer. PLOS One 13(4), e0196007 (2018).
34.
RED BOOK Online. IBM Micromedex [database online]. Truven Health Analytics/IBM Watson Health. (2024). Accessed 15 July 2024. https://www.micromedexsolutions.com
35.
Liu S, Yang K, Xiao Y, Gani R, Xue M, Tang B. EE65 budget impact of zanubrutinib for treatment of relapsed or refractory chronic lymphocytic leukemia in the United States. Value Health 25(12), S65–S66 (2022). https://www.ispor.org/docs/default-source/euro2022/liu-et-alispor-eu-2022-rr-cll-bimdraft-posterfinal-oct-21-pdf.pdf?sfvrsn=f3129e53_0
36.
Mato A, Jahnke J, Li P et al. Real-world treatment and outcomes among older adults with chronic lymphocytic leukemia before the novel agents era. Haematologica 103(10), e462–e465 (2018).
37.
Goyal RK, Nagar SP, Kabadi SM, Le H, Davis KL, Kaye JA. Overall survival, adverse events, and economic burden in patients with chronic lymphocytic leukemia receiving systemic therapy: real-world evidence from the medicare population. Cancer Med. 10(8), 2690–2702 (2021).
38.
The prices that commercial health insurers and Medicare pay for hospitals' and physicians' services [Online]. Congressional Budget Office (2022). Accessed 31 December 2024: https://www.cbo.gov/system/files/2022-01/57422-medical-prices.pdf
39.
Feldman WB, Rome BN, Raimond VC, Gagne JJ, Kesselheim AS. Estimating rebates and other discounts received by Medicare Part D. JAMA Health Forum 2(6), e210626–e210626 (2021).
40.
Consumer Price Index for all urban consumers: Medical Care Commodities in U.S. City Average [CUUR0000SAM1] [online]. U.S. Bureau of Labor Statistics (2024). Accessed 4 March 2024: https://fred.stlouisfed.org/series/CUUR0000SAM
41.
Roeker LE, DerSarkissian M, Ryan K et al. Real-world comparative effectiveness of acalabrutinib and ibrutinib in patients with chronic lymphocytic leukemia. Blood Adv. 7(16), 4291–4301 (2023).
42.
Sanders GD, Neumann PJ, Basu A et al. Recommendations for conduct, methodological practices, and reporting of cost-effectiveness analyses: second panel on cost-effectiveness in health and medicine. JAMA 316(10), 1093–1103 (2016).
43.
Raymakers AJ, Kesselheim AS, Rome BN. Medicare price negotiation: the example of ibrutinib. Health Affairs Forefront (2023).
44.
Hernandez I, Cousin EM, Wouters OJ, Gabriel N, Cameron T, Sullivan SD. Price benchmarks of drugs selected for Medicare price negotiation and their therapeutic alternatives. J. Manag. Care Specialty Pharm. 30(8), 762–772 (2024). https://www.jmcp.org/doi/abs/10.18553/jmcp.2024.24153
Information & Authors
Information
Published In
Copyright
© 2025 AstraZeneca. This work is licensed under the Attribution-NonCommercial-NoDerivatives 4.0 Unported License
History
Received: 21 March 2025
Accepted: 5 June 2025
Published online: 23 June 2025
Keywords:
Topics
Authors
Metrics & Citations
Metrics
Article Usage
Article usage data only available from February 2023. Historical article usage data, showing the number of article downloads, is available upon request.
Citations
How to Cite
Cost impact of Bruton’s tyrosine kinase inhibitor selection in Medicare patients with chronic lymphocytic leukemia. (2025) Journal of Comparative Effectiveness Research. DOI: 10.57264/cer-2025-0035
Export citation
Select the citation format you wish to export for this article or chapter.
Citing Literature
- Mihaela Andreescu, Sorin Ioan Tudorache, Cosmin Alec Moldovan, Adina-Diana Moldovan, Daniel Cochior, Viola Popov, Bogdan Andreescu, Diana Ionescu, Monica-Daniela Padurariu-Covit, The Immunologic Paradox of BTK Inhibitors in Chronic Lymphocytic Leukemia: Selectivity, Hypogammaglobulinemia, and Infection Risk, Cancers, 10.3390/cancers18101621, 18, 10, (1621), (2026).
- Fotis Demetriou, Maria Anagnostouli, CAR T-Cell Immunotherapy in Neuroautoimmune Diseases: Focus on the Central Nervous System, Biomedicines, 10.3390/biomedicines14020296, 14, 2, (296), (2026).