Matching-adjusted indirect comparison via a polynomial-based non-linear optimization method
Publication: Journal of Comparative Effectiveness Research
Abstract
Aim: To demonstrate the potential of fourth-order polynomials within a non-linear optimization framework for matching-adjusted indirect comparison (MAIC). Materials & methods: Simulated individual patient data were reweighted via fourth-order polynomials (polyMAIC) to match aggregate-level data across multiple baseline characteristics. The polyMAIC approach employed pre-specified matching tolerances and maximum allowable weights. Matching performance against aggregate-level targets was assessed, and also compared against the current industry-standard MAIC approach (Signorovitch). Results: The polyMAIC method matched aggregate-level targets within pre-specified tolerances. Effective sample sizes were either similar to or somewhat higher than those obtained from the Signorovitch method. Performance gains from polyMAIC tended to increase as matching complexity increased. Conclusion: PolyMAIC incorporates greater flexibility than the industry-standard MAIC approach and demonstrates matching potential.
Background
It is of vital importance to patients, treating physicians, regulators and payers that relative effectiveness of treatments can be reliably estimated. Evidence of comparative effectiveness is arguably best obtained via head-to-head randomised controlled trials. However, this level of direct evidence may not necessarily exist. In the absence of head-to-head data, treatments can be indirectly compared across studies, for example, treatment X in study A versus treatment Y in study B. Here, researchers are often faced with two important challenges when trying to conduct these indirect treatment comparisons (ITCs). Firstly, the trials might differ across important patient characteristics, such as those which are predictors of disease prognosis or treatment effect modifiers. These differences preclude the application of simple ITC techniques, such as that of Bucher et al. [1]. Secondly, researchers will usually lack access to the individual patient data (IPD) for the comparator treatment. This in turn precludes the use of standard statistical techniques that adjust for baseline differences between studies, such as a propensity score analysis. Matching-adjusted indirect comparison (MAIC) methods can often provide a remedy to such limitations.
Current MAIC approaches
A range of statistical techniques have been developed that attempt to address these challenges, such as extensions of network meta-analysis [2], simulated treatment comparison [3] and MAIC [4,5]. MAIC methodology typically aims to reweight IPD from the experimental treatment in order to match the distribution at the aggregate level (typically the mean and standard deviation [SD]) of baseline factors in the comparator arm of a target study. Once a set of IPD weights has been obtained, weighted analyses of trial outcomes on the experimental arm are then conducted and the results compared with the aggregate-level study outcomes of the target study.
Various MAIC approaches have been developed [6–10], but it is the approach first published by Signorovitch et al. [6] that has been adopted by reimbursement authorities [5]. This approach is now virtually synonymous with the concept of MAIC for most researchers. It is notable that the approach of Signorovitch has seen little improvement since its original publication. This is arguably due to its considerable success in matching target measures of location and spread across a wide range of practical and theoretical settings [5,11–14]. Entropy balancing [8] is another method-of-moments-based technique that has also shown its usefulness [15]. However, recent work [16] would suggest that entropy balancing is methodologically very similar to the Signorovitch approach. An alternative method-of-moments-based approach has recently been developed by Jackson et al. [7] and this appears to improve upon the Signorovitch approach. Simpler approaches to MAIC that reweight IPD using post-stratification techniques have also been developed [10,17]. These approaches have strong parallels with well-established survey sampling techniques such as raking [18], where sample survey results are reweighted in accordance with overall population demographics. These post-stratification approaches to MAIC, while easily applied and readily understood, are limited to the matching of categorical baseline patient characteristics – a limitation which has likely restricted their application within comparative effectiveness research.
Limitations of current MAIC approaches
The Signorovitch, entropy-balancing and Jackson et al. MAIC approaches are based on method-of-moments, with the aim of matching IPD to aggregate-level data (ALD) on the central moments of the baseline characteristic distributions – typically the first (mean) and second (variance) moments. As such, these methods are somewhat restricted in their ability to match ALD on non-central moments such as the median and other percentile-based summary measures, for example, interquartile range (IQR). Researchers will typically substitute the median for the mean in these instances. However, while this interchange is entirely justified when dealing with symmetric distributions, it could potentially lead to poor matching if the underlying distributions are skewed.
An important limitation of current MAIC methods is that none formally account for the trade-off between the accuracy of the match and the precision that the subsequent weighted analyses will achieve. Matching accuracy can be easily assessed by comparing the weighted baseline characteristics of the IPD with the baseline characteristics of the ALD. Precision is commonly assessed using the (approximate) effective sample size (ESS) [6,19], calculated as , where the ith patient has an estimated weight wi. Note that the sum of the weights is constrained to be n (the number of patients) and all weights are non-negative. The effective sample size (ESS) is at a maximum when all wi are equal to 1 (ESS = n), that is, each patient weights equally in the analysis and there is no loss of information due to reweighting.
The set of estimated weights that achieve a match between a weighted IPD summary statistic against an ALD summary statistic is certainly not unique. For example, take a very simple case where four patients have baseline responses of 2, 3, 4 and 7. Suppose a researcher wished to reweight this IPD in order to match a baseline ALD target of a mean of 4.3 and an SD of 1.8. How are 4 weights (w1, w2, w3, w4) to be chosen? One approximate solution exists with the following set of weights: w1 = 0.19, w2 = 1.23, w3 = 1.66 and w4 = 0.92, leading to an ESS of 3.1. However, another solution exists with an alternative set of weights: w1 = 0.57, w2 = 0.17, w3 = 2.38 and w4 = 0.88, leading to an ESS of 2.4. The latter solution is to be avoided, as it leads to considerable loss of information and weights the ‘third’ patient very highly.
Information loss within a MAIC is to be expected. Indeed, a high ESS in relation to the observed sample size in the IPD would make the application of MAIC somewhat redundant – an unweighted analysis would provide virtually the same result. Unfortunately, it is not uncommon for MAICs to estimate ESSs at relatively small proportions of the original sample size [11]. MAIC approaches should ideally aim to match baseline characteristics within certain tolerances while retaining as much information as possible. The use of matching tolerances, and the trade-off with information retention, has been previously described [20], but much current MAIC methodology does not specifically reflect this tension.
In tandem with the problem of low ESSs are patients with large estimated weights (also called a lack of weight ‘stability’ [20]). These patients pose additional challenges, especially if they are outliers and exert high influence/leverage in the outcome analyses of the weighted IPD. Propensity-score-based methods allow for the reduction in the influence of patients with large weights via techniques such as stratification or trimming. Solutions to this problem have yet to be fully integrated within an MAIC framework, though estimated weights can be trimmed post hoc[8].
Methods
Suppose we wish to match IPD from n patients to ALD on baseline age, where ai is the age of the ith patient (i = 1 to n) and where we have a target ALD mean of . The primary goal is to obtain a set of weights (wi) such that the following conditions apply [20]:
1.
(weighted IPD mean equal to the target mean);
2.
(weights sum to n, i.e. mean weight is one);
3.
wi≥0 (no negative weights).
Matching across multiple baseline characteristics requires extensions of condition 1, but conditions 2 and 3 remain the same. Similar logic applies when we aim to match both means and variances. Secondary goals of this weight estimation process, though often not formally stated, are arguably:
4.
(maximise ESS);
5.
wi≤wmax (restrict weights below a pre-specified maximum).
Similar alternatives to condition 4 have been considered, such as the minimisation of weight entropy [8] and the minimisation of the variance of the weights [20], the latter being essentially the same as ESS maximisation. Condition 5 clearly requires that wmax is some value considerably greater than 1 but, at most, only a relatively small proportion of the IPD sample size. Mirroring propensity score guidance, it might seem reasonable to fix wmax as some fraction (e.g., 5%) of n.
Fourth-order polynomial-modified matching-adjusted indirect comparison
The use of polynomial functions within MAIC research was introduced by Regnier et al. [21] as part of an examination of a range of ITC approaches within an ophthalmological setting. The underlying basis for their MAIC approach was to shrink, stretch and warp distributions of baseline characteristics such that the summary statistics of the altered distribution matched the summary statistics of the target distribution. Their weight optimization MAIC method was subsequently modified, extended and formalised as part of this current investigation (Fourth-order polynomial-modified matching-adjusted indirect comparison [polyMAIC]).
The polyMAIC approach proceeds via the following steps:
1.
Standardise each of j = 1 to M baseline characteristics across i = 1 to n subjects (aij) to lie within a [0,1] range, e.g. xij = (aij - min[ai])/(max[ai] - min[ai]);
2.
Define ;
3.
Calculate weights for each patient as ;
4.
Using the wi, calculate weighted summary statistics of the aij as Sjk, where Sjk is the kth summary statistic (e.g., mean, median, proportion, SD, IQR, 90th percentile, etc.) of the jth baseline characteristic;
5.
Select b01, b11, b21, b31, b41, b12, b22, b32, b42, …, b1M, b2M, b3M, b4M in step 2) above such that:
a.
the weighted summary statistics fall within certain tolerance limits (εjk) of the ALD summary statistics Tjk, e.g. , where εjk >0 and;
b.
this maximises the ESS and;
c.
where wi ≤ wmax (optional).
It is worth noting the following:
•
Steps 3 and 5 are the main departures from the weight optimization [21] approach;
•
Step 5 is essentially a non-linear optimization challenge, subject to the applicable constraints. The incorporation of pre-specified matching tolerances within a reweighting framework has previously been developed [20];
•
The use of the functions in steps 2 and 3 provides notable differences when compared with the methods of Signorovitch (which assumes that weights are a simple exponential function of baseline characteristics) and that of Jackson et al. [7] (which assumes that weights are a linear function of baseline characteristics);
•
The data transformation detailed in step 1 is not necessary but aids computation;
•
The polynomial function in step 2 can be reduced to yij = b0j + b1j xij for binomially distributed baseline characteristics (e.g., proportion of females);
•
The b0j can be dropped for j = 2,…, M (as only one ‘intercept’ term is needed).
The matching tolerances (i.e., the εjk in step 5) should be chosen based on a number of potential considerations. For example, they could reflect detection thresholds, minimally important clinical differences or some fraction of standardised differences. It might be prudent to match some baseline characteristics more closely than others, depending on their relative predictive and/or treatment-modifying importance. Furthermore, matching on measures of central location (e.g., means, medians) might be more critical than matching measures of spread (e.g., variances, ranges).
IPD generation
IPD were simulated to compare the relative performance of the polyMAIC approach with that of Signorovitch. Table 1 summarises the distributions of the five baseline characteristics. A variety of distribution types were used to ensure a suitable mix of continuous, categorical and count data. Note that the pain scale data was rounded to the nearest whole number to reflect a typical Likert-type scale. Four different pseudo-IPD scenarios were developed, with an increasing number of baseline characteristics included in each (Table 2). Correlations between baseline characteristics are arguably present in most clinical studies, for example, patient age is often positively correlated with time since diagnosis, which in turn can be correlated with disease severity. Therefore, for each scenario, we incorporated correlations between each of the characteristics (Table 2) via simulations of multivariate normal distributions. The data was then transformed to obtain the desired baseline distribution types. The data that supports the findings of this study is available from the corresponding author upon request.
| Baseline characteristic | Distribution type | Parameters/Distribution |
|---|---|---|
| Age (years) | Normal | mean = 50; SD = 10 |
| Female (proportion) | Binomial | p = 0.6 |
| Pain scale (Likert 0–10) | Uniform (negative skewed) | 10×Uniform(0,1)0.4 |
| Time since diagnosis (years) | Log-normal | eNormal(2,0.5) |
| Disease severity (prior episodes, n) | Negative binomial | p = 0.8; k = 5 |
Normal(x,y): normal distribution with mean (x) and SD (y).
SD: Standard deviation.
| Scenario | Sample size | Spearman's rank correlation | |||||
|---|---|---|---|---|---|---|---|
| Age | Female | Pain | Disease duration | Prior events (n) | |||
| A | n = 500 | Age | 1 | 0.06 | |||
| Gender | – | 1 | |||||
| B | n = 250 | Age | 1 | -0.05 | 0.27 | ||
| Gender | – | 1 | -0.07 | ||||
| Pain | – | – | 1 | ||||
| C | n = 250 | Age | 1 | -0.06 | 0.30 | 0.31 | |
| Gender | – | 1 | -0.07 | 0.13 | |||
| Pain | – | – | 1 | 0.47 | |||
| Disease duration | – | – | – | 1 | |||
| D | n = 100 | Age | 1 | -0.09 | 0.19 | 0.30 | -0.26 |
| Gender | – | 1 | 0.04 | 0.16 | -0.16 | ||
| Pain | – | – | 1 | 0.55 | 0.16 | ||
| Disease duration | – | – | – | 1 | -0.25 | ||
| Prior events (n) | – | – | – | – | 1 | ||
Scenarios
Note that the four IPD-generating scenarios were constructed to make the MAIC process increasingly challenging, with a greater number of baseline characteristics, smaller sample sizes, higher correlations between characteristics and ALD targets further away from the unweighted IPD summary statistics. Due to the theoretical limitations of the Signorovitch method in explicitly incorporating non-central moments (e.g., medians) into the matching algorithm, ALD targets were specified as means, SDs and proportions. ‘Narrow’ and ‘wide’ matching tolerance limits and pre-specified maximum IPD weights were used when applying the polyMAIC approach (see Table 3). We set the narrow polyMAIC tolerances to be well below the typical rounding errors associated with published ALD summary statistics. The ability of each MAIC method to effectively reweight the IPD was assessed via the proximity of the weighted IPD summary statistics to the ALD target summary statistics. Maximum weights and ESSs were also calculated and compared. The relationship between the IPD weights obtained from the two MAIC approaches was assessed graphically and via Spearman rank-order correlations.
| Scenario | Source | Baseline characteristic | Matching performance | |||||||||
|---|---|---|---|---|---|---|---|---|---|---|---|---|
| Age (years) | Female % | Pain | Disease duration (years) | Prior events (n) | ESS | Maximum weight | ||||||
| Mean | SD | Mean | SD | Mean | SD | Mean | SD | |||||
| A | IPD | 49.4 | 8.0 | 60.6 | – | – | – | – | – | – | 500 | |
| ALD target | 55.0 | 6.0 | 65.0 | – | – | – | – | – | – | |||
| Signorovitch | 55.0 | 6.0 | 65.0 | – | – | – | – | – | – | 323.7 | 2.5 | |
| PolyMAIC (narrow)† | 55.0 | 6.0 | 65.0 | – | – | – | – | – | – | 325.9 | 3.0 | |
| PolyMAIC (wide)‡ | 54.0 | 6.3 | 64.0 | – | – | – | – | – | – | 371.1 | 2.4 | |
| B | IPD | 50.9 | 7.6 | 64.8 | 6.5 | 2.1 | – | – | – | – | 250 | |
| ALD target | 46.3 | 5.8 | 57.9 | 7.2 | 1.8 | – | – | – | – | |||
| Signorovitch | 46.3 | 5.8 | 57.9 | 7.2 | 1.8 | – | – | – | – | 127.2 | 5.0 | |
| PolyMAIC (narrow)† | 46.3 | 5.8 | 57.9 | 7.2 | 1.8 | – | – | – | – | 132.1 | 4.2 | |
| PolyMAIC (wide)‡ | 47.3 | 6.3 | 58.9 | 7.0 | 1.8 | – | – | – | – | 169.3 | 2.9 | |
| C | IPD | 50.5 | 7.6 | 60.4 | 6.7 | 2.0 | 8.5 | 5.3 | – | – | 250 | |
| ALD target | 49.5 | 7.2 | 68.3 | 7.5 | 1.5 | 6.1 | 3.8 | – | – | |||
| Signorovitch | 49.5 | 7.2 | 68.3 | 7.5 | 1.5 | 6.1 | 3.8 | – | – | 75.5 | 11.0 | |
| PolyMAIC (narrow)† | 49.5 | 7.2 | 68.3 | 7.5 | 1.5 | 6.1 | 3.8 | – | – | 82.1 | 8.1 | |
| PolyMAIC (wide)‡ | 49.9 | 7.5 | 67.4 | 7.3 | 1.4 | 6.3 | 3.6 | – | – | 114.2 | 5.0 | |
| D | IPD | 51.0 | 7.8 | 64.0 | 6.9 | 1.9 | 8.6 | 4.7 | 2.4 | 3.0 | 100 | |
| ALD target | 57.0 | 7.2 | 56.8 | 7.2 | 1.3 | 12.3 | 6.4 | 1.8 | 1.9 | |||
| Signorovitch | 57.0 | 7.2 | 56.8 | 7.2 | 1.3 | 12.3 | 6.4 | 1.8 | 1.9 | 14.2 | 19.4 | |
| PolyMAIC (narrow)† | 57.0 | 7.2 | 56.8 | 7.2 | 1.3 | 12.3 | 6.4 | 1.8 | 1.9 | 15.3 | 17.7 | |
| PolyMAIC (wide)§ | 55.0 | 6.7 | 58.8 | 7.2 | 1.8 | 11.3 | 5.4 | 1.9 | 1.7 | 41.4 | 9.4 | |
†
Tolerances: age (mean 0.005; SD 0.005); female (0.05%); pain (mean 0.005; SD 0.005); diagnosis (mean 0.01; SD 0.01); prior events (mean 0.01; SD 0.01).
‡
Tolerances: age (mean 1; SD 0.5); female (1%); pain (mean 0.2, SD 0.1); diagnosis (mean 0.2; SD 0.2). Maximum weight: 5.
§
Tolerances: age (mean 2; SD 0.5); female (2%); pain (mean 1.0; SD 0.5); diagnosis (mean 1.0; SD 1.0); prior events (mean 0.25, SD 0.25). Maximum weight: 10.
ALD: Aggregate-level data; ESS: Effective sample size; IPD: Individual patient data; MAIC: Matching-adjusted indirect comparison; polyMAIC: Fourth-order polynomial-modified matching-adjusted indirect comparison; SD: standard deviation.
Implementation
Multivariate normal data was simulated using the PROC SIMNORMAL procedure in SAS/STAT [22]. The Signorovitch MAIC approach was applied using modified R code as per NICE Technical Support Document [4,23]. The polyMAIC approach was applied using the PROC OPTMODEL procedure in SAS/OR [22]. Examples of the polyMAIC SAS code are included in Supplementary Material 1.
Results
Table 3 presents the weighted IPD summary statistics for the polyMAIC (using narrow and wide tolerances) and Signorovitch methods, along with the unweighted IPD and ALD targets, of each baseline characteristic for each of the four scenarios.
Narrow tolerances
Matching performance was first compared between the Signorovitch and polyMAIC methods, where the latter MAIC method utilised narrow matching tolerances. Both methods achieved good agreement between the summary statistics of their weighted IPD when compared with the ALD targets. The polyMAIC approach showed marginal relative improvements in the ESS over the Signorovitch method (Table 3), ranging from around 1% (325.9 vs 323.7, scenario A) to 9% (82.1 vs 75.5, scenario C). Maximum weights were quite similar between the two MAIC approaches, with differences (polyMAIC vs Signorovitch) ranging from 0.5 higher (3.0 vs 2.5, scenario A) to 2.9 lower (8.1 vs 11.0, scenario C). Note that maximum allowable weights were not pre-specified in the polyMAIC approach when narrow tolerances were used.
Wide tolerances
The use of wider matching tolerances in the polyMAIC approach led to marked improvements in ESS and maximal weights, albeit at the cost of a reduction in matching performance. Increases in ESS over the Signorovitch approach ranged from 15% (371.1 vs 323.7, scenario A) to 192% (41.4 vs 14.2, scenario D). Mirroring the trend observed using narrow tolerances, improvements in ESS from the polyMAIC approach appeared to be larger with increased matching complexity. Maximum weights varied considerably across the two MAIC approaches, where differences (polyMAIC vs Signorovitch) ranged from 0.1 lower (2.4 vs 2.5, scenario A) to 10.0 lower (9.4 vs 19.4, scenario D). A maximum pre-specified weight of 5 was applied in the polyMAIC approach for scenarios A, B and C – the maximum IPD weights ‘obtained’ were 2.4, 2.9 and 5.0 (respectively). In scenario D the polyMAIC approach could not identify a set of IPD weights with a pre-specified maximum weight of 5, so this was subsequently relaxed to 10 (a maximum weight of 9.4 was obtained).
It is worth noting that the ESSs obtained from either of the two MAIC methods ranged between 14% and 74% of the original IPD sample sizes, highlighting a considerable amount of information loss.
Figures 1 & 2 present the Spearman correlation coefficients of the sets of IPD weights between the two MAIC methods for each of the four scenarios. Unsurprisingly, given that these methods are trying to achieve similar goals, the two methods gave rise to moderately-to-highly positively correlated weights (correlations ranged from 0.50 to 0.99). Correlations tended to weaken as the complexity of the matching task increased but remained similar between the two methods regardless of the polyMAIC matching tolerances. The fourth-order polynomial coefficients estimated as part of the polyMAIC methodology are presented in Table 4.
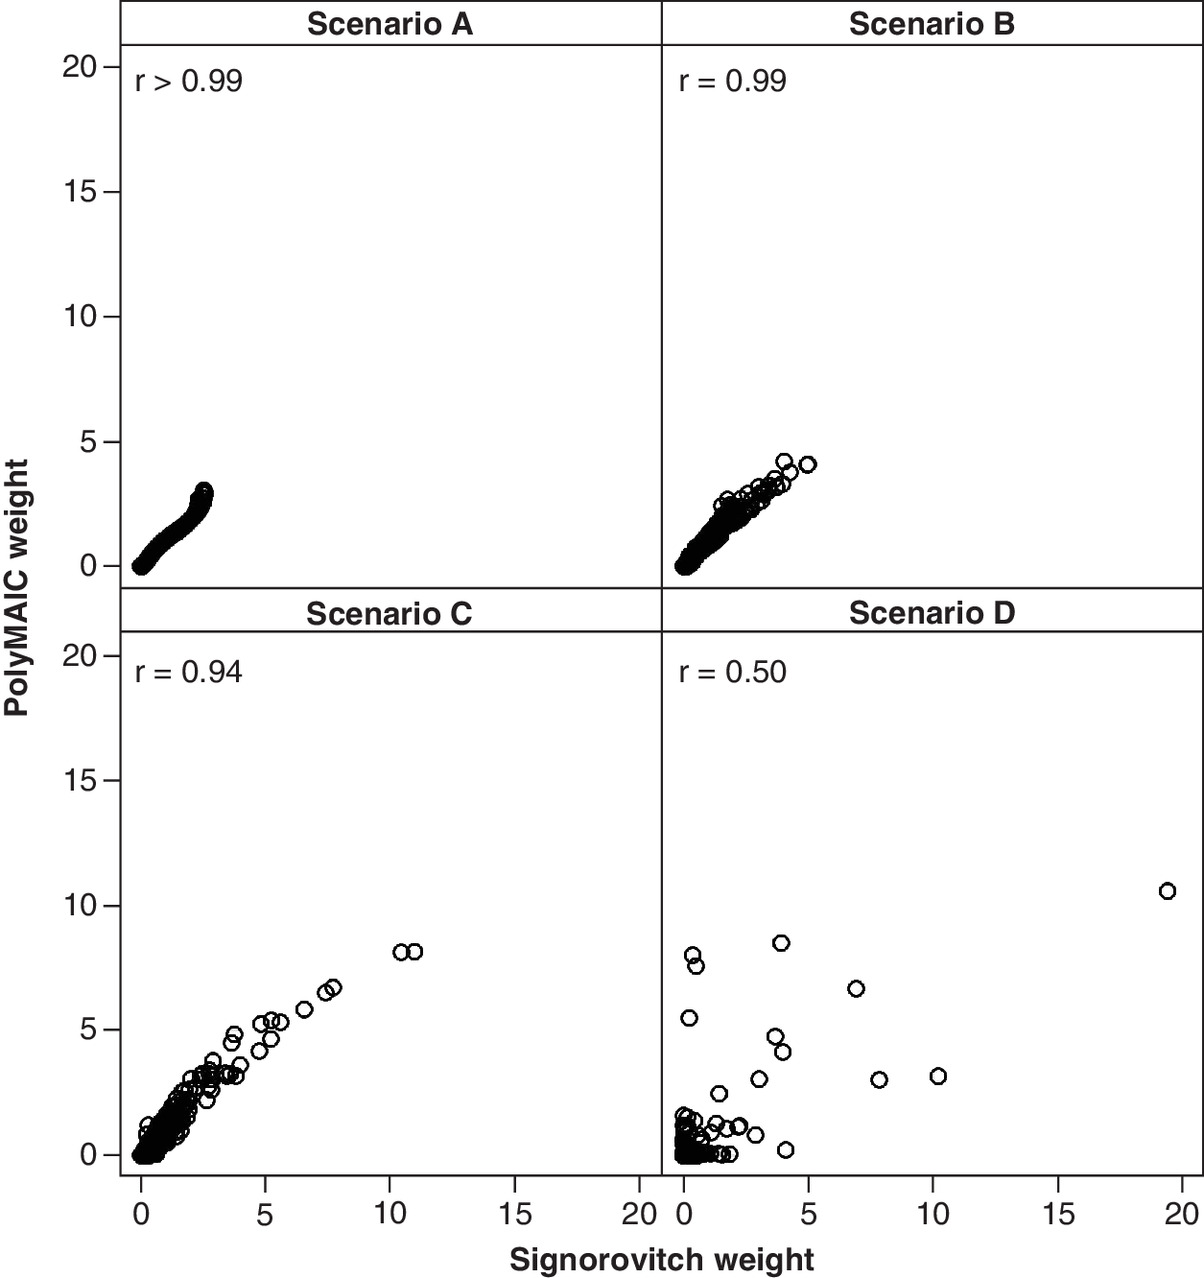
Figure 1. Scatter plot of individual patient data weights for fourth-order polynomial-modified matching-adjusted indirect comparison (narrow tolerances) versus Signorovitch.
PolyMAIC: Fourth-order polynomial-modified matching-adjusted indirect comparison; r: Spearman correlation.

Figure 2. Scatter plot of individual patient data weights for fourth-order polynomial-modified matching-adjusted indirect comparison (wide tolerances) versus Signorovitch.
PolyMAIC: Fourth-order polynomial-modified matching-adjusted indirect comparison; r: Spearman correlation.
| Scenario | Baseline characteristic | Narrow tolerances | Wide tolerances | ||||||||
|---|---|---|---|---|---|---|---|---|---|---|---|
| b0j | b1j | b2j | b3j | b4j | b0j | b1j | b2j | b3j | b4j | ||
| A | Age | -20.96 | 103.90 | -199.22 | 175.67 | -58.38 | -15.53 | 79.42 | -157.08 | 142.84 | -48.91 |
| Female | – | 0.10 | – | – | – | – | 0.08 | – | – | – | |
| B | Age | 41.86 | 30.39 | -134.65 | 240.54 | -157.20 | -77.30 | 9.83 | -46.23 | 85.39 | -58.92 |
| Female | – | -0.19 | – | – | – | – | -0.21 | – | – | – | |
| Pain | -43.89 | -3.40 | 8.83 | -4.38 | 0.46 | 73.83 | 13.01 | -20.96 | 17.76 | -5.77 | |
| C | Age | 47.29 | -20.31 | 46.58 | -46.12 | 16.37 | -7.28 | -7.64 | 17.03 | -16.98 | 6.52 |
| Female | – | 0.66 | – | – | – | – | 0.59 | – | – | – | |
| Pain | – | -62.45 | 152.03 | -138.56 | 44.97 | – | 171.33 | -327.51 | 283.71 | -91.60 | |
| Diagnosis | – | -588.61 | 3244.10 | -7305.04 | 4735.70 | – | -398.34 | 2182.00 | -4904.69 | 3177.85 | |
| D | Age | 20.73 | -83.00 | 94.96 | 25.51 | -52.03 | 22.75 | -52.73 | 146.56 | -160.71 | 63.52 |
| Female | – | -0.75 | – | – | – | – | -0.18 | – | – | – | |
| Pain | – | 26.54 | -68.44 | 116.38 | -63.46 | – | 15.91 | -24.76 | 18.51 | -5.71 | |
| Diagnosis | – | -50.04 | 81.88 | 127.27 | -232.61 | – | -294.09 | 1407.27 | -2813.60 | 2045.20 | |
| Prior events (n) | – | -80.72 | 151.03 | 16.46 | -119.80 | – | -0.30 | -1.83 | 3.12 | -0.30 | |
Discussion
A typical MAIC analysis will generally focus upon matching ‘closeness’ (i.e., the distance between reweighted IPD and target moments), a goal which current MAIC methods typically achieve. However, the impact on the final weighted analysis arising from the information loss of a low ESS and potential bias arising from patients with high individual weights warrants more consideration. The polyMAIC approach demonstrated increases in ESS between 1% to 9% over the standard Signorovitch approach data when strict matching criteria were applied. Substantially larger increases in ESS were obtained with wider matching tolerances. Importantly, in no scenario did the polyMAIC approach identify a set of IPD weights with a lower ESS compared with the Signorovitch approach. This is likely due in part to the greater underlying flexibility of the polyMAIC approach. Improvements in ESS, even arguably marginal ones, are of value given that they could lead to more precise estimates of comparative effectiveness.
Considerable reductions in maximum weights using the polyMAIC approach were also observed, though it is difficult to ascertain the impact of these in terms of bias reduction of a weighted ITC analysis. The challenges posed by patients with high estimated weights have arguably not been sufficiently highlighted, nor resolved, within MAIC methodology. Large weights will invariably lead to lower ESS and hence greater variability associated with ITC estimates, and there is clearly a high risk of bias when a small number of (highly weighted) patients dominate an analysis. Unlike other MAIC methods, the polyMAIC approach allows for pre-specified maximum weights to be incorporated during weight optimisation. There is a trade-off here though, as a lower allowable maximum weight might force the use of wider matching tolerances.
The ability for MAIC researchers to match disproportionally across multiple baseline characteristics has considerable value. In some settings we might reasonably expect researchers to have some knowledge about the relative importance of each baseline characteristic (e.g., disease severity might be more prognostic of the outcome than gender). In these situations, it would seem prudent to match on some characteristics more closely than others. There is perhaps little benefit in closely matching on a less important characteristic if that ultimately leads to substantial reductions in ESS and/or patients with high estimated weights. Similarly, matching on central location (e.g., mean) might be considered more crucial than matching on spread (e.g., SD). The polyMAIC approach provides flexibility in this regard. Implementation of these relative importances within current method-of-moments-based MAIC methods is likely to be possible, though is arguably not a natural fit within their framework.
The tolerances used here were symmetrical around the ALD targets. While this symmetry will be suitable in most settings, there might be circumstances where greater leeway could be given to exceeding an ALD target (or vice versa). For example, suppose an initial analysis of the IPD showed a plateauing age-treatment effect on an outcome, such that the treatment effect increased more slowly across older patients. Here, the researcher may wish that the weighted-IPD mean age lie within -1 to +3 years (say) of the target ALD mean age. The polyMAIC methodology can readily incorporate these types of asymmetric bounds.
It is not uncommon for published articles to present non-central moments (e.g., medians, IQRs) on continuous, skewed baseline characteristics. The difference between the use of the median, as opposed to the mean, of an important characteristic might be crucial in some MAIC situations. Current MAIC methods cannot incorporate non-central moments as ALD targets (researchers typically treat a median as a mean and proceed accordingly). We did not examine matching on these types of summary statistics within our data simulation, as it would be arguably unfair to compare matching performance between the two methods when the Signorovitch approach is based on central moments.
Limitations
Many limitations of the alternative MAIC approaches also apply here. PolyMAIC cannot match against a baseline characteristic that is not reported at the aggregate level – this is especially a problem with unanchored ITCs [12,13]. Limited overlap in the distributions of important baseline characteristics between IPD and ALD will invalidate the use of MAIC. Indeed, specifying small tolerances in cases where there is poor overlap between the IPD and ALD distributions could result in non-convergence of any MAIC reweighting algorithm.
The polyMAIC approach does not formally combine the relative importance of the matching closeness against the ESS maximisation. Lower levels of matching (i.e., use of higher tolerances) will generally lead to higher ESSs. However, it is not clear what the optimal trade-off between these two objectives should be. For example, should researchers specify tolerances such that they achieve an ESS of at least, say, 20% of the original IPD sample size? What characteristics should they be willing to match less closely against, or potentially even drop from consideration, to achieve this? This sort of trade-off might potentially vary by case and therefore preclude any standard solution.
Potential improvement with the polyMAIC approach lies with its use of fourth-order polynomials to alter the baseline distributions. Even more flexible functions such as fifth- (or higher-)order polynomials, splines, or fractional polynomials could potentially be employed [20]. However, while locally ‘extreme’ complex functions might have statistical advantages in terms of matching closeness and maximising ESS, they would arguably have little clinical justification. Two patients with similar baseline characteristics should arguably provide a similar weight in an MAIC-based analysis.
We conducted comparisons of MAIC methodology upon a limited set of data simulations. Despite our efforts to replicate typical conditions faced by researchers when conducting MAICs, given the number of scenarios tested we cannot generalise these results to conclude that the polyMAIC method will be universally superior to that of Signorovitch. We did not conduct a full factorial design; rather each scenario altered multiple factors (sample size, number of characteristics, correlations between characteristics, ALD target ‘distances’ and matching tolerances), meaning that we are not able to definitively identify what drives differences between the two methods. Other MAIC approaches could have been included in our comparisons, in particular entropy balancing and the approach developed by Jackson et al. [7]. However, given that the Signorovitch approach is virtually an industry standard, we felt justified in our exclusion of other MAIC methodologies.
Conclusion
The polyMAIC approach introduced here demonstrates an alternative approach to current standard MAIC methodology. It may be of particular use in certain circumstances, such as when greater flexibility in matching is required. Further research is necessary to determine the conditions under which polyMAIC may lead to more robust estimates of comparative effectiveness. A full and proper comparison of multiple MAIC approaches would undoubtedly be of great interest to researchers.
Future Perspective
Regulatory and reimbursement authorities typically seek data from head-to-head randomised controlled trials when comparing treatments. However, this level of comparative effectiveness data is often unavailable at the time of their assessment, especially when new treatments have only recently become available. MAIC has proven over the past decade to be an extremely useful statistical tool in circumventing this lack of head-to-head data. Improvements in MAIC methodology should lead to more reliable indirect treatment comparisons and, ultimately, better decision making.
•
Researchers undertaking a matching-adjusted indirect comparison (MAIC) typically use the individual patient data (IPD) reweighting approach originally published by Signorovitch et al. [6].
•
We developed a more flexible MAIC method (polyMAIC) to reweight IPD, based on the use of fourth-order polynomial functions within a non-linear optimization framework.
•
The polyMAIC method allows for user-specified matching tolerances (against target aggregate-level summary statistics) and maximal IPD weights, while optimising effective sample size (ESS).
•
The flexibility and performance of this new MAIC approach was tested using simulated IPD, which aimed to reflect a variety of clinical trial baseline characteristics. The polyMAIC method was compared with the Signorovitch MAIC method by examination of matching ability, ESS and maximum weight.
•
This new MAIC method was able to match aggregate-level targets within small, pre-specified tolerances. It generally provided higher ESSs and lower maximum weights compared with the Signorovitch method.
•
Given its theoretical simplicity and flexibility in implementation, the polyMAIC method provides a potentially useful alternative tool when conducting MAICs.
Author contributions
J Alsop and L Pont developed the methodology, conducted the analyses and drafted the manuscript.
Acknowledgments
The authors thank M Scott and K Barrett for their review of the manuscript.
Financial & competing interests disclosure
This study was supported by Numerus Ltd – both authors are paid employees of Numerus Ltd. The authors have no other relevant affiliations or financial involvement with any organisation or entity with a financial interest in or financial conflict with the subject matter or materials discussed in the manuscript apart from those disclosed.
No writing assistance was utilised in the production of this manuscript.
Open access
This work is licensed under the Attribution-NonCommercial-NoDerivatives 4.0 Unported License. To view a copy of this license, visit http://creativecommons.org/licenses/by-nc-nd/4.0/
Supplementary Material
File (appendix 1.docx)
- Download
- 20.08 KB
References
1.
Bucher H, Guyatt GH, Griffith LE, Walter SD. The results of direct and indirect treatment comparisons in meta-analysis of randomized controlled trials. J. Clin. Epidemiol. 50(6), 683–691 (1997).
2.
Thom H, Capkun G, Cerulli A, Nixon R, Howard L. Network meta-analysis combining individual patient and aggregate data from a mixture of study designs with an application to pulmonary arterial hypertension. BMC Med. Res. Methodol. 15(34), 1–16 (2015).
3.
Caro J, Ishak K. No head-to-head trial? Simulate the missing arms. Pharmacoeconomics 28(10), 957–967 (2010).
4.
Phillippo D, Ades A, Dias S et al. NICE DSU technical support document 18: methods for population-adjusted indirect comparisons in submissions to NICE (2016). https://nicedsu.sites.sheffield.ac.uk/tsds/population-adjusted-indirect-comparisons-maic-and-stc
5.
Thom H, Jugl S, Palaka E, Jawla S. Matching adjusted indirect comparisons to assess comparative effectiveness of therapies: usage in scientific literature and health technology appraisals. Value Health 19(3), A100–A101 (2016).
6.
Signorovitch J, Wu E, Yu A et al. Comparative effectiveness without head-to-head trials: a method for matching-adjusted indirect comparisons applied to psoriasis treatment with adalimumab oretanercept. Pharmacoeconomics 28(10), 935–945 (2010).
7.
Jackson D, Rhodes K, Ouwens M. Alternative weighting schemes when performing matching-adjusted indirect comparisons. Res. Synth. Methods 12, 333–346 (2020).
8.
Hainmueller J. Entropy balancing for causal effects: a multivariate reweighting method to produce balanced samples in observational studies. Polit. Anal. 20, 25–46 (2012).
9.
Han S. Statistical Methods for Aggregation of Indirect Information [PhD thesis]. Harvard University, Cambridge, USA (2014).
10.
Malangone E, Sherman S. Matching-adjusted indirect comparison analysis using common SAS 9.2 procedures. SAS Global Forum 2011. Presented at: Las Vegas, Nevada, USA, 4–7 April 2011.
11.
Phillippo D, Dias S, Elsada A, Ades A, Welton N. Population adjustment methods for indirect comparions: a review of National Institute for Health and Care Excellence technology appraisals. Int. J. Technol. Assess. Health Care 35, 221–228 (2019).
12.
Jiang Y, Ni W. Performance of unanchored matching-adjusted indirect comparison (MAIC) for the evidence synthesis of single-arm trials with time-to-event outcomes. BMS Med. Res. Methodol. 20(241), 1–9 (2020).
13.
Hatswell A, Freemantle N, Baio G. The effects of model misspecification in unanchored matching-adjusted indirect comparison: results of a simulation study. Value Health 23(6), 751–759 (2020).
14.
Remiro-Azocar A, Heath A, Baio G. Methods for population adjustment with limited access to individual patient data: a review and simulation study. Res. Synth. Methods 15, 750–775 (2021).
15.
Petto H, Kadziola Z, Brnabic A, Saure D, Belger M. Alternative weighting approaches for anchored matching-adjusted indirect comparisons via a common comparator. Value Health 22, 85–91 (2019).
16.
Phillippo D, Dias S, Ades A, Welton N. Equivalence of entropy balancing and the method of moments for matching-adjusted indirect comparison. Res. Synth. Methods 11, 568–572 (2020).
17.
Di Lorenzo G, Casciano R, Malangone E et al. An adjusted indirect comparison of everolimus and sorafenib therapy in sunitinib-refractory metastatic renal cell carcinomapatients using repeated matched samples. Expert. Opin. Pharmacother. 12(10), 1491–1497 (2011).
18.
Kalton G, Flores Cervantes I. Weighting methods. J. Off. Stat. 19(2), 81–97 (2003).
19.
Kich L. Survey Sampling. Wiley, NY, USA (1965).
20.
Zubizarreta J. Stable weights that balance covariates for estimation with incomplete outcome data. J. Am. Stat. Assoc. 110(511), 910–922 (2015).
21.
Regnier S, Alsop J, Wright J, Nixon R, Staines H, Fajnkuchen F. Review and comparison of methodologies for indirect comparison of clinical trial results: an illustration with ranibizumab and aflibercept. Expert Rev. Pharmacoecon. Outcomes Res. 16(6), 793–801 (2016).
22.
SAS Institute Inc. SAS Software. Cary, NC (2003).
23.
R Core Team. A Language and Environment for Statistical Computing. R Foundation for Statistical Computing, Vienna, Austria (2017).
Information & Authors
Information
Published In
Pages: 551 - 561
PubMed: 35506464
Copyright
© 2022 Jonathan Alsop. This work is licensed under the Attribution-NonCommercial-NoDerivatives 4.0 Unported License
History
Received: 25 October 2021
Accepted: 12 April 2022
Published online: 4 May 2022
Keywords:
Topics
Authors
Metrics & Citations
Metrics
Article Usage
Article usage data only available from February 2023. Historical article usage data, showing the number of article downloads, is available upon request.
Citations
How to Cite
Matching-adjusted indirect comparison via a polynomial-based non-linear optimization method. (2022) Journal of Comparative Effectiveness Research. DOI: 10.2217/cer-2021-0266
Export citation
Select the citation format you wish to export for this article or chapter.
Citing Literature
- Ekkehard Glimm, Lillian Yau, Exact Matching as an Alternative to Propensity Score Matching, Statistics in Biopharmaceutical Research, 10.1080/19466315.2025.2507378, 18, 1, (106-116), (2025).
- K. Jack Ishak, Conor Chandler, Fei Fei Liu, Sven Klijn, A Framework for Reliable, Transparent, and Reproducible Population-Adjusted Indirect Comparisons, PharmacoEconomics, 10.1007/s40273-025-01503-1, 43, 7, (691-710), (2025).
- Ziren Jiang, Joseph C. Cappelleri, Margaret Gamalo, Yong Chen, Neal Thomas, Haitao Chu, A comprehensive review and shiny application on the matching‐adjusted indirect comparison, Research Synthesis Methods, 10.1002/jrsm.1709, 15, 4, (671-686), (2024).