An impact evaluation of two modes of care for sickle cell disease crises
Publication: Journal of Comparative Effectiveness Research
Abstract
Aim: To estimate the economic impacts of increased use of specialty care infusion centers for treating adults experiencing vaso-occlusive crises. Methods: A Markov model is developed to estimate the impact of expanding use of specialty care infusion centers to treat vaso-occlusive crises compared to emergency department care. Results: Access to infusion centers for sickle cell disease could result in savings over US$1.9 billion in formal medical costs and over US$2 billion in societal costs, based on uptake assumptions over 10 years. Conclusion: Expansion of adult sickle cell disease centers across the nation could lead to considerably better economic outcomes in the form of reduced costs and hospital length of stay in addition to improved clinical outcomes as reported in the existing literature.
Plain language summary
Specialty care centers for sickle cell disease crises offer improved care and patient experience over typical emergency department care. This paper is based on a recent study, which compared the treatment for sickle cell disease crises at specialty centers and emergency departments by estimating the potential economic impacts of expanded specialty care centers. We estimate the impacts of increased specialty care use on healthcare costs, caregiver time, patient time and employer absenteeism costs. When 35% of the USA adult population acquires access to a specialty sickle cell disease center, a total savings over US$1.9 billion can be obtained after 10 years.
Background
Approximately 100,000 Americans currently live with a group of inherited red blood cell disorders known as sickle cell disease (SCD). Individuals with SCD commonly experience prolonged and painful vaso-occlusive crises (VOCs) that require hospitalization. These painful crises, the most frequent complication of SCD, occur sporadically and last many days. Patients often seek treatment in emergency departments (EDs), where they receive intravenous infusions of pain-reducing medicines. However, VOC patients have expressed dissatisfaction with the care they receive in EDs, citing significant delays in the administration of required medication [1]. For instance, Tanabe et al. found a median wait time of 90 min for the first dose of which is analgesic, significantly longer than the 15–20 min that the American Pain Society recommends [1]. Significant differences in time to first dose across patients reporting similar pain levels were also found. Silbergleit et al. found just 20% of ED physicians follow a protocol when caring for patients experiencing a VOC [2]. These deficiencies have encouraged the creation of specialty centers for handling VOCs.
Overview of peer-reviewed research on modes of care for sickle cell disease-related vaso-occlusive crises
In recent years, infusion centers (ICs) have provided an alternative to the ED for the care of patients with VOCs. Lanzkron et al. evaluated the differences in care and quality of care received for uncomplicated VOCs in the ED and IC [3]. The authors defined these uncomplicated VOCs as acute pain episodes requiring parenteral therapy for pain relief, with no other known cause. To compare the two modes of care, they conducted a prospective observational cohort study that followed 444 patients across four USA cities for 18 months. Participants were excluded if they were on chronic transfusion therapy and experienced no acute care visits for at least 2 years prior to engaging in the study. Propensity score matching was used to control for the possibility of unequal disease severity between the two modes of care. The results show statistically significant differences between these two settings in the quality of care received for VOC crises. In the IC, Lanzkron and colleagues found reduced time to first dose of pain medication, quicker pain reassessment by attending medical staff and reduced inpatient hospitalization.
We use these finding to estimate the formal and informal impacts of access to IC and ED treatment for patients experiencing VOCs for all adult SCD patients in the United States. A body of research has examined the costs of specialty care (see Rousseau et al., Okpala et al., Yang et al.), but to our knowledge, our research is the first to compare the impacts of these two modes of care at a societal level [4–6]. We measure these impacts from the perspectives of patients, families, payers, employers and society over a 10-year time horizon using yearly estimated cohorts of the adult SCD population.
Methods
We developed a population-level Markov model to simulate the effects of uptake of IC care for VOCs over a 10-year time horizon. Our model estimates the impact of a baseline and ‘'treated' state. In the baseline state, all SCD patients who experience VOC events and require acute care, receive their care in an ED. In the treated state, patients receive acute care in either the ED or an IC. The number of acute care events in the IC in the treated state is based on assumptions of the proportion of patients with access to ICs and the percentage of patients seeking care at an IC when an IC is available.
Each year, a new cohort of SCD patients enters the model. In the treated state, these patients receive care in the ED or IC, or conduct self-care at home, or receive no care. To simulate the patient population with access to an IC, we estimate a beginning estimate of patients with access, followed by an annual uptake rate of IC access every year. A recent literature has outlined the elements needed to run an adult specialty sickle cell center and highlighted implementation workshops with new SCD care centers [7]. The Patient-Centered Outcomes Research Institute (PCORI) is funding work to identify barriers to the expansion of specialty care for SCD and develop an implementation toolkit [8]. To account for this push to expand access to adult sickle cell disease specialty care, we assume a constant rate of growth in patient access to ICs over time. The model estimates acute care event frequency, payer and out-of-pocket medical costs, caregiver time and travel costs and employer costs in the form of foregone wages.
Model parameters
Model parameters were identified in the literature and across publicly available data sources. A full list of these parameters and sources appears in appendix A, Supplementary Table 1A.
Population & clinical parameters
We estimate the population over our study period using 10 population cohorts. The first cohort is based on an estimated prevalence of SCD among adults 18 and older (0.23 per 1000 people) [9–11]. Subsequent cohorts include the number of incidents (0.40 per 1000 people) and prevalent 18-year-olds each year [11,12]. In all 10 cohorts, we estimate annual mortality for adults with SCD each year [13].
We use findings from Brousseau et al. to estimate the number of adults with SCD who experience zero acute care encounters [14]. Each year, we remove this proportion of individuals from our model to arrive at an accurate population estimate of SCD patients seeking treatment each year.
The baseline cohort includes approximately 60,000 USA adults with SCD who seek care for SCD-related pain crises. In each subsequent year of the model, a new cohort of 1500 incident patients enters the model, based on an estimate of the incidence of SCD cases [11]. This incidence rate was applied to the population of adults 18 and older in the USA. We assumed the proportion of SCD patients requiring care for pain episodes was the same as in the prevalent population. Patients only exited the model upon death; we assume 15 patients per year per 1000 prevalent SCD patients die [13].
To account for the recurrent nature of SCD pain episodes, our model assumes patients experiencing pain crises episodes seek medical care an average of 2.7 times per year [3].
Healthcare utilization parameters
In the baseline state of our model, we assume that each year all individuals with SCD either experience a VOC requiring care at an ED (74%) or do not have any VOCs requiring care (26%). Among patients receiving care in the ED, a proportion return home after treatment (62%), and the remainder are admitted to the hospital and subsequently discharged home (38%). The proportion of patients at each choice node are based on proportions we obtained from published literature (Figures 1a and 1b) [3,11,13,15,16], clinical input from Dr Joy Ogunsile].
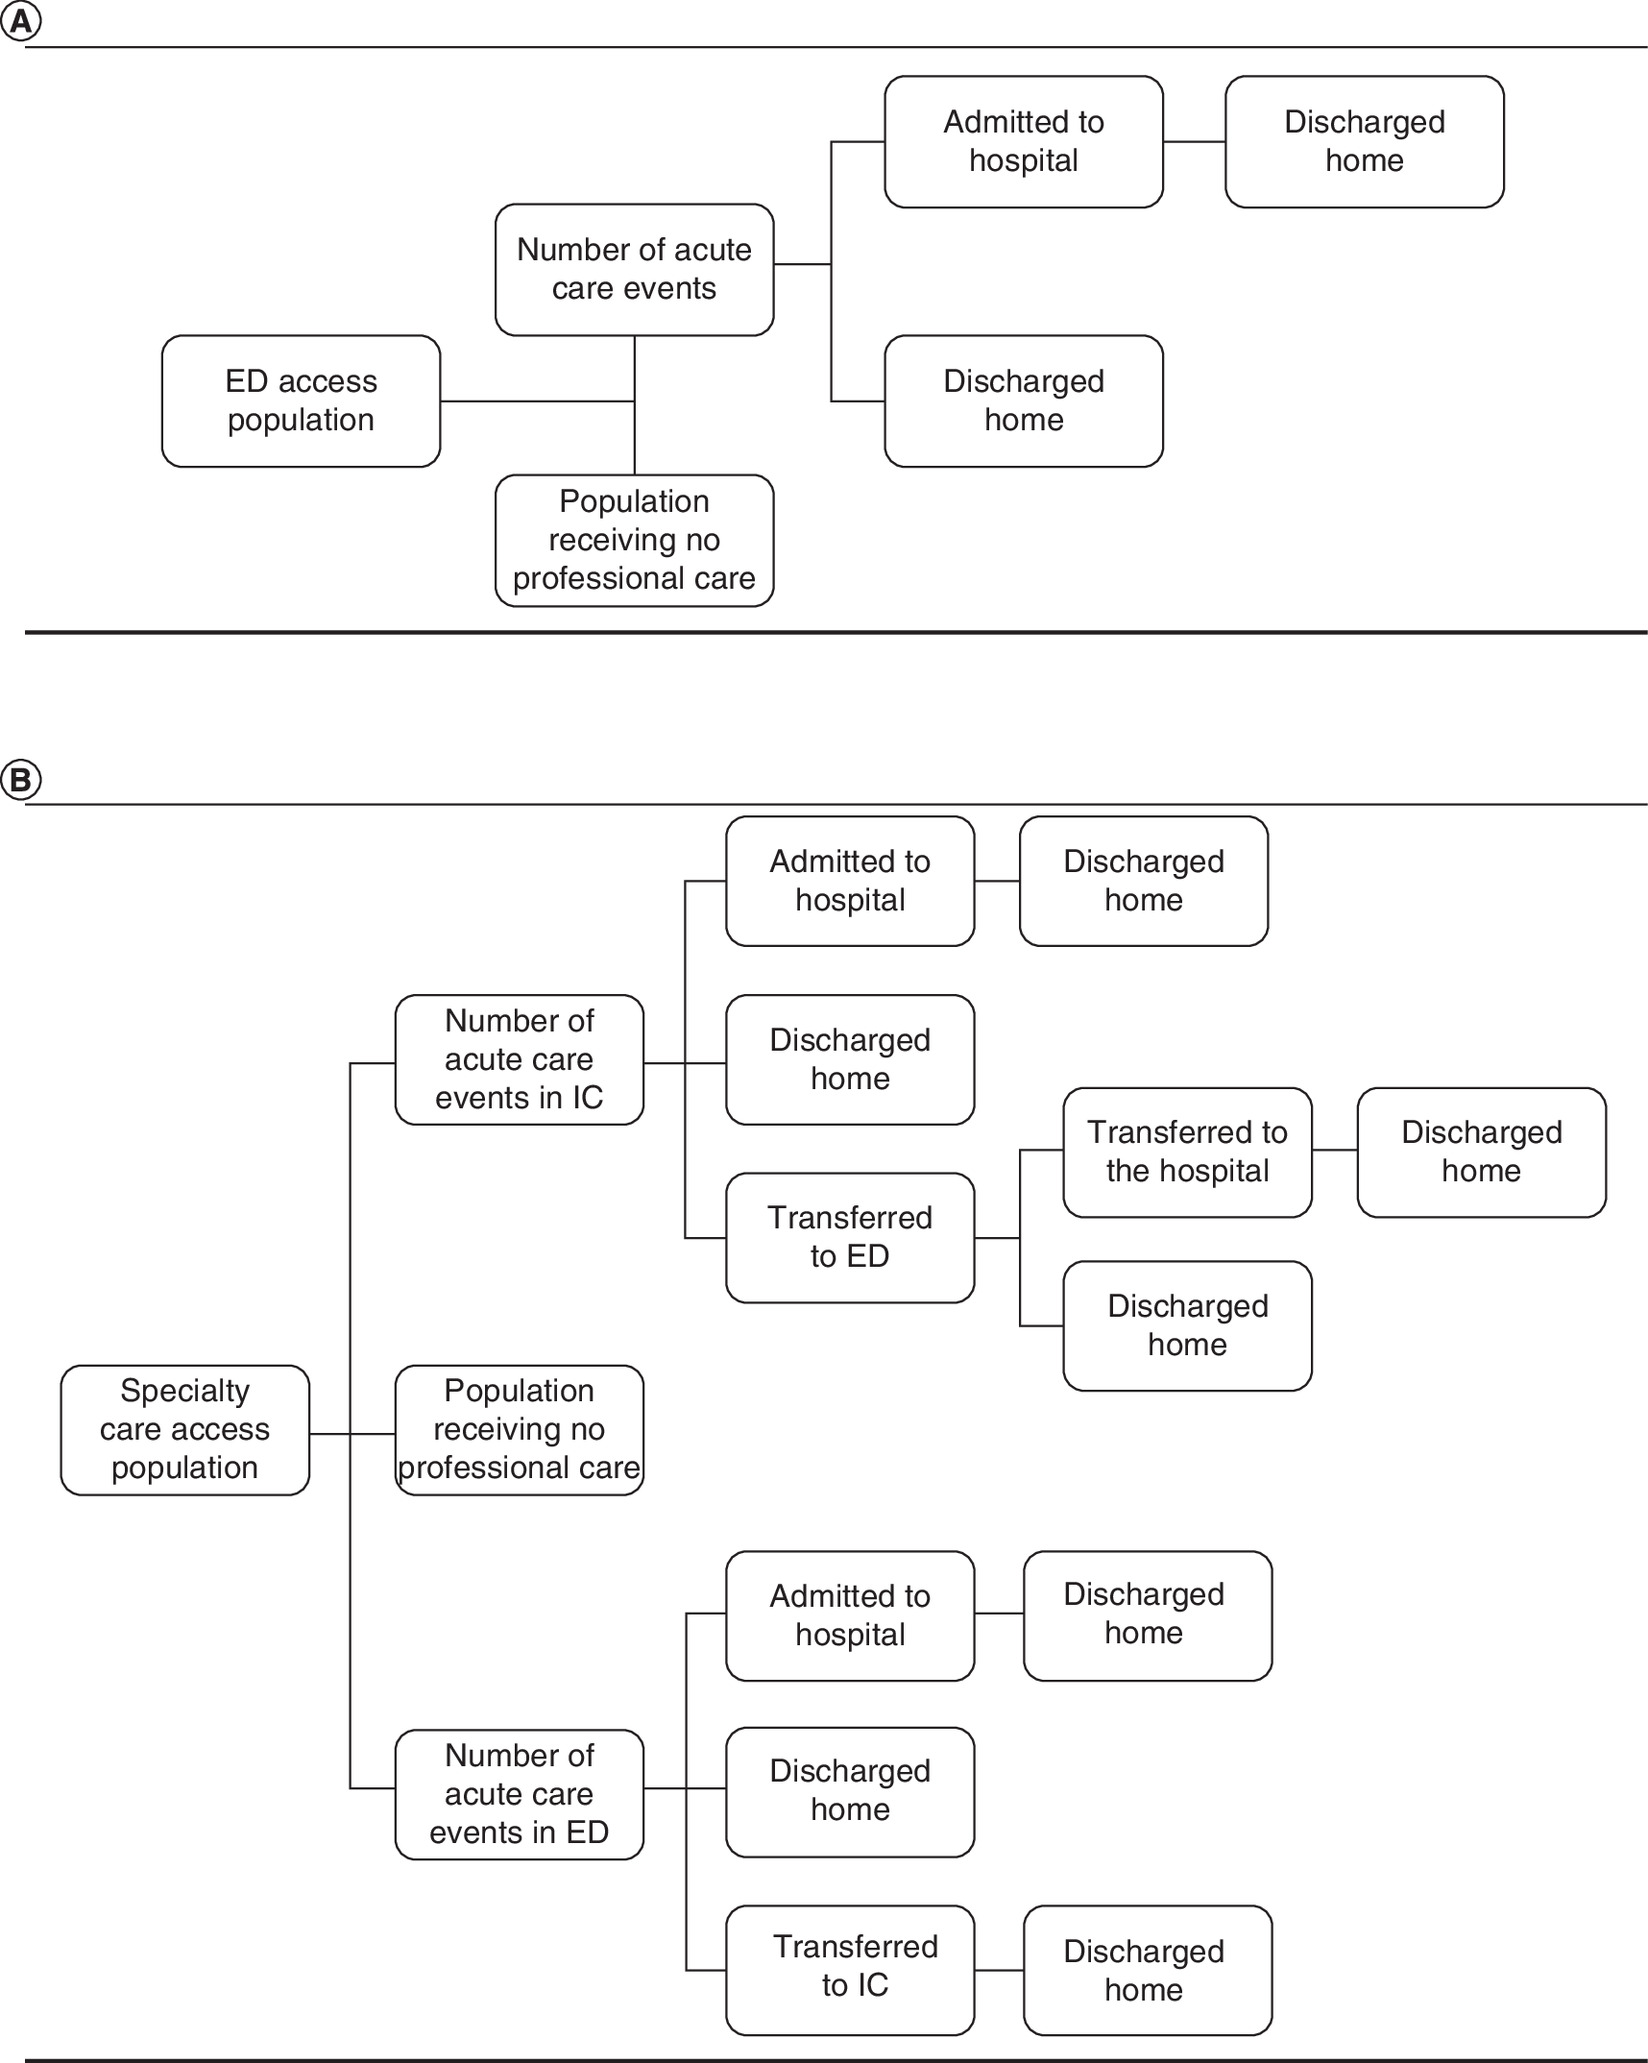
Figure 1. Diagram for baseline and treatment state models.
(A) Baseline state: impact analysis model for two modes of care for sickle cell disease crises. (B) Treatment state: impact analysis model for two modes of care for sickle cell disease crises.
ED: Emergency department; IC: Infusion center.
In our model, patients with access to specialty IC who seek care for a VOC will receive treatment at an emergency department or a specialty IC. We assume that the proportion of patients with access to ICs increases each year. Based on the conversations with a clinical expert, we assume that during the base year of the model, 15% of patients with SCD have access to ICs, and in each subsequent year the proportion of patients with access increases by 10% [F. Ogunsile, Pers. Comm., December 14, 2020]. By the 10th year of the model, we assume 35% of patient have access to ICs. As many individuals live in areas where there is not a large population of patients with SCD, we assume specialty ICs will never be available to the entire SCD patient population. Unfortunately, there are no available data on the total number of existing specialty care facilities, although work is in progress to expand access to specialty care through workshops and other informational tools for healthcare providers [7].
In our model, we assume that 70% of patients with access to specialty ICs will seek treatment at the ICs. In our model, patients who receive treatment at ICs may then be sent home (80%), transferred to an ED and admitted to the hospital (5%), transferred to an ED and subsequently sent home (9%), or admitted directly to the hospital (6%) [F. Ogunsile, Pers. Comm., December 14, 2020].
Healthcare cost parameters
Healthcare costs considered in this study are the cost of inpatient hospital stays, ED costs and the costs of specialty care ICs. The cost of inpatient hospitalization is estimated from the Agency for Healthcare Research and Quality's Healthcare Cost and Utilization Project (HCUP) [17]. We estimate inpatient costs by identifying mean charges for ICD-10 codes for uncomplicated SCD crises. ED and specialty care costs are estimated by identifying the average cost for an ED and IC visit at the Johns Hopkins Hospital in Baltimore, Maryland [S. Lanzkron, Pers. Comm., October 25, 2020]. We construct a measure of out-of-pocket costs for patients by finding the ratio between total and out-of-pocket charges in the Medical Expenditure Panel Survey (MEPS) and applying it to the total costs of care from HCUP and Johns Hopkins [17,18].
Patient time, travel, & productivity cost parameters
We estimated productivity, caregiver, transportation and patient time costs for IC care and care in the ED. To estimate transportation costs, we used the average distance between home and the ED in the United States and a standard mileage rate from the internal revenue service of 58 cents per mile [19,20]. We assumed two trips to and from the ED or IC for a cost of US$7.89 per acute care event. We assumed that ICs are collocated with a hospital building or campus and that there are no time or transportation costs for travel between IC, ED, or inpatient visits and stays.
Patient time costs were estimated by using the average length of stay for inpatient hospital admissions and ED visits for uncomplicated VOCs from HCUP [17]. Lanzkron et al. estimate time-to-first dose in the IC being 64 min faster than for similar care received in the ED [3]. To estimate the length of stay in the IC we assume a similar length of time for care received after the first dose. This gives us an estimated 5.4 h spent in ED and 4.3 h spent in the IC [3,17].
Productivity costs are determined by estimating employer absenteeism through the length of stay across care settings, multiplied by a median hourly wage and the employment rate of adult SCD patients. Lanzkron et al. [21] estimated approximately 40.9% of adult SCD patients are employed. The U.S. Department of Labor's (DOL) Bureau of Labor Statistics (BLS) finds a median hourly wage of US$29.95 across all labor categories [22].
SCD patients are typically not allowed to operate a vehicle after receiving their care. To estimate the burden on caregivers for transporting patients home, we assume a caregiver wage of US$16.90 multiplied by 1 h per acute care event. This caregiver wage is based on the median wage for nursing and home health aides [22].
Societal cost estimation
To estimate the total societal costs, we summed the costs from all payers, patient time and out-of-pocket healthcare costs, and employer productivity costs. These calculations avoid double-counting costs to patients and payers. We count employer productivity costs as the cost of foregone productivity and patient time costs according to household productivity losses.
Sensitivity analyses
One-way & probabilistic sensitivity analyses
We assessed the sensitivity of our model findings using one-way sensitivity analyses. This approach produces a plausible range for each outcome by allowing the value of one input parameter to vary across a distribution between 20% above and below the inputted mean, while holding all other input parameters constant. We also calculated probability sensitivity analyses based on 1000 iterations of the model in which all inputs could vary across a distribution of values.
Infusion centers operating cost estimates
In calculations separate from our Markov Model, we estimated annual operating costs for a specialty care clinic for providing care to SCD patients who experience pain episodes. Based on our conversations with clinical subject matter experts, we estimated that most ICs currently operate with three to four infusion beds and that each infusion treatment takes approximately 5 h [F. Ogunsile, Pers. Comm., December 14, 2020]. These clinics are typically open to treat patients 8 h a day 5 days a week and are staffed by a part-time hematologists, a registered nurse, a physician assistant, a nurse technician, and a front office administrator. Assuming the clinics are open 52 weeks a year, we estimate an annual staffing cost for US$350,979 per clinic [22]. We assume a clinic with four beds will be able to care for two patients per bed per day and is utilized at 75% of its maximum capacity. This estimate suggests that one facility could care for 1560 SCD crises each year.
Many currently operating SCD clinics are co-located within hospitals or other previously built clinical facilities [3]. For such facilities, the upfront costs would be limited to retrofitting of existing facilities. Using expert input, we estimate the cost of retrofitting a facility with four beds at US$371,718. In year 10 of our model, 31,151 SCD crises take place within a SCD specialty IC. Using our estimates of facility capacity, we estimate approximately 20 SCD specialty ICs would need to exist to provide this care. Retrofitting costs of these 20 facilities would equal approximately US$7.4 million spreading out the capital costs of hospital construction over 10 years and adding annual operating costs, we estimate total annual capital and operating costs of US$1,094,415 to care for 31,151 SCD crises in a specialty care setting. Subtracting these costs from annual direct medical cost savings still saves approximately US$1.8 billion.
We exclude these costs from the Markov Model to avoid double-counting the staff and facility operating costs because those costs are already captured by the payer and patient direct medical costs included in our model.
These cost calculations are intended solely as back-of-the-envelope estimates because of the absence of published information on the size, scope or operating costs of existing ICs and the likely large variance in operating costs across the relatively small number of ICs across the country. Although these estimates do suggest that with the addition of these capital costs, substantial direct medical cost savings do occur.
Results
The 10-year healthcare utilization and cost impacts of having access to specialty ICs for the treatment of SCD/VOC pain crises compared with the current treatment practice at EDs are shown in Table 1. We estimated a 14% reduction in ED visits and a 12% reduction in hospital admissions. Based on our model, the patients who avoided 175,000 ED visits and 55,000 hospital stays instead had nearly 205,000 treatments at specialty ICs. Total societal cost savings are the sum of formal and informal sector cost savings, equaling US$2,007,153,548 over 10 years, or US$3,275 per patient per year.
| Outcome | Baseline state: ED treatment | Treated state: IC or ED treatment | Total savings | Annual per-patient savings |
|---|---|---|---|---|
| Utilization | ||||
| Number of hospital admissions | 460,131 | 405,045 | 55,086 | 0.09 |
| Number of ED visits | 1,210,870 | 1,035,411 | 175,460 | 0.29 |
| Number of IC visits | 0 | 204,897 | (204,897) | -0.33 |
| Patient perspective | ||||
| Patient time (h) | 59,378,722 | 52,992,881 | 6,385,842 | 10 |
| Indirect costs (transportation) | $9,551,344 | $9,551,344 | $0 | $0 |
| Direct medical costs | $1,515,634,740 | $1,345,619,906 | $170,014,834 | $277 |
| Total costs | $1,525,186,084 | $1,355,171,250 | $170,014,834 | $277 |
| Payer perspective | ||||
| Formal medical costs | $16,148,002,484 | $14,336,616,210 | $1,811,386,274 | $2956 |
| Family perspective | ||||
| Unpaid caregiving time (h) | 1,210,870 | 1,210,870 | 0 | 0.00 |
| Total cost of unpaid caregiving | $19,131,748 | $19,131,748 | $0 | 0.00 |
| Employer perspective | ||||
| Productivity loss (h) | 8,095,299 | 7,224,696 | 870,603 | 1.42 |
| Total cost of productivity loss | $239,458,948 | $213,706,509 | $25,752,439 | $42 |
| Societal perspective | ||||
| Total formal medical costs | $17,663,637,224 | $15,682,236,116 | $1,981,401,109 | $3233 |
| Total costs | $17,931,779,265 | $15,924,625,717 | $2,007,153,548 | $3275 |
ED: Emergency department; IC: Infusion center; SCD: Sickle cell disease.
Because of the high cost of the avoided ED visits and hospital stays, payers would receive the vast share of the cost savings estimated from increased access to ICs for treatment of SCD crises. On the 10-year time horizon, payers save US$1,811,386,274. This equates to a per-patient savings of US$2956 per year.
Patients benefit from treatment at ICs compared with EDs regarding reduced time and out-of-pocket costs. Based on our model assumptions of less patient time for treatment at ICs, we estimate that over 10 years, patients would save 6,385,842 h compared with the treatment of all patients at EDs (10 h per patient per year). Patients would also have lower out-of-pocket healthcare costs when they have access to ICs. On the 10-year time horizon, patients would save US$170,014,834 in out-of-pocket medical costs, or US$277 per patient per year.
The reduced time for treatment at ICs also translates to benefits for employers. We estimate 870,603 fewer h of missed work. From the employer's perspective, this equates to a US$25,752,439 in avoided productivity losses.
Patients who receive treatment for SCD pain crises often require accompaniment at completion of their treatment. We model the time and time costs from the family perspective by assuming patients are accompanied by one working-age care partner while traveling to and from treatments of SCD pain crises. Because many ICs are co-located with hospitals, we assume equivalent travel distance and times to both EDs and ICs. As a result, we estimate no difference in family time or family costs between baseline treatment state and the alternative, IC intervention state.
We estimated that there are no transportation savings or cost differences between the baseline and treatment states. In our model, all patients who seek care make two trips: one to the acute care facility and another to their home after discharge. Patients experience these two trips regardless of whether they receive their initial care in the IC or ED. Our assumption is that IC care is embedded in a larger clinical space shared by other programs, such as a hospital. This assumption mirrors that of many existing models of SCD care [7].
Costs by payer
We estimate the proportion of total payer costs incurred by public (Medicare and Medicaid) and private payers. We do so by attributing proportions of all payer costs by the share of the SCD population we estimate is covered by each payer. Research has approximated 50% of the SCD population to be covered by Medicaid, 20% by Medicare, and 30% by private insurers [23]. This suggests approximately US$905.7 million in savings would accrue to Medicaid, US$362.3 million to Medicare, and US$543.4 million to private insurers over 10 years.
Sensitivity & scenario analyses
Our model results are most sensitive to variation in input assumptions related to treatment transition probabilities (e.g., the proportion of patients who seek treatment at the ED subsequently admitted to hospital). This is not a surprising result considering the high cost of care in the ED and inpatient settings. The impact of expanding access to IC treatment on many outcomes swings widely above and below zero when the care transition probabilities are varied plus or minus 20% from the default input values (Figures 2 & 3). Additionally, our sensitivity analyses include a range of possible scenarios for the proportion of VOCs among patients with access to the IC that result in initial care occurring in an ED. Anecdotal information suggests that most ICs operate between 9 am –5 pm on Monday through Friday. Alternatively, ICs in areas with high demand could operate longer hours. We vary this range between 5% and 30% to estimate various scenarios in which ICs could potentially operate.
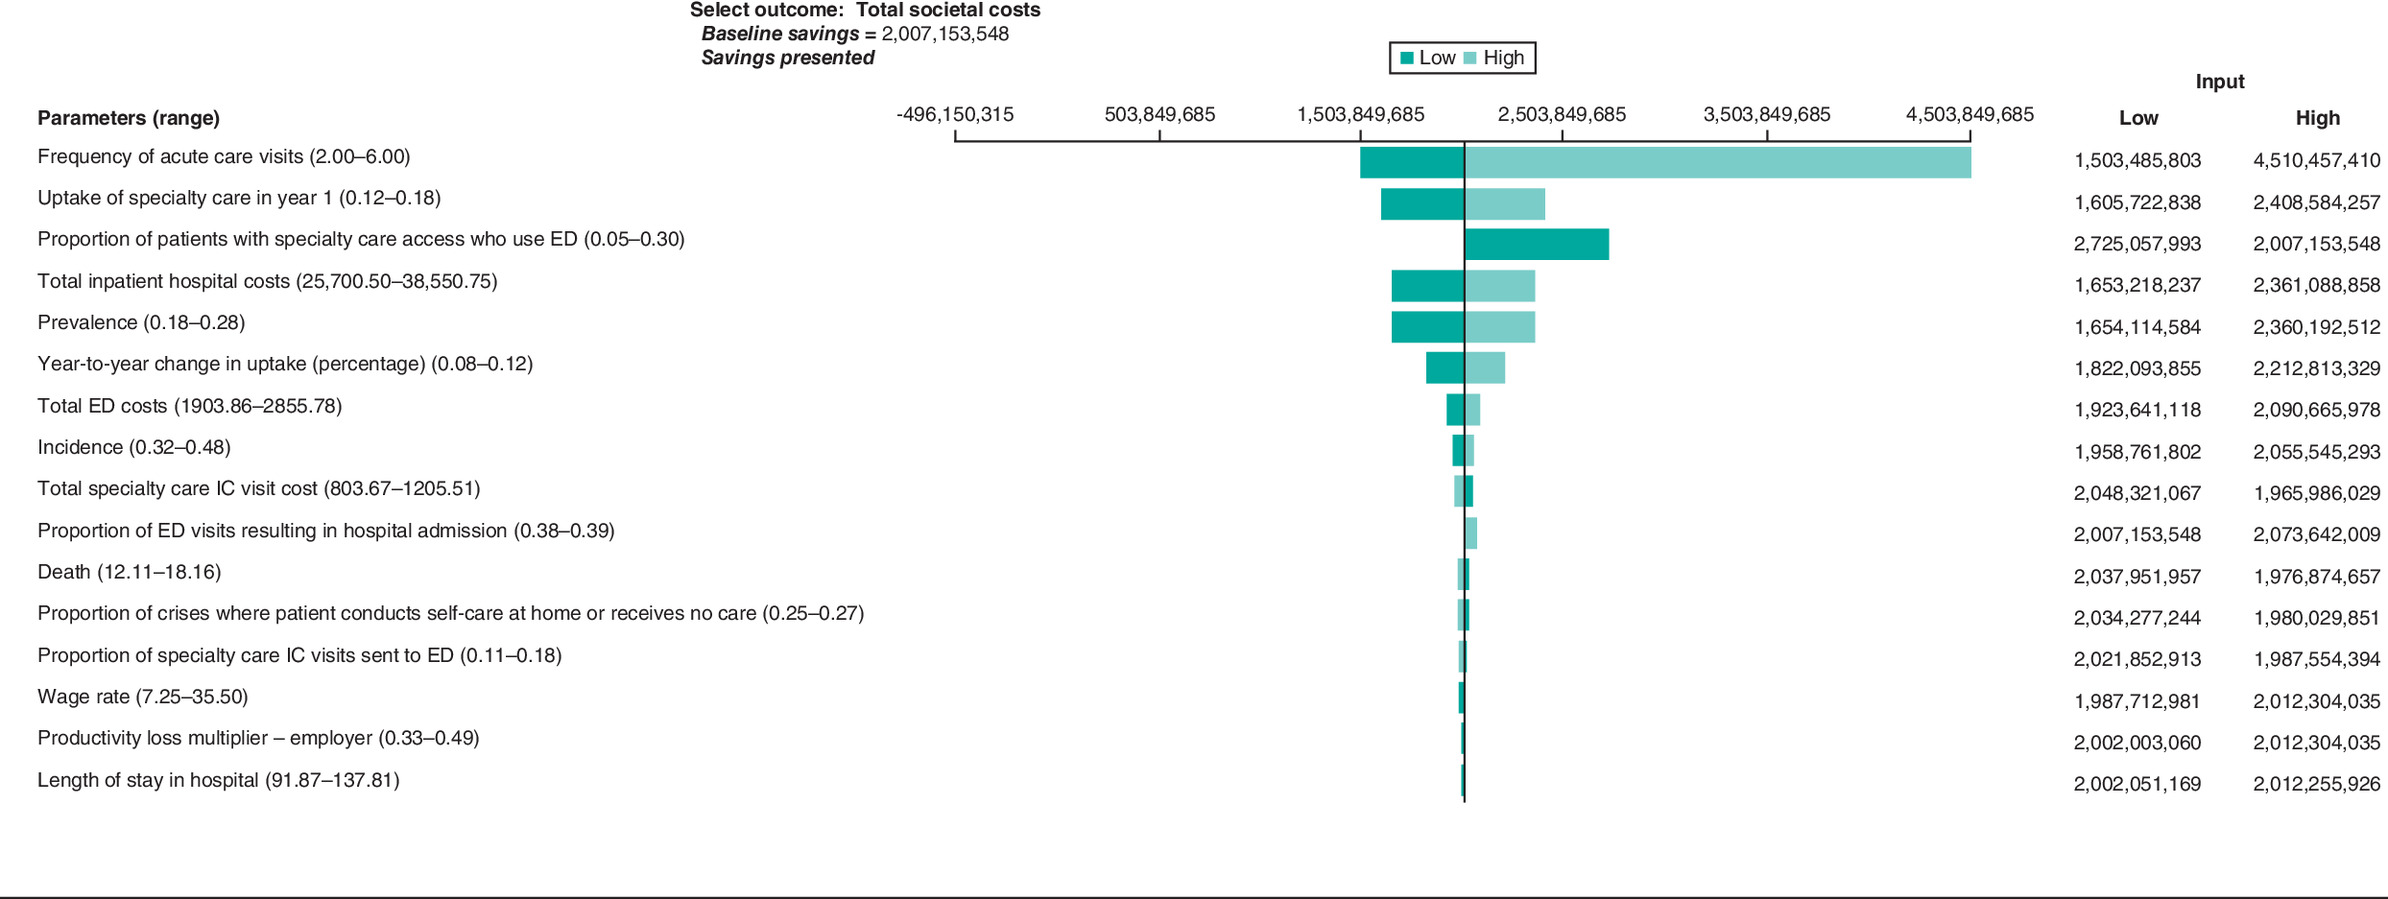
Figure 2. Tornado diagram of total societal costs, 10-year analysis.
ED: Emergency department; IC: Infusion center.
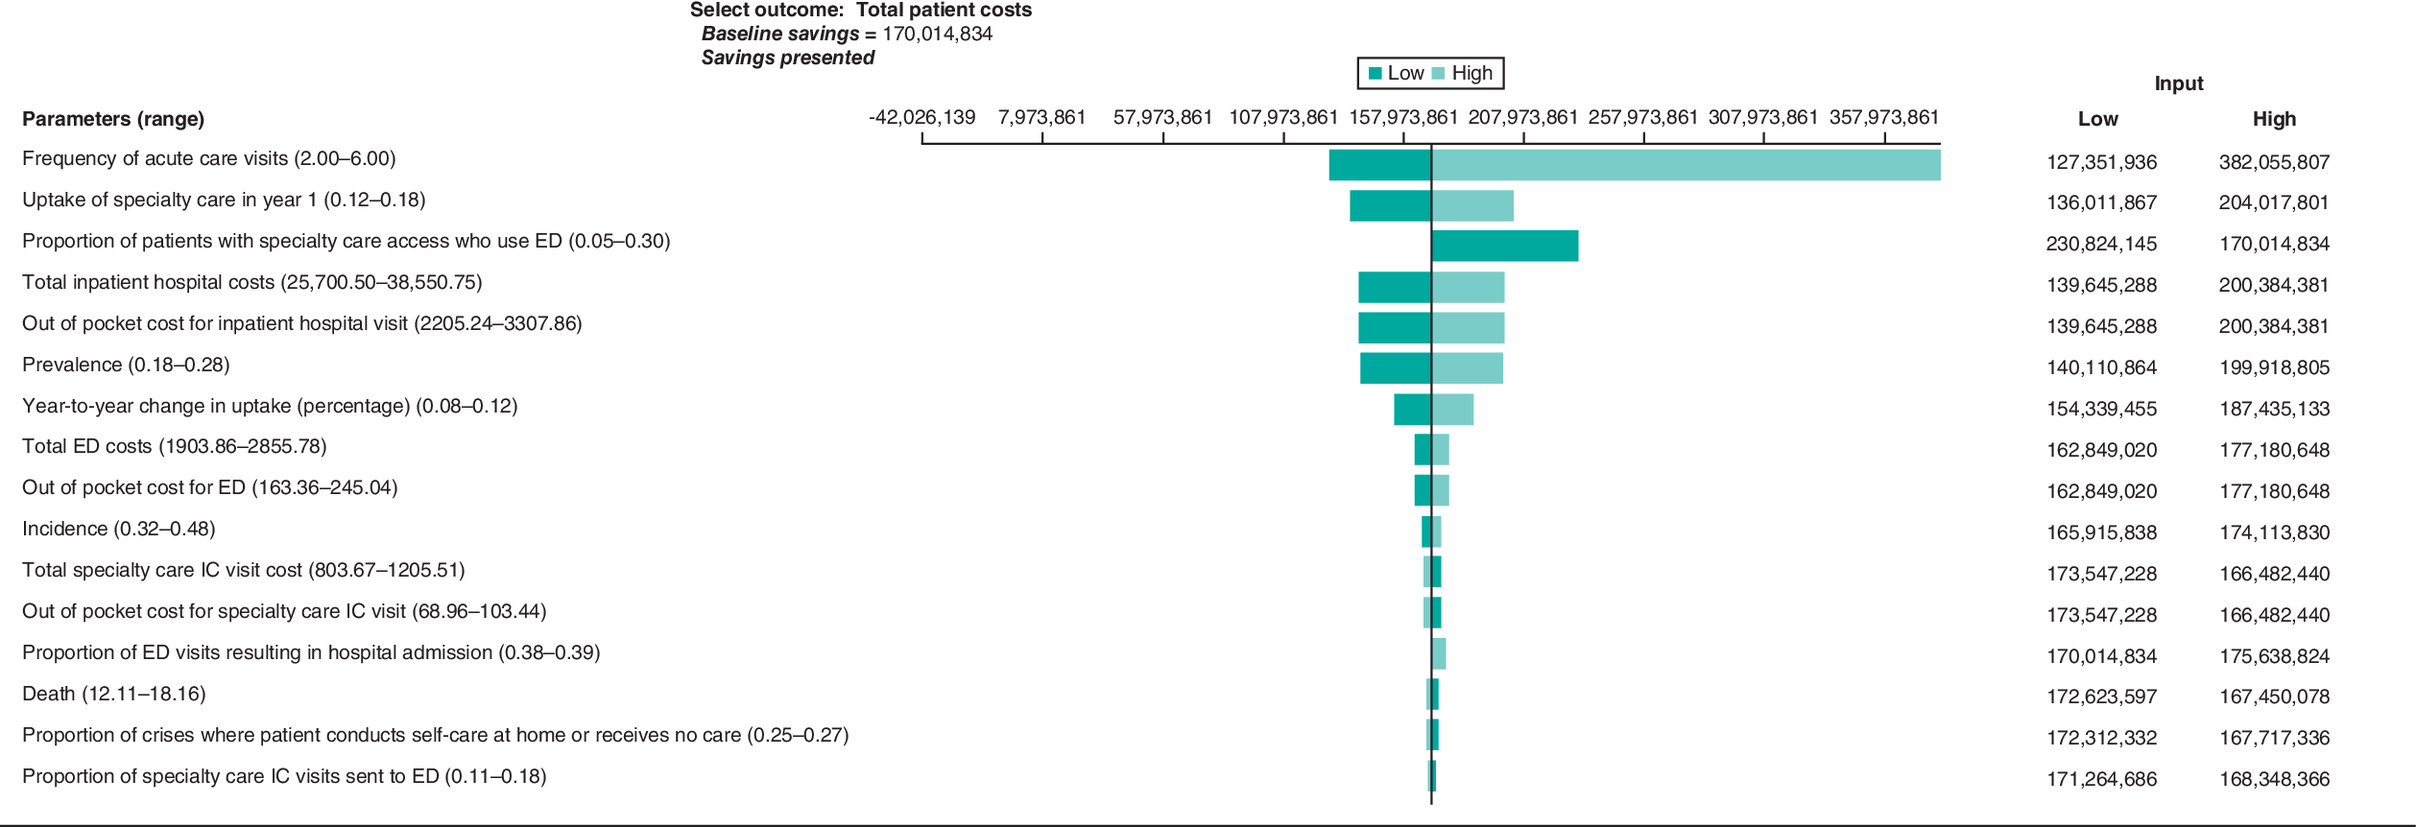
Figure 3. Tornado diagram of total patient costs, 10-year analysis.
ED: Emergency department; IC: Infusion center.
The model results are sensitive to the proportion of patients with SCD who have access to care at ICs during the base year of the model. In the absence of published estimates of the current proportion of patients with SCD who have access to IC care, we assume a baseline access to specialty care of 15%. This assumption was based on conversation with subject matter experts and our best estimates of treatment capacity for the existing ICs. Savings are positive for all one-way sensitivity analysis based on the credible range of the proportion of patients with access to specialty care during the base year of the model (showing savings). The range of outcomes for these sensitivity analyses is large (Figures 2 and 3).
Based on 1000 iterations of our model, the results from our probabilistic sensitivity analysis show the bounds on the credible range for all outcomes (Table 2). For each outcome with any nonzero impact we find that the credible ranges do not include zero. For example, we estimate a credible range of avoided ED visits of between approximately 45,000 and 320,000 visits after 10 years. The effect of the change in utilization could result in a savings of between US$43 million and US$325 million for patients and between US$512 million and US$3.8 billion in total societal costs savings over 10 years.
| Outcome | Impacts avoided or cost savings | Credible range lower bound | Credible range upper bound |
|---|---|---|---|
| Utilization | |||
| Number of hospital admissions | 55,086 | 14,222 | 100,543 |
| Number of ED visits | 175,460 | 45,596 | 323,575 |
| Number of IC visits | (204,897) | (376,960) | (52,900) |
| Patient perspective | |||
| Patient time (h) | 6,385,842 | 1,540,982 | 11,973,678 |
| Indirect costs (transportation)($) | 0.00 | 0.00 | 0.00 |
| Direct medical costs ($) | 170,014,834 | 43,731,697 | 324,856,125 |
| Total costs ($) | 170,014,834 | 43,731,697 | 324,856,125 |
| Payer perspective | |||
| Formal medical costs ($) | 1,811,386,274 | 456,726,273 | 3,452,022,340 |
| Family perspective | |||
| Unpaid caregiving time (h) | 0 | 0 | 0 |
| Total cost of unpaid caregiving ($) | 0 | 0.00 | 0.00 |
| Employer perspective | |||
| Productivity loss (h) | 870,603 | 213,449 | 1,655,896 |
| Total cost of productivity loss ($) | 25,752,439 | 5,888,126 | 57,115,766 |
| Societal perspective | |||
| Total formal medical costs ($) | 1,981,401,109 | 501,500,967 | 3,769,260,204 |
| Total costs ($) | 2,007,153,548 | 512,795,999 | 3,811,993,386 |
ED: Emergency department; IC: Infusion center; SCD: Sickle cell disease.
Discussion
Our analysis follows growing findings of the efficacy of specialty SCD care versus care received in the ED. This study is, to the authors' knowledge, the first to compare the economic impacts of specialty SCD care with traditional care at the societal level. Researchers have estimated the annual economic burden of SCD to payers and patients at US$2.98 billion per year [24]. Lee and colleagues [15] conducted a systematic review of the literature on the economic burden of adults with SCD in the USA and found that the most current literature is related to healthcare resource utilization, and only some of the recent literature identifies direct medical costs, highlighting the need for more economic research in this area. Molokie et al. [25] compared inpatient admissions and lengths of stay following care in specialty care centers and the ED. This research found a higher rate of hospital admission following ED care and similar lengths of stay in the hospital following ED and specialty care.
Other benefits of expanded access to specialty ICs are not measured in our impact estimates. These include reported patient satisfaction, decreased time to first dose, and more frequent pain reassessment throughout the patient care experience [3]. This suggests that specialty care could reduce costs and utilization while increasing patient satisfaction.
One recent study examined the relationship between prescription drug monitoring programs (PDMPs) and access to opioids for patients in the ED. Zhang et al. [26] found a reduction in opioid dispensation for patients presenting to the ED with a SCD crisis after the implementation of PDMPs [26]. These PDMPs could potentially affect our model inputs and results by increasing the time to first dose of pain medication in EDs, resulting in lower quality of care. Additionally, PDMPs could have a greater impact on patients presenting to the ED because of less provider familiarity with SCD crises and the individual patient.
It is worth noting that we do not model an immediate nationwide or universal rollout of specialty care. Our model assumes a gradual uptake of specialty care over 10 years. If a steady state of widespread specialty care use was achieved more quickly than we assumed, then our estimated savings would increase.
Limitations
There are limitations to this study. There were few published sources for several important model inputs, including costs for treatment of SCD crises and the proportion of patients with access to specialty care. Our cost estimates for the ED and specialty care centers are limited to one health system, which may not be representative of estimates in community hospitals or research hospitals in other regions. The model results are highly sensitive to the initial uptake of specialty care or the current proportion of patients with access to specialty care. This number is uncertain because there is no current comprehensive list of all specialty care SCD centers in the USA. In consultation with our clinical expert, we created an estimate of 15% of the population with access to specialty care in year 1. This highlights the need for additional research on the economic burden for specialty care in SCD.
We do not model any downstream direct or indirect costs associated with follow-up outpatient care for SCD crises, which is something that occurs occasionally but infrequently [27,28]; [F. Ogunsile, Pers. Comm., December 14, 2020]. However, we did not identify any data suggesting the differences in outpatient follow-up care between specialty care and emergency department crisis care. It remains unclear if there are differences in follow-up care for crises treated at specialty ICs versus emergency departments and the implications of that on impacts of expanded access to specialty ICs.
We should also note that VOC event rates and acute care use could differ based on prescription drug use. Zaidi et al. [29] finds significantly lower acute care utilization among individuals taking L-glutamine. As far as we are aware, there are no data that indicate whether patients taking L-glutamine would be more or less likely to attend an ER or IC during a VOC.
Additionally, the existing data do not allow us to extrapolate to children experiencing VOCs. It is possible that pediatric patients may experience similar benefits in the specialty care setting. Modeling the treatment of children receiving care for VOCs in the ED and specialty care centers may require accounting for burdens not present in our model. These burdens may include the costs of missed school and additional caregiving responsibilities of parents and family.
Our analysis also includes an attempt to present the costs of implementation of SCD specialty care by estimating the capital construction costs of a new facility and operating expenses of staffing the facility with a team of medical practitioners. The incorporation of this scenario analysis may underestimate savings since patients and payers will pay for the implementation of the specialty centers through their direct medical costs.
Finally, we should note the variations in expert opinion regarding acute care for VOCs. We relied on our clinical expert for a handful of metrics in which data were sparse, such as the proportions of patients who transition between certain treated states such as the transition probabilities condition on receipt of initial care in the IC and ED.
Conclusion
The United States could potentially avert 55,086 inpatient hospital stays with increased uptake of specialty care for SCD crises over 10 years. By providing specialty care and reducing hospital admissions, payers and patients could save over US$1.9 billion in formal medical costs over 10 years. This equates to approximately 6.4 million h of patient time, or US$26 million in productivity losses as a result of reduced employee absenteeism. These savings equate to approximately US$2.0 billion in total societal costs.
Background
•
Care for vaso-occlusive crises often occurs in the emergency department. Specialty infusion care centers for sickle cell disease (SCD) crises have been created in some areas as an alternative.
•
Patients attending specialty infusion care centers experience reduced time to first dose of pain medication, quicker pain reassessment by attending medical staff and reduced inpatient hospitalization.
Methods
•
This paper develops a population-level Markov model to simulate the formal and informal impacts of greater access to specialty care for SCD for all adult SCD patients in the USA.
•
Our model is based on the findings from a previous research, which indicates that SCD centers provide more timely care during vaso-occlusive crises.
•
The model estimates healthcare utilization and costs and work absenteeism costs for SCD crises in the emergency department and specialty care settings.
Results
•
Uptake of specialty care for SCD could reduce formal medical costs by US$1.9 billion over 10 years and total societal costs by US$2 billion over 20 years.
•
Hospital admissions were estimated to decline by approximately 55,000 over 10 years.
Conclusion
•
Expanding uptake of specialty care for SCD crises has the potential to decrease costs while producing equal to greater health outcomes.
Acknowledgments
We gratefully acknowledge funding for this study from the Patient-Centered Outcomes Research Institute. We thank J Ogunsile, S Lanzkron and T Hoerger for their valuable feedback.
Disclaimer
The contents of this work are solely the responsibility of the authors and do not necessarily represent the views of the Patient- Centered Outcomes Research Institute (PCORI), its Board of Governors or Methodology Committee.
Financial & competing interests disclosure
This work was funded by the Patient-Centered Outcomes Research Institute (PCORI) under contract IDIQ-SOW #16-INSIGHT-AOSEPP-ENG. The authors have no other relevant affiliations or financial involvement with any organization or entity with a financial interest in or financial conflict with the subject matter or materials discussed in the manuscript apart from those disclosed.
Writing assistance in terms of editing and formatting of this manuscript was provided in-house within the terms of the contract.
Supplementary Material
File (appendix a.docx)
- Download
- 17.79 KB
References
Papers of special note have been highlighted as: • of interest; •• of considerable interest
1.
Tanabe P, Myers R, Zosel A et al. Emergency department management of acute pain episodes in sickle cell disease. Acad. Emerg. Med. 14(5), 419–425 (2008).
2.
Silbergleit R, Jancis MO, McNamara RM. Management of sickle cell pain crisis in the emergency department at teaching hospitals. J. Emerg. Med. 17(4), 625–30 (1999).
•• Prospective cohort study which compares care for adults with sickle cell disease (SCD) between the emergency department and specialty care center.
3.
Lanzkron S, Little J, Wang H et al. Treatment of acute pain in adults with sickle cell disease in an infusion center versus the emergency department: a multi-center prospective cohort study. Ann. Intern. Med. 174(9), 1207–1213 (2021).
• Provides an overview of the organization of an adult SCD program, including the perspectives of providers and patients.
4.
Rousseau R, Weisberg DF, Gorero J et al. Utilization, financial outcomes and stakeholder perspectives of a re-organized adult sickle cell program. PLoS ONE 15(7), e0236360 (2020).
5.
Okpala I, Thomas V, Westerdale N et al. The comprehensive care of sickle cell disease. Eur. J. Haematol. 68(3), 157–162 (2002).
6.
Yang YM, Shah AK, Watson M, Mankad VN. Comparison of costs to the health sector of comprehensive and episodic health care for sickle cell disease patients. Public Health Rep. 110(1), 80–86 (1995).
•• Defines various models of SCD care and the essential components for each.
7.
Kanter J, Smith WR, Desai PC et al. Building access to care in adult sickle cell disease: defining models of care, essential components, and economic aspects. Blood 4(16), 3804–3813 (2020).
8.
PCORI (Patient-Centered Outcomes Research Institute). Expanding access to the infusion center model for people living with SCD (2020). Available from: www.pcori.org/research-results/2019/expanding-access-infusion-center-model-people-living-scd
9.
U.S. Census Bureau. National population by characteristics, 2010–2019: population estimates by age (18+) (2020). Available from: www.census.gov/data/tables/time-series/demo/popest/2010s-national-detail.html#par_textimage_1537638156
10.
Hassell KL. Population estimates of sickle cell disease in the U.S. Am. J. Prev. Med. 38(4), S512–S521 (2010).
11.
Brousseau D, Owens P, Mosso A et al. Acute care utilization and rehospitalizations for sickle cell disease. JAMA 303(13), 1288–1294 (2010).
12.
National Center for Health Statistics. Martin JA, Hamilton BE, Osterman MJK, Driscoll AK. Births: final data for 2018. National Vital Statistics Reports. MD, USA 68(13), 1–46 (2020).
13.
Paulukonis S, Eckman J, Snyder A et al. 367–377 Defining sickle cell disease mortality using a population-based surveillance system, 2004 through 2008. Public Health Rep. 131(2), (2016).
14.
Brousseau D, Panepinto J, Nimmer M, Hoffman RG. The number of people with sickle-cell disease in the United States: national and state estimates. Am. J. Hematol. 85(1), 77–80 (2009).
• Reviews quality of life, economic costs, and utilization costs for adults with SCD across a variety of studies.
15.
Lee S, Vania DK, Bhor M et al. (2020). Patient-reported outcomes and economic burden of adults with sickle cell disease in the United States: a systematic review. Int. J. Gen. Med. 13, 361–377 (2020).
16.
Lanzkron S, Carroll CP, Haywood C. The burden of emergency department use for sickle-cell disease: an analysis of the national emergency department sample database. Am. J. Hematol. 85(10), 797– 799 (2010).
17.
HCUPnet, Healthcare Cost and Utilization Project. Free health care statistics. Agency for Healthcare Research and Quality, Rockville, MD. (n.d.). Available from: https://hcupnet.ahrq.gov/
18.
HHS AHRQ (U.S. Department of Health and Human Services, Agency for Healthcare Research and Quality). MEPS HC-201: 2017 full year consolidated data file [Dataset]. (2019). Available from: https://meps.ahrq.gov/mepsweb/data_stats/download_data_files_detail.jsp?cboPufNumber=HC-201
19.
Brown AM, Decker SL, Selck FW. Emergency department visits and proximity to patients' residences, 2009–2010. NCHS data brief, No 192. National Center for Health Statistics, MD, USA (2015).
20.
IRS (Internal Revenue Service). IRS issues standard mileage rates for 2020. (2019). Available from: www.irs.gov/newsroom/irs-issues-standard-mileage-rates-for-2020
21.
Lanzkron S, Little J, Field J et al. Increased acute care utilization in a prospective cohort of adults with sickle cell disease. Blood 2(18), 2412–2417 (2018).
22.
U.S. DOL BLS (U.S. Department of Labor, Bureau of Labor Statistics). Earnings, median usual weekly earnings, employed full time, 2018, by quarter. Labor force statistics from the Current Population Survey. Series ID LEU0252881500. Available from: www.bls.gov/cps/ (2018).
23.
Bazell C, Dieguez G, Ferro C, Mirchandani H. A claims-based analysis of sickle cell disease: prevalence, disease, complications, and costs. (2019). Available from: http://assets.milliman.com/ektron/A_claims-based_analysis_of_sickle_cell_disease_Prevalence_disease_complications_and_costs.pdf
24.
Huo J, Xiao H, Garg M, Shah C, Wilkie DJ, Mainous A III. PSY10: the economic burden of sickle cell disease in the United States. Value Health 21(Suppl. 2), S108 (2018).
25.
Molokie RE, Montminy C, Dionisio C et al. Opioid doses and acute care utilization outcomes for adults with sickle cell disease: ED versus acute care unit. Am. J. Emerg. Med. 36(1), 88–92 (2018).
26.
Zhang H, Kilaru AS, Meisel ZF, Bao Y. Prescription drug monitoring program mandates and opioids dispensed following emergency department encounters for patients with sickle cell disease or cancer with bone metastasis. JAMA 326(3), 274–276 (2021).
27.
Limenis E. Improving outpatient follow-up after discharge from hospital for patients with sickle cell disease at high risk for readmission. Paediatr. Child Health 22(Suppl. 1), e18 (2017).
28.
Shaiova L, Wallenstein D. Outpatient management of sickle cell pain with chronic opioid pharmacotherapy. JAMA 96(7), 984–986 (2004).
29.
Zaidi A, Estepp J, Shah N et al. A reanalysis of pain crises data from the pivotal l-glutamine in sickle cell disease trial. Contemp. Clin. Trials 110, 106546 (2021).
Information & Authors
Information
Published In
Pages: 399 - 409
PubMed: 35187950
Copyright
© 2022 Future Medicine Ltd.
History
Received: 19 October 2021
Accepted: 10 January 2022
Published online: 21 February 2022
Keywords:
Topics
Authors
Funding Information
Patient-Centered Outcomes Research Institute: IDIQ-SOW #16-INSIGHT-AOSEPP-ENG
Metrics & Citations
Metrics
Article Usage
Article usage data only available from February 2023. Historical article usage data, showing the number of article downloads, is available upon request.
Citations
How to Cite
An impact evaluation of two modes of care for sickle cell disease crises. (2022) Journal of Comparative Effectiveness Research. DOI: 10.2217/cer-2021-0257
Export citation
Select the citation format you wish to export for this article or chapter.
Citing Literature
- Lydia H. Pecker, Alexander K. Glaros, Monica L. Hulbert, Toward Health Care Structure–Informed Measures of Transition Success for Young Adults With Sickle Cell Disease, JAMA Network Open, 10.1001/jamanetworkopen.2026.22756, 9, 7, (e2622756), (2026).
- Paul Telfer, Kofi A. Anie, Stella Kotsiopoulou, Laura Aiken, Stephen Hibbs, Carol Burt, Sara Stuart-Smith, Sanne Lugthart, The acute pain crisis in sickle cell disease: What can be done to improve outcomes?, Blood Reviews, 10.1016/j.blre.2024.101194, 65, (101194), (2024).