Effects of cardiovascular single pill combinations compared with identical multi-pill therapies on healthcare cost and utilization in Germany
Publication: Journal of Comparative Effectiveness Research
Abstract
Aim: This study assessed whether a single pill combination (SPC) is associated with lower direct healthcare costs. Materials & methods: Anonymized claims data of patients ≥18 years treated with drugs for cardiovascular (CV)-related diseases either as a single pill combination or multi-pill combination (follow-up to 1 year) were evaluated. After propensity score matching, 59,336 out of 1,369,840 patients were analyzed. Results: In all cohorts, patients receiving a single pill combination had a lower frequency of general practitioner and specialist visits. The patients also had a significantly lower ratio of all-cause hospitalization days and number of CV-related prescriptions as well as all-cause prescriptions (with one exception) compared with those receiving a multi-pill combination. Conclusion: Direct CV-related costs were significantly lower in four out of seven comparisons, with a trend toward lower costs in the other three comparisons.
In 2015, about 49 million people across Europe suffered from at least one cardiovascular (CV) disease, with a high prevalence of hypertension and hyperlipidemia throughout the region [1]. Antihypertensives and lipid-lowering agents are recommended for treatment of these diseases [2], with most patients requiring multi-drug treatments [3]. For specific agent combinations, single pill combinations (SPCs) represent an attractive treatment option [3]. In existing SPCs, up to three different agents are combined in one pill, reducing the pill burden in comparison with multi-pill combinations (MPCs). It has been shown that SPCs are associated with improved adherence [4]. However, economic consequences are less clear in this respect, as potential advantages of SPCs (due to better treatment adherence and favorable clinical outcomes) might not directly translate into healthcare cost-savings. This is because drug treatments with higher adherence are typically associated with higher medication costs due to more regular prescriptions for these drugs. In addition, reflecting higher drug development cost, SPCs may be priced higher than MPCs. Consequently, in this real-world observational longitudinal study, the authors we aimed at analyzing direct healthcare costs associated with CV SPCs versus identical MPCs.
Methods
Study design
In this analysis, the authors assessed direct healthcare costs from the perspective of a German payor (Krankenkasse) for adult patients suffering from CV disorders and treated with a drug combination in the form of an SPC or identical MPC. The authors used an anonymized claims dataset from AOK PLUS, a German statutory health fund with 3.2 million insured persons, that covered the period 1/7/2012–30/6/2018. The dataset provided information on the socio-demographic characteristics of patients, inpatient and outpatient care and all documented diagnoses, prescription medications and costs (related to all of these items).
Patients
Patients 18 years of age or older were included in the analysis if they were continuously insured during the entire study period (1/7/2012–30/6/2018), death as the only exception to this rule, and had at least one inpatient or two outpatient claims measured in two different quarters from 1/7/2012 to 30/6/2017 for at least one of the following diseases (based on respective International Classification of Diseases, Tenth Revision, codes): hypertension, coronary heart disease (CHD), hyperlipidemia, myocardial infarction (MI), heart failure (HF), stroke, transient ischemic attack (TIA) and peripheral artery disease.
Based upon the above-mentioned criteria, patients who received the following agent combinations, either as an SPC or identical MPC, were selected for further comparison: bisoprolol/amlodipine (BIS/AMLO), valsartan/amlodipine (VAL/AMLO), candesartan/amlodipine (CAR/AMLO), valsartan/amlodipine/hydrochlorothiazide (VAL/AMLO/HCTZ), ramipril/amlodipine (RAMI/AMLO), ezetimibe/atorvastatin (EZE/ATOR) and acetylsalicylic acid/atorvastatin/ramipril (ASA/ATOR/RAMI). In addition, the following inclusion criteria were applied to patients in each cohort: for BIS/AMLO, VAL/AMLO, CAR/AMLO, VAL/AMLO/HCTZ and RAMI/AMLO combinations, a diagnosis of hypertension was required for comparison; for EZE/ATOR a previous diagnosis of hyperlipidemia was required; and or ASA/ATOR/RAMI, a previous diagnosis of MI, HF, TIA, stroke or embolism was required.
Comparisons were always made within identical agent combination groups (SPCs vs MPCs), and multiple assignments of patients to groups were possible. Analysis of one additional cohort was planned (atorvastatin/perindopril/amlodipine and a diagnosis of CHD) but could not be executed due to low sample sizes (105 SPC and six MPC patients).
Start of observation (index date)
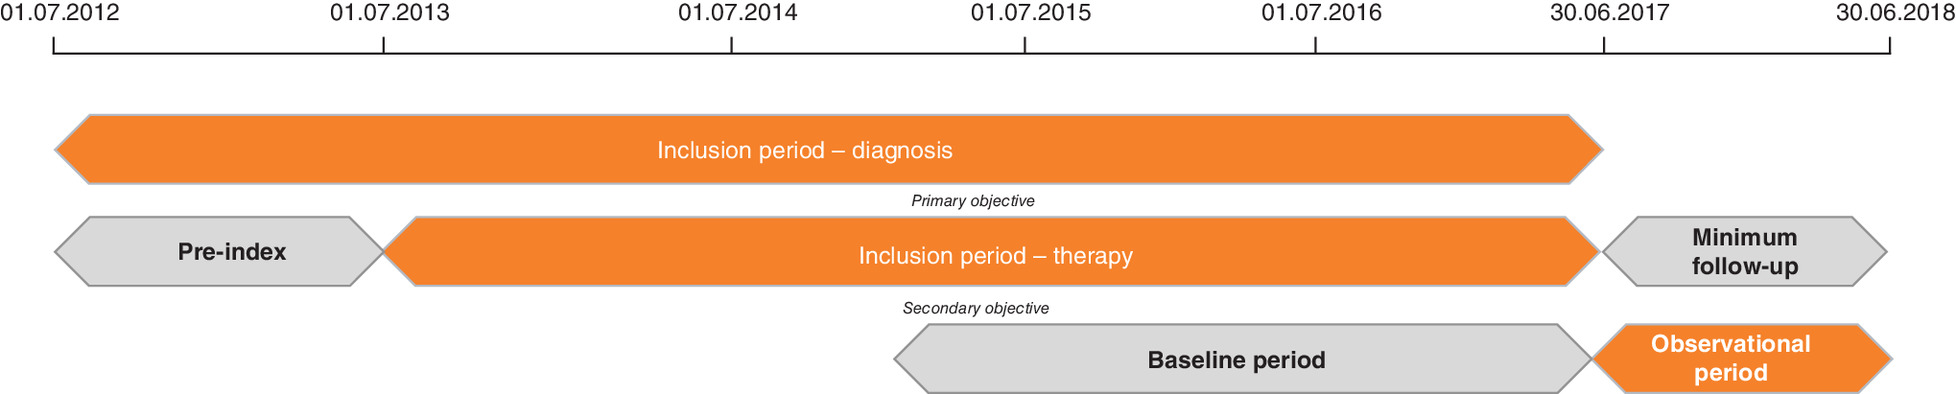
Patients who initiated combination therapy between 1/7/2013 and 30/6/2017 were included. The prescription of a respective combination therapy in 2012 or the first half of 2013 resulted in patient exclusion
(Figure 1). Observation of patients started on the date of the first prescription of combination therapy (index date), either as an SPC or MPC. The index date for the SPC group was the first prescription of a respective SPC. An MPC was assumed to have been prescribed if there were claims of all agents of the targeted combination therapy within 90 days; the index date was the prescription date of the last (second/third) agent in that combination.
Propensity score matching
To account for baseline differences, propensity score matching (PSM) was performed for each of the subgroups. In the PSM analysis, patients in the SPC cohort were separately matched to patients in the MPC cohort for each respective agent group. Propensity scores were calculated using logistic regression (group affiliation as the dependent variable), including age, gender and Charlson Comorbidity Index (CCI) score (without age factor) as fixed independent variables. All were based on information captured on the index date or during the 12-month baseline period. Furthermore, additional variables (measured during the 12-month baseline period) were interpreted to be potential predictors of CV outcomes and thus were incorporated as independent variables; these included CHA2DS2-VASc score; documented level of care; number of prescribed medications (counting each agent with at least two prescriptions, based on anatomical therapeutic chemical [ATC] classification system [ATC code] level 5; number of general practitioner [GP] visits; number of specialist visits; use of antihypertensive agents, oral antidiabetic agents, insulin, antiarrhythmic agents, nonsteroidal anti-inflammatory drugs, antiplatelets, lipid-lowering agents, drugs for peptic ulcer and gastroesophageal reflux disease [GORD], cardiac glycosides, oral corticosteroids and benzodiazepine derivatives; adherence to CV medications [ACT code C*]; weighted prescription-based medication possession ratio [MPR] and number of documented inpatient days; number of hospitalizations with any CV diagnosis as the main diagnosis; number of hospitalizations with any non-CV diagnosis as the main diagnosis; participation in a disease management program; and confirmed diagnosis of dementia, affective disorders or mental and behavioral disorders due to psychoactive substance/alcohol use).
A backward elimination approach was used to eliminate any variables that were not statistically significant in explaining group membership (p > 0.1); in such cases, these variables were excluded from specific PSM models. Each PSM was done using a one-to-one matching approach and the maximum accepted difference in propensity scores was 0.001. PSM quality was assessed in two ways: assessment of standardized differences between comparison groups to evaluate the balance of covariates after matching (number of variables with significant differences between SPC and MPC patients) and incidence assessment of a specific negative control event in the follow-up period (here: knee/hip replacement surgery) that was expected to be unrelated to the type of drug treatment received.
Follow-up periods, study outcomes & statistical analysis
Patients were followed from the index date until censorship. Patients were censored at one of the following events, whichever came first: the end of data availability (30/6/2018); all-cause death and therapy discontinuation defined as a gap in the observed drug supply of at least 60 days, based on the defined daily dose (DDD) per agent; a switch from SPCs to MPCs or vice versa; and the end of 12 months. Costs were always expressed as cost per patient-year (PPY).
The following health–economic outcomes were compared between the SPC and MPC cohorts: all-cause healthcare resource use (HCRU), direct CV-related costs and direct all-cause costs. For HCRU items, the following were considered: number of GP visits, number of specialist visits, number and duration of inpatient stays and number of outpatient drug prescriptions with ATC class C (CV-related drugs) and, alternatively, with any ATC class. For direct CV-related costs, the following were considered: the cost of outpatient visits (outpatient cases with a CV diagnosis), the cost of drug prescriptions within ATC group C and costs related to any inpatient stay with a main diagnosis of CV disease, based on a list of 48 different ICD-10 codes, which are available on request. For all-cause costs, all documented direct costs reimbursed by AOK PLUS were counted.
Drug costs were calculated based on documented list prices in the database. Inpatient costs were calculated based on documented diagnostic-related groups (DRGs), and outpatient costs were evaluated using aggregated-reimbursement fees per visit. Comparisons of HCRU among the SPC/MPC cohorts were made using rate ratios. Costs were compared by investigating the rate ratios of the costs PPY for SPC and MPC cohorts, based on Mann–Whitney tests. Days absent from work (all-cause/related to focus diagnosis) were calculated by onset and ending of sick certificate and compared between SPC and MPC for persons employed and unemployed if they were continuously insured during the entire study period (1/7/2012–30/6/2018).
All reported p-values were two-sided. All descriptive analyses were performed with Microsoft SQL Server 2014 and Microsoft Excel 2016. All other statistical analyses were performed with STATA/MP 13.1 and SPSS 17.0.
Regulatory aspects
Since the study used an anonymized dataset, no ethical review and no informed consent from patients were needed. However, the study protocol was reviewed by the scientific steering committee to which most of the authors belonged.
Results
Patient demographics
The authors identified a total of 1,369,840 continuously insured patients with at least one of the target diagnoses (Figure 2). After the PSM, the authors included 59,336 patients in the comparisons; patient numbers for matched and unmatched cohorts are provided in Table 1.
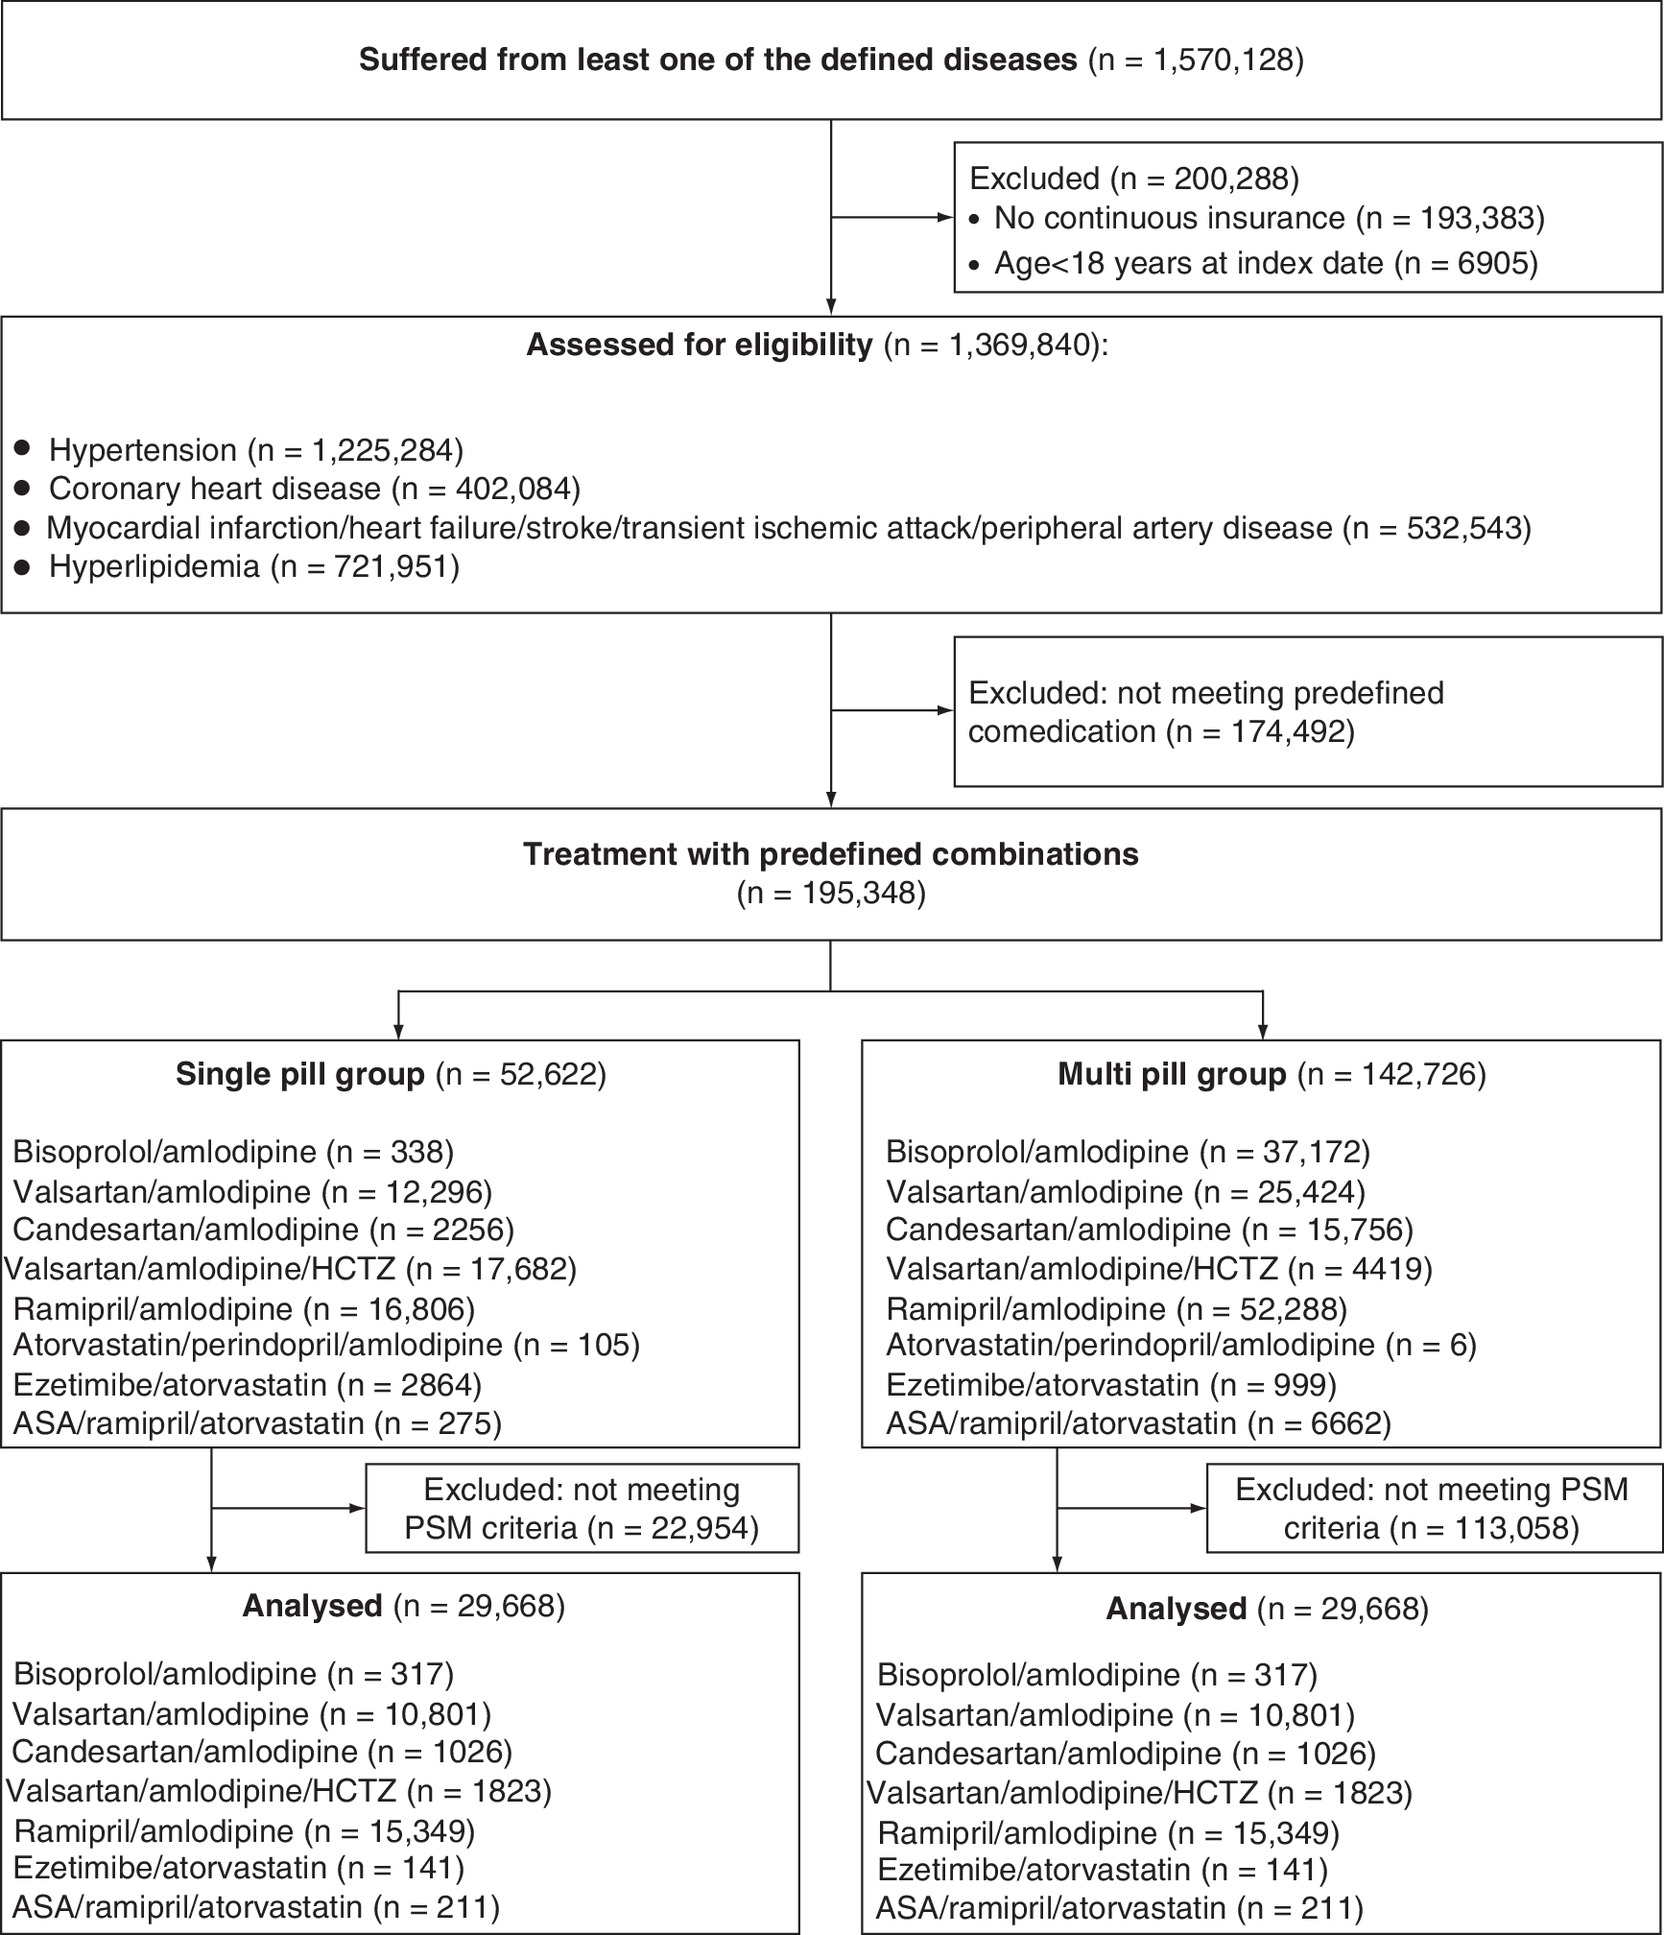
Figure 2. Patient attrition chart.
ASA: Acetylsalicylic acid; HCTZ: Hydrochlorothiazide; PSM: Propensity score matching.
| Cohort | Number of patients on SPC before PSM | Number of patients on MPC before PSM | Number of patients in each group after PSM |
|---|---|---|---|
| Total number of patients | 52,517 | 142,720 | 29,668 |
| Combination | |||
| – Bisoprolol/amlodipine | 338 | 37,172 | 317 |
| – Valsartan/amlodipine | 12,296 | 25,424 | 10,801 |
| – Candesartan/amlodipine | 2256 | 15,756 | 1026 |
| – Valsartan/amlodipine/hydrochlorothiazide | 17,682 | 4419 | 1823 |
| – Ramipril/amlodipine | 16,806 | 52,288 | 15,349 |
| – Ezetimibe/atorvastatin | 2864 | 999 | 141 |
| – ASA/atorvastatin/ramipril | 275 | 6662 | 211 |
ASA: Acetylsalicylic acid; MPC: Multi-pill combination; PSM: Propensity score matching; SPC: Single pill combination.
The patient characteristics were found to be similar across matched cohorts. Mean age, percentage of female patients and mean CCI in the 14 cohorts (respective SPC/MPC patients in the seven comparisons) are listed in Table 2. No significant difference in the number of hip/knee replacement surgeries was detected between compared cohorts (p-values between 0.172 and 1.000), with the exception of VAL/AMLO (p = 0.005), indicating that matches were generally well balanced and comparable.
| Variable | BIS/AMLO | VAL/AMLO | CAR/AMLO | VAL/AMLO/HCTZ | RAMI/AMLO | EZE/ATOR | ASA/ATOR/RAMI |
|---|---|---|---|---|---|---|---|
| SPC | n = 317 | n = 10.801 | n = 1.026 | n = 1.823 | n = 15.349 | n = 141 | n = 211 |
| – Mean age in years (SD) | 64.91 (13.87) | 69.74 (13.22) | 66.36 (13.35) | 71.55 (11.98) | 64.88 (13.83) | 64.81 (10.72) | 68.34 (11.44) |
| – Number of females (%) | 175 (55.21) | 6.163 (57.12) | 575 (56.02) | 1.079 (59.21) | 7.395 (48.24) | 44 (31.22) | 62 (29.45) |
| – Mean CCI (SD) | 2.12 (2.44) | 3.28 (2.89) | 2.29 (2.36) | 3.95 (3.05) | 2.04 (2.32) | 3.77 (2.23) | 3.72 (2.42) |
| – Mean CHA2DS2-VASc score (SD) | 3.03 (1.58) | 3.66 (1.68) | 3.09 (1.59) | 3.98 (1.61) | 2.92 (1.54) | 3.62 (1.45) | 3.63 (1.57) |
| – Mean number of agents (SD) | 4.26 (3.78) | 5.85 (4.12) | 4.44 (3.56) | 7.04 (4.13) | 4.06 (3.29) | 6.37 (3.69) | 5.63 (3.65) |
| – Mean number of CV hospitalizations (SD) | 0.02 (0.16) | 0.12 (0.37) | 0.05 (0.26) | 0.19 (0.52) | 0.04 (0.20) | 0.02 (0.14) | 0.02 (0.14) |
| – Mean number of any hospitalizations (SD) | 0.32 (0.68) | 0.89 (1.26) | 0.49 (1.18) | 1.30 (1.83) | 0.41 (0.91) | 1.01 (1.39) | 0.82 (1.08) |
| – Mean number of knee/hip replacements (SD) | 0.01 (0.08) | 0.02 (0.14) | 0.01 (0.11) | 0.02 (0.14) | 0.01 (0.11) | 0.01 (0.12) | 0.01 (0.07) |
| – Mean observational period in days (SD) | 352.46 (158.24) | 601.15 (487.93) | 386.12 (246.7) | 598.09 (502.85) | 642.39 (491.57) | 479.35 (316.07) | 476.68 (286.12) |
| – Number of deaths during follow-up (%) | 6 (1.86%) | 596 (5.52%) | 17 (1.66%) | 91 (4.99%) | 386 (2.51%) | 5 (3.55%) | 3 (1.42%) |
| MPC | n = 317 | n = 10.801 | n = 1.026 | n = 1.823 | n = 15.349 | n = 141 | n = 211 |
| – Mean age in years (SD) | 64.76 (13.95) | 69.62 (13.22) | 65.47 (14.02) | 71.30 (12.56) | 64.72 (14.11) | 64.03 (12.10) | 69.21 (11.31) |
| – N female (%) | 181 (57.14) | 6129 (56.70) | 565 (55.12) | 1068 (58.61) | 7424 (48.42) | 46 (32.63) | 64 (30.31) |
| – Mean CCI (SD) | 1.99 (2.09) | 3.29 (2.82) | 2.25 (2.41) | 3.99 (2.92) | 2.02 (2.23) | 3.97 (2.19) | 3.43 (2.16) |
| – Mean CHA2DS2-VASc score (SD) | 3.11 (1.58) | 3.65 (1.65) | 3.07 (1.55) | 4.01 (1.62) | 2.93 (1.51) | 3.69 (1.46) | 3.68 (1.54) |
| – Mean number of agents (SD) | 4.02 (3.02) | 5.86 (3.96) | 4.47 (3.46) | 7.14 (4.09) | 4.01 (3.26) | 6.40 (4.53) | 5.53 (3.69) |
| – Mean number of CV hospitalizations (SD) | 0.02 (0.15) | 0.12 (0.36) | 0.05 (0.24) | 0.12 (0.48) | 0.04 (0.20) | 0.03 (0.17) | 0.01 (0.10) |
| – Mean number of any hospitalizations (SD) | 0.36 (0.69) | 0.92 (1.22) | 0.49 (0.84) | 1.27 (1.48) | 0.43 (0.84) | 0.99 (1.0) | 0.84 (0.95) |
| – Mean number of knee/hip replacements (SD) | 0.01 (0.10) | 0.01 (0.12) | 0.02 (0.14) | 0.02 (0.14) | 0.01 (0.11) | 0.00 (0.00) | 0.01 (0.07) |
| – Mean observational period in days (SD) | 272.88 (353.52) | 501.24 (481.11) | 427.94 (455.77) | 212.56 (298.71) | 505.46 (491.33) | 274.8 (284.07) | 282.2 (371.06) |
| – Number of deaths during follow-up (%) | 8 (2.52%) | 794 (7.35%) | 37 (3.61%) | 74 (4.06%) | 686 (4.47%) | 2 (1.42%) | 6 (2.84%) |
ASA/ATOR/RAMI: Acetylsalicylic acid/atorvastatin/ramipril; BIS/AMLO: Bisoprolol/amlodipine; CAR/AMLO: Candesartan/amlodipine; CCI: Charlson Comorbidity Index; CV: Cardiovascular; EZE/ATOR: Ezetimibe/atorvastatin; MPC: Multi-pill combination; RAMI/AMLO: Ramipril/amlodipine; SD: Standard deviation; SPC: Single pill combination; VAL/AMLO: Valsartan/amlodipine; VAL/AMLO/HCTZ: Valsartan/amlodipine/hydrochlorothiazide.
The percentages of patients still continuing the index therapy after 12 months (SPCs/MPCs) were as follows in the seven PSM matched comparison groups: BIS/AMLO: 75.6% versus 20.8% (p < 0.001); VAL/AMLO: 68.9% versus 49.4% (p < 0.001); CAR/AMLO: 71.1% versus 40.7% (p < 0.001); VAL/AMLO/HCTZ: 75.1% versus 25.7% (p < 0.001); RAMI/AMLO: 76.4% versus 52.1% (p < 0.001); EZE/ATOR: 70.0% versus 47.8% (p < 0.001); and ASA/ATOR/RAMI: 80.9% versus 27.6% (p < 0.001). Consequently, the mean observation period for patients in the SPC cohorts was generally longer that in the MPC cohorts.
Healthcare resource use comparisons between single pill combination/multi-pill combinations patients
Table 3 summarizes the differences in HCRU between the observed SPC/MPC cohorts, expressed as rate ratios, while Supplemental Table 1 provides absolute numbers. For all cohorts, patients receiving SPCs attended fewer GP visits than patients receiving MPCs (rate ratios: between 0.904 and 0.981; 95% CIs: between 0.84 and 1.01; p-values: between <0.001 and 0.048; rate ratio for EZE/ATOR: 0.930; 95% CI: 0.83–1.04; p > 0.100). This also applied to all-cause specialist visits (rate ratios: between 0.645 and 0.962; 95% CIs: between 0.50 and 1.08; p-values: between <0.001 and 0.073), with the exception of patients receiving EZE/ATOR (rate ratio: 1.128; 95% CI: 0.92–1.38; p > 0.100). Similarly, the rate ratio of all-cause hospitalization days (SPCs vs MPCs) was between 0.172 and 0.714 in all seven comparisons, indicating a significantly lower hospitalization duration for all SPC cohorts (p < 0.001 for all comparisons; 95% CIs: between 0.14 and 0.73). Finally, the number of CV-related prescriptions as well as all-cause prescriptions was significantly lower (with the exception of CAR/AMLO: 0.979; p = 0.094; CI: 0.95–1.01) in all SPC cohorts (rate ratios: between 0.358 and 0.930; p < 0.001 for comparisons; 95% CIs: between 0.35 and 0.97).
| Variable | BIS/AMLO | VAL/AMLO | CAR/AMLO | VAL/AMLO/HCTZ | RAMI/AMLO | EZE/ATOR | ASA/ATOR/RAMI | |||||||
|---|---|---|---|---|---|---|---|---|---|---|---|---|---|---|
| Rate ratio† | p-value | Rate ratio† | p-value | Rate ratio† | p-value | Rate ratio† | p-value | Rate ratio† | p-value | Rate ratio† | p-value | Rate ratio† | p-value | |
| Number of all-cause GP visits PPY | 0.930 (0.85–1.01) | p = 0.048 | 0.981 (0.97–0.99) | p < 0.001 | 0.955 (0.92–1.00) | p = 0.014 | 0.904 (0.88–0.93) | p < 0.001 | 0.963 (0.95–0.97) | p < 0.001 | 0.930 (0.83–1.04) | p > 0.100 | 0.917 (0.84–1.01) | p = 0.033 |
| Number of all-cause specialist visits PPY | 0.645 (0.50–0.83) | p < 0.001 | 0.876 (0.85–0.90) | p < 0.001 | 0.962 (0.85–1.08) | p > 0.100 | 0.939 (0.86–1.02) | p = 0.073 | 0.751 (0.73–0.77) | p < 0.001 | 1.128 (0.92–1.38) | p > 0.100 | 0.731 (0.61–0.87) | p < 0.001 |
| Number of all-cause hospitalization days PPY | 0.488 (0.44–0.54) | p < 0.001 | 0.714 (0.70–0.73) | p < 0.001 | 0.484 (0.41–0.57) | p < 0.001 | 0.431 (0.40–0.46) | p < 0.001 | 0.554 (0.54–0.57) | p < 0.001 | 0.568 (0.43–0.74) | p < 0.001 | 0.172 (0.14–0.22) | p < 0.001 |
| Number of CV prescriptions‡ PPY | 0.578 (0.53–0.63) | p < 0.001 | 0.884 (0.87–0.90) | p < 0.001 | 0.921 (0.88–0.97) | p < 0.001 | 0.358 (0.35–0.37) | p < 0.001 | 0.750 (0.74–0.76) | p < 0.001 | 0.597 (0.53–0.67) | p < 0.001 | 0.650 (0.59–0.72) | p < 0.001 |
| Number of all-cause prescriptions PPY | 0.750 (0.71–0.80) | p < 0.001 | 0.930 (0.92–0.94) | p < 0.001 | 0.979 (0.95–1.01) | p = 0.094 | 0.474 (0.46–0.48) | p < 0.001 | 0.820 (0.81–0.83) | p < 0.001 | 0.658 (0.61–0.71) | p < 0.001 | 0.657 (0.61–0.70) | p < 0.001 |
†
Rate ratio single pill combination versus multi-pill combination (95% CI).
‡
CV prescriptions: any prescribed agents with anatomical therapeutic chemical code C-.
ASA/ATOR/RAMI: Acetylsalicylic acid/atorvastatin/ramipril; BIS/AMLO: Bisoprolol/amlodipine; CAR/AMLO: Candesartan/amlodipine; CV: Cardiovascular; EZE/ATOR: Ezetimibe/atorvastatin; GP: General practitioner; PPY: Per patient-year; RAMI/AMLO: Ramipril/amlodipine; VAL/AMLO: Valsartan/amlodipine; VAL/AMLO/HCTZ: Valsartan/amlodipine/hydrochlorothiazide.
In six out of seven comparisons, more days absent from work under MPC treatment versus SPC were observed (BIS/AMLO: 3.89 days SPC vs 6.10 days MPC; VAL/AMLO: 3.04 days SPC vs 3.09 days MPC; CAR/AMLO: 6.71 days SPC vs 4.12 days MPC; VAL/AMLO/HCTZ: 2.65 days SPC vs 2.98 days MPC; RAMI/AMLO: 3.80 days SPC vs 4.25 days MPC; EZE/ATOR: 4.97 days SPC vs 8.02 days MPC; ASA/ATOR/RAMI: 3.19 days SPC vs 5.50 days MPC) (Supplemental Figure 1).
Cost comparisons between single pill combination/multi-pill combinations patients
Table 4 summarizes the results of the comparison of direct CV-related costs in the SPC/MPC cohorts, expressed as rate ratios; respective absolute numbers are available in Supplemental Table 2.
| Variable | BIS/AMLO | VAL/AMLO | CAR/AMLO | VAL/AMLO/HCTZ | RAMI/AMLO | EZE/ATOR | ASA/ATOR/RAMI | |||||||
|---|---|---|---|---|---|---|---|---|---|---|---|---|---|---|
| Cost rate ratio† | p-value | Cost rate ratio† | p-value | Cost rate ratio† | p-value | Cost rate ratio† | p-value | Cost rate ratio† | p-value | Cost rate ratio† | p-value | Cost rate ratio† | p-value | |
| CV-related hospitalizations | 0.751 (-0.08–1.59) | p > 0.100 | 0.750 (0.70–0.80) | p < 0.001 | 0.443 (0.18–0.71) | p = 0.019 | 0.372 (0.25–0.50) | p < 0.001 | 0.583 (0.47–0.69) | p < 0.001 | 0.396 (-0.04–0.83) | p > 0.100 | 0.350 (0.01–0.69) | p > 0.100 |
| CV-related outpatient visits‡ | 0.989 (0.81–1.17) | p > 0.100 | 0.957 (0.93–0.99) | p = 0.008 | 0.936 (0.84–1.02) | p < 0.001 | 0.923 (0.84–1.00) | p = 0.075 | 0.948 (0.92–0.97) | p < 0.001 | 0.905 (0.62–1.19) | p > 0.100 | 0.933 (0.67–1.20) | p > 0.100 |
| CV-related prescriptions | 0.921 (0.73–1.11) | p > 0.100 | 1.953 (1.82–2.09) | p < 0.001 | 0.950 (0.70–1.19) | p > 0.100 | 1.403 (1.29–1.51) | p < 0.001 | 1.318 (1.27–1.35) | p < 0.001 | 0.971 (0.75–1.19) | p > 0.100 | 1.031 (0.65–1.41) | p > 0.100 |
| Sum of direct CV-related healthcare costs | 0.881 (0.60–1.16) | p > 0.100 | 0.878 (0.83–0.92) | p < 0.001 | 0.819 (0.69–0.95) | p = 0.017 | 0.795 (0.69–0.90) | p = 0.002 | 0.918 (0.87–0.97) | p = 0.002 | 0.843 (0.45–1.23) | p > 0.100 | 0.518 (0.14–0.90) | p > 0.100 |
†
Rate ratio single pill combination versus multi-pill combination (95% CI).
‡
Case with at least one CV diagnosis.
ASA/ATOR/RAMI: Acetylsalicylicacid/atorvastatin/ramipril; BIS/AMLO: Bisoprolol/amlodipine; CAR/AMLO: Candesartan/amlodipine; CV: Cardiovascular; EZE/ATOR: Ezetimibe/atorvastatin; RAMI/AMLO: Ramipril/amlodipine; VAL/AMLO: Valsartan/amlodipine; VAL/AMLO/HCTZ: Valsartan/amlodipine/hydrochlorothiazide.
With regard to CV-related hospitalizations, four out of seven rate ratios demonstrated significantly lower costs PPY, with ratios of 0.372–0.750 (p < 0.001; 95% CIs: between 0.25 and 0.80). The other three combinations, EZE/ATOR, ASA/ATOR/RAMI and BIS/AMLO, demonstrated a tendency toward lower costs associated with SPC (rates: between 0.350 and 0.751; p-values: between 0.019 and >0.100; 95% CIs: between 0.01 and 1.59). Costs (PPY) associated with CV-related outpatient visits showed a lower trend in the SPC cohorts as compared with the MPC cohorts (significant in three out of seven comparisons; VAL/AMLO, CAR/AMLO, RAMI/AMLO, rates: between 0.936 and 0.948 with p < 0.001–0.008; 95% CIs: between 0.84 and 1.02). In three out of seven cohorts (VAL/AMLO, VAL/AMLO/HCTZ, RAMI/AMLO), the rate ratio of CV-related prescriptions (PPY) indicated higher expenses among the SPC cohorts, with ratios of 1.318–1.953 (p < 0.001; 95% CIs: between 1.27 and 2.09). Finally, overall direct CV-related costs were lower in all comparisons and significantly lower in four out of the seven observed cohorts (VAL/AMLO, CAR/AMLO, VAL/AMLO/HCTZ, RAMI/AMLO), with ratios of 0.795–0.918 (p-values: between <0.001 and 0.017; 95% CIs: between 0.69 and 0.97). Costs for medication were lower in five out of seven comparisons for SPCs and costs for curative means and aids (PPY) were lower in the SPC group in six out of seven comparisons compared with MPCs (Supplemental Figures 2 & 3).
Comparisons of all-cause direct costs (PPY) between SPC/MPC cohorts showed that there was a tendency toward lower cost in all comparisons; in five out of seven comparisons the respective cost differences reached statistical significance (VAL/AMLO, CAR/AMLO, VAL/AMLO/HCTZ, RAMI/AMLO, ASA/ATOR/RAMI; p-values: between <0.001 and 0.021) (Figure 3).
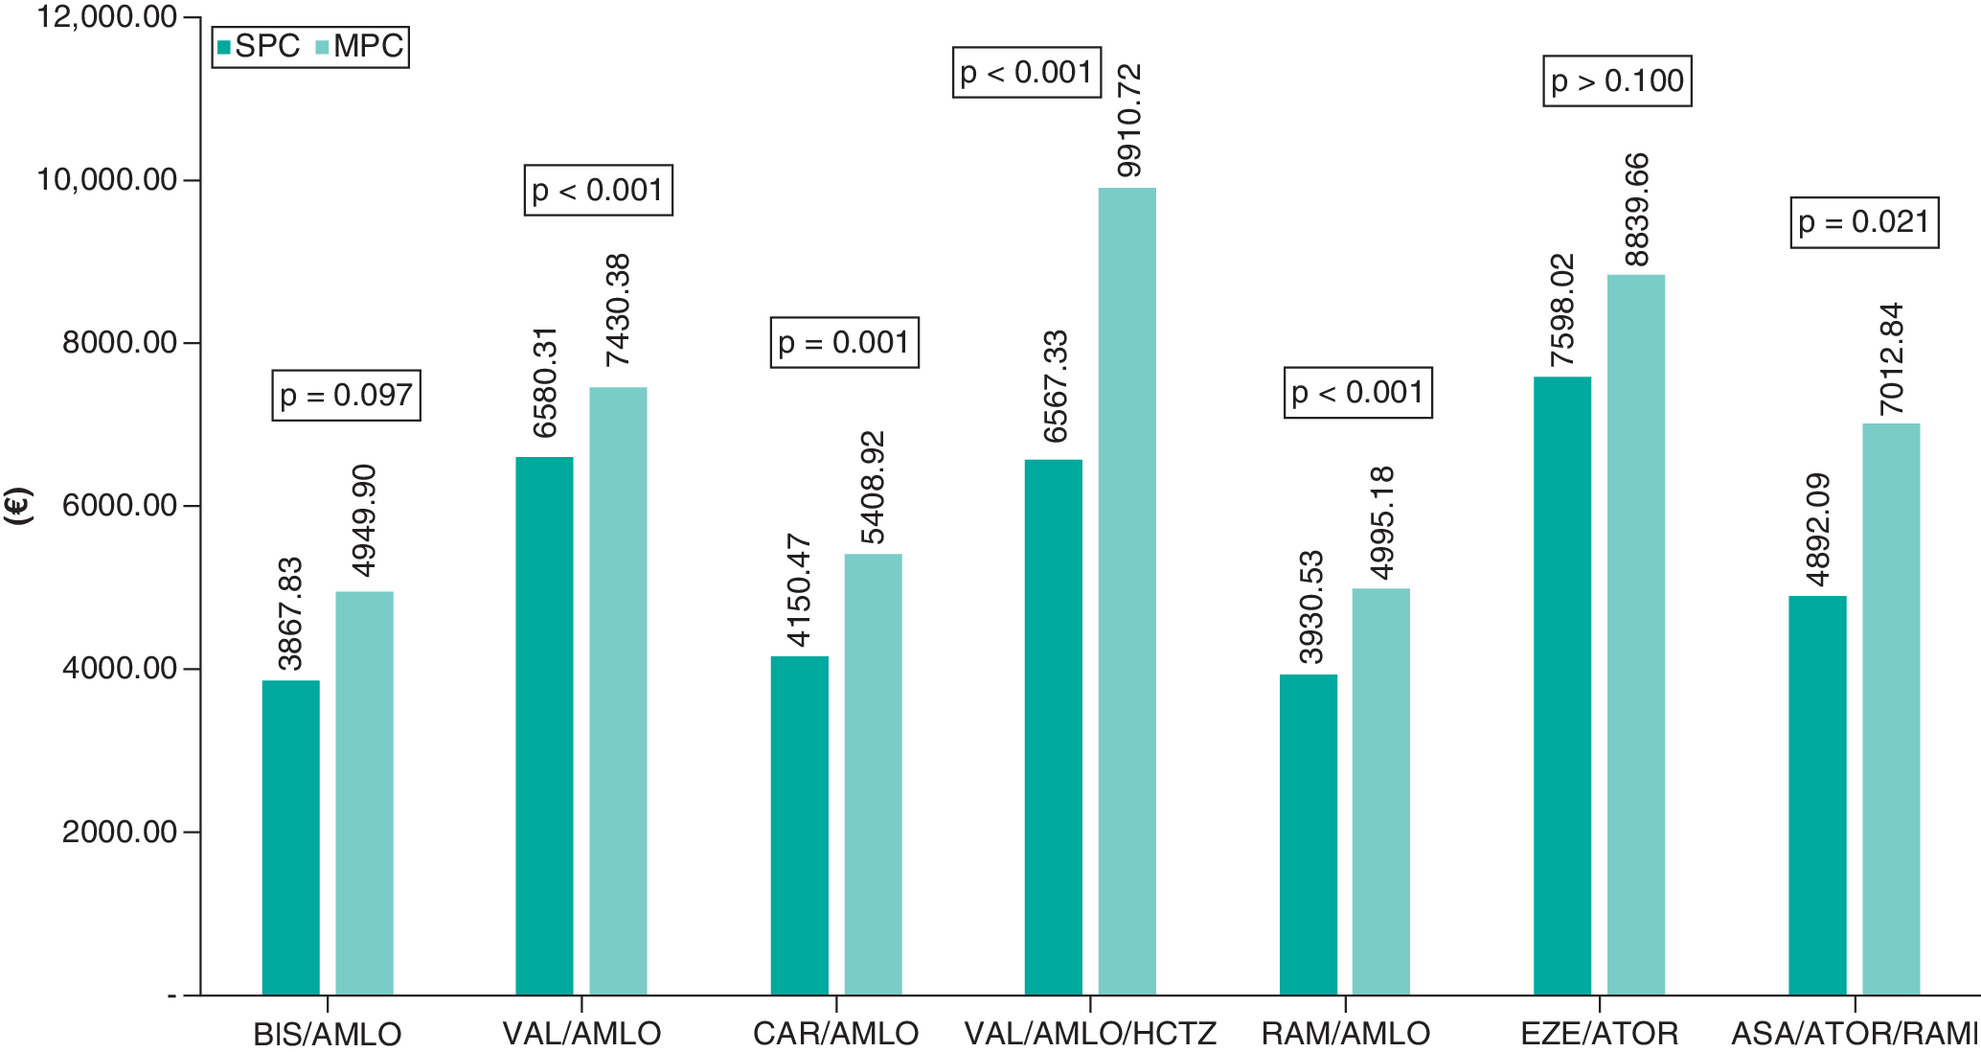
Figure 3. Comparison of all-cause direct cost in matched single pill combination versus multi-pill combination cohorts.
ASA/ATOR/RAMI: Acetylsalicylic acid/atorvastatin/ramipril; BIS/AMLO: Bisoprolol/amlodipine; CAR/AMLO: Candesartan/amlodipine; EZE/ATOR: Ezetimibe/atorvastatin; MPC: multi-pill combination; RAMI/AMLO: Ramipril/amlodipine; SPC: Single pill combination; VAL/AMLO: Valsartan/amlodipine; VAL/AMLO/HCTZ: Valsartan/amlodipine/hydrochlorothiazide.
Discussion
Current ESC/ESH guidelines for the management of hypertension and prevention of CV events recommend the use of drug combination treatments [3]. Specifically, they state that “combination treatment is recommended for most hypertensive patients as initial therapy. Preferred combinations should comprise a renin-angiotensin system blocker (either an angiotensin-converting enzyme inhibitor or an angiotensin receptor blocker) with a calcium channel blocker or diuretic. Other combinations of the five major classes can be used” [3]. In clinical practice it is known that adherence to these treatments decreases with each additional pill a patient takes [3,5]. A previous meta-analysis showed that in hypertension and/or dyslipidemia, treatment with SPCs leads to better persistence and adherence, an improvement in systolic blood pressure control, fewer outpatient visits and a reduction in emergency room visits and hospitalizations when compared with the identical MPC therapy [1]. However, the net effect of using an SPC versus an MPC regimen on overall direct healthcare costs has yet to be thoroughly explored, specifically as better adherence/persistence is typically associated with higher drug cost.
This German claims data study aimed to fill this knowledge gap, by comparing HCRU and direct healthcare spending between matched patients receiving SPCs versus those receiving MPCs for seven different agent combinations. The authors minimized confounding on patients' data by using PSM methodology. By comparing identical drug combinations, the authors sought to minimize the impact of different compounds on HCRU and cost. So, the only relevant difference between the treatment received by each group was the route of administration, either as an SPC or as an MPC. Since we had access to much larger patient cohorts than in clinical trials and included all patients in the AOK PLUS database meeting the inclusion criteria, there was no substantial patient/site selection in this study. Therefore, the authors believe the generalizability of these results to be very high.
The data show that SPCs are associated with a lower HCRU and lower direct outpatient and cost of CV-related hospitalizations. Even when taking higher drug costs associated with SPCs into account, there was still a cost-reducing effect for overall direct CV-related and all-cause health expenses in four out of seven cohort comparisons. In the remaining cohorts, there was a tendency toward lower costs in SPC cohorts; however, these were not found to be statistically significant, mainly due to low sample sizes.
The authors expected that outpatient costs would be lower in the SPC cohorts, as single pills typically require fewer prescriptions and, therefore, fewer physician visits. Lower hospitalization costs associated with SPCs are probably related to lower CV event rates; respective results are being published in parallel. The authors also expected that SPCs would be associated with higher drug costs, due to two reasons: better treatment adherence/persistence and higher drug prices. The authors could confirm this hypothesis partially, as the results indeed showed higher drug costs in some comparisons. However, the analysis also showed that lower outpatient and CV-related hospitalization costs in SPC patients mitigate and even remediate these higher drug costs over time, so that overall direct CV-related and all-cause costs are mainly lower in the SPC cohorts.
Despite a shortage of literature on the impact of SPCs (vs MPCs) on real-world costs, these findings align with the existing literature on persistence/adherence and healthcare spending. Several authors analyzed the cost–effectiveness of CV SPCs (vs MPCs) using a cost–effectiveness modeling approach and trial-based data including CV event rates associated with both treatment strategies. For the USA, Sri Lanka, India, UK and Spain, different authors concluded that SPC-associated costs are higher than MPC-associated costs, but an SPC is still cost–effective based on known incremental cost–effectiveness ratio thresholds [6–10]. The present study shows that an SPC represents a cost-minimizing treatment strategy, due in part to reductions in long-term CV events and associated hospitalizations, which are typically not covered in clinical trials feeding the cost–effectiveness models.
An Italian study concluded that an antihypertensive SPC leads to lower primary healthcare costs due to a lower frequency of outpatient visits, a finding that also aligns with the data in the present study [11]. Machnicki et al. performed a large US Marketscan analysis addressing a single pill combination of AMLO/VAL/HCTZ versus a multi-pill combination of the same agents. In further support of the present findings, they also identified a significantly lower mean number of resource utilization events such as outpatient visits, hospitalizations or emergency room visits [12].
Due to its observational design, this study has some limitations. First, it compared non-randomized cohorts. To address this, the authors used PSM methodology. Due to different patient characteristics and to the fact that within some drug combinations patient size in the SPC was higher than in the MPC cohort, the authors were able to find matching partners for only 57% of the SPC patients. In addition, physicians probably made specific decisions when and why to prescribe an SPC versus an MPC, and some of the underlying reasons for these decisions cannot be adjusted in a PSM. The authors nevertheless quality-checked their PSM by comparing patient characteristics after matching and, as an additional negative control, hip and knee replacement surgery frequencies as an outcome potentially independent of exposure to SPC or MPC regimens. The authors could not detect any major differences between SPC and MPC patients after matching and could not observe any difference in the number of hip/knee replacement surgeries. Second, follow-up periods were significantly different between SPC and MPC regimens, due mainly to the higher treatment persistence of SPC patients (which impacted censorship). Both any unobserved remaining differences between SPC and MPC patients and any bias resulting from different observational periods could only be overcome in a randomized trial design, most probably designed as a pragmatic trial with randomization of patients to SPC versus MPV and a real-world treatment of patients thereafter. Third, the cost calculations were based on prices documented in the database, which were mainly list prices. Potential payor-specific discounts on drug prices, specifically, were not considered. Finally, the present study is based on German data only. So, unique price structures for specific healthcare items might have led to different results in other countries, where local pricing factors vary.
In three out of seven comparisons, there were lower patient numbers in the cohorts. This might be related to the different time point of market entry of the SPCs that were analyzed. The combination BIS/AMLO has been available in the German market since 1 June 2016, CAR/AMLO since 15 September 2016, VAL/AMLO since 15 January 2007, RAMI/AMLO since 15 August 2012, VAL/AMLO/HCTZ since 15 November 2009, ASA/ATOR/RAMI since 15 May 2015 and EZE/ATOR since 1 March 2015.
Conclusion
This study shows that a CV SPC is a cost-minimizing treatment strategy that should be recommended from a health–economic perspective and underlines the current guidelines for the treatment of arterial hypertension.
•
Single pill combinations, compared with multi pill regimens of the same agents, might lead to better patients adherence, superior clinical outcomes and, finally, lower cost.
•
This study compared single pill versus multi-pill regimens in patients who started the respective treatments. Comparisons were done within agent-specific patient subgroups and were based on propensity score matched groups.
•
This study showed that single pill regimens lead in most cases to lower healthcare costs, even if typically drug costs increase due to higher levels of therapy adherence. This is mainly explained by significantly lower inpatient cost.
Author contributions
T Wilke, S Müller and U Maywald had full access to all the data in the study and take responsibility for the integrity of the data and the accuracy of the data analysis. T Wilke, U Maywald, S Müller, J Blettenberg and O Randerath conceived and designed the study. T Wilke and S Müller analyzed the data. T Wilke and M Böhm drafted the manuscript. B Weisser, HG Predel, RE Schmieder, S Wassmann, A Gillessen, J Blettenberg, U Maywald, O Randerath, S Müller and M Böhm critically revised the manuscript for important intellectual content. The final version of the paper has been seen and approved by all the authors.
Financial & competing interests disclosure
Funding was provided by APONTIS PHARMA Deutschland GmbH & Co. KG, Monheim, Germany. T Wilke is head of IPAM e.V., which did the analyses described in this study. IPAM receives financial support for its studies. O Randerath is an employee of APONTIS PHARMA Deutschland. S Müller is an employee of Ingress-Health HWM GmbH, which developed the study protocol; that work was financially supported by APONTIS. U Maywald is an employee of AOK PLUS. The authors have no other relevant affiliations or financial involvement with any organization or entity with a financial interest in or financial conflict with the subject matter or materials discussed in the manuscript apart from those disclosed.
No writing assistance was utilized in the production of this manuscript.
Open access
This work is licensed under the Attribution-NonCommercial-NoDerivatives 4.0 Unported License. To view a copy of this license, visit http://creativecommons.org/licenses/by-nc-nd/4.0/
Supplementary Material
References
1.
Weisser B, Predel HG, Gillessen A et al. Single pill regimen leads to better adherence and clinical outcome in daily practice in patients suffering from hypertension and/or dyslipidemia: results of a meta-analysis. High Blood Press. Cardiovasc. Prev. 27(2), 157–164 (2020).
2.
Cesari M, Pessina AC. Combined antihypertensive and lipid-lowering treatment. Curr. Hypertens. Rep. 6(4), 300–306 (2004).
3.
Williams B, Mancia G, Spiering W et al. 2018 ESC/ESH guidelines for the management of arterial hypertension. Eur. Heart J. 39(33), 3021–3104 (2018).
4.
Corrao G, Zambon A, Parodi A et al. Discontinuation of and changes in drug therapy for hypertension among newly-treated patients: a population-based study in Italy. J. Hypertens. 26(4), 819–824 (2008).
5.
Gerbino PP, Shoheiber O. Adherence patterns among patients treated with fixed-dose combination versus separate antihypertensive agents. Am. J. Heal. Pharm. 64(12), 1279–1283 (2007).
6.
Wang X, Chen H, Essien E et al. Medication adherence to antihypertensive triple-combination therapy among patients enrolled in a Medicare advantage plan. J. Manag. Care Spec. Pharm. 25(6), 678–686 (2019).
7.
Lung T, Jan S, de Silva HA et al. Fixed-combination, low-dose, triple-pill antihypertensive medication versus usual care in patients with mild-to-moderate hypertension in Sri Lanka: a within-trial and modelled economic evaluation of the TRIUMPH trial. Lancet Glob. Heal. 7(10), e1359–e1366 (2019).
8.
Gaziano TA, Fonarow GC, Claggett B et al. Cost–effectiveness analysis of sacubitril/valsartan vs enalapril in patients with heart failure and reduced ejection fraction. JAMA Cardiol. 1(6), 666–672 (2016).
9.
Singh K, Crossan C, Laba TL et al. Cost–effectiveness of a fixed dose combination (polypill) in secondary prevention of cardiovascular diseases in India: within-trial cost–effectiveness analysis of the UMPIRE trial. Int. J. Cardiol. 262, 71–78 (2018).
10.
Barrios V, Kaskens L, Castellano JM et al. Usefulness of a cardiovascular polypill in the treatment of secondary prevention patients in Spain: a cost–effectiveness study. Rev. Española Cardiol. (English Ed.) 70(1), 42–49 (2017).
11.
Putignano D, Orlando V, Monetti VM et al. Fixed versus free combinations of antihypertensive drugs: analyses of real-world data of persistence with therapy in Italy. Patient Prefer. Adherence 13, 1961–1969 (2019).
12.
Machnicki G, Ong SH, Chen W, Wei ZJ, Kahler KH. Comparison of amlodipine/valsartan/hydrochlorothiazide single pill combination and free combination: adherence, persistence, healthcare utilization and costs. Curr. Med. Res. Opin. 31(12), 2287–2296 (2015).
Information & Authors
Information
Published In
Pages: 411 - 422
PubMed: 35315281
Copyright
© 2022 The Authors. This work is licensed under the Attribution-NonCommercial-NoDerivatives 4.0 Unported License
History
Received: 11 August 2021
Accepted: 17 December 2021
Published online: 22 March 2022
Keywords:
Topics
Authors
Funding Information
APONTIS PHARMA Deutschland GmbH & Co. KG
Metrics & Citations
Metrics
Article Usage
Article usage data only available from February 2023. Historical article usage data, showing the number of article downloads, is available upon request.
Citations
How to Cite
Effects of cardiovascular single pill combinations compared with identical multi-pill therapies on healthcare cost and utilization in Germany. (2022) Journal of Comparative Effectiveness Research. DOI: 10.2217/cer-2021-0197
Export citation
Select the citation format you wish to export for this article or chapter.
Citing Literature
- Burkhard Weisser, Adhärenz, Single Pill und Endpunkte – was ist gesichert und wie sieht die Wirklichkeit aus?, Die Innere Medizin, 10.1007/s00108-025-01965-7, 66, 10, (1100-1107), (2025).
- Zahra Pirayesh, Sima Sobhani Shahri, Azar Zare Noughabi, Marzieh Heshmati, Saeede Khosravi Bizhaem, Shima Jafariy, Toba Kazemi, Antihypertensive Drugs in an Iranian Population, Prevalence and Variety of Single Pill Combination (SPC), International Journal of High Risk Behaviors and Addiction, 10.5812/ijhrba-151471, 13, 4, (2025).
- Alberto Zambon, Evangelos Liberopoulos, Melania Dovizio, Chiara Veronesi, Luca Degli Esposti, Leopoldo Pérez de Isla, A real-world analysis of adherence, biochemical outcomes, and healthcare costs in patients treated with rosuvastatin/ezetimibe as single-pill combination vs. free combination in Italy, European Heart Journal Open, 10.1093/ehjopen/oeae074, 4, 5, (2024).
- Felix Götzinger, Marita Kieble, Andrea Espinosa Daudí, Michael Kunz, Lucas Lauder, Michael Böhm, Ulrich Laufs, Felix Mahfoud, Martin Schulz, Use of fixed-dose combinations for cardiovascular indications from 2018 to 2023: a nationwide population-based study, Journal of Hypertension, 10.1097/HJH.0000000000003789, 42, 10, (1720-1727), (2024).