Effectiveness of bisoprolol versus other β-blockers and other antihypertensive classes: a cohort study in the Clinical Practice Research Datalink
Publication: Journal of Comparative Effectiveness Research
Abstract
Aim: To compare blood pressure (BP) and safety outcomes in patients with hypertension initiating bisoprolol, versus other β-blockers, angiotensin-converting enzyme inhibitors/angiotensin II receptor blockers, calcium channel blockers or diuretics. Materials & methods: New user cohort study. Patients initiating bisoprolol were matched with up to four patients, in each comparator cohort using propensity score. BP outcomes were compared using linear mixed models and safety outcomes using Cox proportional hazards. Results: Differences in average systolic and diastolic BP variation were ≤3 mmHg between bisoprolol versus the compared classes. No difference was observed in risk of diabetes, obesity or erectile dysfunction. An increased dyslipidemia risk was only observed versus diuretics (hazard ratio: 0.76; 98.75% CI: 0.58, 0.99). Conclusion: No differences in BP variation and safety outcomes.
The current treatment landscape for hypertension consists of five major drug classes: β-blockers, angiotensin-converting enzyme inhibitors (ACEi), angiotensin II receptor blockers (ARBs), calcium channel blockers (CCBs) and diuretics (including thiazides and thiazide-like diuretics) [1]. Present guidelines vary in their recommendations regarding the use of β-blockers in patients with hypertension. They are recommended by the European Society of Cardiology and European Society of Hypertension guidelines particularly in patients with hypertension presenting with comorbidities such as postmyocardial infarction, angina or heart failure [1]. However, some national guidelines, such as the National Institute for Health and Care Excellence guidance [2], do not recommend the use of β-blockers as a first-line agent for hypertension.
Blood pressure (BP) is a meaningful and well-regarded clinical outcome to compare antihypertensive classes due to its correlation with cardiovascular events such as heart failure, stroke, myocardial infarction and sudden death [1]. A meta-analysis of 354 randomized clinical trials (RCTs) reported similar mean placebo-corrected BP across the five main antihypertensive classes [3]. Furthermore, a more recent non interventional study in the USA has shown that β-blockers offer comparable BP reductions to other antihypertensive classes [4]. However, a limitation of this study is that BP changes were assessed only as the difference between two measurements: before treatment initiation and at the latest BP record, with the follow-up time ranging from 1 week to 1 year, ending at the earliest point that antihypertensive treatment was changed within this timeframe [4]. In clinical practice, BP measurements performed at each visit, reflect the continuous management of patients with hypertension. The present study applied mixed models and multistate models to evaluate the full trajectory of BP variation observed in patients treated with a first-line monotherapy.
Another limitation of the studies mentioned above is their evaluation of different types of β-blocker as a single category [5], which means that the effectiveness of individual β-blockers is not well understood. β-blockers are a heterogenous class with different mechanisms of action, including β-adrenergic receptor 1, 2 and 3 (β-1, β-2 and β-3) antagonists. First-generation β-blockers are non selective and block both β-1- and β-2 receptors. Second- and third-generation β-blockers are selective for β-1 receptors, which are activated during cardiac contraction. Third-generation β-blockers exert additional vasodilative effects by blocking alpha-1 adrenoreceptors and activating β-3-adrenergic receptors [6]. Bisoprolol is a second-generation, highly β-1-receptor-selective β-blocker [7,8]. As different β-blockers have different mechanisms of action, additional research is needed to assess possible differences in effectiveness and safety between bisoprolol and other β-blocker subtypes.
The primary aim of this observational cohort study was to compare the average variation of systolic BP (SBP) and diastolic BP (DBP) in patients newly diagnosed with hypertension who initiated treatment with bisoprolol, versus other β-blockers or different antihypertensive classes. The secondary aims were to compare the time to controlled BP and the risk for Type 2 diabetes mellitus (T2DM), dyslipidemia, obesity and erectile dysfunction.
Materials & methods
A new user, active comparator cohort design was implemented. This was a non interventional study based on routinely collected data from the UK Clinical Practice Research Datalink (CPRD).
Data source
CPRD is a primary care database that collects anonymized electronic patient medical records from general practitioners (GPs), covering over 50 million patients in the UK [9]. These patients are considered representative of the general population, with similar distribution in terms of age, sex and ethnicity [10]. In the UK, non emergency health-related issues, such as hypertension are managed within primary care [11]. The quality of CPRD data are enhanced through the UK ‘Quality and Outcomes Framework’, introduced in 2004, which provides financial incentives for GPs to maintain records of patients treated for hypertension and to record their BP at least every 9 months [12].
Study population
The study population comprised all patients (≥18 years) in the CPRD database who had newly initiated monotherapy with an antihypertensive drug between 1 January 2000 and 31 December 2017 (date of the first prescription for an antihypertensive drug defined as the ‘index date’). In relation to the index date, all patients had no record of being prescribed any antihypertensive drugs in the prior year; had a first diagnosis for hypertension in the prior 6 months prior and had at least 1 year of prior medical history. To select for antihypertensive monotherapy, patients had to have no record of any antihypertensive drugs other than the index drug for 14 days after the index date. To ensure research-quality data, only patients flagged as ‘acceptable’ in CPRD and who were monitored by a practice that CPRD deemed ‘up to research standard’ were included. Finally, patients were only eligible to be included in the study once, at their first qualifying event (Figure 1).

Figure 1. Study design.
ACEi: Angiotensin-converting enzyme inhibitors; ARB: Angiotensin II receptor blockers; CCB: Calcium channel blockers.
Baseline & follow-up period
Comedication and comorbidities for adjustment of the propensity score were assessed during the baseline period defined as the year prior to the index date (included). Clinical measurement such as BMI or BP were defined as the last recorded value within the year prior the index date. Comorbidities were defined by at least one READ codes for a disease within the year prior the index date; and comedication by at least two prescriptions 90 days apart. The smoking status was defined based on the algorithm developed by Booth and colleagues [13].
Patients were followed from the index date plus 1 day, until the first occurrence of any of the following events: addition of another antihypertensive drug to the index treatment, discontinuation of the index treatment, patient death, transfer-out date or the end of the study period (31 December 2018) (Figure 1).
Definition of exposure & treatment duration
Patients were allocated to one of the five treatment cohorts based on the antihypertensive monotherapy initiated at the index date: bisoprolol, other β-blockers, ACEi/ARB, CCB or diuretics. The bisoprolol cohort consisted exclusively of patients who received bisoprolol as monotherapy. The ‘other β-blockers cohort’ included any other β-blocker monotherapy: acebutolol, atenolol, betaxolol, carteolol, carvedilol, celiprolol, labetalol, metoprolol, nadolol, nebivolol, oxprenolol, pindolol, propranolol or timolol. Antihypertensive drugs considered for each cohort are summarized in Supplementary Table 1.
If the duration of treatment prescription data were missing, these were calculated based on a modified version of the method used in the Observational Medical Outcomes Partnership Common Data Model CPRD Mapping Specification [14].
To capture discontinuation or switch to a combination therapy the following algorithm was implemented:
•
The follow-up period of each patient was divided into 14-day segments.
•
The presence or absence of an antihypertensive treatment in each segment was assessed. A treatment needed to be present for at least 7 days to be designated as ‘present’ for that segment.
•
Treatment discontinuation was defined as a gap of ≥90 days after the last 14-day segment where the treatment was present. A switch to an antihypertensive treatment within the same class was not classified as discontinuation, except when there was a switch from the other β-blocker cohort, to the bisoprolol cohort.
•
Combination therapy was defined as an exposure overlap of at least 7 days within a 14-day segment of two or more antihypertensive drugs of the same or different antihypertensive class.
Outcomes
The primary outcome for this study was the average variation of SBP and DBP across cohorts and was identified by all recorded values of SBP and DBP, in the CPRD database within the follow-up period. BP was defined as all BP measurements reported and recorded by the GP, as part of their clinical routine practice.
Secondary outcomes were as follows: controlled BP state (SBP <140 mmHg or DBP <90 mmHg) and uncontrolled BP state over the follow-up period; first occurrence of T2DM; dyslipidemia; erectile dysfunction; or obesity. Algorithms combining specific diagnosis and prescription criteria were used to define these events and are detailed in Table 1. All READ codes (a clinical diagnosis terminology system used in UK general practice) [15] and product codes for medicinal drugs that were used are listed in Supplementary Appendix B.
| Study objective | Outcome definition | Statistical analysis | Estimates | Ref. |
|---|---|---|---|---|
| Average variation of SBP & DBP | All recorded values of BP, as reported by the GP, within the follow-up period | Linear mixed models for longitudinal data These compare the average variation over time of SBP and DBP between cohorts | Coefficients for SBP and DBP (mmHg). A coefficient of x mmHg represents the difference in the average BP variation between the two treatments. | |
| Time to controlled BP | Within the follow-up period: • Controlled BP (SBP <140 & DBP <90 mmHg) • Uncontrolled BP (SBP ≥ 140 or DBP ≥ 90 mmHg) | Multistate Markov models These model the progress of each patient through different hypertension states over time, moving between controlled and uncontrolled BP states or toward an absorbing state ‘discontinuation or death’. These are statistically represented as time-homogeneous Markov processes with finite state space (Supplementary Table 1). The hazards of moving between states were assumed to be constant in time | HRs are the ratio of the transition hazards. A HR >1 means that the treatment increases the ‘chance’ of changing state compared with the control population. For instance, it increases the ‘chance’ to move from the uncontrolled BP state to the controlled BP state. | [16] |
| Safety outcomes | Within the follow-up period, occurrence of: • T2DM (≥1 diagnosis code for T2DM or ≥2 prescriptions† for antidiabetic medication [other than insulin] and no diagnosis code inconsistent with T2DM such as Type 1 diabetes mellitus or gestational diabetes during the year preceding and following the first prescription) • Dyslipidemia (≥1 diagnosis code for dyslipidemia or, ≥2 prescriptions† for statin, fibrate or bile acid sequestrants) • Erectile dysfunction (≥1 diagnosis code for erectile dysfunction or impotence, ≥2 prescriptions† for a treatment with an indication for erectile dysfunction) • Obesity: ≥1 BMI reading ≥30 kg/m2 | Cox proportional hazards models Fine and Gray proportional sub distribution hazards models Both models with competing risks on discontinuation or death. A competing event is any event that precludes the observation of the event of interest. An analysis considering death or treatment discontinuation prior to the event of interest, as ‘independent censoring’ would aim to make an inference for an underlying, potentially completely observed population, in other words, a hypothetical population that cannot die nor discontinue. | Cause-specific HRs obtained via the Cox models: reflect the probability of an event in the next instant to be increased or decreased. In the context of competing risks, treatment effects for the event of interest can be assessed in terms of (cause-specific) HRs, in other words, an increase (HR >1) or decrease (HR <1) on the ‘instantaneous risk’ of experiencing the event of interest. However, the probability of experiencing the event of interest also depends on the hazard of the competing event, only a HR for the event of interest is not enough to assess a treatment effect on the probability. SHRs obtained via the Fine and Gray models: reflect the probability of an event to be increased or decreased in general over the follow-up. The Fine and Gray model is a model tailored for the cumulative incidence of experiencing the event of interest. Thus, a SHR has a direct interpretation in terms of cumulative incidence. For instance, a SHR >1 reflects an increase in the probability of experiencing the event of interest in general over the follow-up |
†
Prescriptions had to be 90 days apart, but no more than 180 days apart.
BP: Blood pressure; DBP: Diastolic blood pressure; GP: General practitioner; HR: Hazard ratio; SBP: Systolic blood pressure; SHR: Sub distribution hazard ratio; T2DM: Type 2 diabetes mellitus.
Data analysis
Analytical cohort creation, including the creation of the analytical variables, was performed in the Instant Health Data platform (Panalgo, formerly Boston Health Analytics, MA, USA). Analyses were performed using R version 3.5.1.
Analysis sets
Each outcome was analyzed using a corresponding analysis set. For the BP analysis set (for the analysis of SBP, DBP and time to controlled BP), patients had a baseline BP reading and at least one further reading within the follow-up period. For the erectile dysfunction analysis set, patients were male and presented with no erectile dysfunction diagnosis at baseline. Similarly, in the other analysis sets (T2DM, dyslipidemia and obesity), patients had no diagnosis of each respective condition at baseline.
Propensity scores matching
Propensity scores (PS) were estimated using boosted regression trees [17]. Tuning of the hyperparameters was performed using fivefold cross validation. Known confounding variables, such as patient demographics (age at index, sex, region), clinical characteristics (BMI, SBP), lifestyle characteristics (smoking status), baseline comorbidities (myocardial infarction, angina, arrhythmia, chronic heart failure, stroke, peripheral vascular disease, diabetes mellitus, dyslipidemia, renal impairment, depression, erectile dysfunction, sleep apnea) and comedications (platelet aggregation inhibitors, anticoagulants, drugs that might cause hypertension, drugs that might cause hypotension, antidepressant drugs, antipsychotics drugs) were used for the estimation of PS [18–20].
Definition of the variables are provided in Supplementary Appendix B. The covariates were chosen theoretically (through clinical input and reference to prior literature). Missing values were dealt with by the boosted trees algorithm with a surrogate split method. When a value for a variable is missing, and that variable needs to be used to determine a split, an alternative variable, which is highly correlated with the variable with missing values, is used to determine the direction of the split. PS matching (caliper 1%, without replacement) was performed for each corresponding analysis set; each patient in the bisoprolol cohort was matched with up to four patients in the comparator cohort. Clinical equipoise was assessed by looking at the PS distributions. Standardized mean differences (SMD) were computed before and after matching. A variable was considered as balanced if the absolute value of the SMD <0.1.
Outcome analysis
Table 1 summarizes the statistical models used to analyze each outcome. The estimates were assessed in the matched population. If a variable was not sufficiently balanced in the PS (SMD >0.1) then the model was adjusted on this variable. Bonferroni correction (1–0.0125 [0.05 divided by the four for the four head-to-head comparisons]) was used to account for the fact that four comparisons were performed: each estimate was given with 98.75% CIs.
Sensitivity analyses
E-values were estimated for the hazard ratios (HRs) and sub distribution hazard ratios (SHRs) [21]. They were used to assess how much confounding would be required to move a clinically meaningful association to near null levels. In further detail, they describe the minimum strength of association, on the HR/SHR scale, that an unmeasured confounder would need to have with both the treatment and the outcome to shift the point estimate to 1 and fully explain away a specific treatment-outcome association, conditional on the measured covariates. For instance, let’s take an outcome O with a prevalence <15% and with a hypothetical HR (CI) for A versus B of 1.5 (1.2, 2.2), this would lead to an E-value of 2.37. An unmeasured confounder would need to be associated with the outcome with an HR >2.37, and with the exposure with an HR >2.37, to shift the point estimate from HR = 1.5 to HR = 1 (no effect) [22]. The largest the E-values is, the strongest the unmeasured confounding need to be to move the observed estimate toward the null.
Results
Patients
A total of 267,352 patients fulfilled the eligibility criteria (Supplementary Figure 2). Before matching, patients in the CCB and diuretics cohorts were the oldest (median age 64 years), and those in the ACEi/ARB cohorts were the youngest (median age 53 years) (Supplementary Figure 2). A higher proportion of patients in the bisoprolol cohort presented with angina (3.9 vs 0.2–1.6% in the other cohorts) and arrhythmia (7.9 vs 0.4–0.9%); while a higher proportion of patients in the ACEi/ARB cohorts presented with diabetes (10.9 vs 1.5–2.8%). Furthermore, a higher proportion of patients in the bisoprolol cohort were prescribed platelet aggregation inhibitor (22.6 vs 9.2–10.6%) (Supplementary Table 3). Follow-up durations varied across the cohorts, ranging from a median duration of 4.6 months for the diuretic cohort, to 14.7 months for the ACEi/ARB cohort (Table 2). For each outcome, over 77% of the patients in the bisoprolol cohort were successfully matched to patients in the four comparator cohorts. Patients were well-matched, with baseline characteristics such as coronary artery disease ( e.g., angina, arrythmia or prescribed platelet aggregation) generally similar between cohorts (SMD after matching ≤0.1) (BP analysis set, Table 3; all other analysis sets, Supplementary Table 4; SMD tables for all analysis sets, Supplementary Table 5).
| Bisoprolol | Other β-blockers | ACEi/ARB | CCB | Diuretics | |
|---|---|---|---|---|---|
| Median (25th, 75th percentile) months | 8.3 (1.8, 31.3) | 6.0 (1.8, 24.4) | 14.7 (3.6, 45.1) | 8.3 (1.8, 30.8) | 4.6 (1.3, 23.4) |
| Mean (SD) months | 23.3 (33.15) | 20.2 (32.22) | 30.5 (36.79) | 22.2 (30.19) | 19.5 (31.40) |
ACEi: Angiotensin-converting enzyme inhibitor; ARB: Angiotensin II receptor blocker; CCB: Calcium channel blocker; SD: Standard deviation.
| Bisoprolol (n = 1327) | Other β-blockers (n = 5308) | Bisoprolol (n = 1537) | ACEi/ARB (n = 6148) | Bisoprolol (n = 1485) | CCB (n = 5940) | Bisoprolol (n = 1468) | Diuretics (n = 5872) | |
|---|---|---|---|---|---|---|---|---|
| Demographics | ||||||||
| Age, median (IQR), years | 58 (49, 67) | 58 (49, 67) | 58 (49, 67) | 59 (49, 68) | 59 (50, 68) | 58 (49, 68) | 59 (50, 68) | 58 (49, 68) |
| Male, n (%) | 674 (50.8) | 2727 (51.4) | 773 (50.3) | 3156 (51.3) | 747 (50.3) | 3024 (50.9) | 719 (49.0) | 2799 (47.7) |
| Clinical measurement | ||||||||
| BMI, median (IQR), kg/m2 | 28.3 (25.1, 31.8) | 28.2 (24.9, 32.0) | 28.3 (25.1, 32.2) | 28.1 (24.6, 32.1) | 28.3 (25.2, 32.0) | 28.3 (25.1, 32.4) | 28.3 (25.0, 32.2) | 28.3 (25.0, 32.4) |
| Missing, % | 54.4 | 55.9 | 54.5 | 54.0 | ||||
| Systolic BP, median (IQR), mmHg | 163 (150, 176) | 160 (150, 175) | 162 (150, 176) | 160 (150, 176) | 162 (150, 176) | 160 (150, 176) | 163 (150, 176) | 160 (150, 176) |
| Missing, % | 0 | 0 | 0 | 0 | ||||
| Diastolic BP, median (IQR), mmHg | 96 (89, 102) | 95 (87, 101) | 95 (88, 100) | 94 (86, 101) | 95 (88, 100) | 95 (87, 102) | 95 (88, 100) | 95 (88, 100) |
| Missing, % | 0.2 | 0.1 | 0.1 | 0.1 | ||||
| Lifestyle risk factors | ||||||||
| Current smoker, n (%) | 237 (17.9) | 917 (17.3) | 267 (17.4) | 1106 (18.0) | 260 (17.5) | 1109 (18.7) | 247 (16.8) | 1071 (18.2) |
| Presence of comorbidities, n (%) | ||||||||
| Myocardial infarction | <5 | 20 (0.4) | 7 (0.5) | 32 (0.5) | <5 | 6 (0.1) | <5 | 13 (0.2) |
| Angina | 37 (2.8) | 157 (3.0) | 9 (0.6) | 80 (1.3) | 16 (1.1) | 100 (1.7) | 16 (1.1) | 86 (1.5) |
| Arrhythmia | 21 (1.6) | 144 (2.7) | 39 (2.5) | 290 (4.7) | 32 (2.2) | 243 (4.1) | 37 (2.5) | 198 (3.4) |
| Chronic heart failure | <5 | 6 (0.1) | 5 (0.3) | 20 (0.3) | <5 | 15 (0.3) | <5 | 20 (0.3) |
| Stroke | 6 (0.5) | 45 (0.8) | 10 (0.7) | 78 (1.3) | 10 (0.7) | 67 (1.1) | 8 (0.5) | 51 (0.9) |
| Peripheral vascular disease | 19 (1.4) | 86 (1.6) | 19 (1.2) | 100 (1.6) | 20 (1.3) | 103 (1.7) | 18 (1.2) | 103 (1.8) |
| Diabetes | 22 (1.7) | 120 (2.3) | 35 (2.3) | 109 (1.8) | 27 (1.8) | 148 (2.5) | 24 (1.6) | 115 (2.0) |
| Dyslipidemia | 101 (7.6) | 357 (6.7) | 104 (6.8) | 480 (7.8) | 103 (6.9) | 361 (6.1) | 97 (6.6) | 360 (6.1) |
| Chronic renal failure | 10 (0.8) | 32 (0.6) | 20 (1.3) | 118 (1.9) | 18 (1.2) | 84 (1.4) | 14 (1.0) | 44 (0.7) |
| Depression | 39 (2.9) | 165 (3.1) | 43 (2.8) | 129 (2.1) | 40 (2.7) | 153 (2.6) | 40 (2.7) | 192 (3.3) |
| Erectile dysfunction | 11 (0.8) | 45 (0.8) | 12 (0.8) | 74 (1.2) | 12 (0.8) | 75 (1.3) | 11 (0.7) | 62 (1.1) |
| Sleep apnea | <5 | 5 (0.1) | <5 | 7 (0.1) | <5 | 11 (0.2) | <5 | 12 (0.2) |
| Presence of comedications, n (%) | ||||||||
| Anticoagulant | 16 (1.2) | 63 (1.2) | 28 (1.8) | 151 (2.5) | 26 (1.8) | 125 (2.1) | 26 (1.8) | 103 (1.8) |
| Antidepressant | 200 (15.1) | 731 (13 8) | 235 (15.3) | 857 (13.9) | 223 (15.0) | 905 (15.2) | 221 (15.1) | 815 (13.9) |
| Antipsychotic | 48 (3.6) | 189 (3.6) | 60 (3.9) | 224 (3.6) | 58 (3.9) | 262 (4.4) | 58 (4.0) | 251 (4.3) |
| Platelet aggregation inhibitor | 223 (16.8) | 994 (18.7) | 272 (17.7) | 1166 (19.0) | 266 (17.9) | 1137 (19.1) | 246 (16.8) | 952 (16.2) |
| Leading to hypertension† | 477 (35.9) | 2062 (38.8) | 578 (37.6) | 2248 (36.6) | 552 (37.2) | 2175 (36.6) | 549 (37.4) | 2296 (39.1) |
| Leading to hypotension‡ | 193 (14.5) | 803 (15.1) | 216 (14.1) | 928 (15.1) | 214 (14.4) | 847 (14.3) | 190 (12.9) | 800 (13.6) |
†
Drug leading to hypertension: NSAID, antidepressants. Estrogens (hormonal birth control and hormonal replacement therapy), immunosuppressive drugs (ciclosporin, tacrolimus), methylphenidate.
‡
Drug leading to hypotension: opioid analgesics, alpha-blockers, anti-anginals.
ACEi: Angiotensin-converting enzyme inhibitor; ARB: Angiotensin II receptor blocker; BP: Blood pressure; CCB: Calcium channel blocker; IQR: Interquartile range.
The proportion of prediabetic patients (those with non diabetic increased glycemia as indicated by a fasting plasma glucose result between ≥6.1 and <7.0 mmol/l) was higher in the ACEi/ARB cohort (2.1%), compared with the CCB (1.4%), bisoprolol (1.0%), other β-blockers (0.8%) and diuretics (0.8%) cohorts (Supplementary Table 2). However, these data were missing for most (80%) patients, meaning this variable could not be added into the PS calculations.
Blood pressure
After matching, across cohorts, median baseline SBP ranged from 160 to 163 mmHg, while median baseline DBP ranged from 94 to 96 mmHg (Table 3). Over the follow-up period, all cohorts showed similar declining trajectories in mean SBP (Figure 2) and DBP (Figure 3).
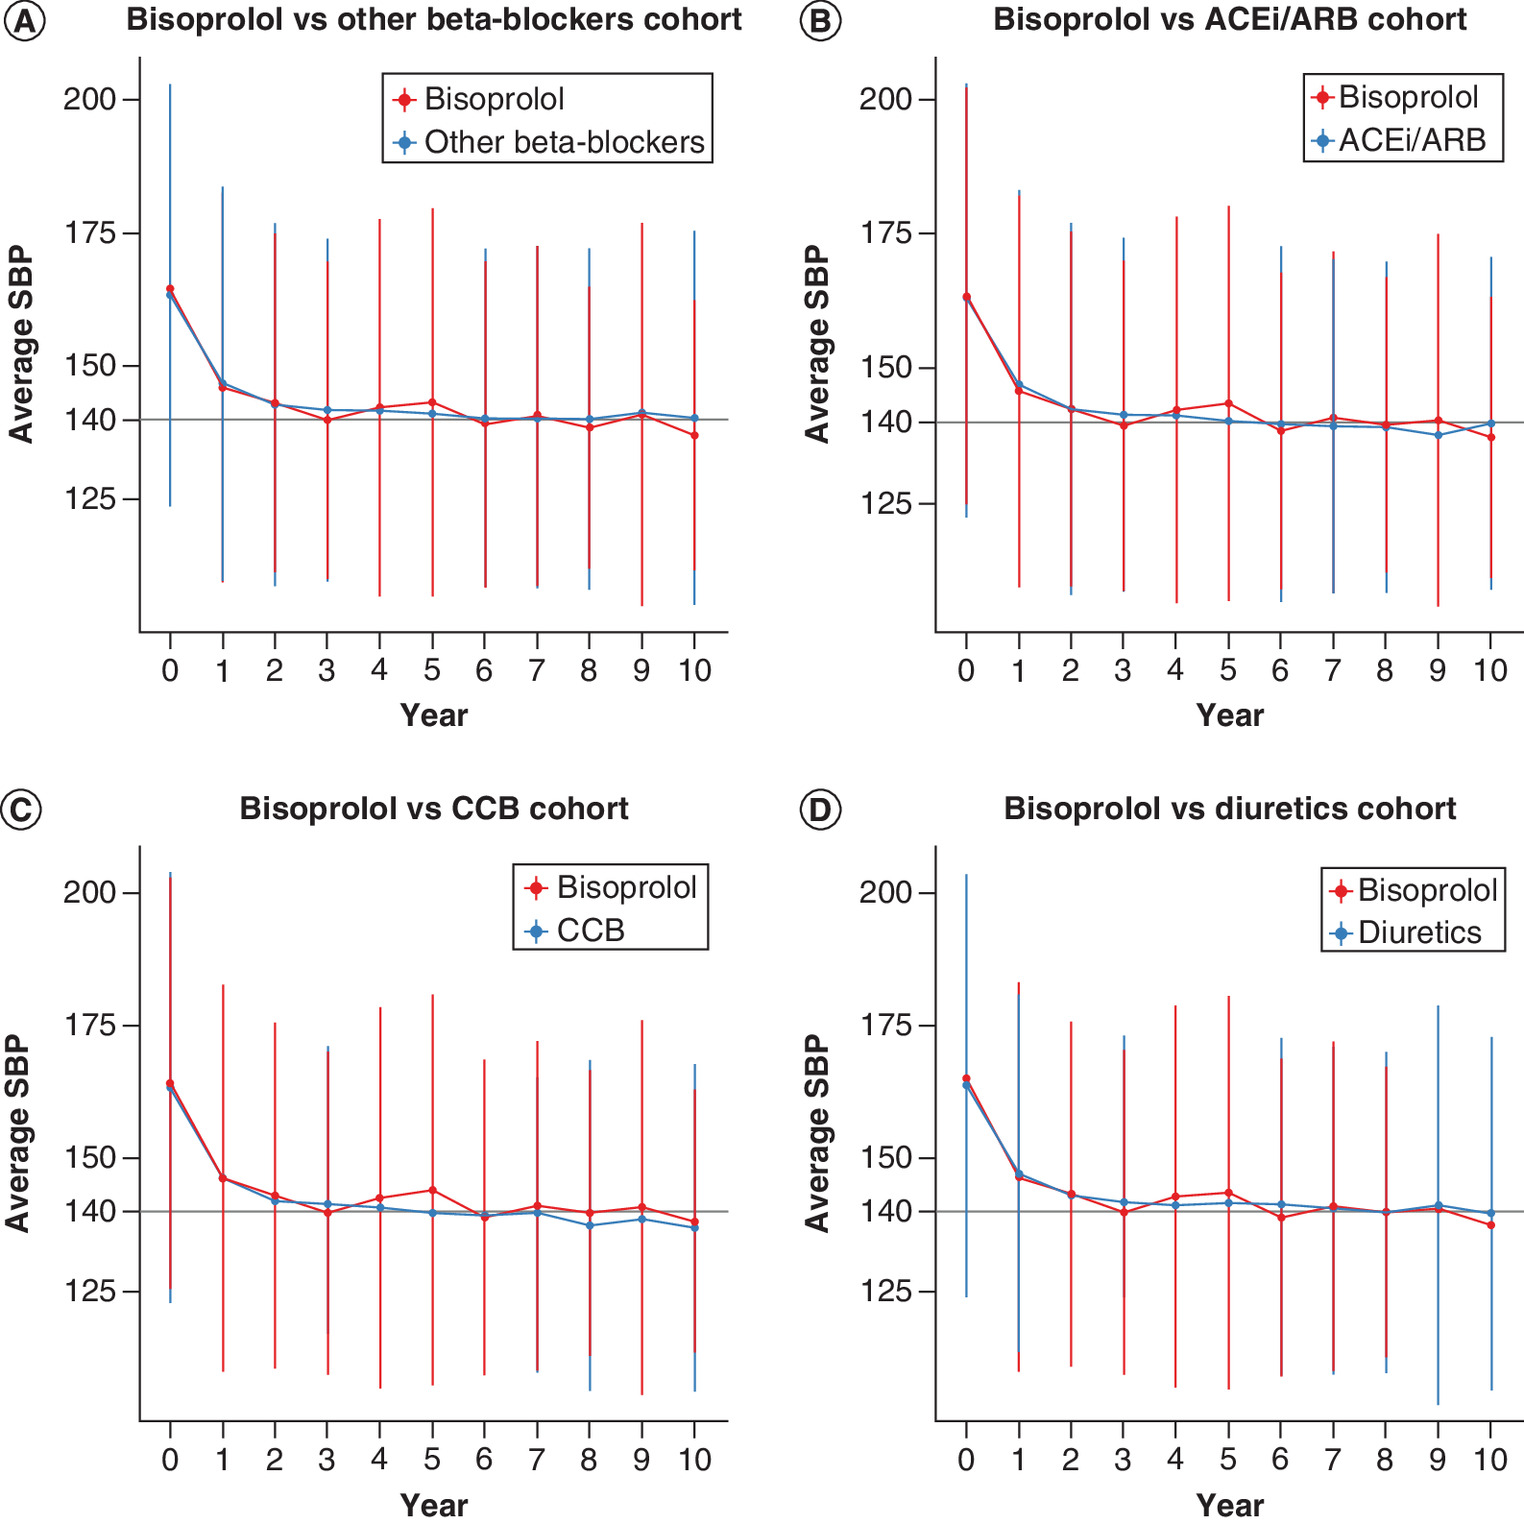
Figure 2. Mean trajectories of systolic blood pressure over the follow-up period (in years) in the blood pressure analysis set after matching. Vertical lines represent 95% CI.
(A) Mean trajectories of SBP in the bisoprolol vs other β-blockers cohort over the follow-up period in the blood pressure (BP) analysis set. (B) Mean trajectories of SBP in the bisoprolol vs ACEi/ARB cohort over the follow-up period in the BP analysis set. (C) Mean trajectories of SBP in the bisoprolol vs CCB cohort over the follow-up period in the BP analysis set. (D) Mean trajectories of SBP in the bisoprolol vs diuretics cohort over the follow-up period in the BP analysis set.
ACEi: Angiotensin-converting enzyme inhibitors; ARB: Angiotensin II receptor blockers; CCB: Calcium channel blockers; SBP: Systolic blood pressure.

Figure 3. Mean trajectories of diastolic blood pressure over the follow-up period (in years) in the blood pressure analysis set after matching. Vertical lines represent 95% CI.
(A) Mean trajectories of DBP in the bisoprolol vs other β-blockers cohort over the follow-up period in the blood pressure (BP) analysis set. (B) Mean trajectories of DBP in the bisoprolol vs ACEi/ARB cohort over the follow-up period in the BP analysis set. (C) Mean trajectories of DBP in the bisoprolol vs CCB cohort over the follow-up period in the BP analysis set. (D) Mean trajectories of DBP in the bisoprolol vs diuretics cohort over the follow-up period in the BP analysis set.
ACEi: Angiotensin-converting enzyme inhibitors; ARB: Angiotensin II receptor blockers; CCB: Calcium channel blockers; DBP: Diastolic blood pressure.
The difference in the average variation of SBP and DBP between the bisoprolol and matched cohorts over this time was no greater than 3 mmHg (Table 4). This difference was only significant in the comparison versus diuretics (PS-matched coefficient [98.75% CI] SBP 1.58 mmHg [0.54, 2.62]; DBP 2.97 mmHg [2.32. 3.61] [Table 4]). There were no significant differences in the time taken to transition from an uncontrolled to controlled BP in almost all cohorts (point estimate of the PS-matched HRs were ~1; Table 4). However, the diuretics cohort had a slightly reduced rate of achieving controlled BP compared with the bisoprolol cohort (PS-matched HR [CI: 98.75%] diuretics vs bisoprolol: 0.92 [0.85, 0.99]; Table 4). Details on the time taken to transition from a controlled to uncontrolled BP across cohorts, and the length of stay in the controlled state across cohorts are included in Supplementary Table 6.
| Linear mixed model PS-matched coefficient (98.75% CI) | Multistate model PS-matched HR (98.75% CI) | ||
|---|---|---|---|
| SBP | DBP | Uncontrolled to controlled BP | |
| Bisoprolol vs other β-blockers | 1.20 mmHg (-0.01, 2.40) | 0.46 mmHg (-0.18, 1.11) | 0.97 (0.89, 1.05) |
| Bisoprolol vs ACEi/ARB | 0.20 mmHg (-0.86, 1.25) | 0.91 mmHg (0.27, 1.55) | 1.05 (0.98, 1.13) |
| Bisoprolol vs CCB | -0.85 mmHg (-1.83, 0.13) | 0.59 mmHg (-0.04, 1.22) | 0.94 (0.87, 1.01) |
| Bisoprolol vs diuretics | 1.58 mmHg (0.54, 2.62) | 2.97 mmHg (2.32. 3.61) | 0.92 (0.85, 0.99) |
A matched-adjusted coefficient of ‘bisoprolol vs other β-blockers SBP 1.20 mmHg indicates that patients treated with other β-blockers had on average a 1.20 mmHg higher SBP than those treated with bisoprolol over the follow-up period.
For the bisoprolol vs ACEi/ARB and bisoprolol vs CCB analyses, the model was further adjusted for the presence of arrhythmia, due to a residual imbalance after matching.
ACEi: Angiotensin-converting enzyme inhibitor; ARB: Angiotensin II receptor blocker; CCB: Calcium channel blocker; DBP: Diastolic blood pressure; PS: Propensity score; SBP: Systolic blood pressure.
Safety outcomes
Summary
Summaries of the events of interest analyses are shown in Figure 4 (HR, SHR) and Supplementary Table 7 (number of events, incidence rate). All outcomes occurred while on treatment. The competing events (defined as death prior to the event of interest or treatment discontinuation) analysis showed discontinuation rates varied between cohorts; compared with the bisoprolol cohort, the risk of the competing event was lower in the ACEi/ARB cohorts (PS-matched point estimate HRs ranged from 0.78 to 0.83), slightly higher in the CCB cohorts (PS-matched point estimate HRs ranged from 1.05 to 1.07) and higher in the diuretic cohort (PS-matched point estimate HRs ranged from 1.14 to 1.29) (Supplementary Table 9).
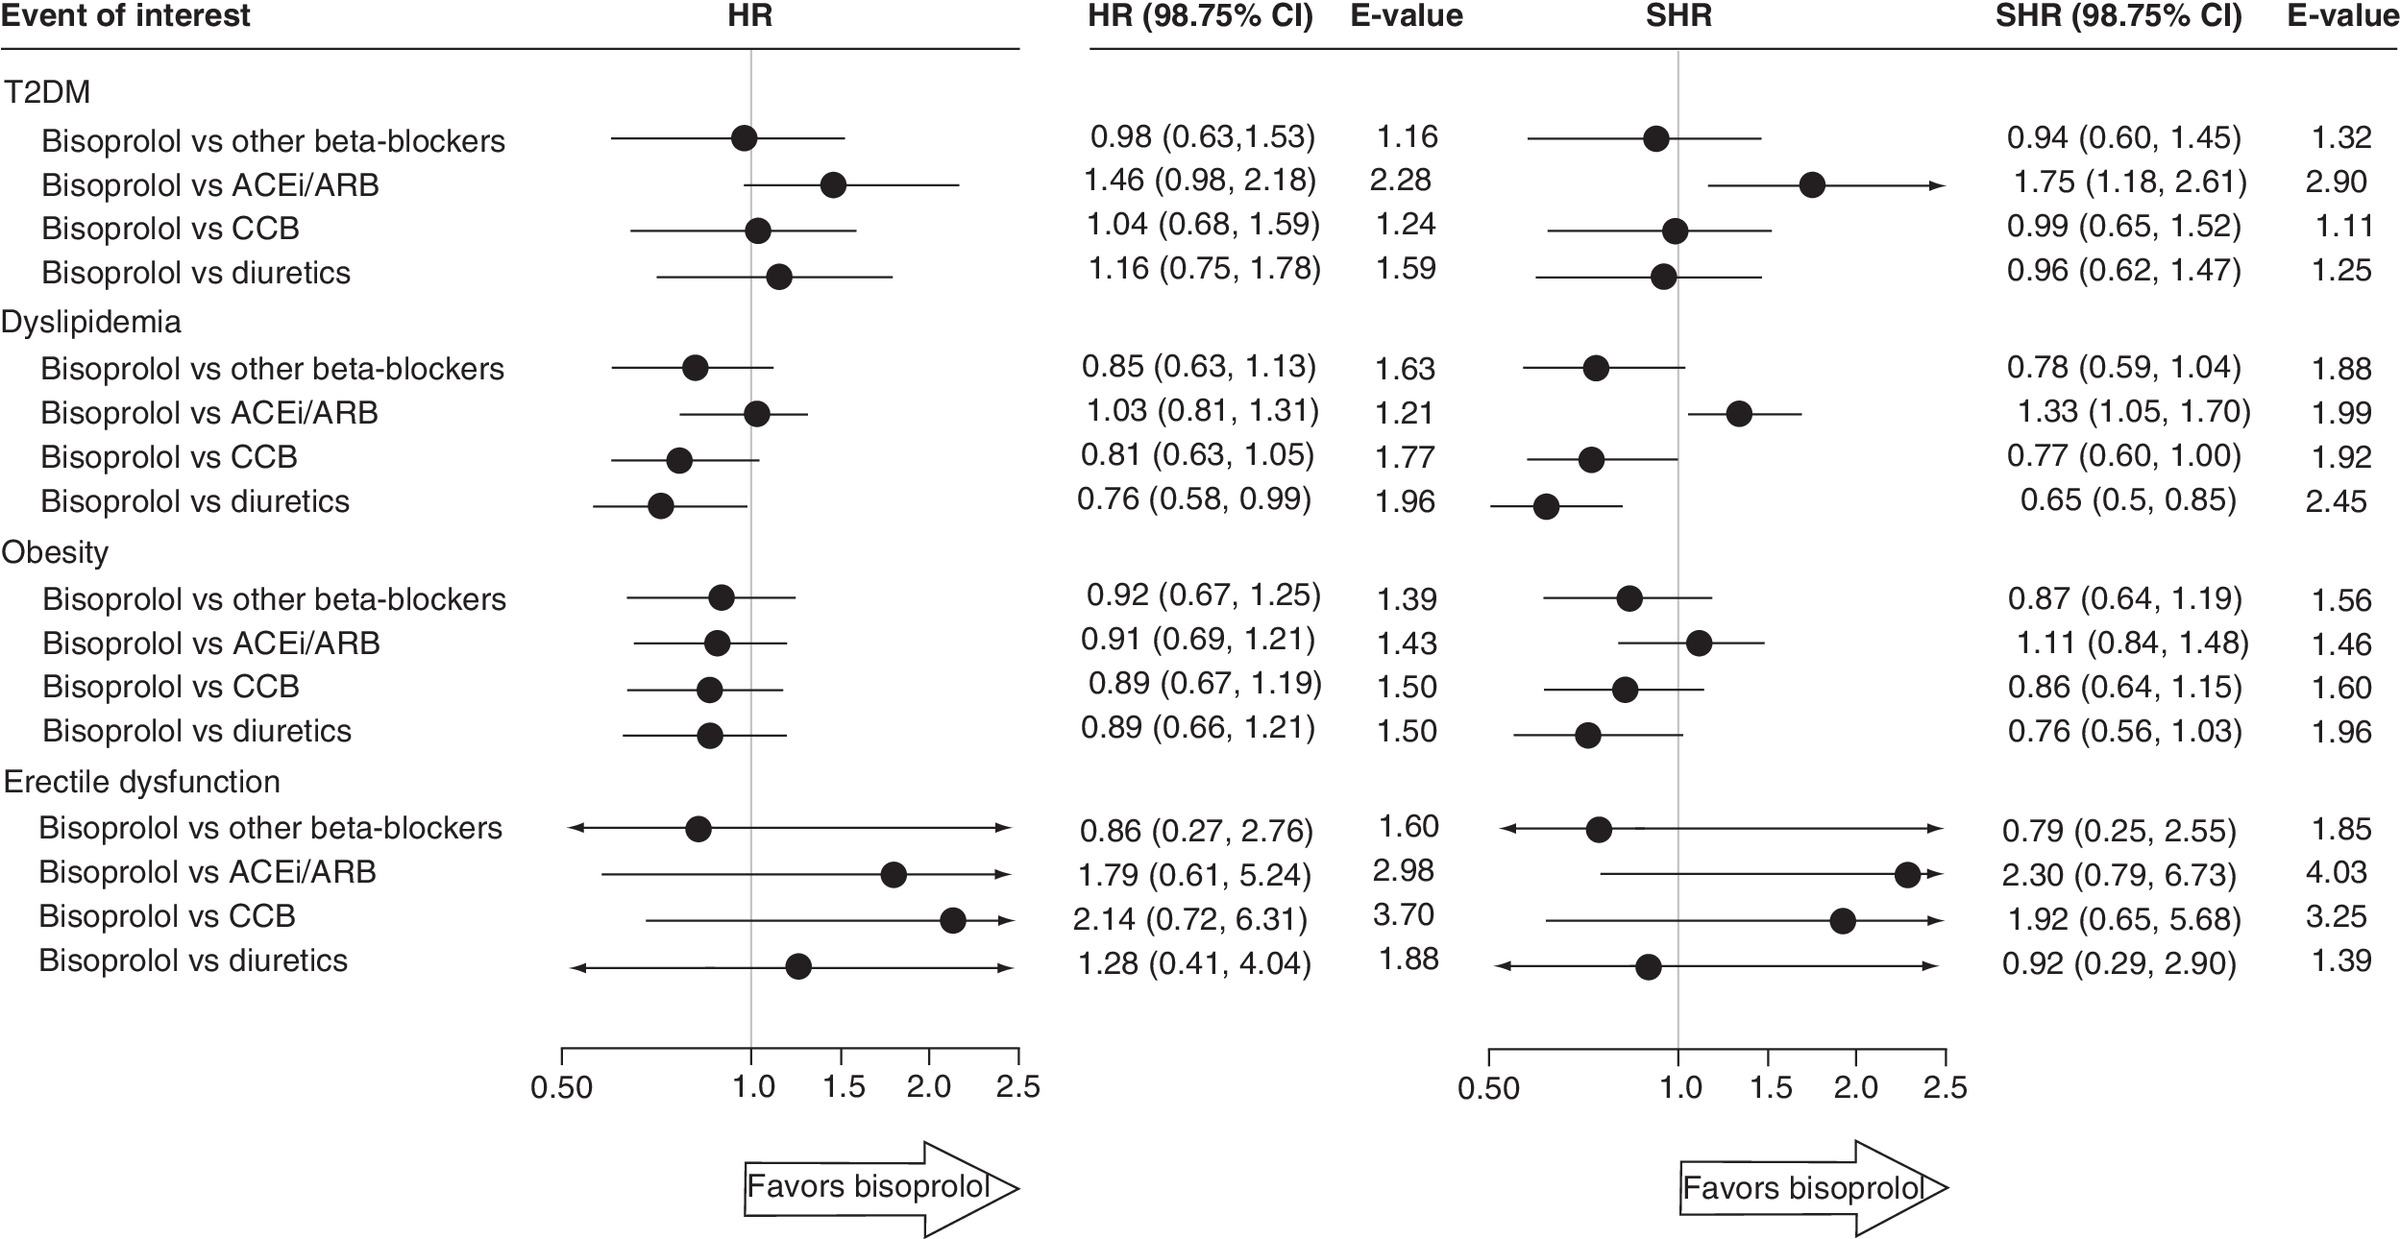
Figure 4. Cause-specific Cox proportional hazards and Fine and Gray subdistribution hazards models for the outcome time to each event of interest, after matching, in the corresponding event of interest analysis set.
ACEi: Angiotensin-converting enzyme inhibitors; ARB: Angiotensin II receptor blockers; CCB: Calcium channel blockers; HR: Hazard ratio; SHR: Subdistribution hazard ratio.
Type 2 diabetes
There was no difference in the risk of developing T2DM in the bisoprolol cohort compared with other β-blockers, CCB or diuretics cohorts (Figure 4). However, compared with the ACEi/ARB cohort, the risk of developing T2DM tended to be lower in the bisoprolol cohort (PS-matched estimates [98.75% CI] HR: 1.46 [0.98, 2.18], E-value 2.28; SHR 1.75 [1.18, 2.61], E-value 2.90) (Figure 4). Consistent results were found after excluding patients with impaired fasting glucose (defined as a fasting plasma glucose between ≥6.1 and <7.0 mmol/l) at baseline (PS-matched HR [98.75% CI] ACEi/ARB vs bisoprolol 1.59 [1.05, 2.42]) (Supplementary Table 8). The HR reflects the probability of an event in the next instant, whereas the SHR reflects the probability of an event over the entire follow-up period. In this study, patients in the ACEi/ARB cohort had a longer follow-up compared with patients in the bisoprolol cohort, so the point estimate of the SHR was higher than the point estimate of the HR.
Dyslipidemia
There was no difference in the risk of developing dyslipidemia in the bisoprolol cohort compared with the other β-blockers cohort; however there was an increased risk compared with the diuretics cohort (PS-matched estimates [98.75% CI]: diuretics vs bisoprolol HR: 0.76 [0.58, 0.99], E-value: 1.96; SHR: 0.65 [0.50, 0.85]), E-value: 2.45 (Figure 4). There was a trend toward an increase in the risk of developing dyslipidemia in the bisoprolol cohort compared with the CCB cohort (PS-matched estimates [98.75% CI]: CCB vs bisoprolol HR: 0.81 [0.63, 1.05], E-value: 1.77; SHR: 0.77 [0.60, 1.00], E-value: 1.92) (Figure 4).
There was no difference in the risk of dyslipidemia in the bisoprolol cohort compared with the ACEi/ARB cohort as indicated by the HR (HR: 1.03 [0.81, 1.31], E-value 1.21;), however, the SHR indicated a decreased risk in the bisoprolol cohort compared with ACEi/ARB (PS-matched estimates [98.75% CI]: SHR: 1.33 [1.05, 1.70], E-value: 1.99) (Figure 4).
Obesity
No difference was seen in the risk of developing obesity in the bisoprolol cohort compared with the other cohorts (Figure 4). There was no difference in the risk of obesity in the bisoprolol cohort compared with the diuretics cohort as indicated by the HR; however, the SHR showed a trend toward an increased risk in the bisoprolol cohort (PS-matched estimates [98.75% CI]: HR: 0.89 [0.66, 1.21], E-value: 1.50; SHR: 0.76 [0.56, 1.03], E-value: 1.96) (Figure 4).
Erectile dysfunction
Similarly, no difference was seen in the risk of developing erectile dysfunction in the bisoprolol cohort compared with the other cohorts, although a low number of reported events resulted in large CIs (Figure 4).
Discussion
This is the first non interventional study, to our knowledge, to perform a head-to-head comparison of bisoprolol with other antihypertensive classes, including other β-blockers, in terms of BP and safety outcomes, providing real-world evidence on their effectiveness and safety.
Main findings: BP
The analysis showed that, in real-world settings, no differences were found between bisoprolol monotherapy and other therapeutic classes respectively in controlling hypertension, over a median follow-up period spanning from 4.6 to 14.7 months. Similarly, in each head-to-head comparison, no difference was seen in the time taken to present a controlled BP from an uncontrolled BP. Nevertheless, a slightly higher BP control was only observed with bisoprolol compared with diuretics.
Our findings are consistent with the results from a meta-analysis of RCTs that revealed non clinically significant differences in SBP variation, all below 2 mmHg, between the major antihypertensive classes [23]. This meta-emphasized the fact that the reduction of cardiovascular events was due to the BP-lowering per se rather than to specific drug properties. Further to the BP decrease, comparing the cardiovascular events between classes would strength the knowledge on the comparative effectiveness of these classes.
They also align with two non interventional studies that did not observe any difference in mean reduction in SBP between the major antihypertensive classes, over 6-month [4] and 3-year [24] follow-up periods. However, one limitation of the study by Bronsert et al. 2013 [4] is that BP changes were assessed as the difference between two measurements: at baseline and at the latest BP record, with the follow-up time ranging from 1 week to 1 year, ending at the earliest point that antihypertensive treatment was changed within this timeframe. The present study included all BP measurements, performed at each visit, which more accurately reflects the continuous management of patients with hypertension in a primary care setting. Furthermore, one limitation of the study by Stapff and Hilderbrand 2019 [24] is that patients who changed hypertensive therapy within the 3-year period were excluded. The study may not be representative of a real-world hypertension population; in a real-world setting (as demonstrated in this analysis), the majority of patients with hypertension discontinue their first-line therapy within the 1st year.
While several RCTs have demonstrated the efficacy and safety of bisoprolol in patients with hypertension [25–27], real-world evidence bisoprolol is more limited. A recent analysis of real-world data from UK CPRD of 539 patients prescribed bisoprolol monotherapy, showed a significantly higher survival rate that was maintained for up to 15 years over the study period, compared with other types of β-blocker and the other major antihypertensive classes [7]. Our analysis adds evidence from clinical practice that bisoprolol did not present a different BP decrease to the other antihypertensive classes, including other β-blocker subtypes.
Safety findings
No difference in the risk of developing T2DM was observed across most cohorts, apart from a lower risk in the bisoprolol cohort compared with the ACEi/ARB cohort. This finding should be interpreted with caution as patients with T2DM and prediabetes are more likely to be prescribed ACEi/ARB [1], and, in this study, the proportion of prediabetic patients appeared to be highest in the ACEi/ARB cohort. Moreover, as fasting blood plasma glucose measurements were missing for most (80%) patients, this variable could not be fully controlled for. Non diabetic increased glycemia may be an unknown confounder that impacted the comparison of bisoprolol versus ACEi/ARB. There are conflicting results from previous studies comparing the risk of T2DM across the major antihypertensive classes. On the one hand, β-blockers and diuretics comparatively increased the risk of T2DM in a nested case–control study [28]. However, on the other hand, a RCT found that β-blockers and CCBs were not associated with the risk of T2DM, whereas the risk was increased with diuretics [29].
No difference in the risk of dyslipidemia between the bisoprolol and other β-blockers cohort was observed; however, there was an increased risk compared with diuretics, and a trend-wise increase in risk compared with the CCB cohort. The comparison with the ACEi/ARB cohort was inconclusive. The increased bisoprolol-related risk of dyslipidemia compared with diuretics was unexpected. As a reminder, dyslipidemia is commonly associated with an increase in cholesterol, but as well in triglycerides [30]. Diuretics are associated with an increase in total cholesterol [31], bisoprolol has no known effect on total cholesterol, HDL cholesterol or LDL cholesterol [32,33]. Regarding triglycerides, different β-blockers have been reported to have different effects on triglycerides [34]. Furthermore, some studies have shown an increase in triglycerides after 2 years of bisoprolol treatment, while other studies found no difference after 3 years [33]. Therefore, this finding may be explained by a bisoprolol-related increase in triglycerides, rather than an increase in cholesterol. Further research should be conducted to investigate the differences between this study and the existing literature.
This study did not show any difference in the risk of developing obesity (defined as BMI ≥30 kg/m2), between patients with hypertension treated with bisoprolol compared with other antihypertensive classes. Low sympathetic nervous system activity has been suggested as a risk factor for weight gain and developing obesity. Metabolic and sympathetic signals are transmitted via β-2 adrenoceptors in adipose tissue [35]. Since bisoprolol is highly selective for β-1 receptors [7,8], it is not expected to affect adipocytes or to otherwise interfere with body weight regulation. This aligns with a study which reported that patients on carvedilol gained an average of 2.3 kg over 6 months of treatment, whereas those on bisoprolol did not experience a significant change in body weight [36]. Our analysis suggests that bisoprolol is not associated with an increased risk of developing obesity compared with other antihypertensive classes.
In this study, no difference in the risk of erectile dysfunction was observed between cohorts, but the number of events was low, with only six events reported out of the 1111 patients in the bisoprolol cohort. It is important to note that this observation may be affected by possible under-reporting, as the prevalence of baseline erectile dysfunction was much lower in this study (0.7%) compared with the results from a survey of the wider UK population (13%) [37], and hypertension is one of the most common risk factors for erectile dysfunction [38]. The low number of events and therefore lack of statistical power for this analysis limits interpretation. Our findings conflict with a systematic review that found diuretics and β-blockers were associated with erectile dysfunction while CCB and ACEi/ARBs were not [39]. However, the association between β-blockers and erectile dysfunction may be partially explained by psychological factors, as demonstrated by a study from 2003 which found that patients who experienced anxiety after being informed that β-blockers may cause erectile dysfunction, were more likely to experience this effect [40]. This information may help to ease a common patient anxiety regarding the detrimental impact of β-blockers on erectile function, improving medication adherence [39,41].
Strengths & limitations
The strengths of the present study include the use of high-quality CPRD data and the appropriateness of the statistical analysis proposed with linear mixed model and the multistate Markov model. It allows to analyze all available longitudinal data while considering the censoring process as well. Likewise, the additional competing risks analysis accounted for patient discontinuation and switching of drugs, which reflects the real world setting compared with RCTs. And finally, the use of PS matching minimized confounding effects by lessening baseline differences between cohorts. Therefore, the proposed ad-hoc statistical method permitted robust evaluation of the long term, real-world BP variations and safety outcomes of different antihypertensive classes. Our study also used larger populations and much longer follow-up timeframes than those typically reported in clinical trials [25,26]. There were also several limitations to this study. As previously discussed, non diabetic increased glycemia may be an unknown confounder in this study, which could have impacted the T2DM outcome analysis. Several well-known cardiovascular risk factors, including physical inactivity, are not accurately recorded in CPRD; therefore, it is not possible to rule out the possibility that unmeasured risk factors could still confound the result, although E-values were calculated to account for and quantify residual confounding effects [21]. PS matching was done to minimize confounding bias; however, this only matched patients at treatment initiation, and this benefit could have been lost over the follow-up periods. Finally, follow-up time and discontinuation rate varied between cohorts: the bisoprolol cohort had a higher discontinuation rate, especially compared with ACEi/ARB; the shorter follow-up period for bisoprolol may have had a moderate impact on the short-term outcomes such as BP variation, but an even greater impact on long-term outcome such as the development of T2DM. But the robust methodology that were applied was able to utilize the time at risk on each subject with censored data to provide unbiased survival estimates.
Conclusion
Overall, this study adds real-world support to the evidence gathered from several RCTs that no difference is observed in a term of BP decrease between the major antihypertensive classes. This study has not shown any difference between bisoprolol and other antihypertensive classes, in terms of risk of T2DM, obesity or erectile dysfunction, but an increased risk of dyslipidemia only in the comparison with diuretics. These data support further consideration of the use of bisoprolol for the treatment of patients with hypertension.
Future perspective
It is expected that all five antihypertensive drug classes, β-blocker, diuretics, CCB, ARB and ACEi remain the cornerstone in hypertension treatment either as monotherapy in very mild hypertension or in old and frail patients or in various combinations in other hypertensive patients.
•
Real-world evidence to support the use of bisoprolol in patients with hypertension.
•
Differences in average systolic and diastolic blood pressure (BP) variation were ≤3 mmHg between bisoprolol compared with other antihypertensive classes.
•
In clinical practice, BP measurements are performed at each visit, at different time points of the disease and reflect the continuous management of patients with hypertension. The present study applied mixed models and multistate models to evaluate the full trajectory of BP variation observed in patients treated with a first-line monotherapy.
•
In terms of safety, no differences were observed between bisoprolol and other antihypertensive classes in the risk for Type 2 diabetes mellitus, obesity and erectile dysfunction, with increased risk for dyslipidemia versus diuretics only.
Author contributions
All authors were responsible for study conception and design; C Foch was responsible for acquisition of data; A Allignol was responsible for data analysis. All authors were responsible for revision of the manuscript.
Financial & competing interests disclosure
This work was fully funded by Merck KGaA (CrossRef Funder ID: 10.13039/100009945). The authors have no other relevant affiliations or financial involvement with any organization or entity with a financial interest in or financial conflict with the subject matter or materials discussed in the manuscript apart from those disclosed.
The authors would like to thank A Kwan of Scientific Pathways Ltd, a Nucleus Global company, for providing medical writing support, which was funded by Merck KGaA, Darmstadt, Germany in accordance with Good Publication Practice (GPP3) guidelines (http://www.ismpp.org/gpp3).
Ethical conduct of research
Study approval was reviewed and granted by the CPRD Independent Scientific Advisory Committee (ISAC) of the Medicines and Healthcare products Regulatory Agency (MHRA) (protocol number 19_087R).
Open access
This work is licensed under the Attribution-NonCommercial-NoDerivatives 4.0 Unported License. To view a copy of this license, visit http://creativecommons.org/licenses/by-nc-nd/4.0/
Supplementary Material
References
Papers of special note have been highlighted as: • of interest; •• of considerable interest
1.
Williams B, Mancia G, Spiering W et al. 2018 ESC/ESH guidelines for the management of arterial hypertension. Eur. Heart J. 39(33), 3021–3104 (2018).
• European guidelines for the treatment of hypertension.
2.
NICE. Hypertension in adults: diagnosis and management 2019. https://www.nice.org.uk/guidance/ng136
• UK guidelines for the treatment of hypertension.
3.
Law MR, Wald NJ, Morris JK et al. Value of low dose combination treatment with blood pressure lowering drugs: analysis of 354 randomised trials. BMJ 326(7404), 1427 (2003).
4.
Bronsert MR, Henderson WG, Valuck R et al. Comparative effectiveness of antihypertensive therapeutic classes and treatment strategies in the initiation of therapy in primary care patients: a Distributed Ambulatory Research in Therapeutics Network (DARTNet) study. J. Am. Board Fam. Med. 26(5), 529–538 (2013).
•• Non interventional study, with a different design and statistical methods, shows similar mean reduction in systolic blood pressure at 6-month, between the major antihypertensive classes.
5.
Wiysonge CS, Bradley HA, Volmink J et al. Beta-blockers for hypertension. Cochrane Database Syst. Rev. 1, CD002003 (2017).
6.
do Vale GT, Ceron CS, Gonzaga NA et al. Three generations of β-blockers: history, class differences and clinical applicability. Curr. Hypertens. Rev. 15(1), 22–31 (2019).
7.
Sabido M, Hohenberger T, Grassi G. Pharmacological intervention in hypertension using beta-blockers: real-world evidence for long-term effectiveness. Pharmacol. Res. 130, 191–197 (2018).
8.
Stoschitzky K. Betablockers in hypertension: acquiring a balanced view. Cardiovasc. Pharmacol. Pharmacoth. 8, (2010).www.escardio.org/Journals/E-Journal-of-Cardiology-Practice/Volume-8/Betablockers-in-hypertension-acquiring-a-balanced-view
9.
CPRD. Clinical Practice Research Datalink 2020. https://www.cprd.com/
10.
Herrett E, Gallagher AM, Bhaskaran K et al. Data resource profile: clinical practice research datalink (CPRD). Int. J. Epidemiol. 44(3), 827–836 (2015).
11.
Sheppard JP, Schwartz CL, Tucker KL et al. Modern management and diagnosis of hypertension in the United Kingdom: home care and self-care. Ann. Glob. Health 82(2), 274–287 (2016).
12.
Weir S, Juhasz A, Puelles J et al. Relationship between initial therapy and blood pressure control for high-risk hypertension patients in the UK: a retrospective cohort study from the THIN general practice database. BMJ Open 7(7), e015527 (2017).
13.
Booth HP, Prevost AT, Gulliford MC. Validity of smoking prevalence estimates from primary care electronic health records compared with national population survey data for England, 2007 to 2011. Pharmacoepidemiol. Drug Saf. 22(12), 1357–1361 (2013).
14.
Matcho A, Ryan P, Fife D et al. Fidelity assessment of a clinical practice research datalink conversion to the OMOP common data model. Drug Saf. 37(11), 945–959 (2014).
15.
NHS. Read Codes 2020 [updated 19 October 2020; March 2021]. https://digital.nhs.uk/services/terminology-and-classifications/read-codes
16.
Spruance SL, Reid JE, Grace M et al. Hazard ratio in clinical trials. Antimicrob. Agents Chemother. 48(8), 2787–2792 (2004).
17.
McCaffrey DF, Ridgeway G, Morral AR. Propensity score estimation with boosted regression for evaluating causal effects in observational studies. Psychologic. Meth. 9(4), 403 (2004).
18.
Kupelian V, Hall SA, McKinlay JB. Common prescription medication use and erectile dysfunction: results from the Boston Area Community Health (BACH) survey. BJU Int. 112(8), 1178–1187 (2013).
19.
Patel JP, Lee EH, Mena-Hurtado CI et al. Evaluation and management of erectile dysfunction in the hypertensive patient. Curr. Cardiol. Rep. 19(9), 1–11 (2017).
20.
Hagberg KW, Divan HA, Persson R et al. Risk of erectile dysfunction associated with use of 5-α reductase inhibitors for benign prostatic hyperplasia or alopecia: population based studies using the Clinical Practice Research Datalink. BMJ 354, i4823 (2016).
21.
VanderWeele TJ, Ding P. Sensitivity analysis in observational research: introducing the E-value. Ann. Intern. Med. 167(4), 268–274 (2017).
22.
Mathur M, Ding P, Riddell C et al. Website and R package for computing E-values. Epidemiology 29(5), e45–e47 (2018).
23.
Thomopoulos C, Parati G, Zanchetti A. Effects of blood pressure lowering on outcome incidence in hypertension: 4. Effects of various classes of antihypertensive drugs--overview and meta-analyses. J. Hypertens. 33(2), 195–211 (2015).
•• Meta-analysis of randomized clinical trial showing non clinically significant differences in systolic blood pressure between the major antihypertensive classes.
24.
Stapff M, Hilderbrand S. First-line treatment of essential hypertension: a real-world analysis across four antihypertensive treatment classes. J. Clin. Hypertens. (Greenwich) 21(5), 627–634 (2019).
•• Non interventional study, with a different design and statistical methods, shows similar mean reduction in systolic blood pressure at 3-year, between the major antihypertensive classes.
25.
Channaraya V, Marya RK, Somasundaram M et al. Efficacy and tolerability of a beta-1 selective beta blocker, bisoprolol, as a first-line antihypertensive in Indian patients diagnosed with essential hypertension (BRIGHT): an open-label, multicentric observational study. BMJ Open 2(3), e000683 (2012).
26.
Zhou WJ, Wang RY, Li Y et al. A randomized controlled study on the effects of bisoprolol and atenolol on sympathetic nervous activity and central aortic pressure in patients with essential hypertension. PLoS ONE 8(9), e72102 (2013).
27.
Suojanen L, Haring A, Tikkakoski A et al. Haemodynamic influences of bisoprolol in hypertensive middle-aged men: a double-blind, randomized, placebo-controlled cross-over study. Basic Clin. Pharmacol. Toxicol. 121(2), 130–137 (2017).
28.
Cooper--DeHoff RM, Bird ST, Nichols GA et al. Antihypertensive drug class interactions and risk for incident diabetes: a nested case-control study. J. Am. Heart Assoc. 2(3), e000125 (2013).
• In a nested case–control study, β-blockers and diuretics comparatively increased the risk of Type 2 diabetes mellitus.
29.
Shen L, Shah BR, Reyes EM et al. Role of diuretics, beta blockers, and statins in increasing the risk of diabetes in patients with impaired glucose tolerance: reanalysis of data from the NAVIGATOR study. BMJ 347, f6745 (2013).
• In a randomized clinical trial, β-blockers and calcium channel blockers were not associated with the risk of Type 2 diabetes mellitus, whereas the risk was increased with diuretics.
30.
Reiner Ž, Catapano AL, De Backer G et al. ESC/EAS guidelines for the management of dyslipidaemias: the Task Force for the management of dyslipidaemias of the European Society of Cardiology (ESC) and the European Atherosclerosis Society (EAS). Eur. Heart J. 32(14), 1769–1818 (2011).
31.
Musini VM, Nazer M, Bassett K et al. Blood pressure-lowering efficacy of monotherapy with thiazide diuretics for primary hypertension. Cochrane Database Syst. Rev. 29(5), CD003824 (2014).
32.
Oh PC, Kang WC, Moon J et al. Anti-anginal and metabolic effects of carvedilol and atenolol in patients with stable angina pectoris: a prospective, randomized, parallel, open-label study. Am. J. Cardiovasc. Drugs 16(3), 221–228 (2016).
33.
Weir MR, Moser M. Diuretics and β-blockers: is there a risk for dyslipidemia? Am. Heart J. 139(1), 174–184 (2000).
34.
Ozbilen S, Eren MA, Turan MN et al. The impact of carvedilol and metoprolol on serum lipid concentrations and symptoms in patients with hyperthyroidism. Endocr. Res. 37(3), 117–123 (2016).
35.
Lee P, Day R, Greenfield J et al. Formoterol, a highly β 2-selective agonist, increases energy expenditure and fat utilisation in men. Int. J. Obes. 37(4), 593–597 (2013).
36.
Kovačić D, Marinšek M, Gobec L et al. Effect of selective and non-selective β-blockers on body weight, insulin resistance and leptin concentration in chronic heart failure. Clin. Res. Cardiol. 97(1), 24–31 (2008).
37.
Rosen RC, Fisher WA, Eardley I et al. The multinational Men's Attitudes to Life Events and Sexuality (MALES) study: i. Prevalence of erectile dysfunction and related health concerns in the general population. Curr. Med. Res. Opin. 20(5), 607–617 (2004).
38.
Al Khaja KA, Sequeira RP, Alkhaja AK et al. Antihypertensive drugs and male sexual dysfunction: a review of adult hypertension guideline recommendations. J. Cardiovasc. Pharmacol. 21(3), 233–244 (2016).
39.
Baumhäkel M, Schlimmer N, Kratz M et al. Cardiovascular risk, drugs and erectile function–a systematic analysis. Int. J. Clin. Pract. 65(3), 289–298 (2011).
40.
Silvestri A, Galetta P, Cerquetani E et al. Report of erectile dysfunction after therapy with beta-blockers is related to patient knowledge of side effects and is reversed by placebo. Eur. Heart J. 24(21), 1928–1932 (2003).
41.
Manolis A, Doumas M, Ferri C et al. Erectile dysfunction and adherence to antihypertensive therapy: focus on β-blockers. Eur. J. Intern. Med. 81, 1–6 (2020).
Information & Authors
Information
Published In
Pages: 423 - 436
PubMed: 35189710
Copyright
© 2022 Merck KGaA, Germany. This work is licensed under the Attribution-NonCommercial-NoDerivatives 4.0 Unported License
History
Received: 17 December 2021
Accepted: 9 February 2022
Published online: 22 February 2022
Keywords:
Topics
Authors
Funding Information
Metrics & Citations
Metrics
Article Usage
Article usage data only available from February 2023. Historical article usage data, showing the number of article downloads, is available upon request.
Citations
How to Cite
Effectiveness of bisoprolol versus other β-blockers and other antihypertensive classes: a cohort study in the Clinical Practice Research Datalink. (2022) Journal of Comparative Effectiveness Research. DOI: 10.2217/cer-2021-0305
Export citation
Select the citation format you wish to export for this article or chapter.
Citing Literature
- Evgeniy Nikolaevich Ievlev, DYNAMICS OF LIPID PROFILE IN PATIENTS WITH END-STAGE RENAL DISEASE DEPENDING ON THE CLASS OF ANTIHYPERTENSIVE DRUGS, Ulyanovsk Medico-biological Journal, 10.34014/2227-1848-2026-2-58-76, 2, (58-76), (2026).
- Oleksandr Pyvovarov, Assessment of interest in drugs based on the active ingredient bisoprolol using the Google Trends search engine, The Ukrainian Scientific Medical Youth Journal, 10.32345/USMYJ.1(160).2026.7-17, 160, 1, (7-17), (2026).
- Hriday Kumar Chopra, Kamal Kumar Sethi, Tiny Nair, Chandrashekhar Ponde, Saumitra Ray, Sarita Rao, Shanmunga Sundaram, Dinesh Khullar, Navin C Nanda, Jatinder Pal Singh Sawhney, Sarita Bajaj, Yatin Mehta, Ashok Kumar Pancholia, Pradeep Jain, Ashok Kumar Omar, Aditya Kapoor, Rishi Sethi, Atul Abhyankar, Vinod Sharma, Anil Dhall, Ajay Sinha, Shishu Shankar Mishra, Satya Narayan Rautray, Gyarsi Lal Sharma, Ashwani Mehta, Rajeev Agarwala, Rajeev Rajput, Ajay Mahajan, Sanjay Porwal, Ramesh Hotchandani, Vishal Rastogi, Rajiv Passey, Mohan Bhargava, Gnanaraj Justin Paul, Dorairaj Prabhakaran, Vivudh P Singh, Vinod Mittal, Vitull Gupta, Anil Kumar Bhalla, Virender Kumar Katyal, Ishwarappa Balekundri Vijaylakshami, Asha Moorthy, Poonam Malhotra, Vanita Arora, Mona Bhatia, Prabhavathy Bhat, Shibba T Chhabra, Sugandhi Gopal, Tripti Deb, Preeti Gupta, Hemlata Tewari, Anupam Goel, Rekha Mishra, Lovelina Singh, Zakia Khan, Geeta Sheth, Chandra Mukhi, Inder Pal Singh Kalra, Yogender Kumar Arora, Uttara Das, Kavita Tyagi, Satya Nand Pathak, Samir Kubba, Saurabh Bagga, Asha Mahilmaran, Ameet Sattur, Rohit Tandon, Dharmender Jain, Hetan Shah, Cecily Majella, Ravi Prakash, Manish Aggarwal, Ruchi Verma, Sumit Sethi, Alka Gujral, Kanika Sood, Sonia Rawat, Varsha Kaul, Surinder S Arora, Manjiti Arora, Veena Bhat, Anil Kumar Bali, Sanjay Sood, Shakuntala Dawesar, Bhushan K Dawesar, Nilakshi Deka, Makarand Paithankar, Rajiv Handa, Nitish Parmar, Sheikh U Nabi, Naveen Garg, Sandeep Sharma, Vivek Tandon, Manoj Pabrai, Samshad Alam, Manju Tyagi, Manisha Sahay, Manju Hotchandani, Anupama Kathpalia, Ish Kathpalia, Sangeeta Chaudhary, Kiran Kukreja, Vikas Agrawal, Inam D Khan, Prachi Garg, Satya Naryana, Pawan Kumar Mangla, Rajiv Mehrotra, Rajiv Garg, Upadhyayula Satyanarayan, Himani Malhotra, Kapil Kumar, Lokesh Raj, Shachi Kalyani, Vijay Garg, Ali H Khan, Harman P Singh, Sajal Gupta, TC Singh, Vipul Rastogi, Rahul Ramteke, Sukriti Bhalla, Ritesh Sanguri, Sumit K Niranjan, Rohit Singla, Alok Kumar, Anu Grover, National Consensus Statement on Role of Bisoprolol across Cardiovascular Continuum: Special Focus on Women, Journal of The Association of Physicians of India, 10.59556/japi.73.0957, 73, 5, (e16-e33), (2025).
- V. S. Chulkov, M. Z. Gasanov, O. V. Azovtseva, E. E. Minina, Vl. S. Chulkov, The role of beta blockers in the treatment of cardiovascular diseases, Meditsinskiy sovet = Medical Council, 10.21518/ms2024-467, 16, (28-36), (2024).
- Antoine Pinon, Arthur Allignol, Thilo Hohenberger, Caroline Foch, Emmanuelle Boutmy, Ulrike Hostalek, Dependent censoring bias assessment using inverse probability of censoring weights: Type 2 diabetes mellitus risk in patients initiating bisoprolol versus other antihypertensives in a Clinical Practice Research Datalink cohort study, Journal of Comparative Effectiveness Research, 10.57264/cer-2023-0027, 13, 11, (2024).
- Petra Vysočanová, Optimal heart rate value - not only hypertensive patients, Medicína pro praxi, 10.36290/med.2024.013, 21, 2, (79-83), (2024).
- Felix Mahfoud, Jiguang Wang, Saumitra Ray, The current position of β-blockers in hypertension: guidelines and clinical practice, Current Medical Research and Opinion, 10.1080/03007995.2024.2318003, 40, sup1, (25-32), (2024).
- Ujwala Desai, Smita Pimple, Divya Dhamankar, Ganesh Desai, Vishal Vare, Developing a Green UV-Spectroscopic Method for Quercetin and Celecoxib Estimation Using AGREE Assessment Tool, International Journal of Pharmaceutical And Phytopharmacological Research, 10.51847/G4jD6FEZ1I, 14, 4, (9-16), (2024).
- Stefano Masi, Zhanna Kobalava, Chiara Veronesi, Elisa Giacomini, Luca Degli Esposti, Konstantinos Tsioufis, A Retrospective Observational Real-Word Analysis of the Adherence, Healthcare Resource Consumption and Costs in Patients Treated with Bisoprolol/Perindopril as Single-Pill or Free Combination, Advances in Therapy, 10.1007/s12325-023-02707-7, 41, 1, (182-197), (2023).
- Laura Dormer, Journal of Comparative Effectiveness Research: 2022 year in review, Journal of Comparative Effectiveness Research, 10.57264/cer-2023-0026, 12, 4, (2023).