Cost–effectiveness of concurrent radiation with cetuximab or chemotherapy in older patients with oropharyngeal cancer
Publication: Journal of Comparative Effectiveness Research
Abstract
Aim: To assess the cost–effectiveness of definitive therapies for nonmetastatic oropharyngeal cancer (OPC). Materials & methods: Using the Surveillance, Epidemiology and End Results-Medicare dataset, patients diagnosed between 2000 and 2011 were identified. The cost–effectiveness of chemoradiation (CRT) versus radiotherapy (RT), cetuximab plus RT (cetuximab-RT) versus RT and cetuximab-RT versus CRT were estimated. Results: The incremental cost–effectiveness ratio for CRT compared with RT from 2000 to 2005 was US$56,650 (95% CI: US$4,522–$288,688) per additional year of survival. CRT was dominated by RT from 2006 to 2011. Cetuximab-RT was dominated by RT and CRT. Conclusion: CRT had a favorable value from 2000 to 2005 but was dominated by RT from 2006 to 2011. The value of cetuximab-RT compared with RT/CRT was not favorable with similar/inferior survival and substantial incremental costs.
Background
Squamous cell carcinoma of the oropharynx is a distinct subset of head and neck cancers (HNC) that involve the base of the tongue, tonsil, soft palate, vallecula and pharyngeal wall. While historically many oropharyngeal cancer (OPC) cases were related to the risk factors of tobacco and alcohol use, the incidence of oncogenic human papillomavirus (HPV) infection as an etiologic factor has increased over time. The incidence of OPC in the USA is projected to increase from 20,124 cases in 2016 to about 30,629 cases in 2029 [1]. Previous studies have indicated that there is an ongoing shift toward an increased incidence of OPC in the USA among older age groups, in particular, those over 65 years of age, which is likely attributed to HPV-related OPC [1,2]. Trends of increasing HPV-related OPC incidence have been observed in the USA and other economically developed countries [3].
Data from the Surveillance, Epidemiology and End Results (SEER) registry indicate that about 77% of the oral cavity and pharynx cancer cases are diagnosed at a localized or regional stage [4]. While the increasing availability of transoral robotic surgery (TORS) has allowed for surgical resection to be offered as a curative approach to more patients [5], definitive cytotoxic chemotherapy plus radiation (CRT) is still widely employed as a curative treatment option. The added benefit of CRT compared with radiation therapy (RT) alone was established based on multiple clinical trials, the results of which were disseminated between 1999 and 2004 [6–9]. However, the addition of chemotherapy to radiation can be associated with significant toxicity, especially in older individuals, and there are limited prospective data with regard to alternative chemotherapy dosing schedules. Thus, treatment with RT alone remained a relevant option for older patients with comorbidities, who might not tolerate chemotherapy.
In 2006, Bonner et al. presented randomized data showing a survival benefit with the monoclonal antibody EGFR inhibitor cetuximab plus RT (cetuximab-RT) over RT alone [10]. The study was met with widespread interest among head and neck oncologists as it presented a new treatment option, especially for patients at higher risk of increased toxicity from platinum-based chemotherapy. Over time, a debate developed with regard to the efficacy of cisplatin plus RT (cisplatin-RT) versus cetuximab-RT, in part supported by a retrospective analysis that indicated the survival outcomes were inferior with cetuximab-RT compared to cisplatin-RT [11]. In addition, subsequent studies indicated that the toxicity of cetuximab-RT may be more pronounced than originally anticipated [12]. In a randomized clinical trial (RTOG 1016) among patients with HPV-associated OPC, cisplatin-RT outperformed cetuximab-RT in locoregional control, progression-free survival and overall survival (OS) [13]. In another randomized clinical trial (De-ESCALaTE HPV) in patients with HPV-positive low-risk OPC, cetuximab-RT did not demonstrate reduced toxicity compared with cisplatin-RT, but did show inferior tumor control, with a lower rate of two-year OS and a higher rate of two-year recurrence [14].
Thus, while this data did not support the use of cetuximab for HPV-positive OPC, its use for HPV-negative disease has not specifically been studied. There remain questions about efficacy in this subset, coupled with the known increased cost associated with cetuximab. A previously published study demonstrated that treatment with cetuximab-RT is associated with substantial incremental costs compared with treatment with CRT or RT alone [15]. Therefore, it is important to evaluate the clinical and economic outcomes of OPC treatment options, establish their cost–effectiveness and compare their results as the treatment landscape changes over time.
Although there are a few cost–effectiveness studies of cetuximab for locally advanced HNC [16–18], there is a need for studies that focus on OPC given the etiologic nature of this subsite and its common association with HPV. In addition, previous cost–effectiveness studies were conducted by modeling data from clinical trials and this evidence must be complemented by real-world data that reflect actual spending by payers. Moreover, the shifting age demographics and HPV prevalence over time as well as developments in radiation treatment in recent years warrant evaluating how the value of OPC treatments has evolved over a long interval of time (2000–2013).
The objective of this study was to conduct cost–effectiveness analyses to assess the value of definitive therapeutic options for OPC between 2000 and 2013. To facilitate the analysis of cost–effectiveness over time, the study period was divided into two based on the year of diagnosis (2000–2005 and 2006–2011). In the early time period, the survival and costs outcomes of CRT versus RT alone were compared. In the later time period, comparisons included CRT versus RT alone, cetuximab-RT versus RT alone and CRT versus cetuximab-RT.
Materials & methods
Study design & data source
This retrospective cohort study aimed to estimate the cost–effectiveness of definitive CRT and cetuximab-RT compared with RT alone over time among patients with OPC. The linked SEER-Medicare database, which provides clinical and health services utilization information on Medicare beneficiaries with cancer by linking two large population-based datasets, was used [19]. SEER data provides demographic and cancer-related information, while Medicare data provide medical claims information for the utilized health services. During the study period (2000–2013), the SEER registry collected demographic and cancer-related information from registries that covered approximately 28% of the US population. This study was approved by the local Institutional Review Board (HP-00067264).
Beneficiaries aged 66 years and older who were newly diagnosed with nonmetastatic OPC and who were treated with definitive RT, concurrent CRT or concurrent cetuximab-RT were identified. The study included patients diagnosed between 2000 and 2011 and with Medicare claims data from 1999 until 2013. The study sample was divided into two cohorts based on the diagnosis period: 2000–2005 (Cohort I) and 2006–2011 (Cohort II). These two time periods were selected to reflect the change in the treatment landscape associated with the publication of the Bonner et al. study [10] and the approval of cetuximab for locally or regionally advanced HNC in 2006. The analytic dataset was limited to patients who received the following treatments within 180 days postdiagnosis: RT or CRT in Cohort I, and RT, CRT or cetuximab-RT in Cohort II. Patients were required to have continuous enrollment in fee-for-service Medicare Parts A and B during the 12 months prior to the OPC diagnosis (baseline period) and until the end of the study period (31 December 2013) or death. The following exclusion criteria were applied: in situ or distant tumors, receipt of cetuximab in Cohort I, health maintenance organization enrollment during the baseline period, OPC diagnosis on autopsy, missing diagnosis date, nonsquamous cell carcinoma, benign tumor and unknown race. This cost–effectiveness study was conducted from a Medicare perspective and examined the direct medical costs associated with OPC diagnosis and treatment. The study time horizon was 5 years. The cost and survival estimates were discounted at an annual 3% rate and costs were inflated to 2017 US dollars using the Medical Component of the Consumer Price Index.
Treatment receipt
Patients with tumor-node-metastasis (TNM) stage M0 disease were assigned to the CRT group if they had at least one claim for RT and at least one claim for chemotherapy within 180 days of diagnosis. Patients were assigned to the cetuximab-RT group if they had at least one claim for RT and one claim for cetuximab within 180 days of diagnosis. Patients with at least one claim for RT and no claims for chemotherapy within 180 days of diagnosis were assigned to the RT-alone group. Cohort I was limited to patients who received either RT alone or CRT. Cohort II included patients who received RT alone, CRT or cetuximab-RT.
Outcomes: overall survival & cost
OS was estimated using the diagnosis date (actual diagnosis month and first day of that month) and the date of death. OS was defined as the time from cancer diagnosis until death or censoring for those alive on 31 December 2013. Direct medical costs were estimated from the following sources: hospitalizations, healthcare providers, outpatient facilities, home health, skilled nursing facilities, hospice and durable medical equipment. Costs recorded in Medicare files represented Medicare reimbursements to healthcare providers or healthcare facilities. The total cost per patient was estimated by summing all monthly costs from all sources during the follow-up period until death or censoring.
Covariates
Patients' baseline demographic and clinical characteristics, including age, race, gender, marital status, Charlson Comorbidity Index (CCI), stage (localized/regional), urban residence (Yes/No) , census tract median income, year of diagnosis and geographic region were evaluated. The staging information (i.e., localized/regional) was based on SEER Summary Stage for cases diagnosed in 2000–2003. For nonmetastatic cases diagnosed in 2004–2011, localized/regional stages were derived based on the American Joint Committee on Cancer (AJCC) Sixth Edition staging with a review of tumor and nodal staging. Localized stage was assigned for nonmetastatic tumors with no lymph node involvement while regional disease was assigned for nonmetastatic tumors with lymph node involvement. For each comparison under evaluation, the factors associated with cost and OS were evaluated.
Statistical analyses
Patients' demographic and clinical characteristics were compared across study cohorts using t-tests, the Fisher's exact test and the likelihood ratio test. To control for measurable systematic differences between the study groups, the comparison groups were matched on observable factors. For each comparison under evaluation (e.g., CRT vs RT in 2005–2011), 1:1 propensity score matching was conducted based on the factors associated with cost and OS. The factors that were statistically associated with costs were identified based on the results from multivariable generalized linear models (with a log link and gamma distribution) that included all baseline variables. Factors statistically associated with OS were identified based on multivariable Cox proportional hazards models that included all baseline variables. Accordingly, for each comparison, the factors that were associated with cost and/or OS (Supplementary Table 1) were identified and included in the logistic regression models that were used to calculate the propensity scores for treatment receipt. The comparison groups were then matched using a greedy five-to-one digit matching algorithm that aimed to increase the number of matched cases while maintaining the goodness of matching [20]. The greedy matching algorithm was based on the following approach: first, patients were matched on the five digits of the propensity score of treatment receipt. The remaining unmatched cases were then matched on the four digits of the propensity score. This sequence was followed until patients were matched on one digit of the propensity score. The goodness of matching was assessed by comparing the characteristics of the matched groups using standardized mean differences. The standardized mean differences between the comparison groups were less than 0.25 for all covariates included in the matching process, indicating a good variable balance [21].
Median OS was estimated using the Kaplan–Meier approach and survival functions were compared across cohorts using the Wilcoxon and log-rank tests. The restricted mean survival time (RMST) was also estimated at five years for the matched comparison groups. The RMST estimated the area under the Kaplan–Meier curve, restricted at five years, and provided a reliable estimate of mean survival that can accommodate the available study follow-up time [22].
In each of the matched samples, the mean five-year cost per patient was estimated for each comparison group. Since there was no censoring in Cohort I at five years, we estimated the mean five-year cost by summing the costs from all sources and dividing by the number of patients in the group of interest. In Cohort II, the censoring proportion at 5 years ranged 25–36% (Supplementary Table 2). Therefore, the inverse probability weighting (IPW) method was used to adjust for right-censoring as suggested by Bang and Tsiatis [23,24]. Using this approach, the cost of censored patients was accounted for based on the costs of complete observations. Patients with longer survival received higher weights compared with patients who died soon after diagnosis.
To estimate the cost–effectiveness of CRT compared with RT in Cohort I, the mean incremental cost of CRT compared with RT was first estimated by calculating the difference between the mean costs of both groups. Given the skewed distribution of the cost data, the 95% CI of the incremental cost estimate was estimated using nonparametric bootstrapping with 1000 sampling repetitions. Second, the mean difference in RMST between the two groups was estimated. Similar to the incremental cost, the 95% CI of the difference was estimated using the same bootstrapped samples. Third, the incremental cost–effectiveness ratio (ICER) was estimated by dividing the incremental cost by the incremental RMST. The 95% CI of the ICER estimate was derived from the 25th and 975th percentiles obtained from the bootstrapped samples. Finally, the joint incremental cost and effectiveness estimates from the bootstrapped samples were plotted on the cost–effectiveness plane to graphically illustrate the cost–effectiveness of CRT compared with RT. The same approach was applied to all study comparisons. All statistical analyses were conducted using SAS (version 9.4, SAS Institute Inc., NC, USA) and R statistical software (version 3.6.2; R Foundation, Vienna, Austria) .
Results
Descriptive results
A total of 922 patients with OPC were identified in Cohort I. Patients receiving CRT represented 42% (n = 391) of the cohort while patients receiving RT represented 58% (n = 531). The cohorts exhibited differences in age, sex, stage and tract median income as shown in Table 1.
| Treatment group | p-value | ||||||
|---|---|---|---|---|---|---|---|
| Overall (n = 922) | CRT (n = 391) | RT (n = 531) | |||||
| n | % | n | % | n | % | ||
| Age | <0.001 | ||||||
| 66–69 | 251 | (27.2) | 138 | (35.3) | 113 | (21.3) | |
| 70–74 | 267 | (29.0) | 119 | (30.4) | 148 | (27.9) | |
| 75–79 | 210 | (22.8) | 88 | (22.5) | 122 | (23.0) | |
| 80+ | 194 | (21.0) | 46 | (11.8) | 148 | (27.9) | |
| Sex | 0.004 | ||||||
| Male | 595 | (64.5) | 273 | (69.8) | 322 | (60.6) | |
| Female | 327 | (35.5) | 118 | (30.2) | 209 | (39.4) | |
| Race | 0.321 | ||||||
| White | 799 | (86.7) | 345 | (88.2) | 454 | (85.5) | |
| African-American | 82 | (8.9) | 33 | (8.4) | 49 | (9.2) | |
| Other | 41 | (4.4) | 13 | (3.3) | 28 | (5.3) | |
| Married | 0.174 | ||||||
| Missing | 46 | (5.0) | 21 | (5.4) | 25 | (4.7) | |
| No | 441 | (47.8) | 173 | (44.2) | 268 | (50.5) | |
| Yes | 435 | (47.2) | 197 | (50.4) | 238 | (44.8) | |
| Urban residence | 0.849 | ||||||
| No | 15 | (1.6) | † | † | † | † | |
| Yes | 907 | (98.4) | † | † | † | † | |
| CCI score | 0.080 | ||||||
| Missing | 48 | (5.2) | 24 | (6.1) | 24 | (4.5) | |
| 0 | 469 | (50.9) | 213 | (54.5) | 256 | (48.2) | |
| 1 | 231 | (25.1) | 92 | (23.5) | 139 | (26.2) | |
| 2+ | 174 | (18.9) | 62 | (15.9) | 112 | (21.1) | |
| Stage | <0.001 | ||||||
| Missing | 58 | (6.3) | 23 | (5.9) | 35 | (6.6) | |
| Localized | 201 | (21.8) | 47 | (12.0) | 154 | (29.0) | |
| Regional | 663 | (71.9) | 321 | (82.1) | 342 | (64.4) | |
| Census tract median income quartile | 0.021 | ||||||
| Missing | 12 | (1.3) | † | † | † | † | |
| 1st | 228 | (24.7) | 76 | (19.4) | 152 | (28.6) | |
| 2nd | 228 | (24.7) | † | † | † | † | |
| 3rd | 228 | (24.7) | † | † | † | † | |
| 4th | 226 | (24.5) | 105 | (26.9) | 121 | (22.8) | |
| Region | 0.047 | ||||||
| Midwest | 96 | (10.4) | 43 | (11.0) | 53 | (10.0) | |
| Northeast | 165 | (17.9) | 83 | (21.2) | 82 | (15.4) | |
| South | 292 | (31.7) | 108 | (27.6) | 184 | (34.7) | |
| West | 369 | (40.0) | 157 | (40.2) | 212 | (39.9) | |
| Teaching hospital | <0.001 | ||||||
| No | 779 | (84.5) | 289 | (73.9) | 490 | (92.3) | |
| Yes | 143 | (15.5) | 102 | (26.1) | 41 | (7.7) | |
†
Per data use agreement, cell sizes less than 11 cannot be shown or derived.
CCI: Charlson Comorbidity Index; CRT: Cytotoxic chemotherapy plus radiation; RT: Radiation therapy.
In Cohort II, 1133 OPC patients were identified with the following distribution by primary treatment: CRT group = 31% (n = 349), cetuximab-RT group = 23% (n = 257) and RT group = 47% (n = 527). The cohorts exhibited differences in age, gender, race, marital status, stage, median tract income and census region as shown in Table 2.
| Treatment group | p-value | ||||||||
|---|---|---|---|---|---|---|---|---|---|
| Overall (n = 1133) | RT (n = 527) | CRT (n = 349) | Cetuximab-RT (n = 257) | ||||||
| n | % | n | % | n | % | n | % | ||
| Age | <.001 | ||||||||
| 66–69 | 366 | (32.3) | 155 | (29.4) | 145 | (41.5) | 66 | (25.7) | |
| 70–74 | 367 | (32.4) | 176 | (33.4) | 109 | (31.2) | 82 | (31.9) | |
| 75–79 | 202 | (17.8) | 79 | (15.0) | 66 | (18.9) | 57 | (22.2) | |
| 80+ | 198 | (17.5) | 117 | (22.2) | 29 | (8.3) | 52 | (20.2) | |
| Sex | 0.047 | ||||||||
| Male | 847 | (74.8) | 376 | (71.3) | 270 | (77.4) | 201 | (78.2) | |
| Female | 286 | (25.2) | 151 | (28.7) | 79 | (22.6) | 56 | (21.8) | |
| Race | 0.020 | ||||||||
| White | 1021 | (90.1) | 465 | (88.2) | 317 | (90.8) | 239 | (93.0) | |
| African-American | 68 | (6.0) | † | † | † | † | † | † | |
| Other | 44 | (3.9) | † | † | † | † | † | † | |
| Married | 0.001 | ||||||||
| Missing | 75 | (6.6) | † | † | † | † | † | † | |
| No | 451 | (39.8) | † | † | † | † | † | † | |
| Yes | 607 | (53.6) | 249 | (47.2) | 201 | (57.6) | 157 | (61.1) | |
| Urban residence | 0.215 | ||||||||
| No | 18 | (1.6) | † | † | † | † | † | † | |
| Yes | 1115 | (98.4) | † | † | † | † | † | † | |
| CCI score | 0.417 | ||||||||
| Missing | 39 | (3.4) | † | † | † | † | † | † | |
| 0 | 574 | (50.7) | † | † | † | † | † | † | |
| 1 | 273 | (24.1) | 128 | (24.3) | 91 | (26.1) | 54 | (21.0) | |
| 2+ | 247 | (21.8) | 119 | (22.6) | 69 | (19.8) | 59 | (23.0) | |
| Stage | <0.001 | ||||||||
| Missing | 30 | (2.6) | † | † | † | † | † | † | |
| Localized | 195 | (17.2) | † | † | † | † | † | † | |
| Regional | 908 | (80.1) | 398 | (75.5) | 290 | (83.1) | 220 | (85.6) | |
| Census tract median income quartile | 0.004 | ||||||||
| Missing | † | † | † | † | † | † | † | † | |
| 1st | † | † | † | † | † | † | † | † | |
| 2nd | 282 | (24.9) | 138 | (26.2) | 80 | (22.9) | 64 | (24.9) | |
| 3rd | 282 | (24.9) | 115 | (21.8) | 84 | (24.1) | 83 | (32.3) | |
| 4th | 281 | (24.8) | 119 | (22.6) | 96 | (27.5) | 66 | (25.7) | |
| Region | 0.002 | ||||||||
| Midwest | 99 | (8.7) | 47 | (8.9) | 36 | (10.3) | 16 | (6.2) | |
| Northeast | 192 | (16.9) | 90 | (17.1) | 61 | (17.5) | 41 | (16.0) | |
| South | 332 | (29.3) | 168 | (31.9) | 110 | (31.5) | 54 | (21.0) | |
| West | 510 | (45.0) | 222 | (42.1) | 142 | (40.7) | 146 | (56.8) | |
| Teaching hospital | 0.250 | ||||||||
| No | 1051 | (92.8) | 482 | (91.5) | 326 | (93.4) | 243 | (94.6) | |
| Yes | 82 | (7.2) | 45 | (8.5) | 23 | (6.6) | 14 | (5.4) | |
†
Per data use agreement, cell sizes less than 11 cannot be shown or derived.
CCI: Charlson Comorbidity Index; Cetuximab-RT: Cetuximab plus radiation; CRT: Cytotoxic chemotherapy plus radiation; RT: Radiation therapy.
After matching the CRT and RT groups in Cohort I, 530 patients we retained, divided evenly between the two groups. After matching the CRT and RT groups in Cohort II, 546 patients were retained, divided evenly between the two groups. The matched cetuximab-RT and RT groups in Cohort II included 448 patients. Lastly, the matched cetuximab-RT and CRT groups in Cohort II included 396 patients. The patient characteristics of the matched groups were comparable based on the variables that were selected for matching as shown in Supplementary Tables 3–6.
Overall survival
The Kaplan–Meier OS functions for the matched groups are shown in Figure 1. The survival curves indicate that the CRT group exhibited longer survival compared with the RT group in Cohort I (p = 0.049). In Cohort II, there was no difference in OS between the CRT and RT groups. OS was also similar between the cetuximab-RT and RT groups in Cohort II. Finally, the CRT group had superior survival compared with the cetuximab-RT group (p = 0.017).
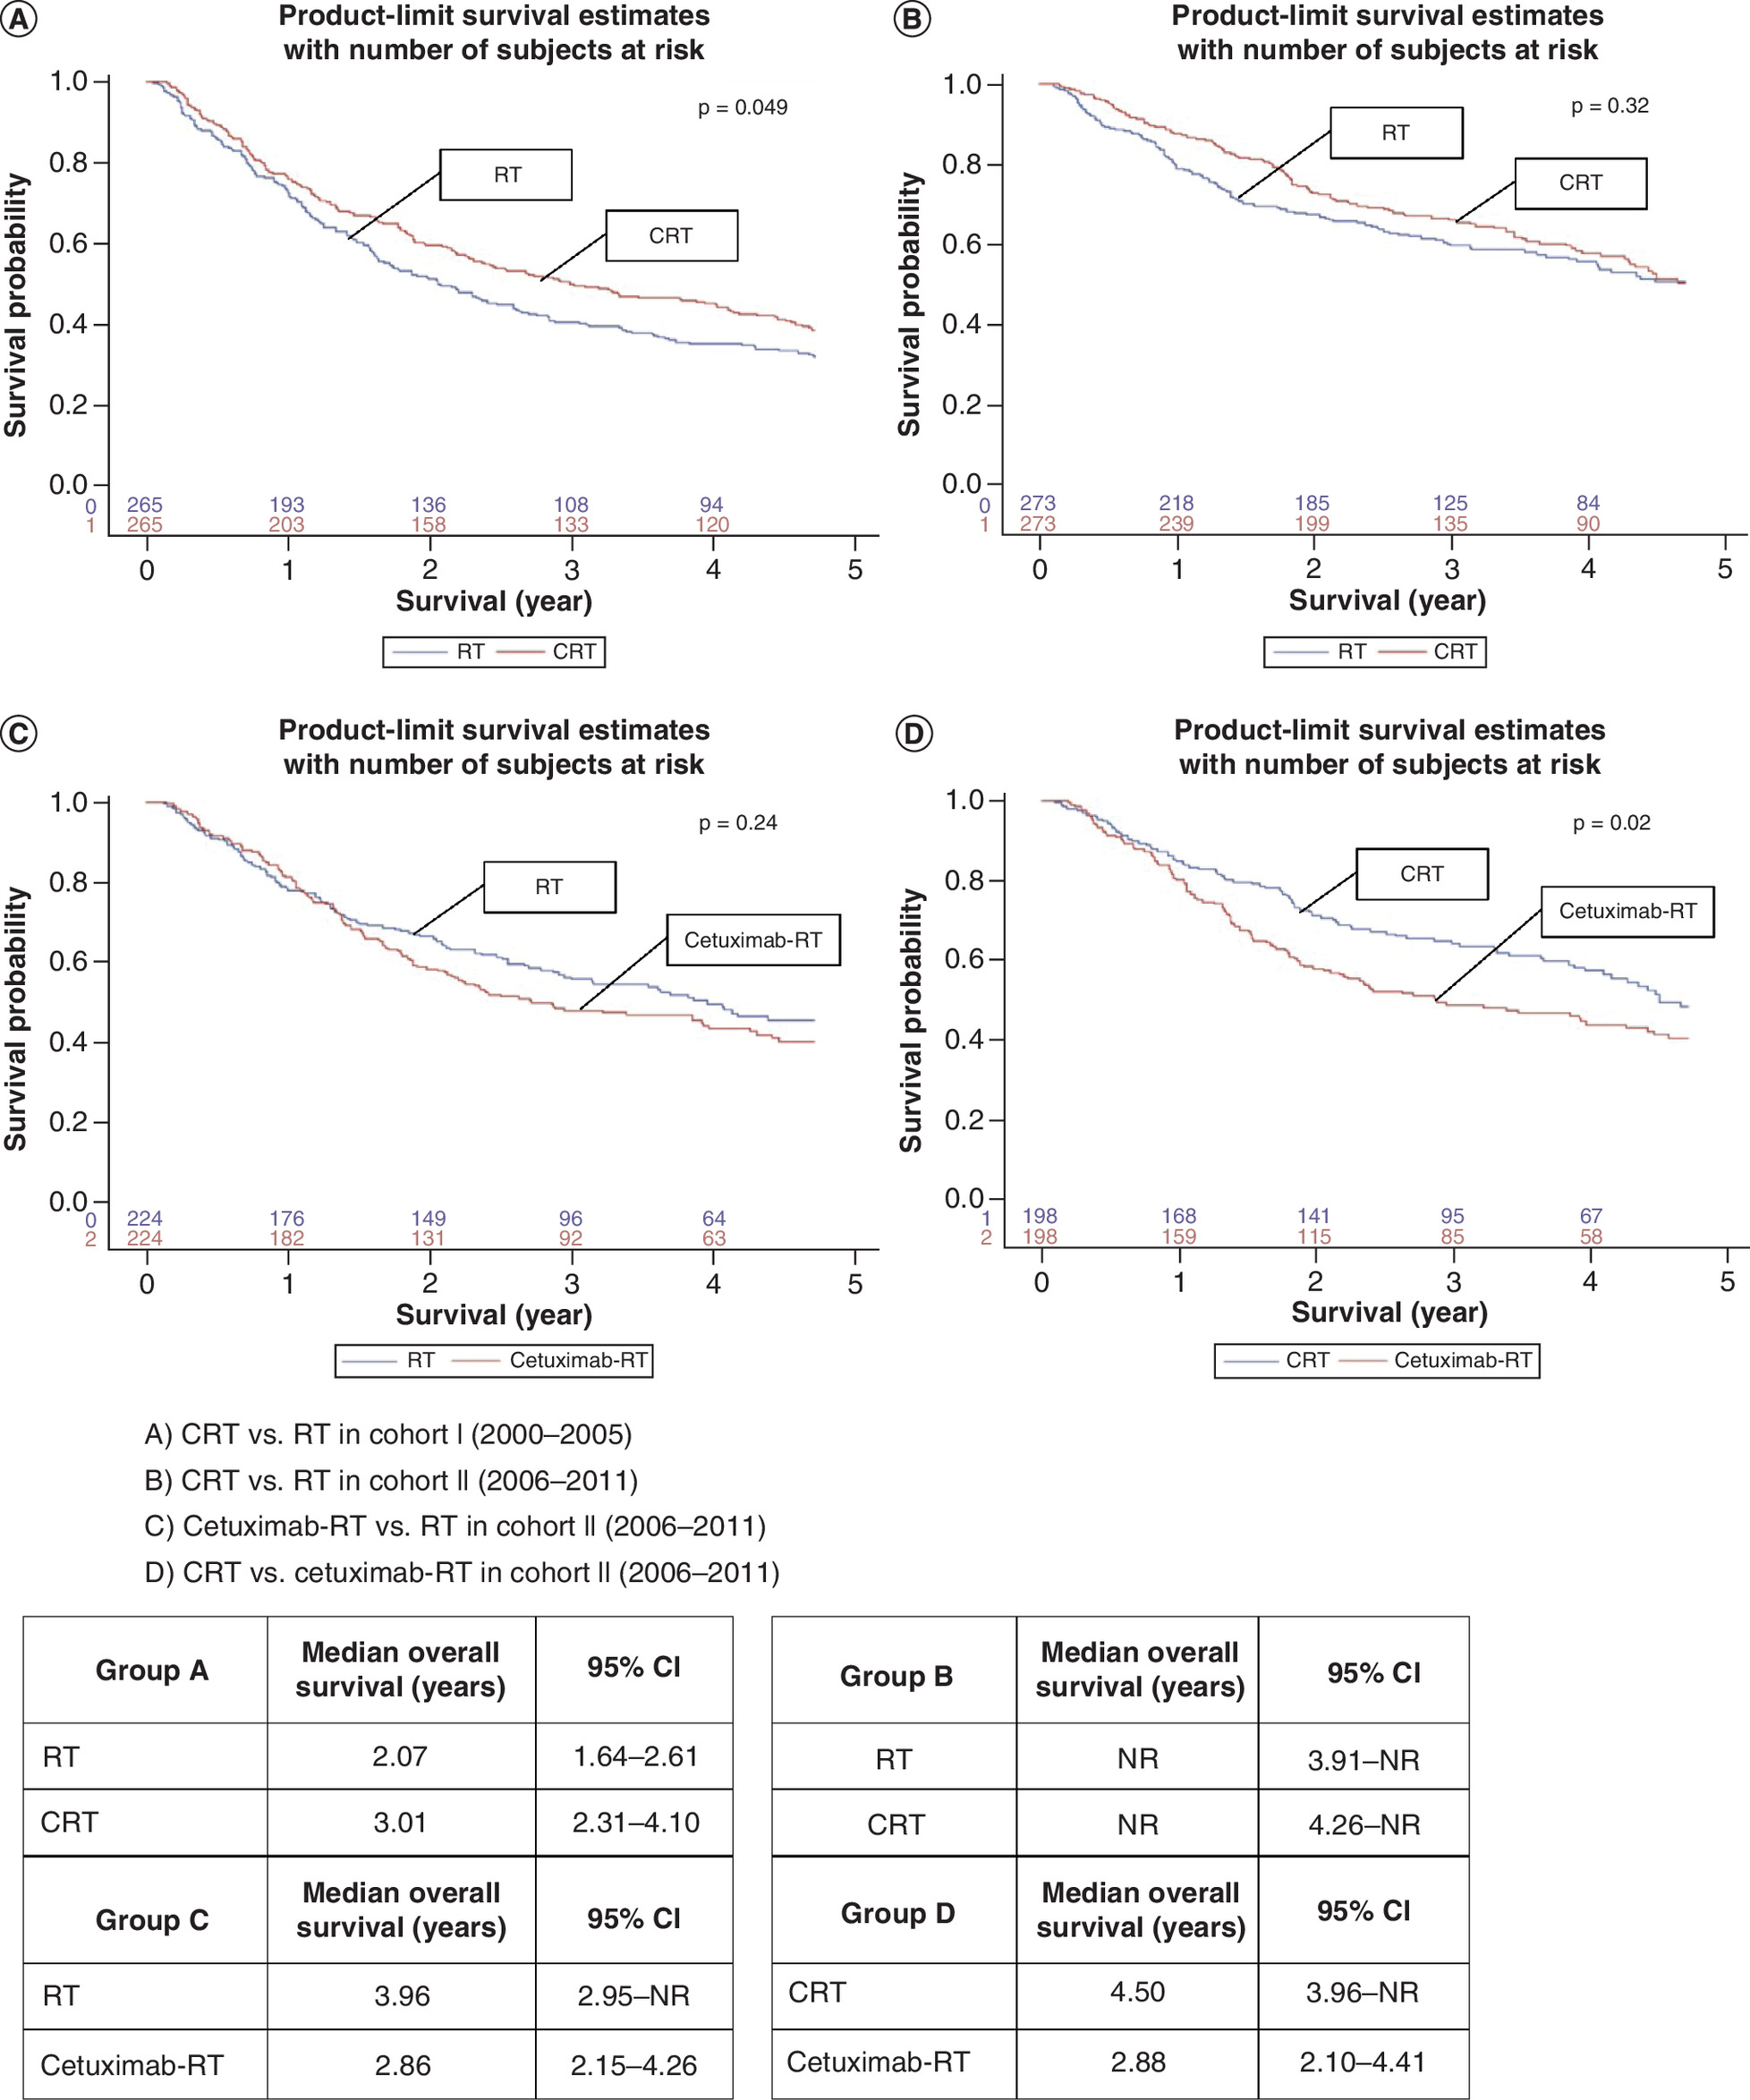
Figure 1. Kaplan–Meier survival curves comparing treatment groups in Cohorts I and II.
(A) CRT versus RT in Cohort I (2000–2005). (B) CRT versus RT in Cohort II (2006–2011). (C) Cetuximab-RT versus RT in Cohort II (2006–2011). (D) CRT versus cetuximab-RT in Cohort II (2006–2011).
Cetuximab-RT: Cetuximab plus radiation; CRT: Cytotoxic chemotherapy plus radiation; NR: Not reached; RT: Radiation therapy.
Cost–effectiveness
Cost–effectiveness results are provided for four comparisons across two time periods and their associated cohorts: CRT versus RT in Cohort I (2000–2005); CRT versus RT in Cohort II (2006–2011); cetuximab-RT versus RT in Cohort II; and cetuximab-RT versus CRT in Cohort II. Based on the first comparison, the incremental cost of CRT compared with RT was US$19,261 (95% CI: US$4232–$35,054). The incremental RMST was 0.34 (95% CI: 0.03–0.65) years. The ICER was US$56,650 (95% CI: US$4522–$288,688) per additional year of survival. Based on the second comparison, the incremental cost of CRT compared with RT in Cohort II was US$32,665 (95% CI: US$13,692–$51,668). The incremental RMST was 0.24 (95% CI: -0.05–0.51) years. The ICER was US$136,104 (95% CI: -910,678–1,111,999) per additional year of survival. The results for the third comparison were as follows: the incremental cost of cetuximab-RT compared with RT was US$46,557 (95% CI: US$27,961–$66,094). The incremental RMST was -0.19 (95% CI: -0.53–0.15) years. Lastly, based on the fourth comparison, the incremental cost of cetuximab-RT compared with CRT was US$34,422 (95% CI: US$13,919–$56,982). The incremental RMST was -0.48 (95% CI: -0.81– -0.16) years.
The cost–effectiveness results of the four comparisons are summarized in Table 3 and illustrated graphically in Figure 2. The figure shows scatter plots of the incremental costs and RMST pairs from the 1000 bootstrapped samples. For the CRT versus RT comparison in Cohort I, most of the points fall in the northeast quadrant, which indicates that CRT is associated with improved survival and higher costs. For the CRT versus RT comparison in Cohort II, most of the points also fall in the northeast quadrant; however, a proportion of the points cross over to the northwest quadrant, which indicates a lack of evidence of improved survival with CRT. For the cetuximab-RT versus RT comparison in Cohort II, most of the points fall in the northwest quadrant, indicating that cetuximab-RT is associated with higher costs without evidence of improved survival. Finally, for the cetuximab-RT versus CRT comparison in Cohort II, almost all of the points fall in the northwest quadrant, which indicates that cetuximab-RT is associated with inferior survival and higher costs.
| Evaluation | CRT vs RT | CRT vs RT | Cetuximab-RT vs RT | Cetuximab-RT vs CRT | ||||
|---|---|---|---|---|---|---|---|---|
| Diagnosis year | 2000–2005 | 2006–2011 | 2006–2011 | 2006–2011 | ||||
| CRT | RT | CRT | RT | Cetuximab-RT | RT | Cetuximab-RT | CRT | |
| N | 265 | 265 | 273 | 273 | 224 | 224 | 198 | 198 |
| Mean cost, $ (SD) | 127,585 (83,597) | 108,325 (92,529) | 138,894 (124,905) | 106,229 (91,747) | 162,550 (104,449) | 115,993 (95,186) | 160,595 (104,044) | 126,174 (105,505) |
| RMST, years (95% CI) | 2.89 (2.67–3.10) | 2.54 (2.33–2.76) | 3.47 (3.28–3.66) | 3.23 (3.02–3.44) | 2.91 (2.68–3.14) | 3.10 (2.87–3.33) | 2.92 (2.67–3.16) | 3.39 (3.16–3.63) |
| Median survival, years (95% CI) | 3.01 (2.31–4.10) | 2.07 (1.64–2.61) | NR | NR | 2.86 (2.15–4.26) | 3.96 (2.95–NR) | 2.88 (2.10–4.41) | 4.50 (3.96–NR) |
| Censoring, % | 0 | 0 | 36 | 35 | 24 | 32 | 24 | 36 |
| Incremental cost, $ (95% CI) | 19,261 (4232–35,054) | 32,665 (13,692–51,668) | 46,557 (27,961–66,094) | 34,422 (13,919–56,982) | ||||
| Incremental RMST, years (95% CI) | 0.34 (0.03–0.65) | 0.24 (-0.05–0.51) | -0.19 (-0.53–0.15) | -0.48 (-0.81– -0.16) | ||||
| ICER, $ per additional year of survival (95% CI) | 56,650 (4522–288,688) | 136,104 (-910,678–1,111,999) | Dominated Positive incremental cost and negative incremental RMST | Dominated Positive incremental cost and negative incremental RMST | ||||
Cetuximab-RT: Cetuximab plus radiation; CRT: Cytotoxic chemotherapy plus radiation; ICER: Incremental cost–effectiveness ratio; NR: Not reached; RMST: Restricted mean survival time; RT: Radiation therapy; SD: Standard deviation.
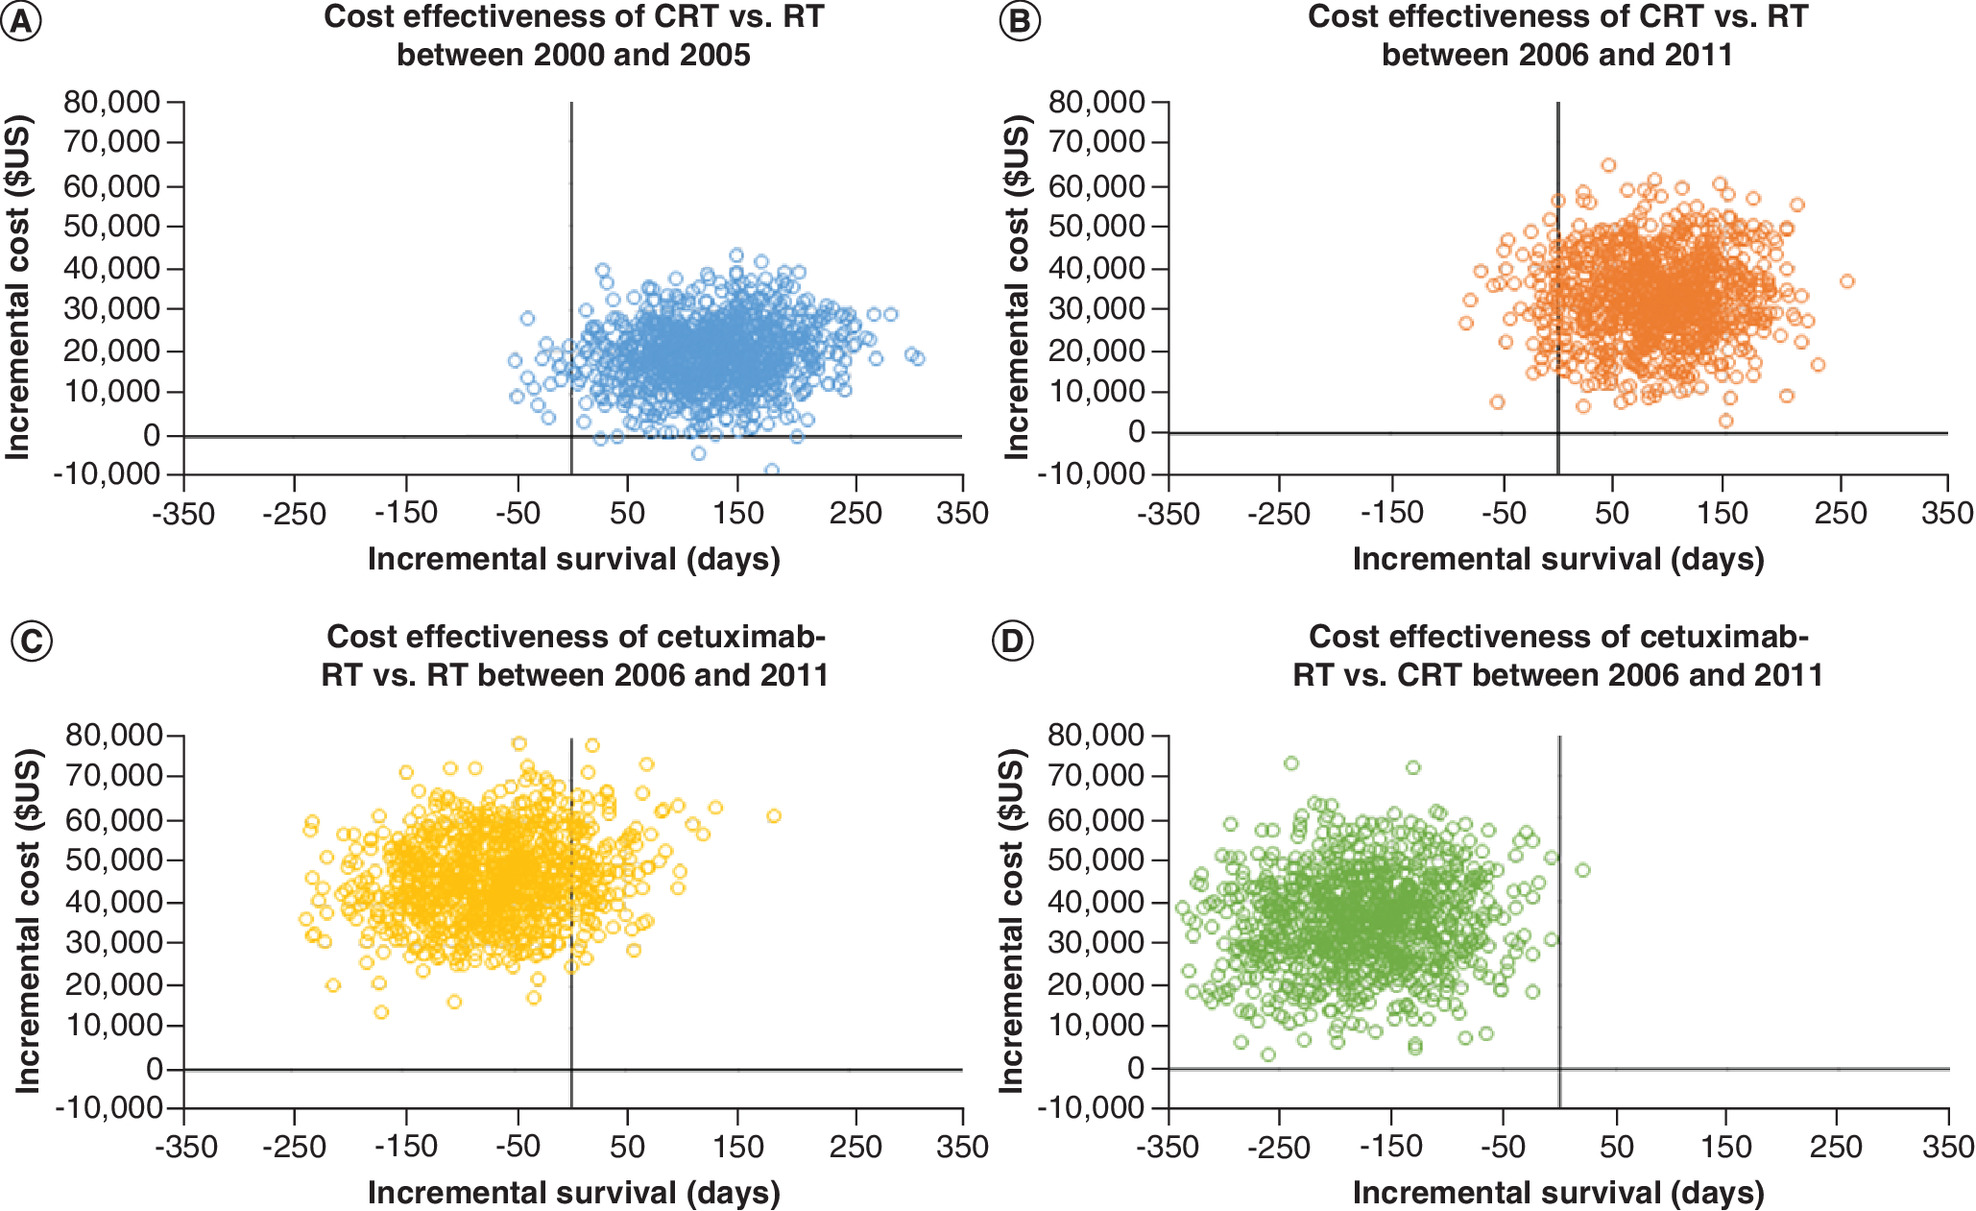
Figure 2. Scatter plot of incremental costs and effects based on 1000 bootstrapped replicates.
(A) CRT versus RT in Cohort I (2000–2005). (B) CRT versus RT in Cohort II (2006–2011). (C) Cetuximab-RT versus RT in Cohort II (2006–2011). (D) CRT versus cetuximab-RT in Cohort II (2006–2011).
Cetuximab-RT: Cetuximab plus radiation; CRT: Cytotoxic chemotherapy plus radiation; RT: Radiation therapy.
Discussion
This study examined the cost–effectiveness of definitive treatments for OPC using 13 years of data for individuals newly diagnosed with nonmetastatic OPC as their first cancer and represented in the linked SEER-Medicare data. Leveraging the long time period, cost–effectiveness estimates were compared over time periods defined by the availability of cetuximab. The comparisons provided novel information regarding the cost–effectiveness of treatments for OPC before and after a significant change in the treatment landscape.
The first comparison of CRT versus RT alone in the earlier time period (2000–2005) showed that the ICER of CRT fell within acceptable ranges of cost–effectiveness, which was anticipated given the expected survival benefit of adding platinum-based chemotherapy [25] at a relatively low cost. The second comparison of CRT versus RT alone in the post-cetuximab era (2006–2011) showed that CRT was dominated by RT because it was associated with higher costs without evidence of improved RMST compared with RT. It was expected that CRT would offer a survival advantage over RT in the post-cetuximab era. However, there are several factors to consider in reviewing these results. While CRT was associated with a numerically improved RMST, the limited follow-up time and the small sample size may have prevented capturing a survival difference. Similar trends were observed in the Kaplan–Meier functions of both groups (Figure 1B) and in the cost–effectiveness scatter plot (Figure 2B). Another factor to consider is the increasing prevalence of HPV among older patients with OPC in more recent time periods. For instance, analysis of HPV prevalence in OPC has shown a significant increase from 64% between 2000 and 2004 to 72% between 2005 and 2009 [26]. HPV-positive OPC has a better prognosis compared with HPV-negative OPC [27], which may be reflected by the observed improvements in survival with both RT and CRT in Cohort II compared with Cohort I (Figure 1A & B). The improved prognosis of HPV-positive OPC and the concerns over morbidity and mortality related to chemotherapy have promoted discussion of treatment de-escalation in this patient group with the goal of reducing toxicity while maintaining tumor control [14]. Several strategies for de-escalating the treatment of HPV-positive OPC have been previously tested and continue to be tested in ongoing trials [28], and this topic may be of special importance in the case of older patients. Additionally, in a meta-analysis that evaluated the benefit of adding chemotherapy to locoregional treatment, the benefit of chemotherapy was found to decrease with older age, potentially due to higher toxicity and reduced adherence to treatment [29]. Nonetheless, future confirmatory analyses are warranted to investigate these findings.
Third, the comparison of cetuximab-RT versus RT alone in Cohort II showed that cetuximab-RT was dominated by RT alone, due to incremental costs of US$46,557 with no incremental survival benefit (the incremental RMST point estimate was negative). These survival results were consistent with an exploratory subgroup analysis from the landmark randomized controlled trial of cetuximab, which suggested no additional benefit of cetuximab among patients 65 years or older [30]. In the fourth comparison, cetuximab-RT demonstrated incremental costs of US$34,422 coupled with inferior survival compared with CRT. The survival results were consistent with two clinical trials and multiple retrospective analyses [11,13,14,31]. These findings suggest that other treatment options are preferred over cetuximab-RT from both survival and cost perspectives.
In HNC, in general, several studies found that cetuximab plus radiation therapy was cost-effective compared with radiation alone [16–18]. These studies utilized modeling approaches (e.g., Markov models or decision trees) and data from the cetuximab landmark clinical trial. However, the current study provides important insights to supplement available evidence because it is based entirely on observed survival and healthcare resource utilization in real-world practice. It also included individuals who are older and with comorbidities and thus, less likely to be enrolled in trials. The current study also provides a novel examination of the value of CRT over time. While the results indicate that CRT may have offered good value compared with RT alone in the pre-cetuximab era, the findings suggest that CRT had similar survival benefits compared with RT alone but at a higher cost.
The study results must be considered in the context of study limitations. First, the observational nature of the study may result in patient selection into treatment groups that may impact the estimated outcomes. Although we aimed to reduce this patient selection bias by matching treatment groups, unobserved characteristics, factors such as performance status and patient preference, could not be controlled for and might have led to residual confounding. Second, in order to reduce the amount of censored cost data, the time horizon of the study was reduced, which may have limited our ability to observe differences between the comparison groups in the long run. Future studies with longer follow-up data are needed to complement the evidence from this study. Third, while the type of cytotoxic chemotherapy (i.e., carboplatin vs low-dose cisplatin vs high-dose cisplatin) may have an impact on patient outcomes, specific types of cytotoxic chemotherapy could not be studied due to sample size limitations. Therefore, as the first step for a cost–effectiveness analysis using real-world data, the family of cytotoxic chemotherapy agents that were utilized in the real-world setting were evaluated as one group. Future studies with larger sample sizes are warranted to evaluate the cost–effectiveness of specific cytotoxic chemotherapy agents. Fourth, this study assessed the value of concomitant RT with cytotoxic chemotherapy or cetuximab as treatment options in nonmetastatic OPC, which included localized (10–16% of the patients in the matched cohorts) and regional tumors (84–90% of the patients in the matched cohorts). In future studies using larger samples, stage-specific subgroup analyses may be warranted to evaluate the cost and survival outcomes of such treatments within each stage group. Fifth, the study reports an additional year of survival as the effectiveness measure and did not adjust the estimates based on quality of life. Additional research on health-related quality of life will be needed to provide reliable inputs for population-based cost–effectiveness studies of OPC treatments based on real-world or modeled data. The study results also may not generalize to individuals diagnosed with OPC who are younger than 66 years old. Lastly, the results may not generalize to the source SEER-Medicare OPC population because all comparisons were conducted using matched samples. While matching is appropriate to maintain the internal validity of the group comparisons, there is potential that the results are not externally valid. Despite these limitations, the results provide important, novel information regarding the value of therapies across a changing treatment landscape for nonmetastatic OPC.
Conclusion
The value of definitive CRT compared with RT has changed over time for older patients diagnosed with OPC. In the earlier time period, the ICER for CRT was US$56,650 per additional year of survival, which may fall within acceptable cost–effectiveness thresholds. In the later time period, CRT was associated with similar survival as RT alone, but at a higher cost. Finally, cetuximab-RT was associated with substantial costs compared with both RT and CRT despite the lack of a survival benefit compared with RT and the inferior survival compared with CRT. Based on these findings, the value of cetuximab for older patients with OPC was not favorable.
•
The landscape of oropharyngeal cancer (OPC) has been changing with an increased incidence among older patients as well as an increased prevalence of human papillomavirus (HPV) infection as an etiologic factor.
•
There is limited evidence related to the cost–effectiveness of nonmetastatic OPC therapies based on real-world data. With the changing OPC landscape, it is important to evaluate the related change in the value of OPC therapies over time.
•
Using data from the linked Surveillance, Epidemiology and End Results-Medicare dataset, an observational retrospective cohort study that included patients aged 66+ years with nonmetastatic OPC was conducted.
•
The way the value of definitive OPC treatments has evolved over time was evaluated from 2000 to 2013 using real-world data from patients diagnosed with OPC between 2000 and 2011.
•
Over a five-year time horizon, the cost and overall survival outcomes for patients who received radiotherapy alone (RT), concurrent chemoradiation (CRT) or concurrent radiation with cetuximab (cetuximab-RT) were compared.
•
Among patients diagnosed between 2000 and 2005, CRT was associated with a survival benefit at a relatively low incremental cost compared with RT alone. The incremental cost–effectiveness ratio (US$56,650 per additional year of survival) fell within acceptable cost–effectiveness limits.
•
Comparing CRT to RT alone among patients diagnosed between 2006 and 2011, CRT was associated with higher costs without evidence of improved survival.
•
Comparing cetuximab-RT to RT alone or CRT among patients diagnosed between 2006 and 2011, cetuximab-RT was associated with similar or inferior survival with substantially higher costs.
Author contributions
H Albarmawi: Conception and design; data analysis and interpretation; drafting the manuscript; final approval of the manuscript; agreement to be accountable for all aspects of the work; KJ Kullen: Conception and design; data interpretation; revising the manuscript critically for intellectual content; final approval of the manuscript; agreement to be accountable for all aspects of the work; R Mehra: Study design; data interpretation; drafting and revising the manuscript; final approval of the manuscript; agreement to be accountable for all aspects of the work; E Onukwugha: Conception and design; data analysis and interpretation; drafting and revising the manuscript; final approval of the manuscript; agreement to be accountable for all aspects of the work; O Goloubeva: Conception and design; data acquisition, analysis and interpretation; drafting and revising the manuscript; final approval of the manuscript; agreement to be accountable for all aspects of the work.
Acknowledgments
This study used the linked SEER-Medicare database. The interpretation and reporting of these data are the sole responsibility of the authors. The authors acknowledge the efforts of the National Cancer Institute; the Office of Research, Development and Information, CMS; Information Management Services (IMS), Inc.; and the Surveillance, Epidemiology and End Results (SEER) Program tumor registries in the creation of the SEER-Medicare database. The collection of cancer incidence data used in this study was supported by the California Department of Public Health as part of the statewide cancer reporting program mandated by California Health and Safety Code Section 103885; the National Cancer Institute's Surveillance, Epidemiology and End Results Program under contract HHSN261201000140C awarded to the Cancer Prevention Institute of California, contract HHSN261201000035C awarded to the University of Southern California and contract HHSN261201000034C awarded to the Public Health Institute; and the Centers for Disease Control and Prevention's National Program of Cancer Registries, under agreement # U58DP003862-01 awarded to the California Department of Public Health. The ideas and opinions expressed herein are those of the author(s) and endorsement by the State of California Department of Public Health, the National Cancer Institute and the Centers for Disease Control and Prevention or their Contractors and Subcontractors is not intended nor should be inferred. The authors acknowledge the efforts of the National Cancer Institute; the Office of Research, Development and Information, CMS; Information Management Services (IMS), Inc.; and the Surveillance, Epidemiology and End Results (SEER) Program tumor registries in the creation of the SEER-Medicare database.
Financial & competing interests disclosure
No external funding was received for the conduct of this study. H Albarmawi reports employment by Genentech, Inc. after the completion of the analysis. E Onukwugha reports research funding from Pfizer, Inc. and BeiGene, Ltd. unrelated to the current work. R Mehra reports research funding from Merck & Co., Inc. and Astra Zeneca Plc. as well as consulting fees (advisory board) from Rakuten unrelated to the current work. The authors have no other relevant affiliations or financial involvement with any organization or entity with a financial interest in or financial conflict with the subject matter or materials discussed in the manuscript apart from those disclosed.
No writing assistance was utilized in the production of this manuscript.
Ethical conduct of research
This study was approved by the Institutional Review Board at the University of Maryland, Baltimore (HP-00067264).
Supplementary Material
File (appendix.docx)
- Download
- 50.44 KB
References
Papers of special note have been highlighted as: • of interest; •• of considerable interest
1.
Tota JE, Best AF, Zumsteg ZS, Gillison ML, Rosenberg PS, Chaturvedi AK. Evolution of the oropharynx cancer epidemic in the United States: moderation of increasing incidence in younger individuals and shift in the burden to older individuals. J. Clin. Oncol. 37(18), 1538–1546 (2019).
2.
Zumsteg ZS, Cook-Wiens G, Yoshida E et al. Incidence of oropharyngeal cancer among elderly patients in the United States. JAMA Oncol. 2(12), 1617–1623 (2016).
• This study highlights the increased incidence of oropharyngeal cancer among older patients in the USA, which could be attributed to human papillomavirus infection.
3.
Chaturvedi AK, Anderson WF, Lortet-Tieulent J et al. Worldwide trends in incidence rates for oral cavity and oropharyngeal cancers. J. Clin. Oncol. 31(36), 4550–4559 (2013).
4.
SEER*Explorer: An interactive website for SEER cancer statistics [Internet]. Surveillance Research Program, National Cancer Institute. (Accessed 27 September 2021). https://seer.cancer.gov/explorer/
5.
Quon H, O'malley B Jr, Weinstein G. Transoral robotic surgery (TORS) for the head and neck: current and future indications. Int. J. Head Neck Surg. 1(3), 133–140 (2010).
6.
Calais G, Alfonsi M, Bardet E et al. Randomized trial of radiation therapy versus concomitant chemotherapy and radiation therapy for advanced-stage oropharynx carcinoma. J Natl Cancer Inst. 91(24), 2081–2086 (1999).
7.
Adelstein DJ, Li Y, Adams GL et al. An intergroup Phase III comparison of standard radiation therapy and two schedules of concurrent chemoradiotherapy in patients with unresectable squamous cell head and neck cancer. J. Clin. Oncol. 21(1), 92–98 (2003).
8.
Cooper JS, Pajak TF, Forastiere AA et al. Postoperative concurrent radiotherapy and chemotherapy for high-risk squamous-cell carcinoma of the head and neck. N. Engl. J. Med. 350(19), 1937–1944 (2004).
9.
Bernier J, Domenge C, Ozsahin M et al. Postoperative irradiation with or without concomitant chemotherapy for locally advanced head and neck cancer. N. Engl. J. Med. 350(19), 1945–1952 (2004).
10.
Bonner JA, Harari PM, Giralt J et al. Radiotherapy plus cetuximab for squamous-cell carcinoma of the head and neck. N. Engl. J. Med. 354(6), 567–578 (2006).
11.
Koutcher L, Sherman E, Fury M et al. Concurrent cisplatin and radiation versus cetuximab and radiation for locally advanced head-and-neck cancer. Int. J. Radiat. Oncol. Bio. Phys. 81(4), 915–922 (2011).
•• In this retrospective cohort study of patients with locally advanced head and neck cancer, patients who received concurrent cisplatin and radiation had better outcomes compared with patients who received cetuximab plus radiation.
12.
Magrini SM, Buglione M, Corvò R et al. Cetuximab and radiotherapy versus cisplatin and radiotherapy for locally advanced head and neck cancer: a randomized Phase II trial. J. Clin. Oncol. 34(5), 427–435 (2016).
13.
Gillison ML, Trotti AM, Harris J et al. Radiotherapy plus cetuximab or cisplatin in human papillomavirus-positive oropharyngeal cancer (NRG Oncology RTOG 1016): a randomised, multicentre, non-inferiority trial. Lancet 393(10166), 40–50 (2019).
•• In this clinical trial among patients with human papillomavirus-associated oropharyngeal cancer, cisplatin plus radiation outperformed cetuximab plus radiation.
14.
Mehanna H, Robinson M, Hartley A et al. Radiotherapy plus cisplatin or cetuximab in low-risk human papillomavirus-positive oropharyngeal cancer (De-ESCALaTE HPV): an open-label randomised controlled phase 3 trial. Lancet 393(10166), 51–60 (2019).
•• In this clinical trial among patients with low-risk human papillomavirus-associated oropharyngeal cancer, cisplatin plus radiation and cetuximab plus radiation had similar toxicity outcomes, but cisplatin outperformed cetuximab in tumor control.
15.
Saraswathula A, Chen MM, Colevas AD, Divi V. Assessing care value for older patients receiving radiotherapy with or without cisplatin or cetuximab for locoregionally advanced head and neck cancer. JAMA Otolaryngol. Head Neck Surg. 145(12), 1160–1167 (2019).
• This study showed that treatment with cetuximab was associated with higher costs compared to treatment with radiation therapy or cytotoxic chemotherapy.
16.
Van Der Linden N, Van Gils CW, Pescott CP, Buter J, Vergeer MR, Groot CA. Real-world cost–effectiveness of cetuximab in locally advanced squamous cell carcinoma of the head and neck. Eur. Arch. Otorhinolaryngol. 272(8), 2007–2016 (2015).
17.
Brown B, Diamantopoulos A, Bernier J et al. An economic evaluation of cetuximab combined with radiotherapy for patients with locally advanced head and neck cancer in Belgium, France, Italy, Switzerland, and the United Kingdom. Value Health 11(5), 791–799 (2008).
18.
Chan AL, Leung HW, Huang S-F. Cost effectiveness of cetuximab concurrent with radiotherapy for patients with locally advanced head and neck cancer in Taiwan. Clin. Drug Investig. 31(10), 717–726 (2011).
19.
Division of Cancer Control & Population Sciences, National Cancer Institute. SEER-Medicare: brief description of the SEER-Medicare Database. (May 16, 2019). https://healthcaredelivery.cancer.gov/seermedicare/overview/
20.
Parsons L. Reducing bias in a propensity score matched-pair sample using greedy matching techniques. In: Proceedings of the Twenty-Sixth Annual SAS Users Group International Conference.214–226 (2001).
21.
Stuart EA. Matching methods for causal inference: a review and a look forward. Stat. Sci. 25(1), 1–21 (2010).
22.
Uno H, Claggett B, Tian L et al. Moving beyond the hazard ratio in quantifying the between-group difference in survival analysis. J. Clin. Oncol. 32(22), 2380–2385 (2014).
23.
Bang H, Tsiatis A. Estimating medical costs with censored data. Biometrika 87(2), 329–343 (2000).
24.
Wijeysundera HC, Wang X, Tomlinson G, Ko DT, Krahn MD. Techniques for estimating health care costs with censored data: an overview for the health services researcher. Clinicoecon. Outcomes Res. 4, 145–155 (2012).
25.
Blanchard P, Baujat B, Holostenco V et al. Meta-analysis of chemotherapy in head and neck cancer (MACH-NC): a comprehensive analysis by tumour site. Radiother. Oncol. 100(1), 33–40 (2011).
26.
Mehanna H, Beech T, Nicholson T et al. Prevalence of human papillomavirus in oropharyngeal and nonoropharyngeal head and neck cancer—systematic review and meta-analysis of trends by time and region. Head Neck 35(5), 747–755 (2013).
• This study highlights the increase in the prevalence of human papillomavirus among patients with oropharyngeal cancer from 2000 to 2009.
27.
Ang KK, Harris J, Wheeler R et al. Human papillomavirus and survival of patients with oropharyngeal cancer. N. Engl. J. Med. 363(1), 24–35 (2010).
•• This study highlights the improved prognosis of human papillomavirus-positive oropharyngeal cancer compared to human papillomavirus-negative oropharyngeal cancer.
28.
Rosenberg AJ, Vokes EE. Optimizing treatment de-escalation in head and neck cancer: current and future perspectives. Oncologist 26(1), 40–48 (2021).
• This study summarizes trials aimed at de-escalating the treatment of human papillomavirus-positive oropharyngeal cancer given the concerns over morbidity and mortality related to chemotherapy as well as the improved prognosis of human papillomavirus-positive oropharyngeal cancer.
29.
Pignon J, Bourhis J, Domenge CO, Designé LL, Group M-NC. Chemotherapy added to locoregional treatment for head and neck squamous-cell carcinoma: three meta-analyses of updated individual data. Lancet 355(9208), 949–955 (2000).
30.
Bonner JA, Harari PM, Giralt J et al. Radiotherapy plus cetuximab for locoregionally advanced head and neck cancer: 5-year survival data from a phase 3 randomised trial, and relation between cetuximab-induced rash and survival. Lancet Oncol. 11(1), 21–28 (2010).
31.
Xiang M, Holsinger FC, Colevas AD, Chen MM, Le Q-T, Beadle BM. Survival of patients with head and neck cancer treated with definitive radiotherapy and concurrent cisplatin or concurrent cetuximab: A Surveillance, Epidemiology, and End Results-Medicare analysis. Cancer 124(23), 4486–4494 (2018).
Information & Authors
Information
Published In
Pages: 595 - 607
PubMed: 35543585
Copyright
© 2022 Future Medicine Ltd.
History
Received: 31 August 2021
Accepted: 12 April 2022
Published online: 11 May 2022
Keywords:
Topics
Authors
Metrics & Citations
Metrics
Article Usage
Article usage data only available from February 2023. Historical article usage data, showing the number of article downloads, is available upon request.
Citations
How to Cite
Cost–effectiveness of concurrent radiation with cetuximab or chemotherapy in older patients with oropharyngeal cancer. (2022) Journal of Comparative Effectiveness Research. DOI: 10.2217/cer-2021-0209
Export citation
Select the citation format you wish to export for this article or chapter.
Citing Literature
- Sandeep Muzumder, Data-Driven Realism: Why Every Oncologist Must Analyze and Publish Their Clinical Outcomes, Indian Journal of Medical and Paediatric Oncology, 10.1055/s-0045-1812850, (2025).
- Szu-Han Hu, Ming-Yii Huang, Chung-Yu Chen, Hui-Min Hsieh, Treatment patterns of targeted and nontargeted therapies and survival effects in patients with locally advanced head and neck cancer in Taiwan, BMC Cancer, 10.1186/s12885-023-11061-4, 23, 1, (2023).