Evaluation of emerging NASH therapies: the impact of treatment efficacy profiles on long-term health outcomes
Publication: Journal of Comparative Effectiveness Research
Abstract
Aim: Evaluations of nonalcoholic steatohepatitis (NASH) treatments require predicting lifetime outcomes from short-term clinical trials. Materials & methods: A Markov model with NASH fibrosis stages F0–F3, NASH resolution, compensated cirrhosis (F4/CC), and liver-related complication (LRC) states was developed using literature-based standard of care (SoC) data. Hypothetical efficacy profiles were defined affecting resolution (100%-increase), fibrosis improvement (100% increase), or fibrosis worsening (50% decrease). Results: For the SoC, 10-year LRC rates increased with baseline fibrosis stage (F1: 3.0%; F2: 9.8%; F3: 27.2%; F4/CC: 64.9%). The fibrosis worsening profile reduced predicted 10-year LRC rates (F1: 1.9%; F2: 6.5%; F3: 19.1%; F4/CC: 55.0%) more than the resolution and fibrosis improvement profiles (F1: 2.6%/2.6%; F2: 8.5%/8.3%; F3: 23.3%/23.0%; F4/CC: NA/59.0%). Scenario analyses considered alternative SoC progression, treatment efficacy and treatment-stopping rules. Conclusion: Potential NASH efficacy profiles have differing impacts on predicted long-term outcomes, providing insights for future stakeholders.
Plain language summary
Many new treatments are being investigated for nonalcoholic steatohepatitis (NASH), a progressive and life-threatening disease often resulting in liver fibrosis (scarring) and advanced liver disease. The clinical value of these treatments and whether they are good value for money will depend on their ability to reduce the risk of advanced liver disease and subsequent liver transplantation. We developed a disease progression model which tracks survival and quality of life for two identical groups of NASH patients over their lifetimes. One group received a new hypothetical treatment for NASH while the other received current standard care. We used the model to estimate the potential health benefits of different hypothetical treatments for NASH. Our results suggest that treatments slowing fibrosis worsening may lead to greater long-term health benefits than treatments that improve NASH or improve existing fibrosis. These findings may provide insights to researchers involved in the development of new treatments for NASH.
Nonalcoholic steatohepatitis (NASH), a progressive form of nonalcoholic fatty liver disease (NAFLD), affects 2–3% of the United States (US) population [1] and is a leading cause of liver transplantation (LT) [2,3]. NAFLD is defined as the accumulation of excess hepatic fat (steatosis) not attributable to alcohol consumption, while NASH is subsequently characterized by inflammation and hepatocyte injury (ballooning) and can lead to advanced liver fibrosis [4]. While NASH may resolve on its own for some patients [5] (i.e., a decrease in steatosis, inflammation and ballooning), fibrosis associated with NASH can progress to cirrhosis of the liver, ultimately resulting in clinical decompensation, hepatocellular carcinoma (HCC) or liver failure [4]. The development and rate of progression of NASH is highly heterogeneous among patients [6], and many patients with NASH will not progress to cirrhosis [7]. Those patients that do progress to cirrhosis experience an increase in mortality associated with liver-related complications (LRCs), as well as comorbidities such as diabetes, obesity and cardiovascular disease [1,8].
Current recommendations for the management of patients with NASH focus on lifestyle modification, including long-term changes in diet, increasing physical exercise, and encouraging weight loss [9]. The goal of NASH disease management is deceleration of the progression of liver disease to cirrhosis [10] and possibly reversal of the hepatic damage [11]. Although no pharmacologic therapies are currently available for NASH, there are several treatments in late-stage development. A selection of these emerging treatments is shown in Table 1, each of which targets some combination of increasing the probability of NASH resolution, increasing the probability of fibrosis improvement, or decreasing the probability of fibrosis worsening [4]. Both the US Food and Drug Administration (FDA) guidance [12] and the European Medicines Agency (EMA) draft guidance [13] for drug development in NASH state that these three efficacy endpoints are reasonable surrogates for long-term liver-related outcomes and survival outcomes.
| Clinical trial outcome† | Targeted populations | Investigated treatment (trial) | Ref. |
|---|---|---|---|
| Improvement in fibrosis by at least one stage without worsening NASH | Histological evidence of NASH and histopathological evidence of stage 2 or 3 liver fibrosis | Cenicriviroc (AURORA) | [28] |
| Liver biopsy consistent with NASH and bridging (F3 fibrosis) | Selonsertib (STELLAR 3) | [29] | |
| Confirmed diagnosis of NASH and a fibrosis score of 4 | Obeticholic acid (REVERSE) Selonsertib (STELLAR 4) | [30,31] | |
| Achieving resolution of NASH without worsening of fibrosis | Histological confirmation of steatohepatitis, fibrosis stage of 1 or greater and below 4 | Elafibranor (RESOLVE-IT) | [32] |
| Histologic evidence of NASH and evidence of fibrosis stage 2 or stage 3 | Obeticholic acid (REGENERATE) | [33] |
†
Clinical trial outcomes were summarized in a recent review of NASH therapeutic strategies [4].
NASH: Nonalcoholic steatohepatitis.
Because of the number and variety of emerging therapies for NASH, economic models will be needed to assist payers, health technology assessment bodies and other decision makers with evaluating the value for money provided by these treatments. Existing models for NASH provide a framework for evaluating single interventions but were not designed to consider either the heterogeneity of fibrosis severity in NASH patient populations or the variety of treatment efficacy profiles suggested by clinical trial endpoints. A modeling approach that can account for heterogeneous populations and different treatment efficacy profiles is critical to accurately predict the long-term outcomes that are expected to be drivers of clinical and economic value. The objective of this study was to develop a model for NASH that can serve as a framework for future economic evaluations of products with demonstrated effects on NASH resolution, fibrosis improvement and/or disease progression.
Materials & methods
Review of existing models
To inform the design of the model, we conducted a targeted review of published economic models in NASH. Six published models [14–19] and one systematic literature review of existing models [6] were identified. Each of the six NASH modeling studies identified in the literature used a Markov-based approach to capture long-term NASH progression. Several of these models share a similar structure in which fibrosis stages were grouped together, as well as a similar approach to modeling postcirrhotic progression to decompensated cirrhosis (DCC), HCC, and subsequent liver failure. Approaches to NASH resolution varied greatly between studies, if included at all. This variability in modeling approaches, especially for NASH resolution and precirrhotic fibrosis stages, was similarly highlighted by Johansen et al. [6], who further emphasized that economic models for NASH often lack NASH-specific data and rely on data from other liver diseases. Differences among these models may be due to the objective of each model, and the structural assumptions may have been dictated by the interventions and populations being studied.
Mahady et al. [14] compared lifestyle modification, pioglitazone, and vitamin E treatment in patients with NASH in Australia from a third-party payer perspective; the model structure in their study was limited by the combination of all noncirrhotic health states into a single-model health state and the omission of the possibility of NASH resolution. Klebanoff et al. [15] investigated the cost–effectiveness of bariatric surgery compared with lifestyle intervention in patients with NASH in the US from a societal perspective and was one of the few studies to include separate health states for different stages of fibrosis. However, NASH resolution was included as a single health state without distinguishing patients' fibrosis levels after resolution. Both Corey et al. [16] and Zhang et al. [17] estimated the cost–effectiveness of NASH screening strategies from a third-party payer perspective for patients in the US and Canada, respectively; the model structures for these studies did not include NASH resolution health states. In 2016, the Institute for Clinical and Economic Review (ICER) [18] conducted a preliminary evaluation of obeticholic acid for the treatment of NASH in US patients from a health system perspective; this model structure included separate fibrosis states for both NASH and NASH resolution and allowed fibrosis improvement once NASH resolution was achieved. In the final ICER evaluation of obeticholic acid conducted in 2020, the clinical efficacy and safety profile of obeticholic acid led to the omission of NASH resolution health states and the inclusion of cardiovascular events [20].
Although these models addressed the effectiveness of NASH interventions, including lifestyle modification, using a variety of approaches, none of these models were sufficiently flexible to evaluate the variety of target populations and treatment efficacy profiles for emerging NASH therapies. The evaluation of these emerging drugs requires a comprehensive and flexible modeling approach that can account for the differences in population and treatment efficacy profiles among these therapies.
Model structure
The target populations and anticipated efficacy profiles for emerging NASH therapies require a model structure that considers transitions between separate health states for individual fibrosis stages as well as transitions between NASH and NASH resolution. Consistent with the identified published models, a Markov modeling approach was utilized that captured four precirrhotic fibrosis health states (no fibrosis [F0], mild fibrosis [F1], moderate fibrosis [F2], and significant fibrosis [F3]), compensated cirrhosis (F4/CC), DCC, HCC, liver transplant (LT) (which includes the first-year post-transplantation), post-LT (1-year post-transplantation and beyond), and death (liver-related and general population mortality) (Figure 1). This separation of fibrosis into five separate health states (F0-F4/CC) was defined by the 5-point METAVIR scoring system.

Figure 1. Model structure.
The cycle length for transitions between health states is 1 year. Straight arrows designate possible patient transition pathways between health states, while curved arrows indicate that patients may remain within that health state.
aGeneral mortality, occurs from all states and varies by age.
bLiver-related mortality occurs from F4/CC, DCC, HCC, LT and post-LT. Liver-related mortality varies between different health states.
DCC: Decompensated cirrhosis; F0: No fibrosis; F1: Mild fibrosis; F2: Moderate fibrosis; F3: Significant fibrosis; F4/CC: Compensated cirrhosis; HCC: Hepatocellular carcinoma; LT: Liver transplant; NASH: Nonalcoholic steatohepatitis.
Additional health states were included to distinguish between NASH and NASH resolution for patients in the precirrhotic fibrosis stages (F0–F3). In alignment with clinical trial inclusion criteria (Table 1), NASH is defined as having a NAFLD Activity Score of 4 or more, while NASH resolution is defined as having a NAFLD Activity Score of less than 4. The disaggregation of the precirrhotic health states by fibrosis stage and NASH status is important for multiple reasons. First, this allows the model to reflect the specific fibrosis stages targeted by emerging NASH therapies [4]. Additionally, this allows the model to capture any continued fibrosis improvement occurring after NASH resolution [18], which is important for tracking patient outcomes in the event NASH redevelops. Finally, the disaggregated precirrhosis health states allow the model to explore the impact of diverse treatment-stopping rules, such as discontinuing therapy after NASH resolution or fibrosis worsening. This is important because the duration of treatment is influential in cost–effectiveness analyses and because it would be inappropriate to keep patients on treatment if they are no longer receiving benefit.
The model uses a cycle length of 1 year (i.e., the time period during which patients transition between model health states), in alignment with previous modeling studies [14–17]. In alignment with estimates reported in meta-analyses of fibrosis progression literature, the model assumes that patients transition at most one fibrosis stage per year [21]. Because the available data on fibrosis improvement and NASH resolution do not rule out the possibility of these events occurring simultaneously [21], the model allows for simultaneous fibrosis improvement and NASH resolution within a single-model cycle (Figure 1).
Because the model is intended to follow patients with NASH for their remaining lifetimes, long-term LRCs are included in the model using postcirrhosis health states similar to those used in previously published NASH models [14–18]. Patients in F4/CC can improve back to F3, stay in F4/CC, or progress to DCC or HCC. The model does not allow improvement from DCC back to F4/CC; patients can either remain stable, worsen to HCC, or transition to LT. Patients in HCC either remain in HCC or progress to LT. Patients remain in the LT health state for a single-model cycle and then transition to the post-LT health state. The model also includes death due to liver disease (from the F4/CC, DCC, HCC, LT, or post-LT health states) and due to other causes (from all health states, based on general population mortality rates).
Model settings
Because the target populations for NASH therapies in development span a range of disease severities, the model was designed to consider baseline populations consisting of adults (aged 18 years or older) with NASH ranging from no fibrosis (F0) to compensated cirrhosis (F4/CC). Population demographics (mean age: 52.4 years; sex: 60% male) were aligned with the baseline characteristics of the GOLDEN-505 trial population [5]. As differences in demographic characteristics across fibrosis score groups were not reported in the GOLDEN-505 trial, these demographic characteristics were assumed to apply across all potential baseline fibrosis scores.
The model was designed to consider up to a lifetime horizon, since new treatments have the potential to impact LRCs, costs, and outcomes for the remainder of patients' lifetimes, as well as to be in alignment with established guidelines for economic evaluations [22,23]. While our analysis did not include costs and therefore was not designed to reflect a particular cost perspective (e.g., third-party payer, societal) or country (only the general mortality data were US specific), the modeling approach was aligned with global health technology assessment requirements for cost–effectiveness analysis. The model was programmed in Microsoft Excel (Microsoft Corporation, WA, USA) in accordance with good practice guidelines for state-transition models [24].
Standard of care transition probabilities
The current standard of care (SoC) for patients with NASH across fibrosis levels focuses on lifestyle modification, including dietary changes and exercise recommendations [9]. All patients in the model were assumed to continue receiving the SoC whether or not they were receiving active pharmacologic treatment for NASH. The transition probabilities for disease progression in NASH patients receiving the SoC were characterized using estimates derived from literature reviews, clinical studies, and existing published models.
The specific sources considered for SoC progression data included a recent meta-analysis of fibrosis progression studies [21], the NASH cost–effectiveness models described previously [14–17], and additional clinical and burden-of-illness studies [5,25,26]. All progression data selected from these studies were converted to annual transition probabilities; all patients not transitioning to another health state in each cycle were assigned to remain in their current health state. Probabilities for fibrosis worsening (i.e., transitioning to a more advanced fibrosis stage) and fibrosis improvement (i.e., transitioning to a less advanced fibrosis stage) in NASH were obtained from the review presented by Singh et al. [21], and a weighted average of the transition probabilities from individual studies was calculated for use in the model. The probability of NASH resolution was obtained from the GOLDEN-505 trial [5], and an annual probability of NASH redevelopment of 10.0% was assumed based on consultations with clinical experts due to the lack of data published in the literature. The resulting annual transition probabilities for the precirrhotic health states are shown in Table 2.
| Health-state transitions | Probability | Study | Ref. |
|---|---|---|---|
| NASH resolution transitions | |||
| NASH F0 to NASH resolution F0 | 12.8% | Ratziu et al. | [5] |
| NASH F1 to NASH resolution F1 | 9.6% | ||
| NASH F2 to NASH resolution F2 | 9.6% | ||
| NASH F3 to NASH resolution F3 | 9.6% | ||
| NASH fibrosis improvement transitions | |||
|---|---|---|---|
| NASH F1 to NASH F0 | 13.3% | Singh et al. | [21] |
| NASH F2 to NASH F1 | 13.3% | ||
| NASH F3 to NASH F2 | 13.3% | ||
| NASH fibrosis worsening transitions | |||
|---|---|---|---|
| NASH F0 to NASH F1 | 19.3% | Singh et al. | [21] |
| NASH F1 to NASH F2 | 19.3% | ||
| NASH F2 to NASH F3 | 19.3% | ||
| NASH F3 to NASH F4/CC | 19.3% | ||
| NASH resolution fibrosis improvement transitions | |||
|---|---|---|---|
| NASH resolution F1 to NASH resolution F0 | 16.5% | Singh et al. | [21] |
| NASH resolution F2 to NASH resolution F1 | 16.5% | ||
| NASH resolution F3 to NASH resolution F2 | 16.5% | ||
| NASH redevelopment transitions | |||
|---|---|---|---|
| NASH resolution to NASH (F0, F1, F2, and F3) | 10.0% | Assumption | |
| Simultaneous NASH fibrosis improvement and NASH resolution | |||
|---|---|---|---|
| NASH F1 to NASH resolution F0 | 3.2% | Assumption applied to Singh et al. and Ratziu et al. | [5,21] |
| NASH F2 to NASH resolution F1 | 3.2% | ||
| NASH F3 to NASH resolution F2 | 3.2% | ||
| Postcirrhosis | |||
|---|---|---|---|
| NASH F4/CC to NASH F3 | 5.9% | Younossi et al. | [25] |
| NASH F4/CC to DCC | 7.9% | Harrison et al. | [26] |
| NASH F4/CC to HCC | 2.6% | Younossi et al. | [25] |
| DCC to HCC | 2.6% | ||
| DCC to LT | 3.1% | Younossi et al. | [25] |
| HCC to LT | 3.1% | ||
| Mortality (incremental risk) | |||
|---|---|---|---|
| NASH F4/CC to death | 3.4% | Zhang et al. | [17] |
| DCC to death | 16.0% | ||
| HCC to death | 52.0% | ||
| LT to death | 9.4% | Klebanoff et al. | [15] |
| Post-LT to death | 10.1% | ||
DCC: Decompensated cirrhosis; F0: No fibrosis; F1: Mild fibrosis; F2: Moderate fibrosis; F3: Significant fibrosis; F4/CC: Compensated cirrhosis; HCC: Hepatocellular carcinoma; LT: Liver transplant; NASH: Nonalcoholic steatohepatitis.
Estimates of the overlap between the identified improvement and resolution probabilities were not identified in the literature. On the basis of input from clinical advisors during model development, we assumed that 25% of NASH resolution is accompanied by a one-stage improvement in fibrosis, as shown in Table 2. With this approach, the sum of the resulting fibrosis improvement probabilities (with and without simultaneous NASH resolution) continued to match the estimates derived from Singh et al. [21]; likewise, the resulting sum of the NASH resolution probabilities (with and without simultaneous fibrosis improvement at each fibrosis level) matched the estimates derived from Ratziu et al. [5]. Note that simultaneous NASH resolution and fibrosis improvement does not apply in the F0 health state.
Mortality
The probability of death for the general population by age and sex was obtained from the National Vital Statistics Report [27]. Liver-related mortality risks for patients in the F4/CC, DCC, HCC and LT health states (Table 2) were obtained from Zhang et al. [17] and Klebanoff et al. [15]. In alignment with previous NASH modeling studies, liver-related mortality risks were applied additively to general population mortality without adjustment for the potential contribution of liver mortality to the general mortality estimates. The impact of this assumption on model outcomes was expected to be minimal because liver-related mortality comprises a negligible proportion of all-cause mortality. A separate multiplicative factor was considered for the general mortality probabilities to adjust for comorbidities that are common in patients with NASH (e.g., obesity, diabetes); however, this factor was not used in the base-case analysis owing to the validation of survival outcomes predicted by the model.
Treatment efficacy profiles
Our model incorporated three hypothetical efficacy profiles for NASH therapies: a “resolution” profile where therapy increases the annual probability of NASH resolution, an “improvement” profile where therapy increases the annual probability of fibrosis improvement, and a “worsening” profile where therapy decreases the annual probability of fibrosis worsening. Rather than modeling the specific clinical trial endpoints for particular NASH therapies, we designed these hypothetical efficacy profiles in alignment with the range of endpoints for therapies currently in development (Table 1). While some trial outcomes rely on combinations of these endpoints (e.g., resolution of NASH without fibrosis worsening), our analysis considers each efficacy profile separately to provide insights into the differences between the profiles. However, our approach does allow for individual efficacy profiles to have indirect effects on the other outcomes (e.g., increasing the probability of NASH resolution would indirectly reduce the probability of fibrosis worsening).
The efficacy parameters for the three profiles were defined by using risk ratios (RRs), with the default RRs assumed to be 2.0 for the resolution and improvement profiles (i.e., 100% increase in annual probabilities) and 0.5 for the worsening profile (i.e., 50% decrease in annual probabilities). These RRs were applied directly to the appropriate SoC transition probabilities according to the design of the efficacy profiles (e.g., the RR for NASH resolution was applied to the annual probability of NASH resolution) and were assumed to remain constant for as long as patients remained on treatment. Each treatment efficacy profile was considered separately for each of four baseline fibrosis stages (i.e., F1, F2, F3 and F4/CC) in comparison with SoC.
In the base-case analyses, clinical treatment-stopping rules were enforced to limit treatment to the baseline-indicated health states (i.e., patients immediately stopped treatment if they left their baseline health state); broader clinical stopping rules were considered in scenario analyses. Note that in the model, once patients discontinue treatment they cannot restart, even if they return to the baseline health state (e.g., a one-step improvement in fibrosis followed by a one-step worsening of fibrosis). In the base case, an annual treatment discontinuation of 10% was assumed for all treatment efficacy profiles to reflect discontinuation due to potential adverse events or lack of compliance.
Outcomes
To compare the clinical benefits to patients for these three treatment efficacy profiles across each of the four baseline fibrosis stages, we calculated 10-year LRC rates, 10-year liver-related deaths and the predicted life-years (LYs) over a lifetime horizon. The treatment exposure (i.e., time on treatment) was also estimated to provide insight into the treatment burden associated with these clinical benefits. Both the FDA [12] and EMA [13] acknowledge reduction in LRC rates as the preferred long-term outcome for NASH treatment, and gains in LYs reflect the potential improvements in survival associated with avoiding LRCs. Treatment exposure (which also includes monitoring burden) may be used as a proxy for patient burden of care, costs, and treatment- or diagnostic-related risks.
The 10-year LRC rate outcome was calculated as the percentage of the patient cohort that advanced from F4/CC to DCC or HCC or those who died due to liver-specific mortality. Treatment exposure was calculated as a function of the stopping rules. Both long-term LRC rates and LY outcomes were validated against the literature; validation results are described in detail in the Supplementary Material.
Results
Base-case analysis
Base-case analyses for hypothetical patient cohorts starting in each of the four different baseline fibrosis stages (F1, F2, F3 and F4/CC) were conducted for each of the three treatment efficacy profiles (resolution, improvement and worsening) in comparison with the SoC (Table 3 & Figure 2). As the F4/CC health state does not have a corresponding NASH resolution state, the resolution treatment efficacy was not applicable for this baseline fibrosis stage. All treatment efficacy profiles predicted lower 10-year LRC rates and fewer liver-related deaths versus SoC, as well as a higher number of LYs. It should be noted that due to the strict stopping rules limiting treatment to the baseline fibrosis stage, treatment exposure did not vary significantly between the different treatment efficacy profiles (results not shown).
| Treatment efficacy profile† | Baseline fibrosis stage | |||
|---|---|---|---|---|
| F1 | F2 | F3 | F4/CC | |
| Standard of care | ||||
| 10-year liver-related complication rates | 3.0% | 9.8% | 27.2% | 64.9% |
| 10-year liver-related deaths | 1.6% | 5.8% | 18.3% | 49.1% |
| Lifetime LYs | 27.5 | 25.5 | 21.2 | 12.5 |
| Resolution profile | ||||
| 10-year liver-related complication rates | 2.6% (-0.4%) | 8.5% (-1.3%) | 23.3% (-3.9%) | NA |
| 10-year liver-related deaths | 1.4% (-0.2%) | 5.1% (-0.7%) | 15.8% (-2.5%) | |
| Lifetime LYs | 27.7 (0.2) | 25.9 (0.5) | 22.2 (1.0) | |
| Improvement profile | ||||
| 10-year liver-related complication rates | 2.6% (-0.4%) | 8.3% (-1.5%) | 23.0% (-4.3%) | 59.0% (-5.9%) |
| 10-year liver-related deaths | 1.4% (-0.2%) | 5.0% (-0.8%) | 15.5% (-2.8%) | 44.9% (-4.2%) |
| Lifetime LYs | 27.7 (0.2) | 26.0 (0.5) | 22.3 (1.1) | 13.8 (1.4) |
| Worsening profile | ||||
| 10-year liver-related complication rates | 1.9% (-1.1%) | 6.5% (-3.3%) | 19.1% (-8.1%) | 55.0% (-9.9%) |
| 10-year liver-related deaths | 1.0% (-0.6%) | 3.7% (-2.1%) | 12.4% (-6.0%) | 41.4% (-7.7%) |
| Lifetime LYs | 27.9 (0.4) | 26.3 (0.9) | 23.0 (1.8) | 14.1 (1.6) |
†
The results reported for each treatment efficacy profile are accompanied by the parenthetical difference between the standard of care and the treatment efficacy profile for each result (in absolute percentage points for the 10-year liver-related complications and deaths, and in life-years for lifetime life-years).
F1: Mild fibrosis; F2: Moderate fibrosis; F3: Significant fibrosis; F4/CC: Compensated cirrhosis; LY: Life year; NA: Not applicable.
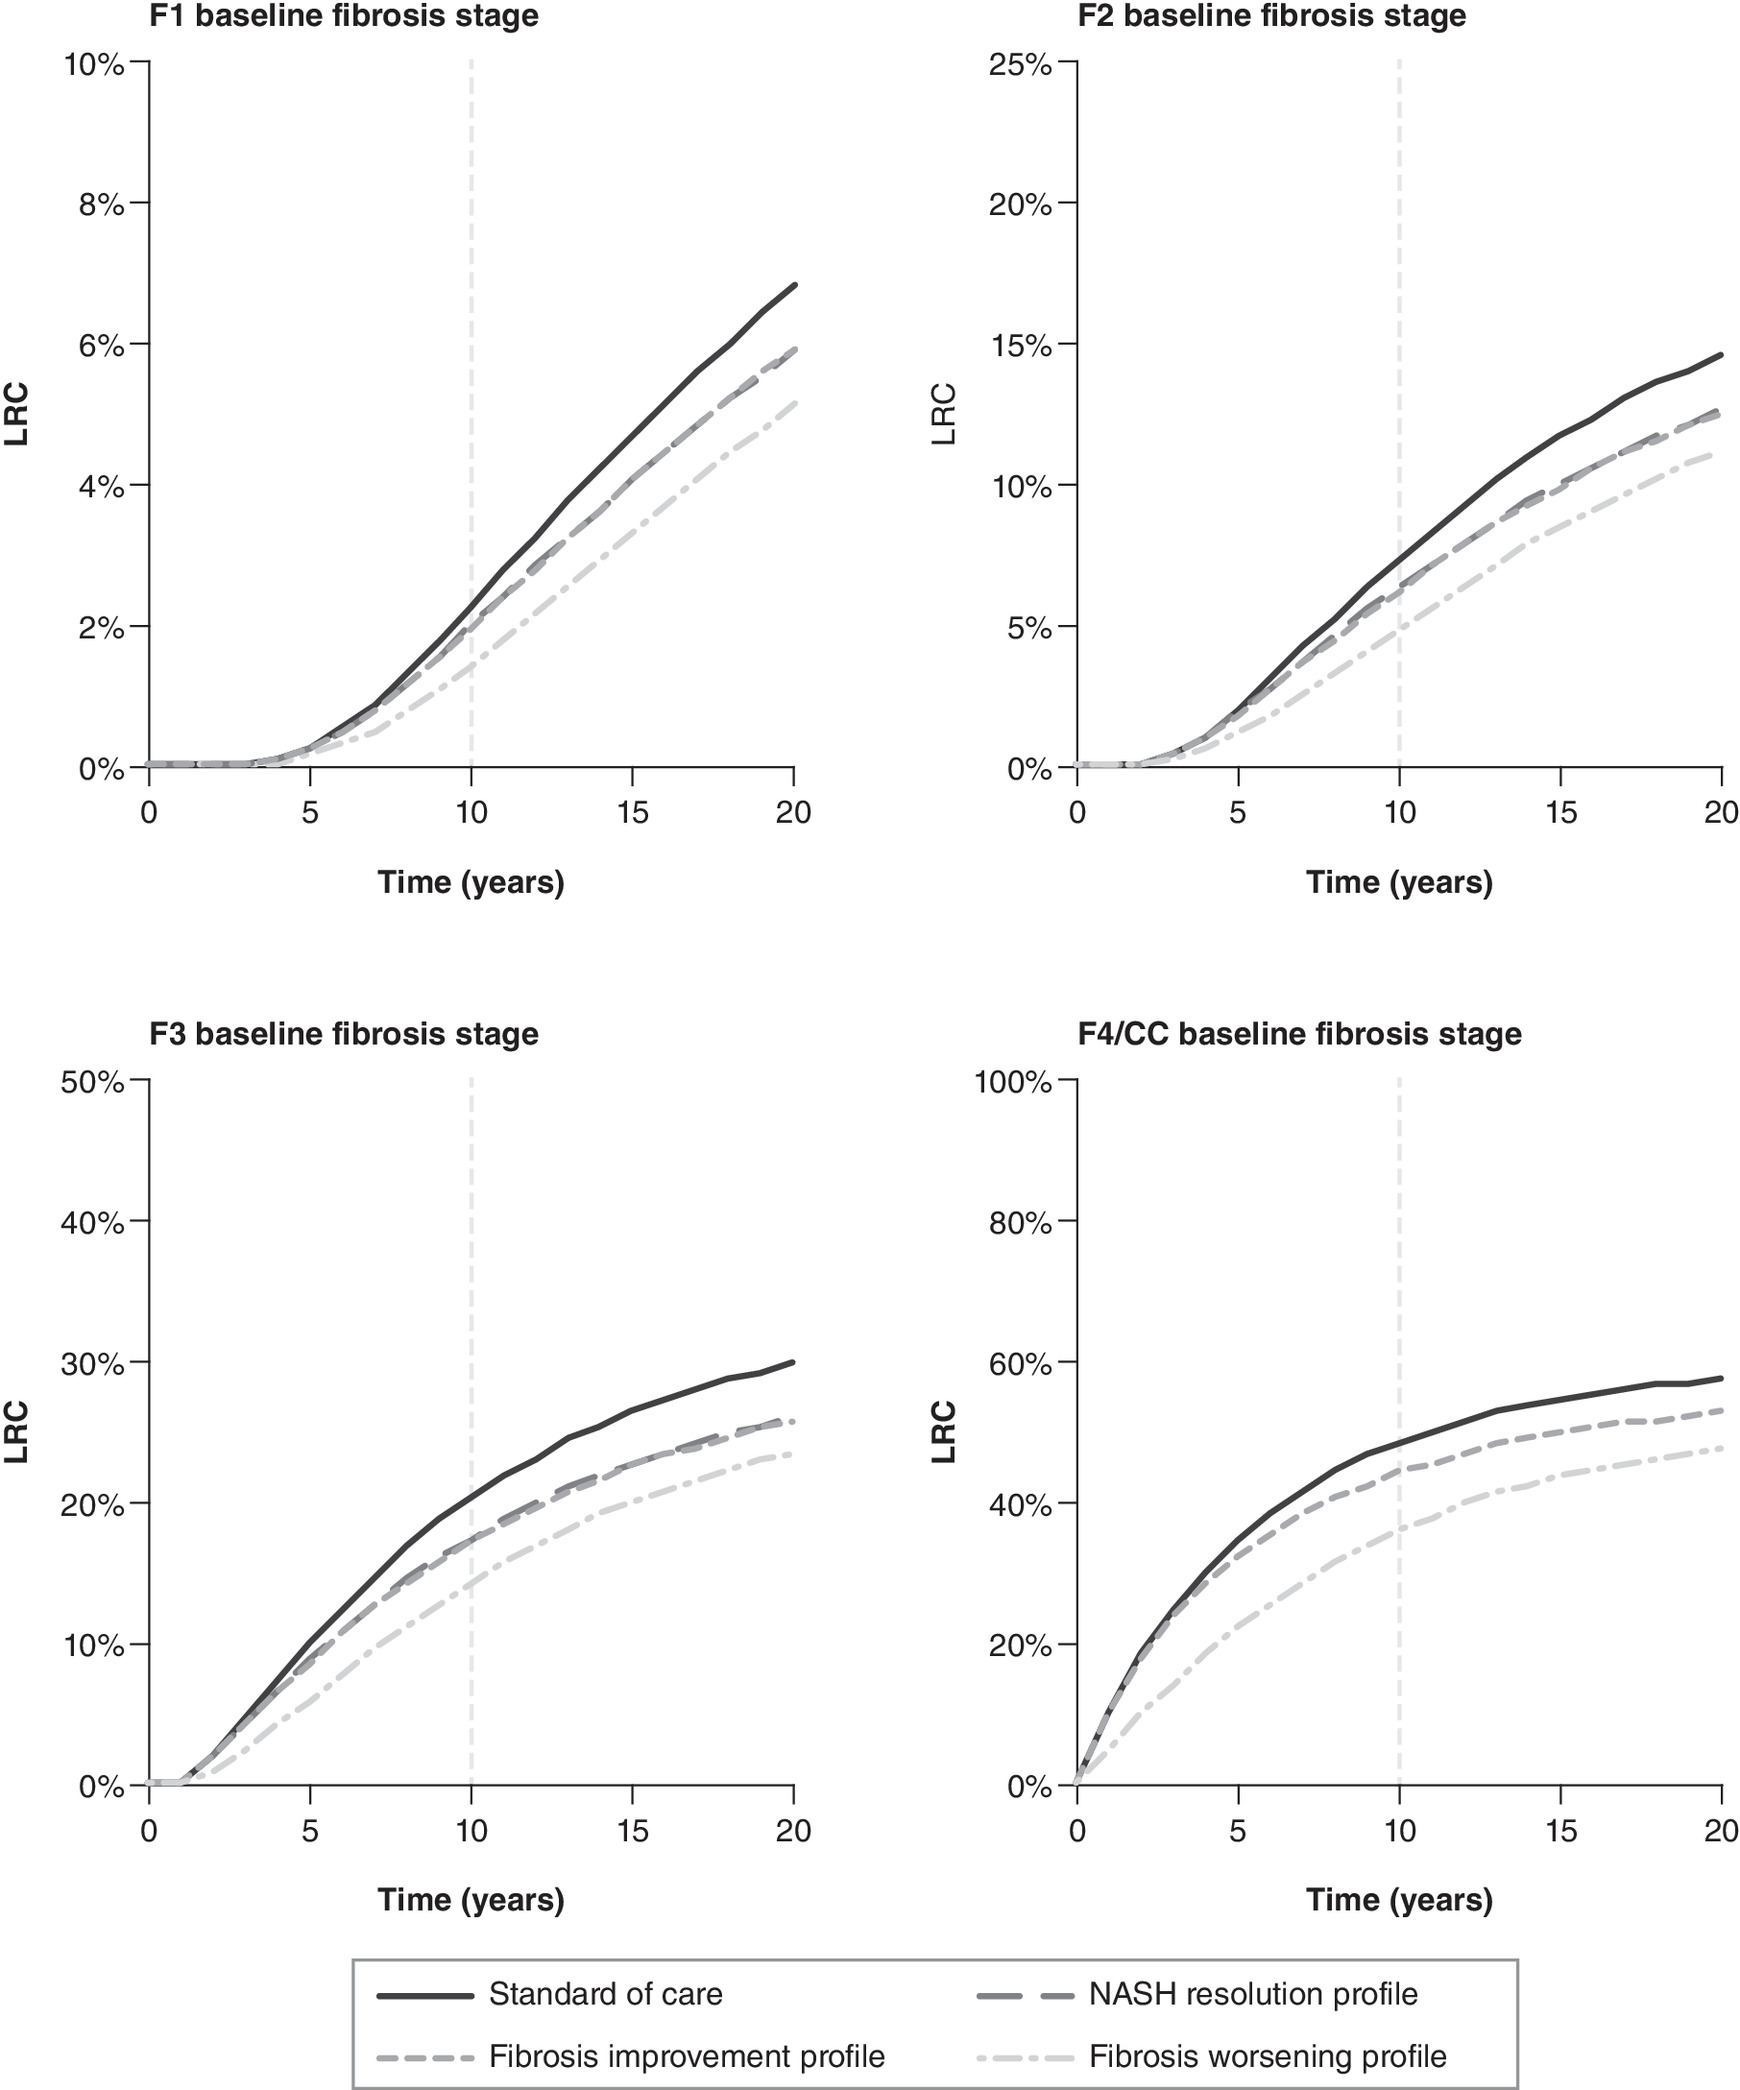
Figure 2. Effect of treatment efficacy profiles on liver-related complication rates over time by baseline fibrosis stage.
Depiction of the proportion of the baseline cohort with the 10-year LRC rate (i.e., DCC, HCC, or beyond) over time for three different treatment efficacy profiles (NASH resolution [dash-long], fibrosis improvement [dash-short], and fibrosis worsening [dot-dash]) compared with the standard of care (solid) for the baseline fibrosis stages of F1 (top right), F2 (top left), F3 (bottom right), and F4/CC (bottom left).
DCC: Decompensated cirrhosis; F0: No fibrosis; F1: Mild fibrosis; F2: Moderate fibrosis; F3: Significant fibrosis; F4/CC: Compensated cirrhosis; HCC: Hepatocellular carcinoma; LRC: Liver-related complication; NASH: Nonalcoholic steatohepatitis.
For patients receiving SoC, 10-year LRC rates (F1: 3.0%; F2: 9.8%; F3: 27.2%; F4/CC: 64.9%) and 10-year liver-related death rates (F1: 1.6%; F2: 5.8%; F3: 18.3%; F4/CC: 49.1%) increased with baseline fibrosis stage, while lifetime LYs decreased with baseline fibrosis stage (F1: 27.5; F2: 25.5; F3: 21.2; F4/CC: 12.5). For each of the three treatment efficacy profiles, the absolute differences in outcomes versus SoC are presented in brackets in the paragraphs below.
For the resolution profile, 10-year LRC rates decreased compared with SoC (F1: 2.6% [absolute difference = -0.4%]; F2: 8.5% [-1.3%]; F3: 23.3% [-3.9%]; F4/CC: not applicable), as did 10-year liver-related death rates (F1: 1.4% [-0.2%]; F2: 5.1% [-0.7%]; F3:15.8% [-2.5%]; F4/CC: not applicable). Lifetime LYs increased compared with SoC (F1: 27.7 [0.2]; F2: 25.9 [0.5]; F3: 22.2 [1.0]; F4/CC: not applicable).
For the improvement profile, 10-year LRC rates decreased compared with SoC (F1: 2.6% [-0.4%]; F2: 8.3% [-1.5%]; F3: 23.0% [-4.3%]; F4/CC: 59.0% [-5.9%]), as did 10-year liver-related death rates (F1: 1.4% [-0.2%]; F2: 5.0% [-0.8%]; F3: 15.5% [-2.8%]; F4/CC: 44.9% [-4.2%]). Lifetime LYs increased compared with SoC (F1: 27.7 [0.2]; F2: 26.0 [0.5]; F3: 22.3 [1.1]; F4/CC: 13.8 [1.4]).
For the worsening profile, 10-year LRC rates decreased compared with SoC (F1: 1.9% [-1.1%]; F2: 6.5% [-3.3%]; F3: 19.1% [-8.1%]; F4/CC: 55.0% [-9.9%]), as did 10-year liver-related death rates (F1: 1.0% [-0.6%]; F2: 3.7% [-2.1%]; F3: 12.4% [-6.0%]; F4/CC: 41.4% [-7.7%]). Lifetime LYs increased compared with SoC (F1: 27.9 [0.4]; F2: 26.3 [0.9]; F3: 23.0 [1.8]; F4/CC: 14.1 [1.6]).
Scenario analyses
Scenario analyses were performed to quantify the impact of factors influencing natural history (faster rates of fibrosis progression and increased mortality due to underlying comorbidities) and of factors influencing treatment effectiveness (magnitude of RRs for treatment efficacy and treatment-stopping rules). Scenario analysis results for patients with a baseline health state of fibrosis stage F2 are presented in Tables 4 and 5. For each scenario, the absolute differences from SoC are presented in brackets.
| Scenario analysis | Expected 10-year LRC rate per patient | Expected lifetime LYs per patient | ||||||
|---|---|---|---|---|---|---|---|---|
| SoC† | Resolution | Improvement | Worsening | SoC† | Resolution | Improvement | Worsening | |
| Base-case settings | 9.8% | 8.5% (-1.3%) | 8.3% (-1.5%) | 6.5% (-3.3%) | 25.5 | 25.9 (0.5) | 26.0 (0.5) | 26.3 (0.9) |
| 40% faster fibrosis progression | 18.8% | 16.4% (-2.4%) | 16.4% (-2.4%) | 13.2% (-5.6%) | 22.9 | 23.5 (0.7) | 23.5 (0.6) | 24.1 (1.2) |
| 20% higher general mortality | 9.7% | 8.4% (-1.3%) | 8.3% (-1.5%) | 6.5% (-3.3%) | 24.1 | 24.6 (0.4) | 24.6 (0.5) | 25.0 (0.8) |
| No progression stopping rule‡ | 9.8% | 8.4% (-1.4%) | 8.1% (-1.7%) | 6.2% (-3.7%) | 25.5 | 26.1 (0.6) | 26.2 (0.7) | 26.6 (1.1) |
| F4/CC or less severe stopping rule§ | 9.8% | 7.3% (-2.5%) | 6.5% (-3.3%) | 4.0% (-5.8%) | 25.5 | 26.5 (1.0) | 26.8 (1.4) | 27.2 (1.7) |
| Higher treatment efficacy¶ | 9.8% | 7.9% (-1.9%) | 7.8% (-2.1%) | 4.5% (-5.3%) | 25.5 | 26.1 (0.7) | 26.2 (0.7) | 26.9 (1.4) |
| Lower treatment efficacy# | 9.8% | 9.1% (-0.7%) | 9.0% (-0.8%) | 8.3% (-1.5%) | 25.5 | 25.7 (0.3) | 25.7 (0.3) | 25.9 (0.4) |
Base-case efficacy was defined with an RR = 2.0 for the resolution and improvement profiles and an RR = 0.5 for the worsening profile. Results for 10-year LRC rate and lifetime life-years are accompanied by the parenthetical difference between the standard of care and the treatment efficacy profile for each result (in absolute percentage points for the 10-year LRC rate and in life-years for lifetime life-years).
†
The base-case results for the standard of care are not affected by changes in treatment-stopping rules and treatment efficacy.
‡
“No progression” clinical stopping rule defined as allowing treatment to continue until a patient progresses to a fibrosis stage that is worse than their baseline stage (i.e., continuing treatment for patients with fibrosis improvement or NASH resolution).
§
“F4/CC or less severe” clinical stopping rule defined as allowing treatment to continue until a patient leaves the F4/CC health state (i.e., continuing treatment for patients with fibrosis improvement, NASH resolution or fibrosis worsening provided they do not progress past F4/CC to either the HCC or DCC health state).
¶
The improvement in treatment efficacy for the resolution and improvement profiles equates to an increase in the RR from 2.0 to 2.5, while an improvement in the efficacy for the worsening profile equates to a reduction in the RR from 0.50 to 0.25.
#
The reduction in treatment efficacy for the resolution and improvement profiles equates to a decrease in the RR from 2.0 to 1.5, while a reduction in the efficacy for the worsening profile equates to an increase in the RR from 0.50 to 0.75.
DCC: Decompensated cirrhosis; F2: Moderate fibrosis; F4/CC: Compensated cirrhosis; HCC: Hepatocellular carcinoma; LRC: Liver-related complication; LY: Life year; RR: Risk ratio; SoC: Standard of care.
| Scenario analysis | Treatment efficacy profile | ||
|---|---|---|---|
| Resolution | Improvement | Worsening | |
| Base-case settings | 1.1 | 1.0 | 1.9 |
| 40% faster rates of fibrosis progression | 0.9 | 0.9 | 1.7 |
| 20% higher risk of general mortality | 1.1 | 1.0 | 1.9 |
| No progression stopping rule | 5.6 | 5.8 | 6.5 |
| F4/CC or less severe stopping rule | 8.2 | 8.2 | 8.4 |
| Higher treatment efficacy | 1.0 | 0.9 | 2.1 |
| Lower treatment efficacy | 1.3 | 1.2 | 1.6 |
Base-case efficacy was defined with an RR = 2.0 for the resolution and improvement profiles and an RR = 0.5 for the worsening profile. Results for treatment exposure are reported as years; incremental changes are not reported, as there is no treatment exposure for the untreated health states for standard of care. Scenario parameters are the same as those described in Table 4.
F2: Moderate fibrosis; F4/CC: Compensated cirrhosis; RR: Risk ratio; SoC: Standard of care.
Faster fibrosis progression
Faster baseline rates of fibrosis progression, reflecting uncertainty in the base-case data or the possibility of treatment targeting subgroups of faster progressors, were considered by applying a 40% increase to the SoC transition probabilities for fibrosis worsening, including those from F4/CC to DCC and HCC. This increase in fibrosis progression rates nearly doubled the 10-year LRC rates in the SoC from 9.8 to 18.8% and increased the incremental LRC rate for each treatment profile by 1–2% absolute percentage points over the SoC (as shown in Table 4). Similar to the base-case results, both the resolution and the improvement treatment efficacy profiles predicted a similar difference in 10-year LRC rates, while the worsening treatment efficacy profile showed the greatest change (Table 4). However, this change in the baseline fibrosis progression rate had little impact on the lifetime LYs gained. Faster fibrosis progression also resulted in fewer years of treatment exposure compared with the base case (Table 5).
Increased general mortality
Increased background mortality to account for potential comorbid conditions (e.g., obesity, Type 2 diabetes mellitus) was considered by applying a 20% increase to the underlying general mortality probabilities. As shown in Table 4, this increase in mortality had almost no effect on the incremental 10-year LRC rates and incremental lifetime LYs across all three treatment efficacy profiles. Treatment exposure remained unchanged for resolution (1.1 years), improvement (1.0 years), and worsening profiles (1.9 years) compared with base-case settings.
Broader clinical stopping rules
In order to investigate the effect that treatment-stopping rules had on the model outcomes, two scenarios broadening the stopping rules were considered. The first stopping rule scenario allowed patients to continue treatment as long as their fibrosis stage did not worsen relative to baseline (i.e., baseline F2 patients would be allowed to stay on treatment in F1 and F0) and patients were allowed to continue treatment even after achieving NASH resolution. The second stopping rule scenario allowed patients to continue treatment even if their disease progressed up to compensated cirrhosis but not beyond (i.e., discontinuing treatment only if patients progressed to DCC or HCC). In both of these stopping rule scenarios, treatment efficacy was maintained across all health states where treatment was permitted. For the first stopping rule scenario (“no progression”), the incremental outcomes improved slightly for all three treatment efficacy profiles (10-year LRC rates: less than 0.5% absolute incremental percentage points; lifetime LYs: less than 0.3 incremental years) as shown in Table 4 and Figure 3. Incremental treatment exposure increased over the SoC for the resolution (5.6 years), improvement (5.8 years), and worsening (6.5 years) treatment profiles as shown in Table 5.
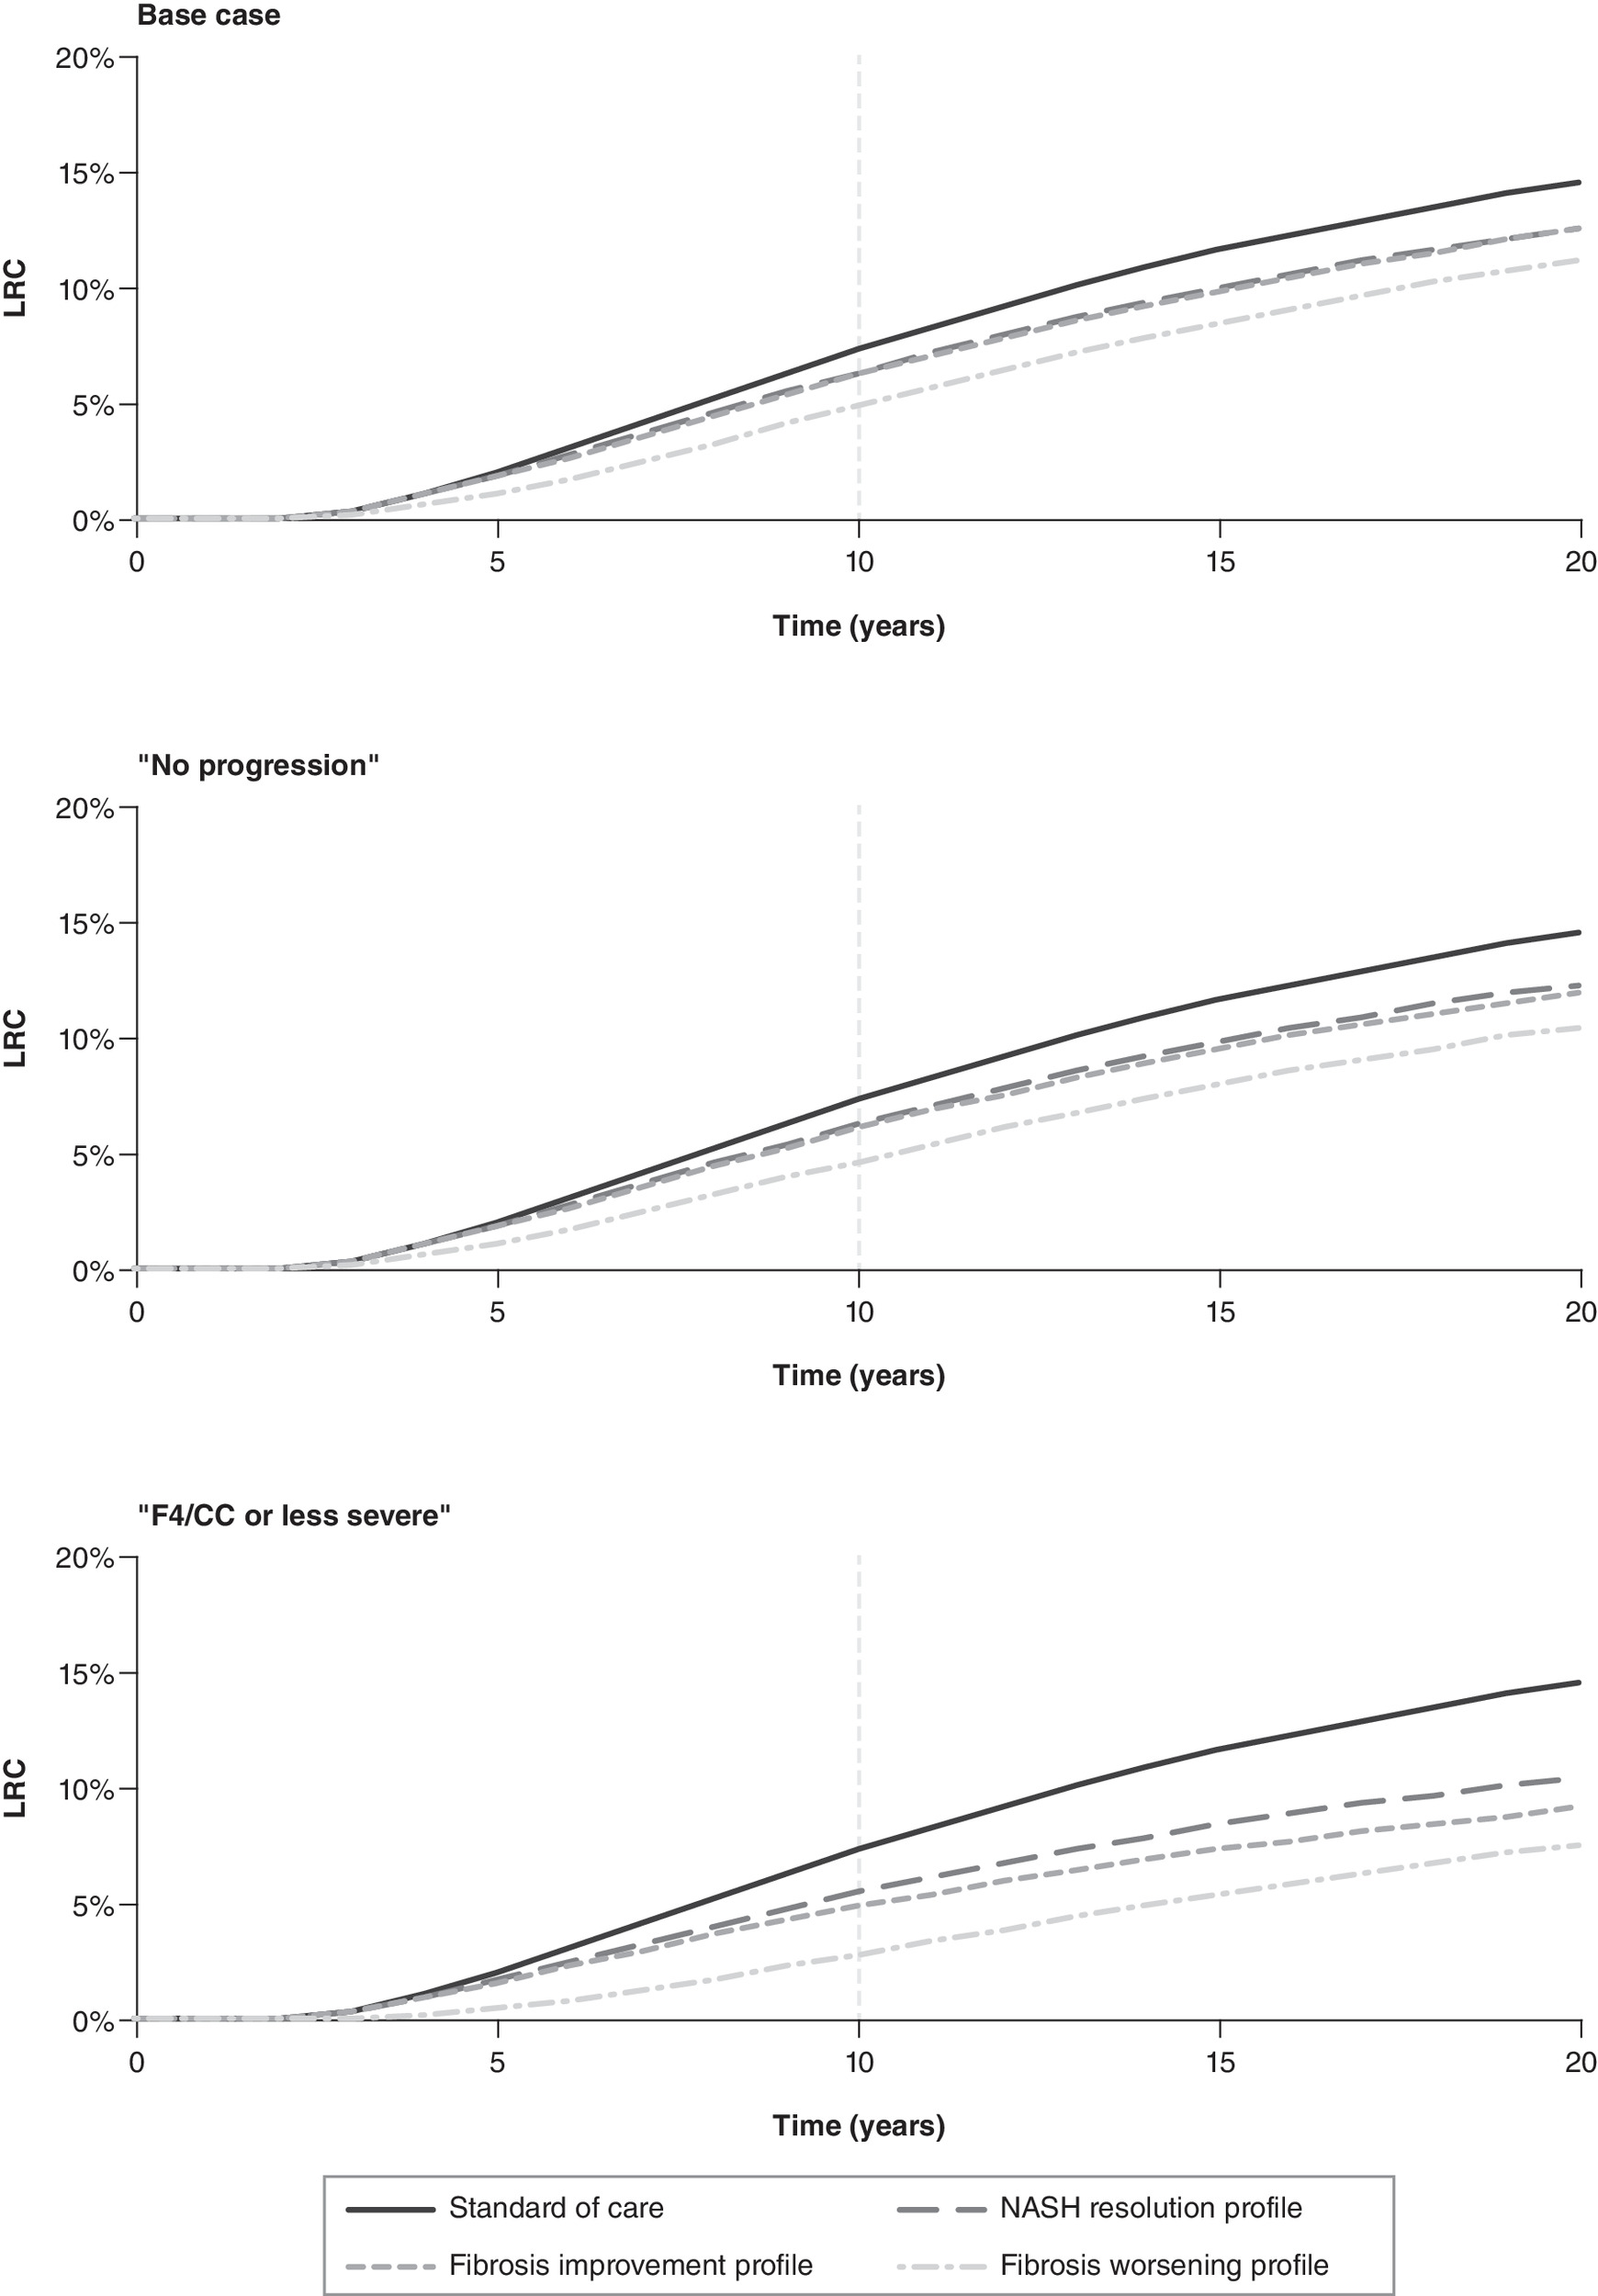
Figure 3. Effect of treatment efficacy profiles on liver-related complication rates over time by stopping rule for a cohort with baseline fibrosis stage F2.
Depiction of the proportion of the baseline F2-baseline fibrosis cohort with the LRC rate (i.e., DCC, HCC, or beyond) over time for three different treatment efficacy profiles (NASH resolution [dash-long], fibrosis improvement [dash-short], and fibrosis worsening [dot-dash]) compared with the standard of care (solid) for treatment-stopping rules limiting treatment to baseline fibrosis stage only (top), NASH fibrosis stages with no progression (middle), and fibrosis stages – both NASH and NASH resolution – less severe than F4/CC (bottom).
DCC: Decompensated cirrhosis; F4/CC: Compensated cirrhosis; HCC: Hepatocellular carcinoma; LRC: Liver-related complication; NASH: Nonalcoholic steatohepatitis.
In the second stopping rule scenario (“F4/CC or less severe”), the differences from SoC for 10-year LRC rates and lifetime LYs were greatest in the worsening profile, as expected. However, there was a smaller decrease in 10-year LRC rates compared with the SoC for the resolution treatment profile (-1.3% vs -2.5%) than the improvement treatment profile (-1.5% vs -3.3%); both treatment efficacy profiles gained similar benefits to lifetime LYs. Treatment exposure demonstrated the greatest increase over the base settings for the resolution (8.2 years), improvement (8.2 years), and worsening (8.4 years) profiles compared with other scenarios.
Changes in treatment efficacy
The effects of higher and lower treatment efficacy were considered by varying the treatment efficacy RRs for the NASH resolution profile (from 2.0 to 1.5 or 2.5), the fibrosis improvement profile (from 2.0 to 1.5 or 2.5), and the fibrosis worsening profile (from 0.50 to 0.25 or 0.75).
For both the higher and lower efficacy scenarios, the benefits to 10-year LRC rates and lifetime LYs followed base-case trends as shown in Table 4. As expected, the higher efficacy scenario decreased treatment exposure for treatment profiles that increase transition probabilities away from the baseline fibrosis stage (resolution and improvement); whereas higher efficacy increased treatment exposure for treatment profiles that decrease transition probabilities away from the baseline fibrosis stage (worsening). Conversely, lower treatment efficacy increased treatment exposure for the resolution and improvement profiles, while decreasing treatment exposure for the worsening profile.
Discussion
Understanding the potential impact of emerging NASH treatments on long-term health outcomes, especially the reduction in NASH-related liver complications, is critical to help decision makers understand how best to compare different treatment options. The diversity of mechanisms reflected in therapies being investigated for NASH, including anti-diabetic therapies targeting the potentially bidirectional relationship between NASH and metabolic syndrome, heightens the importance of understanding how these treatment options impact clinical outcomes [4]. Emerging therapies are being evaluated in clinical studies with endpoints measuring NASH resolution, fibrosis improvement, and fibrosis worsening. However, as emphasized in regulatory guidance for NASH drug development [12,13] and reinforced in the recent FDA determination on obeticholic acid [19], the objective of NASH treatment is to prevent progression to cirrhosis and LRCs. The analysis presented in this study demonstrates how different efficacy profiles measured in clinical studies (in terms of NASH resolution, fibrosis improvement, and fibrosis worsening) can be used in a model to estimate predictions for reductions in 10-year LRC rates and improvements in survival.
Across all three treatment effect profiles, the increased mortality scenario had a minimal impact on the incremental 10-year LRC rates (Table 4) or treatment exposure (Table 5). Similarly, an additional scenario analysis in which the assumed 10% probability of NASH redevelopment was set to 0% had only a slight impact on the 10-year LRC rate and treatment exposure (results not shown). Also note that the incremental lifetime LYs were not greatly affected in any of the scenarios.
The incremental 10-year LRC rates were very similar for both the efficacy profile that increased the annual probability of NASH resolution and the efficacy profile that increased the annual probability of fibrosis improvement, as shown in Figures 2 & 3. Both the NASH resolution and the fibrosis improvement treatment efficacy profiles increased the probability of patients transitioning to a state with improved health, moving them further away from the F4/CC health state from which LRCs occur. Because the SoC transition probability for fibrosis improvement across all NASH fibrosis stages (13.3% per year) is higher than the SoC transition probability for NASH resolution (9.6% per year), the improvement treatment efficacy profile yields slightly higher incremental 10-year LRC rates than the resolution profile when compared with the SoC. This slightly larger reduction in LRC rates for the improvement treatment efficacy profile over the resolution treatment efficacy profile is increased in the “F4/CC or less severe” stopping rule scenario as shown in Figure 3. In this expanded stopping rule scenario, patients who continue to receive the improvement treatment efficacy profile compared with the resolution profile benefit from a larger reduction in LRC rates, as the resolution treatment efficacy profile confers no benefits to those who enter the F4/CC health state.
The worsening efficacy profile, however, had the greatest impact on health-related outcomes both in terms of absolute percentage point reduction in 10-year LRC rates and an increase in lifetime LYs compared with the SoC across all four stages of fibrosis as shown in Figure 2 and Table 3. In contrast with the other efficacy profiles, the worsening treatment efficacy profile directly affects the transition probability of transiting to a more severe fibrosis stage (e.g. F4/CC, DCC, HCC, LT). For the reduced annual probability of fibrosis worsening efficacy profile, the scenario that allowed patients to continue treatment regardless of whether their fibrosis status improved or declined led to the largest 10-year LRC rate reduction across all scenarios and all treatment efficacy profiles as shown in Table 4 and Figure 3. As expected, the greatest decrease in 10-year LRC rates occurred in the faster baseline fibrosis progression scenario (as shown in Table 4).
For all three treatment efficacy profiles, the scenario analyses for faster baseline rates of fibrosis progression and the “F4/CC or less severe” stopping rule both resulted in a lower 10-year LRC rates than the higher efficacy scenario. This indicates that focusing treatment on patients with fast-progressing NASH or demonstrating treatment effectiveness over a broader range of health states may translate to larger clinical benefits per patient than focusing on treatment showing higher efficacy in its baseline health state only.
Decreases in 10-year LRC rate did not correlate directly with treatment exposure between scenario analyses. Across all three treatment efficacy profiles, broadening the stopping rules increased the treatment exposure by a factor of three-times or more; as a comparison, higher treatment efficacy resulted in a decrease in treatment exposure for the resolution and improvement efficacy profiles while increasing treatment exposure for the worsening efficacy profile. Note that the worsening profile treatment in the faster baseline rates of fibrosis progression scenario reduces the overall exposure to treatment while offering a similar reduction in 10-year LRC rates as expanded stopping rules. This reduction in treatment exposure would reduce the number of potentially invasive liver-related diagnostic procedures, possible drug-related adverse events and treatment costs.
A number of limitations should be noted when interpreting the findings of this analysis. In particular, a few key assumptions were made to fill data gaps regarding the NASH patient characteristics and SoC transition probabilities: baseline demographics were assumed to be the same across fibrosis levels; the transition probabilities for fibrosis improvement, fibrosis worsening, and NASH resolution were assumed to be identical across all precirrhotic (i.e., F0–F3) fibrosis stages; simultaneous NASH resolution and fibrosis improvement was permitted, and the degree of overlap was assumed; and the annual probability for NASH redevelopment was assumed. Postcirrhosis transition probabilities and mortality were obtained from studies that were specific to liver disease but were not specific to NASH. In addition, the model is based on two key structural assumptions: patients can move at most one fibrosis severity level per annual cycle, and no fibrosis worsening was allowed in the NASH resolution health states. Many of these data gaps and assumptions may be addressed by conducting additional analyses of existing or future clinical trial data or by leveraging the data being collected in ongoing real-world evidence initiatives.
It should be noted that many of the transition probabilities that were obtained from literature were estimated from clinical trials with limited durations. The annual transition probabilities obtained from these studies for fibrosis progression, NASH resolution, and cirrhotic complications (DCC, HCC, and F4/CC mortality) were extrapolated in the model over longer horizons to predict LRC rates and other outcomes. The hypothetical treatment efficacy profiles considered in our analysis also may differ from the endpoints used in clinical trials for specific NASH therapies. Evidence on potential combinations of efficacy profiles (e.g., direct effects on NASH resolution and fibrosis improvement) and on the durability of treatment effect may be considered for future analysis. Additionally, from a practical clinical perspective, the enforcement of treatment-stopping rules based on fibrosis progression and NASH resolution is dependent on an annual liver analysis that may require costly and invasive tests and procedures. Finally, this model does not account for potential health outcomes associated with cardiovascular events (e.g., due to comorbid diabetes or obesity) or treatment-related adverse events.
Conclusion
Given the relatively few published models for NASH, this model is a step forward for the development of a modeling approach that can account for different treatment efficacy profiles and accurately predict long-term LRC rates from short-term clinical trial endpoints. Unlike existing published models, this work accounts for separate health states for fibrosis stages in both NASH and NASH resolution. Also, this work provides a basis of comparison for decision makers as they compare different approaches to the treatment of NASH (resolution, improvement and worsening treatment efficacy profiles), including the potential impact of identifying fast-progressing patient subpopulations and determining appropriate treatment-stopping rules. As additional data on the natural history of NASH become available, this modeling approach and the insights gained from our analysis can aid researchers and decision makers studying the clinical and economic value of treatment options for NASH patients.
•
Nonalcoholic steatohepatitis (NASH) is a leading cause of liver transplantation and the focus of ongoing drug development efforts.
•
There are several treatments for NASH in development targeting some combination of increasing NASH resolution, increasing fibrosis improvement, or decreasing fibrosis worsening.
•
Regulatory guidance describes these endpoints as reasonable surrogates for long-term liver-related and survival outcomes.
•
Economic evaluations of new treatments for NASH will require the prediction of lifetime health outcomes from short-term clinical trial data on these surrogate endpoints.
•
Our objective was to use an evidence-based modeling approach for NASH to estimate the impact on predicted long-term health outcomes of hypothetical NASH efficacy profiles aligned with clinical trial endpoints.
•
Our results suggest that treatments slowing fibrosis worsening have a larger impact on 10-year liver-related complication rates and overall survival than treatments increasing NASH resolution or fibrosis improvement.
•
In scenario analyses, the long-term health benefits of NASH treatments also depended on patients' baseline fibrosis stage, underlying rates of fibrosis progression, and potential treatment-stopping rules.
•
These results have implications for future researchers and decision makers tasked with evaluating emerging treatments for NASH.
Author contributions
WL Herring and IG Gould developed the model and led the interpretation of analytical results. V Wittrup-Jensen, J Ertle, E Kuti and S Wolowacz contributed to the design of the model and the interpretation of analytical results. All authors reviewed and approved the final analyses and interpretation presented in the article.
Acknowledgments
The authors acknowledge Sam Mettam formerly of Boehringer Ingelheim International GmbH for contributions to the design of the model, Brian Samsell of RTI Health Solutions for medical writing assistance and Emily Gill of RTI Health Solutions for graphic design support.
Financial & competing interests disclosure
The financial support for the study, including the journal's Open Access fee, was provided by Boehringer Ingelheim International GmbH and Boehringer Ingelheim Pharmaceuticals, Inc. V Wittrup-Jensen, J Ertle and E Kuti are employees of Boehringer Ingelheim. WL Herring and S Wolowacz are employees of RTI Health Solutions, an independent nonprofit research organization, which received funding under a contract with Boehringer Ingelheim to conduct the study which is the subject of this manuscript. IG Gould was an employee of RTI Health Solutions at the time this study was conducted. The authors have no other relevant affiliations or financial involvement with any organization or entity with a financial interest in or financial conflict with the subject matter or materials discussed in the manuscript apart from those disclosed.
RTI Health Solutions received funding under a research contract with Boehringer Ingelheim to conduct this study and to provide medical writing and graphical design support.
Ethical conduct of research
No human research ethics committee approval was required for this study. All relevant data on human subjects were obtained from aggregated outcomes reported in the published literature.
Data sharing statement
All data relevant to the study was obtained from the published literature and has been presented in the article and supplementary materials.
Open access
This work is licensed under the Attribution-NonCommercial-NoDerivatives 4.0 Unported License. To view a copy of this license, visit http://creativecommons.org/licenses/by-nc-nd/4.0/
Supplementary Material
File (supplementary material.docx)
- Download
- 83.33 KB
References
Papers of special note have been highlighted as: • of interest; •• of considerable interest
1.
Neuschwander-Tetri BA, Caldwell SH. Nonalcoholic steatohepatitis: summary of an AASLD single topic conference. Hepatology 37(5), 1202–1219 (2003).
2.
Spengler EK, Loomba R. Recommendations for diagnosis, referral for liver biopsy, and treatment of nonalcoholic fatty liver disease and nonalcoholic steatohepatitis. Mayo Clin. Proc. 90(9), 1233–1246 (2015).
3.
Wong RJ, Aguilar M, Cheung R et al. Nonalcoholic steatohepatitis is the second leading etiology of liver disease among adults awaiting liver transplantation in the United States. Gastroenterology 148(3), 547–555 (2015).
4.
Friedman SL, Neuschwander-Tetri BA, Rinella M, Sanyal AJ. Mechanisms of NAFLD development and therapeutic strategies. Nat. Med. 24(7), 908–922 (2018).
• Overview of nonalcoholic fatty liver disease and nonalcoholic steatohepatitis (NASH) clinical features and therapeutic strategies.
5.
Ratziu V, Harrison SA, Francque S et al. Elafibranor, an agonist of the peroxisome proliferator-activated receptor-alpha and -delta, induces resolution of nonalcoholic steatohepatitis without fibrosis worsening. Gastroenterology 150(5), 1147–1159.e1145 (2016).
•• Study used to estimate the probability of NASH resolution for our model.
6.
Johansen P, Howard D, Bishop R, Moreno SI, Buchholtz K. Systematic literature review and critical appraisal of health economic models used in cost–effectiveness analyses in non-alcoholic steatohepatitis: potential for improvements. Pharmacoeconomics 38(5), 485–497 (2020).
•• Systematic literature review of published economic models for NASH used to inform our modeling approach.
7.
Tapper EB, Chhatwal J. We are not meeting the needs of pharmacoeconomic models of nonalcoholic steatohepatitis, but we can. Pharmacoeconomics 38(5), 427–429 (2020).
8.
Caldwell S, Argo C. The natural history of non-alcoholic fatty liver disease. Dig. Dis. 28(1), 162–168 (2010).
9.
Ratziu V, Bellentani S, Cortez-Pinto H, Day C, Marchesini G. A position statement on NAFLD/NASH based on the EASL 2009 special conference. J. Hepatol. 53(2), 372–384 (2010).
10.
Ratziu V. A critical review of endpoints for non-cirrhotic NASH therapeutic trials. J. Hepatol. 68(2), 353–361 (2018).
• Overview of NASH clinical trial endpoints used to inform our hypothetical treatment efficacy profiles.
11.
Chalasani N, Younossi Z, Lavine JE et al. The diagnosis and management of nonalcoholic fatty liver disease: practice guidance from the American Association for the Study of Liver Diseases. Hepatology 67(1), 328–357 (2018).
12.
Food and Drug Administration. Noncirrhotic nonalcoholic steatohepatitis with liver fibrosis: developing drugs for treatment. Guidance for industry (2018). www.fda.gov/regulatory-information/search-fda-guidance-documents/noncirrhotic-nonalcoholic-steatohepatitis-liver-fibrosis-developing-drugs-treatment
13.
European Medicines Agency. Draft reflection paper on regulatory requirements for the development of medicinal products for chronic non-infectious liver diseases (PBC, PSC, NASH) (2018). www.ema.europa.eu/en/draft-reflection-paper-regulatory-requirements-development-medicinal-products-chronic-non-infectious
14.
Mahady SE, Wong G, Craig JC, George J. Pioglitazone and vitamin E for nonalcoholic steatohepatitis: a cost utility analysis. Hepatology 56(6), 2172–2179 (2012).
15.
Klebanoff MJ, Corey KE, Chhatwal J, Kaplan LM, Chung RT, Hur C. Bariatric surgery for nonalcoholic steatohepatitis: a clinical and cost–effectiveness analysis. Hepatology 65(4), 1156–1164 (2017).
16.
Corey KE, Klebanoff MJ, Tramontano AC, Chung RT, Hur C. Screening for nonalcoholic steatohepatitis in individuals with type 2 diabetes: a cost–effectiveness analysis. Dig. Dis. Sci. 61(7), 2108–2117 (2016).
17.
Zhang E, Wartelle-Bladou C, Lepanto L, Lachaine J, Cloutier G, Tang A. Cost-utility analysis of nonalcoholic steatohepatitis screening. Eur. Radiol. 25(11), 3282–3294 (2015).
18.
Institute for Clinical and Economic Review (ICER). Obeticholic acid for the treatment of nonalcoholic steatohepatitis: comparative clinical effectiveness and value (2016).
19.
Intercept. Intercept press release: intercept receives complete response letter from FDA for obeticholic acid for the treatment of fibrosis due to NASH (2020). https://ir.interceptpharma.com/news-releases/news-release-details/intercept-receives-complete-response-letter-fda-obeticholic-acid
20.
Rind DM HR, Guzauskas G, Beinfeld M, Chapman R, Bradt P, Pearson SD. Obeticholic acid for the treatment of nonalcoholic steatohepatitis with fibrosis: effectiveness and value. Institute for Clinical and Economic Review (2020). https://icer-review.org/wp-content/uploads/2019/10/ICER_NASH_Evidence_Report_072120.pdf
21.
Singh S, Allen AM, Wang Z, Prokop LJ, Murad MH, Loomba R. Fibrosis progression in nonalcoholic fatty liver vs nonalcoholic steatohepatitis: a systematic review and meta-analysis of paired-biopsy studies. Clin Gastroenterol Hepatol. 13(4), 643–654.e641–649; quiz e639–640 (2015).
•• Meta-analysis of fibrosis progression in NASH used to obtain fibrosis improvement and worsening probabilities for our model.
22.
Sanders GD, Neumann PJ, Basu A et al. Recommendations for conduct, methodological practices, and reporting of cost–effectiveness analyses: second panel on cost–effectiveness in health and medicine. JAMA 316(10), 1093–1103 (2016).
23.
NICE. Guide to the methods of technology appraisal 2013 (PMG9) (2013). www.nice.org.uk/process/pmg9/resources/guide-to-the-methods-of-technology-appraisal-2013-pdf-2007975843781
24.
Siebert U, Alagoz O, Bayoumi AM et al. State-transition modeling: a report of the ISPOR-SMDM modeling good research practices task force-3. Value Health. 15(6), 812–820 (2012).
25.
Younossi ZM, Blissett D, Blissett R et al. The economic and clinical burden of nonalcoholic fatty liver disease in the United States and Europe. Hepatology 64(5), 1577–1586 (2016).
•• Key data source for postcirrhotic transition probabilities in our model.
26.
Harrison SA, Abdelmalek MF, Caldwell S et al. Simtuzumab is ineffective for patients with bridging fibrosis or compensated cirrhosis caused by nonalcoholic steatohepatitis. Gastroenterology 155(4), 1140–1153 (2018).
27.
Arias E, Heron M, Xu J. United States life tables, 2013. Natl Vital Stat Rep. 66(3), 1–64 (2017).
28.
ClinicalTrials.gov. AURORA: phase III study for the efficacy and safety of CVC for the treatment of liver fibrosis in adults with NASH. NCT03028740 (2019). https://clinicaltrials.gov/ct2/show/NCT03028740
29.
ClinicalTrials.gov. Safety and efficacy of selonsertib in adults with nonalcoholic steatohepatitis (NASH) and bridging (F3) fibrosis (STELLAR 3). NCT03053050 (2019). https://clinicaltrials.gov/ct2/show/NCT03053050
30.
ClinicalTrials.gov. Study evaluating the efficacy and safety of obeticholic acid in subjects with compensated cirrhosis due to nonalcoholic steatohepatitis (REVERSE). NCT03439254 (2019). https://clinicaltrials.gov/ct2/show/NCT03439254
31.
ClinicalTrials.gov. Safety and efficacy of selonsertib in adults with compensated cirrhosis due to nonalcoholic steatohepatitis (NASH) (STELLAR 4). NCT03053063 (2019). https://clinicaltrials.gov/ct2/show/NCT03053063?term=NCT03053063&draw=2&rank=1
32.
ClinicalTrials.gov. Phase III study to evaluate the efficacy and safety of elafibranor versus placebo in patients with nonalcoholic steatohepatitis (NASH) (RESOLVE-IT). NCT02704403 (2019). https://clinicaltrials.gov/ct2/show/NCT02704403?term=NCT02704403&draw=2&rank=1
33.
ClinicalTrials.gov. Randomized global Phase III study to evaluate the impact on NASH with fibrosis of obeticholic acid treatment (REGENERATE). NCT02548351 (2019). https://clinicaltrials.gov/ct2/show/NCT02548351?term=NCT02548351&draw=2&rank=1
Information & Authors
Information
Published In
Pages: 1349 - 1363
PubMed: 36317935
Copyright
© 2022 Boehringer Ingelheim International GmbH. This work is licensed under the Attribution-NonCommercial-NoDerivatives 4.0 Unported License
History
Received: 10 August 2021
Accepted: 13 October 2022
Published online: 1 November 2022
Keywords:
Topics
Authors
Funding Information
Metrics & Citations
Metrics
Article Usage
Article usage data only available from February 2023. Historical article usage data, showing the number of article downloads, is available upon request.
Citations
How to Cite
Evaluation of emerging NASH therapies: the impact of treatment efficacy profiles on long-term health outcomes. (2022) Journal of Comparative Effectiveness Research. DOI: 10.2217/cer-2021-0194
Export citation
Select the citation format you wish to export for this article or chapter.
Citing Literature
- Windson Hebert Araújo Soares, Guilherme Grossi Lopes Cançado, André Soares Motta-Santos, Cost-Effectiveness of Resmetirom for Metabolic Dysfunction-Associated Steatohepatitis in Brazil, Value in Health Regional Issues, 10.1016/j.vhri.2025.101526, 53, (101526), (2026).
- Paul N. Brennan, Ahmed M. Elsharkawy, Timothy J. Kendall, Rohit Loomba, Derek A. Mann, Jonathan A. Fallowfield, Antifibrotic therapy in nonalcoholic steatohepatitis: time for a human-centric approach, Nature Reviews Gastroenterology & Hepatology, 10.1038/s41575-023-00796-x, 20, 10, (679-688), (2023).