Cost–utility analysis of single nucleotide polymorphism panel-based machine learning algorithm to predict risk of opioid use disorder
Publication: Journal of Comparative Effectiveness Research
Abstract
Aim: To conduct a cost–utility analysis of a novel genetic diagnostic test (OUDTEST) for risk of developing opioid use disorder for elective orthopedic surgery patients. Materials & Methods: A simulation model assessed cost–effectiveness and quality-adjusted life-years (QALYs) for OUDTEST from private insurer and self-insured employer perspectives over a 5-year time horizon for a hypothetical patient population. Results: OUDTEST was found to cost less and increase QALYs, over a 5-year period for private insurance (savings US$2510; QALYs 0.02) and self-insured employers (-US$2682; QALYs 0.02). OUDTEST was a dominant strategy in 71.1% (private insurance) and 72.7% (self-insured employer) of model iterations. Sensitivity analyses revealed robust results except for physician compliance. Conclusion: OUDTEST was expected to be a cost-effective solution for personalizing postsurgical pain management in orthopedic patients.
There were more than 233 million opioid prescriptions filled in each year between 2006 and 2017 [1]. It is estimated that nearly a third of all opioid-related deaths were associated with prescription opioids while the other two-thirds were related to heroin and fentanyl use which often follows exposure to prescription opioids [2,3]. According to the CDC, more than 1000 patients visit the emergency department daily due to opioid use while approximately 135 patients die from opioid overdose daily [4]. Opioid addiction and use not only impacts quality of life but is also a major economic burden in the United States [5,6]. In 2017, the economic impact of opioid overdose and opioid use disorder (OUD) exceeded 78.5 billion annually in the US including cost of healthcare and treatment as well as loss in productivity [6,7].
Although a large percentage of opioid prescriptions are for chronic pain, postoperative pain management is also a large contributor. More than 51 million Americans undergo inpatient surgery annually [8]. The majority of surgical patients receive opioids for postoperative pain management [9,10]. It is estimated that opioids are the primary pain management for 80% of all patients undergoing surgery [11].
Opioids prescribed at discharge have been identified as a risk factor for continued opioid use up to 1 year following surgery [12]. Patients prescribed opioids for even short-stay surgeries have shown as much as a 44% increased risk of developing OUD [13]. Furthermore, it has been shown that postoperative opioid use is a stimulus for OUD even among previously opioid-naive patients [14]. Rates of continued opioid use at 90 days after surgery have been estimated to be as high as 6.5% in previously opioid-naive patients [15]. Patients that are opioid-tolerant often require higher doses over longer periods which may also contribute to OUD [16,17].
Prescription patterns vary by surgery type and by physician [18,19]. Orthopedic surgeons are the third leading prescribers of opioids and are estimated to be responsible for roughly 8% of all prescribed opioids in the US [20,21]. They face a difficult challenge of properly treating acute pain following surgery while managing the risk for developing OUD [22]. Estimates of OUD post-orthopedic surgery range from 2% to as high as 22% [23,24]. For these reasons many orthopedic surgeons have requested the development of evidence-based prescribing guidelines [21].
Healthcare providers have taken a multi-faceted approach to prevent and treat OUD including changes to prescribing protocols, alternative treatment pathways including multimodal therapy and regional anesthesia, enhanced recovery after surgery, and an emphasis on patient education and discharge planning [15,22,25,26]. Multimodal therapies have improved post-operative pain management resulting in shorter hospital stays and earlier transitions to rehabilitation programs [27]. However, postdischarge pain management remains a challenge as little evidence exists to define appropriate regimens, dosage and duration of opioids for orthopedic procedures [8,28].
Another approach to address OUD is to modify postoperative pain management regimens based on patient screening for risk of developing OUD [29,30]. Many patient risk factors have been identified for developing OUD including patient age, sex, race, education level, income, pre-operative tobacco use, alcohol or substance use, mental health disorders such as mood disorders and anxiety, pre-operative chronic pain and pre-operative opioid use [5,15,30]. However, these assessments are often based on self-reported measures and have had low uptake by physicians due to their self-reported nature. Further, research has also shown genetic predisposition as an important factor for the development of OUD [31,32,33,34,35].
The self-reported and subjective nature of prior assessments has led to the development of an objective novel and robust machine learning algorithm for OUD assessment that analyzes fifteen alleles involved in the brain reward pathway (OUDTEST) has been shown to identify patients with a higher risk of OUD [36]. This validated test may be used within the healthcare system for modifying postoperative pain management therapies in patients with high risk for opioid addiction or misuse.
The objective of this economic simulation model was to quantify the incremental cost–effectiveness of incorporating the OUDTEST in the patient care pathway of patients without prior OUD undergoing elective orthopedic surgery from the healthcare payer and self-insured payer perspective. We hypothesized that using the OUDTEST to inform postoperative therapeutic decisions will provide an economic value to payers and self-insured employers.
Data & methods
Description of intervention
Donaldson (2021) conducted a multi-center clinical validation study of a novel predictive algorithm of 15 single nucleotide polymorphisms involved in the brain rewards pathways, OUDTEST test [37]. They validated this OUD diagnostic test on a dataset consisting of 381 subjects who had prior exposure to opioids prior to entering the study. The OUDTEST predicted OUD incidence with 82.5% sensitivity (95% CI: 76.1–87.8%) and 79.9% specificity (95% CI: 73.7–85.2%). OUDTEST performed in a robust manner regardless of age or race/ethnicity groups. These results were used to inform the probability of being identified as high risk and low risk for OUD incidence in the simulation models.
Study population
The population consisted of a hypothetical cohort of adult patients undergoing elective orthopedic procedures for which opioids are commonly prescribed for pain management. Patients were split equally between the intervention and standard of care (SOC) treatment arms. The intervention cohort received the OUDTEST prior to surgery. Patients who tested positive for increased likelihood of OUD were given non-opioid-based pain relievers post-surgery. Patients who tested negative were given opioids for pain management. The SOC cohort did not receive the OUDTEST test and were treated with opioids for pain management post-surgery.
Literature review & parameter selection
A best-evidence literature review was conducted using the National Library of Medicine’s PubMed database (containing both MEDLINE and publisher-supplied citations), the Cochrane Reviews database of systematic reviews and meta-analyses, and a manual reference check of recent reviews (past 2 years). The search terms were developed to identify relevant literature for the clinical, cost, utilization and utility parameters for each model input. The search strategy included articles published in English-language journals since 2010. A single reviewer performed all screening and data extraction.
Best practices were followed in order to minimize bias. Publication information, sample size, study design and effect sizes for relevant parameters were extracted into a Microsoft Excel data form for all literature meeting specified criteria. For parameters with multiple data points extracted (i.e., multiple studies reporting the parameter), the sample size weighted pooled average was calculated to populate the base case model. Upper and lower reported values in the literature, along with standard errors around the pooled-mean were used to define a plausible range for each parameter. If a range could not be sourced from the literature, then ± 25% of the reference value was used to define the end points of the range. Table 1 and Appendix A provides further information on parameter references, life tables used in the analysis, distributions used in the PSA, and model assumptions.
| Parameter | Value (range) | Ref. |
|---|---|---|
| Starting age (years) | 55 (45–65) | Assumption |
| Discount rate (%) | 3 | NA |
| OUDTEST test probabilities (%) | ||
| – High (HI) risk of OUD | 23.19 (18.44–28.76) | [37] |
| – Low (LO) risk of OUD | 76.81 (81.56–71.24) | [37] |
| OUD risk probabilities (%): | ||
| – OUD high risk | 14.0 (4.95–22.0) | [20,23,24,38,39] |
| – OUD low risk | 2.1 (2.1–4.95) | [20,23,24,38,39] |
| – General OUD | 4.95 (2.1–22.0) | [20,23,24,38,39] |
| Labor productivity (self-insured employers); days/month | ||
| – Working at time of index procedure | 50 (34–80) | [40] |
| – Treatment lost work | 0.39 | [41] |
| – OUD lost work | 7.39 | [41] |
| Transition probabilities (%) | ||
| – OUD to OUD | 74.5 (67.0–81.9) | [42] |
| – OUD to treatment | 25.6 (23.0–28.1) | [42] |
| – OUD to remission | 0 | [42] |
| – Treatment to treatment | 85.8 (77.3–94.4) | [42] |
| – Treatment to OUD | 10.3 (9.3–11.4) | [42] |
| – Treatment to remission | 3.8 (3.4–4.2) | [42] |
| – Remission to OUD | 5.4 (4.9–5.9) | [42] |
| – Remission to remission | 94.6 (85.1–100) | [42] |
| Transition to death (SMR) | ||
| – OUD | 3.9 (3.6–7.7) | [43] |
| – Treatment | 1.8 (1.1–2.8) | [43] |
| – Remission | Life tables | [44] |
| – Alive | Life tables | [44] |
| Costs ($US) | ||
| – OUDTEST | 500 (375–600) | SOLVD |
| – Opioid pain mgmt. | 251 (188–314) | [45] |
| – Alt. pain mgmt. | 50 (38–63) | [46] |
| – OUD | 11,771 | [47] |
| – Treatment | 3985 | [47] |
| – Remission | 0 | Assumption |
| – Worker salary | 218 | [40] |
| – OUD worker salary | 218 | [40] |
| Utility values | ||
| – OUD | 0.71 (0.64–0.78) | [48] |
| – Treatment | 0.75 (0.68–0.83) | [48] |
| – Remission | 0.76 (0.68–0.84) | [48] |
| – Alive | 0.82 (0.78–0.85) | [48] |
| – Dead | 0 | NA |
†
Values in parentheses informed the sensitivity analyses. See Appendix for further information.
Alt.: Alternative; LR: Literature review; Mgmt.: Management; OUD: Opioid use disorder; SOLVD: SOLVD Health, Inc.; SMR: Standardized mortality ratio.
Modeling approach
A cost–utility analysis from the healthcare payer perspective was performed using a patient-level Markov chain Monte Carlo simulation model. The model scaffold (Figure 1A–C) was informed by relevant treatment guidelines and key expert opinion. Patients who developed OUD transitioned between four health states: OUD, Treatment, Remission and Dead. Patients had a transition probability for moving between health states for each time cycle. Patients in the OUD health state received inpatient treatment followed by medication-assisted therapy while patients in a Treatment health state received medication-assisted therapy. Dead was considered to be an absorbing health state.
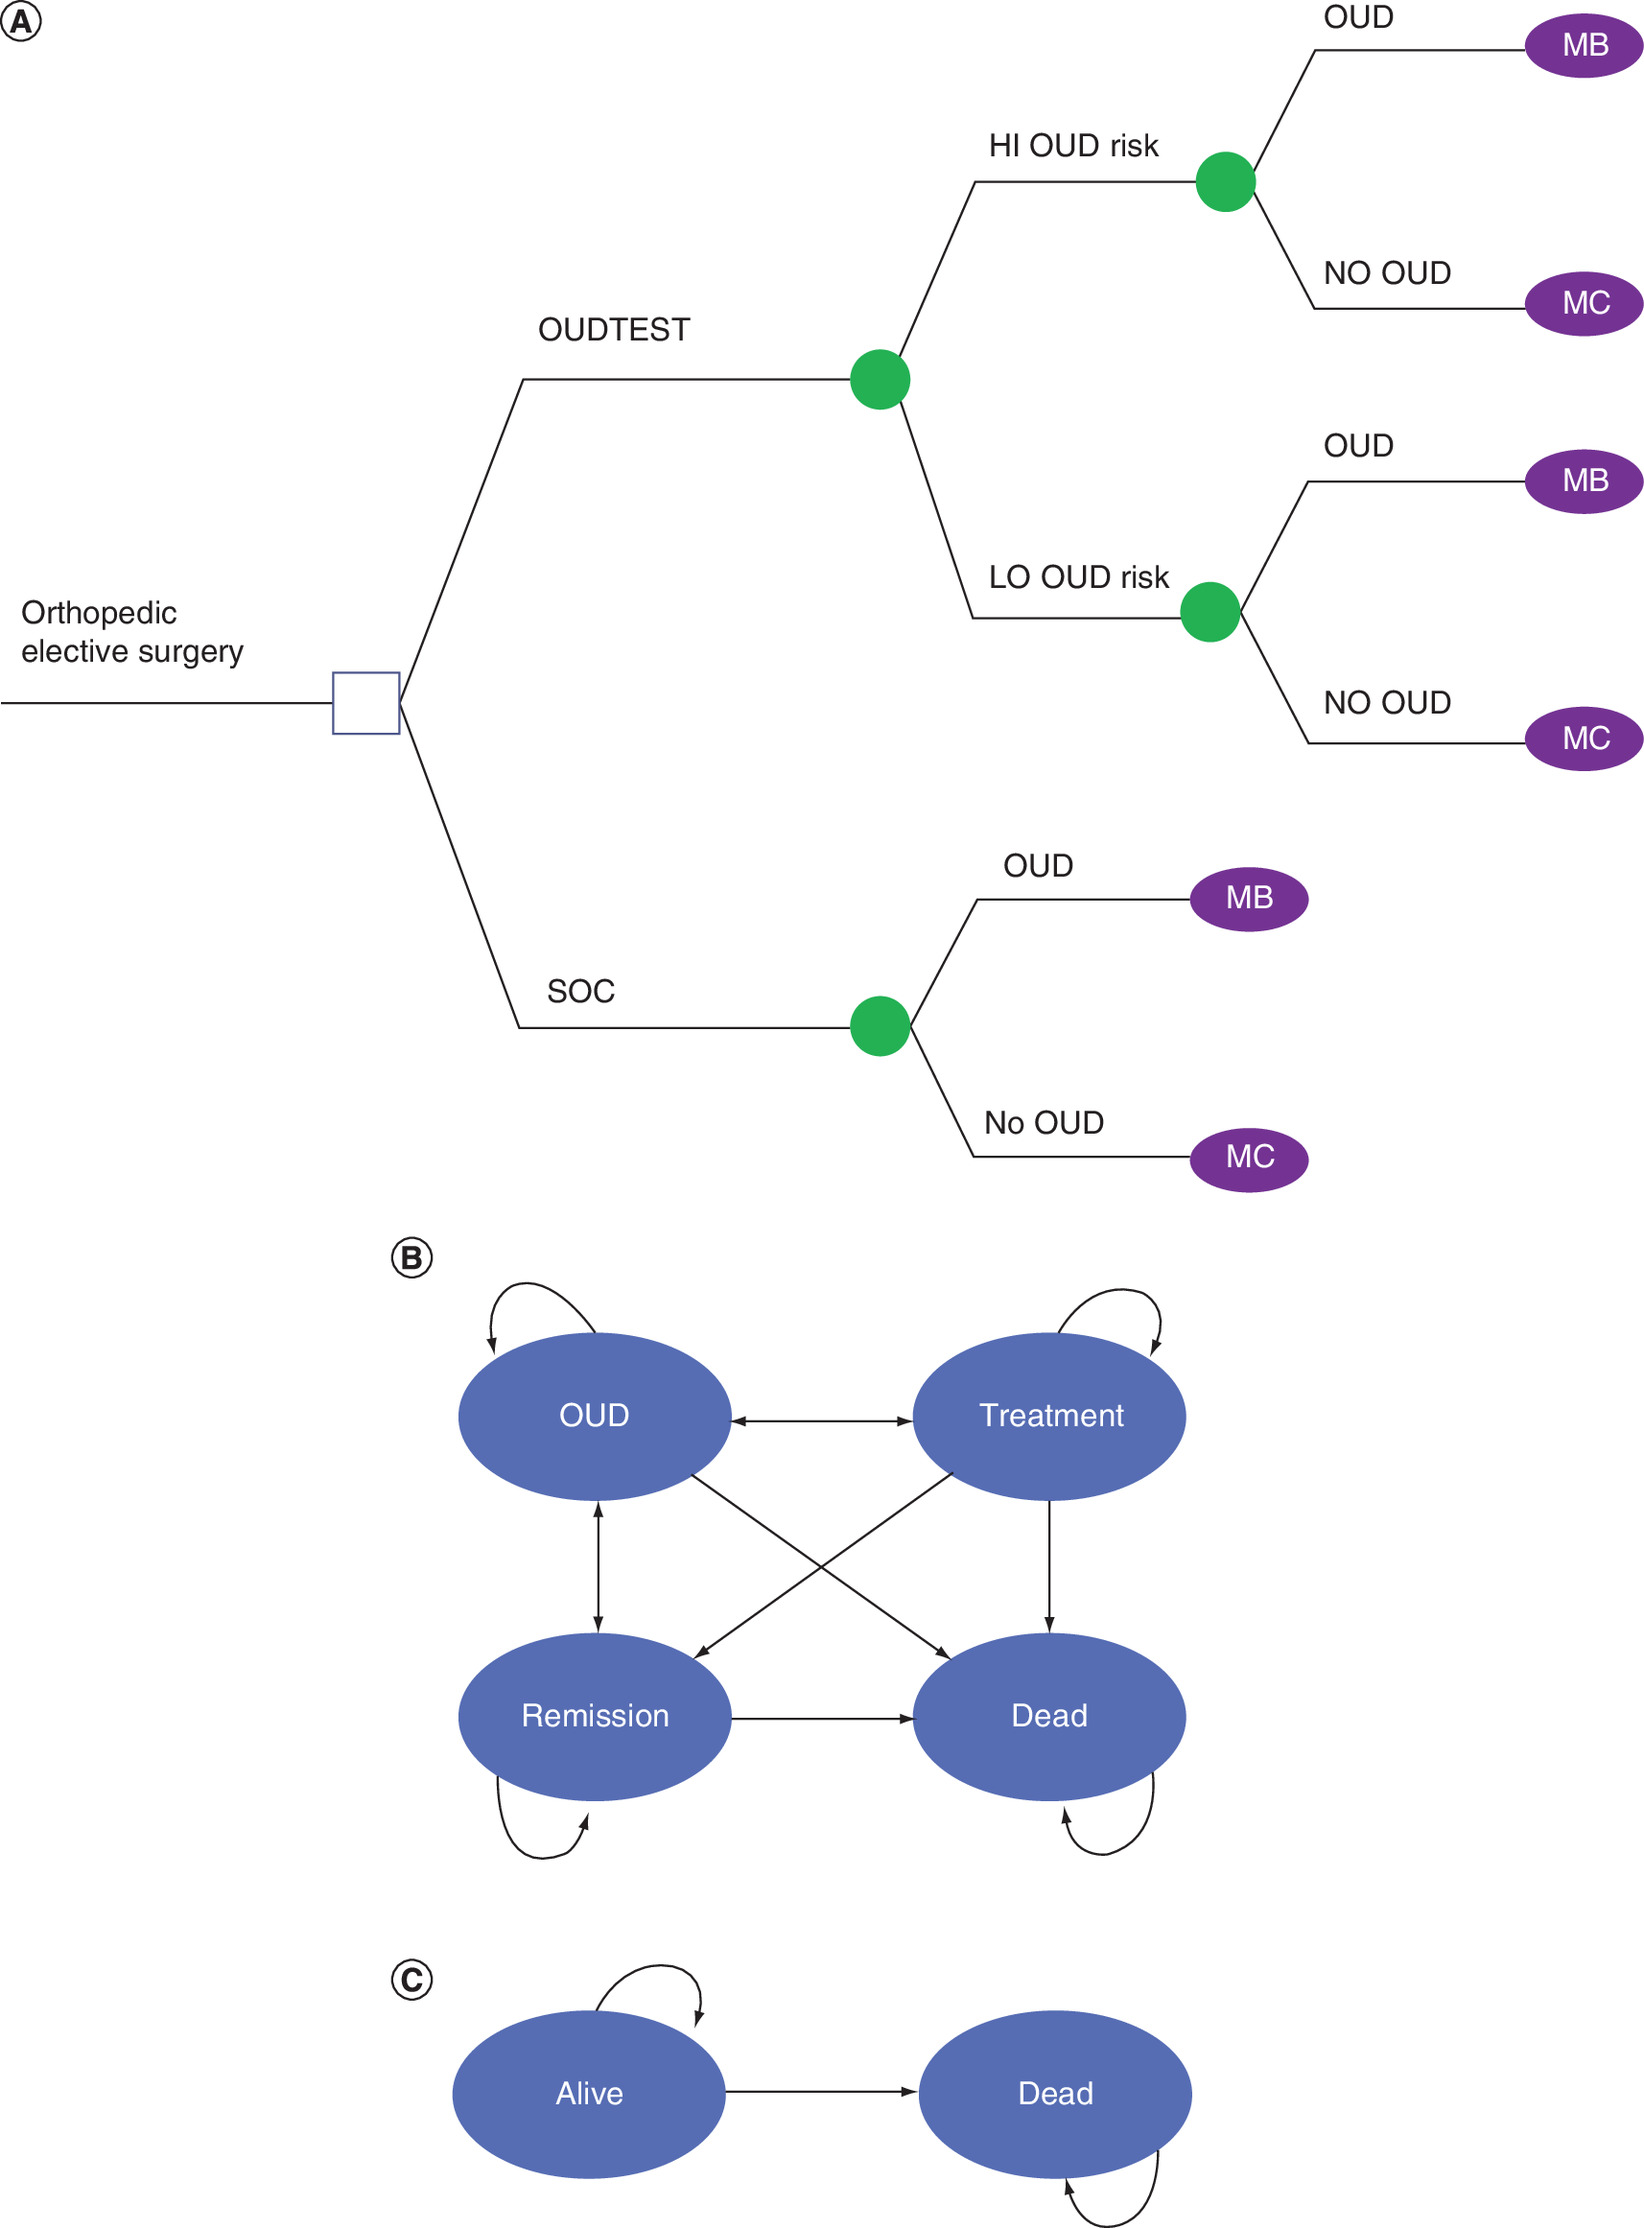
Figure 1. Model diagram.
(A) Hypothetical patients were assigned 1:1 to the OUDTEST or SOC treatment arms. All patients assigned to OUDTEST received the test and were assigned to either HI OUD Risk or LO OUD Risk based on the results. (B) MB: Hypothetical patients with OUD enter the following Markov process with the following health states: OUD, Treatment, Remission and Dead. The transition probabilities in Table 1 informed the transitions for each model cycle. (C) MC: Hypothetical patients without OUD enter the following Markov process with the following health states: Alive and Dead. The transition probabilities in Table 1 informed the transitions for each model cycle.
HI: High; LO: Low; OUD: Opioid use disorder; SOC: Standard of care.
Patients who did not develop OUD transitioned between two health states: Alive and Dead. Patients had a transition probability for moving between these health states with each time cycle. Dead was considered to be an absorbing health state.
Patients in the Remission, Alive, and Dead health states did not have an associated cost as the model was designed to explore incremental differences in cost as a result of diagnostic testing and treatment modification among patients at high risk of developing OUD. Patients receiving alternative pain management were considered to have a decrement in quality of life compared with patients treated with opioids for a period of time post-surgery. Labor productivity estimates accounted for orthopedic surgery and OUD health states separately. Patients in remission were considered to be working. Simulation models were generated from both the private insurance and self-insured employer perspectives accounting for the aggregated costs accrued in the 5 years following hospital discharge. The model was not designed to evaluate different OUD treatment regimens.
The primary outcome was the incremental cost–effectiveness ratio (ICER), expressed in 2019 United States Dollars (USD), per quality-adjusted life-year (QALY). Secondary outcomes included total costs and QALYS. The self-insured employer scenario added job absenteeism parameters into the simulation model. A 1-month cycle length was used in the analysis. The willingness-to-pay threshold was set at $50,000 and the discount rate at three percent. The economic simulation models were performed using TreeAge Pro 2020 (MA, USA). The research was exempt from IRB review under 45 CFR 46.101(b)(4).
Calculating cost–effectiveness
After costs and QALYs were calculated for the OUDTEST and SOC cohorts, ICER was calculated from the private insurance and self-insured employer perspectives. The only difference between these payer perspectives was the inclusion of lost labor productivity attributed to OUD in the self-insured employer perspective. Therefore, the ICERs OUDTEST and SOC cohorts were calculated as follows (Equation 1):
(Eq. 1)
The numerator in the ICER equation shows the incremental cost of adding the OUDTEST test relative to the SOC cohort. The denominator shows the incremental difference in QALYs.
Sensitivity & scenario analysis
A one-way deterministic sensitivity analysis was conducted to assess the sensitivity of the cost–effectiveness of OUDTEST to specific parameters. Markov chain Monte Carlo probabilistic sensitivity analysis (PSA) was performed to further assess the robustness of the results testing both first- and second-order uncertainty. In the PSA, the uncertainty of each model parameter was represented by a distribution around the point estimate. 10,000 model iterations with 10,000 unique hypothetical patients were performed by randomly sampling from each parameter distribution to obtain a full set of parameters, then model outputs were calculated and stored for each iteration. A beta distribution was used for transition and clinical parameters. A triangle distribution was used for cost and utility parameters. The distributions were created from the values and ranges reported in Table 1.
A one-way sensitivity analysis was conducted to assess the cost–effectiveness based on the 95% CI of the OUDTEST correctly identifying high-risk OUD patients. Models were generated evaluating the low (18.44%) and high (28.76%) end points of the confidence interval of risk of OUD incidence based on OUDTEST results for the private payer and self-insurer employer perspectives. To examine the influence of the health-state utility values on the cost–effectiveness results, a second one-way sensitivity analysis was performed varying the utility values based on the low and high end of the ranges reported from the private insurance perspective.
Scenario analysis was performed to examine the base case model under several different scenarios. A total of 12 scenario analyses were performed. The first six were from the perspective of the private insurer varying the time periods (3- and 10-year) and levels of physician noncompliance 25, 50, 75 and 100%. For this analysis, physician noncompliance was defined as the prescription of opioids for patients which were identified as high-risk for OUD using the OUDTEST. Scenarios seven through 12 repeated these scenarios from the perspective of the self-insured employer.
Results
A review of the literature revealed a median prevalence of OUD incidence post-orthopedic surgery of 4.95% which was used in the model (Table 1) [20,23,24,38,39]. Based on this incidence level, the OUDTEST was expected to be a dominant strategy for private insurance and self-insured employer perspectives over a 5-year period (Table 2). In the case of a dominant strategy, the ICER is not relevant and the incremental QALYs gained and decreased costs relative to typical opioid pain management practice were reported. Use of OUDTEST was associated with a $2510 and 2682 reduction in costs per patient for private insurers and self-insured employers compared with SOC, respectively. The expected gain in QALYS was 0.02 per patient for both payer perspectives compared with SOC.
| Strategy | Cost ($US) | Δ Cost | QALYS | Δ QALYs | ICER ($US/QALY) |
|---|---|---|---|---|---|
| Private insurance | |||||
| OUDTEST | 10,607 | -2510 | 3.71 | 0.02 | Dominant |
| SOC | 13,117 | Reference | 3.69 | Reference | Reference |
| Self-insured employer | |||||
| OUDTEST | 11,289 | -2682 | 3.71 | 0.02 | Dominant |
| SOC | 13,971 | Reference | 3.69 | Reference | Reference |
A dominant strategy is one that decreases costs and increases QALYs. A dominated strategy is one that increases costs and does not change or decreases QALYs.
ICER: Incremental cost–effectiveness ratio; OUD Opioid use disorder; QALY: Quality-adjusted life-year; SOC: Standard of care.
Sensitivity analyses
A one-way sensitivity analysis of the probability of OUDTEST being cost-effective based on the OUDTEST Test Probabilities based on the 95% CI indicated OUDTEST remained a dominant strategy from both the private insurer and self-insured employer perspectives (Table 4). Using the high end of the range (28.76%) OUDTEST revealed a cost reduction of $3240 for private insurers and $3461 for self-insured employers. The low end point and high end point probabilities for OUD incidence resulted in a 0.02 QALY increase in the private insurer and self-insured employer models.
| Strategy | Cost | Δ Cost | QALYS | Δ QALYs | ICER ($US/QALY) |
|---|---|---|---|---|---|
| Private insurance | |||||
| Scenario 1: time 3 years | |||||
| OUDTEST | 7194 | *1653 | 2.32 | 0.01 | Dominant |
| SOC | 8847 | Reference | 2.31 | Reference | Reference |
| Scenario 2: time 10 years | |||||
| OUDTEST | 17,765 | -4310 | 6.80 | 0.01 | Dominant |
| SOC | 22,075 | Reference | 6.79 | Reference | Reference |
| Scenario 3: physician noncompliance 25% | |||||
| OUDTEST | 13,137 | 20 | 3.71 | 0.02 | 1000 |
| SOC | 13,117 | Reference | 3.69 | Reference | Reference |
| Scenario 4: physician noncompliance 50% | |||||
| OUDTEST | 15,667 | 2550 | 3.71 | 0.002 | 127,500 |
| SOC | 13,117 | Reference | 3.69 | Reference | Reference |
| Scenario 5: physician noncompliance 75% | |||||
| OUDTEST | 18,198 | 5081 | 3.71 | 0.02 | 254,050 |
| SOC | 13,117 | Reference | 3.69 | Reference | Reference |
| Scenario 6: physician noncompliance 100% | |||||
| OUDTEST | 20,728 | 7611 | 3.71 | 0.02 | 380,550 |
| SOC | 13,117 | Reference | 3.69 | Reference | Reference |
| Self-insured employer | |||||
|---|---|---|---|---|---|
| Scenario 7: time 3 years | |||||
| OUDTEST | 7648 | -1767 | 2.32 | 0.01 | Dominant |
| SOC | 9415 | Reference | 2.31 | Reference | Reference |
| Scenario 8: time 10 years | |||||
| OUDTEST | 18,296 | -5232 | 6.80 | 0.01 | Dominant |
| SOC | 23,528 | Reference | 6.79 | Reference | Reference |
| Scenario 9: physician noncompliance 25% | |||||
| OUDTEST | 13,715 | -256 | 3.71 | 0.02 | Dominant |
| SOC | 13,971 | Reference | 3.69 | Reference | Reference |
| Scenario 10: physician noncompliance 50% | |||||
| OUDTEST | 16,140 | 2169 | 3.71 | 0.02 | 108,450 |
| SOC | 13,971 | Reference | 3.69 | Reference | Reference |
| Scenario 11: physician noncompliance 75% | |||||
| OUDTEST | 18,566 | 4595 | 3.71 | 0.02 | 229,750 |
| SOC | 13,971 | Reference | 3.69 | Reference | Reference |
| Scenario 12: physician noncompliance 100% | |||||
| OUDTEST | 22,542 | 8571 | 3.71 | 0.02 | 428,550 |
| SOC | 13,971 | Reference | 3.69 | Reference | Reference |
A dominant strategy is one that decreases costs and increases QALYs. A dominated strategy is one that increases costs and does not change or decreases QALYs.
ICER: Incremental cost–effectiveness ratio; OUD Opioid use disorder; QALY: Quality-adjusted life-year; SOC: Standard of care.
| Strategy | Cost ($US) | Δ Cost | QALYS | Δ QALYs | ICER ($US/QALY) |
|---|---|---|---|---|---|
| Private insurance low (18.44%) | |||||
| OUDTEST | 11,230 | -1887 | 3.71 | 0.02 | Dominant |
| SOC | 13,117 | Reference | 3.69 | Reference | Reference |
| Private insurance high (28.76%) | |||||
| OUDTEST | 9877 | -3240 | 3.71 | 0.02 | Dominant |
| SOC | 13,117 | Reference | 3.69 | Reference | Reference |
| Self-insured employer low (18.44%) | |||||
| OUDTEST | 11,954 | -2017 | 3.71 | 0.02 | Dominant |
| SOC | 13,971 | Reference | 3.69 | Reference | Reference |
| Self-insured employer high (28.76%) | |||||
| OUDTEST | 10,510 | -3461 | 3.72 | 0.03 | Dominant |
| SOC | 13,971 | Reference | 3.69 | Reference | Reference |
The one-way sensitivity results examining the probability of determining a patient is at high risk for developing OUD was varied by the 95% Confidence Interval. For the private insurance and self-employed insured models, the OUDTEST remains a dominant strategy (costs less and increases QALYs) compared with the SOC strategy.
ICER: Incremental cost–effectiveness ratio; OUD Opioid use disorder; QALY: Quality-adjusted life-year; SOC: Standard of care.
A second one-way sensitivity analysis varying the health-state utility values from the private insurer perspective indicated OUDTEST was either a dominant strategy or cost less with an equivalent QALYs across all health-state utility values (Table 5). The difference in QALYs between OUDTEST and SOC ranged from 0.00 to 0.02. When the utility value was adjusted to the low end of the range for remission and OUD, OUDTEST was expected to cost less and result in the same number of QALYs. Similarly, when the health-state utility value was set to the high end of the range for Treatment, OUDTEST was expected to cost less and result in the same number of QALYs.
| Treatment state | Δ QALYs | ICER ($US/QALY) |
|---|---|---|
| Alive - low | 0.01 | Dominant |
| Alive - high | 0.02 | Dominant |
| Remission - low | 0.00 | Costs less; same QALY |
| Remission - high | 0.01 | Dominant |
| Treatment - low | 0.01 | Dominant |
| Treatment - high | 0.00 | Costs less; same QALY |
| OUD - low | 0.00 | Costs less; same QALY |
| OUD - high | 0.01 | Dominant |
ICER: Incremental cost–effectiveness ratio; OUD: Opioid use disorder; QALY: Quality-adjusted life-year.
Figure 2A & B show the scatterplot of the ICER values from all hypothetical patients in the model. OUDTEST was expected to be a dominant strategy in 71.1 and 93.7% of the hypothetical patients from the private insurer and self-insured employer perspectives, respectively. OUDTEST was a cost-effective strategy using a willingness to pay threshold of $50,000 or less per QALY gained in 72.7 and 93.9% of the hypothetical patients from the private insurer and self-insured employer perspectives, respectively.
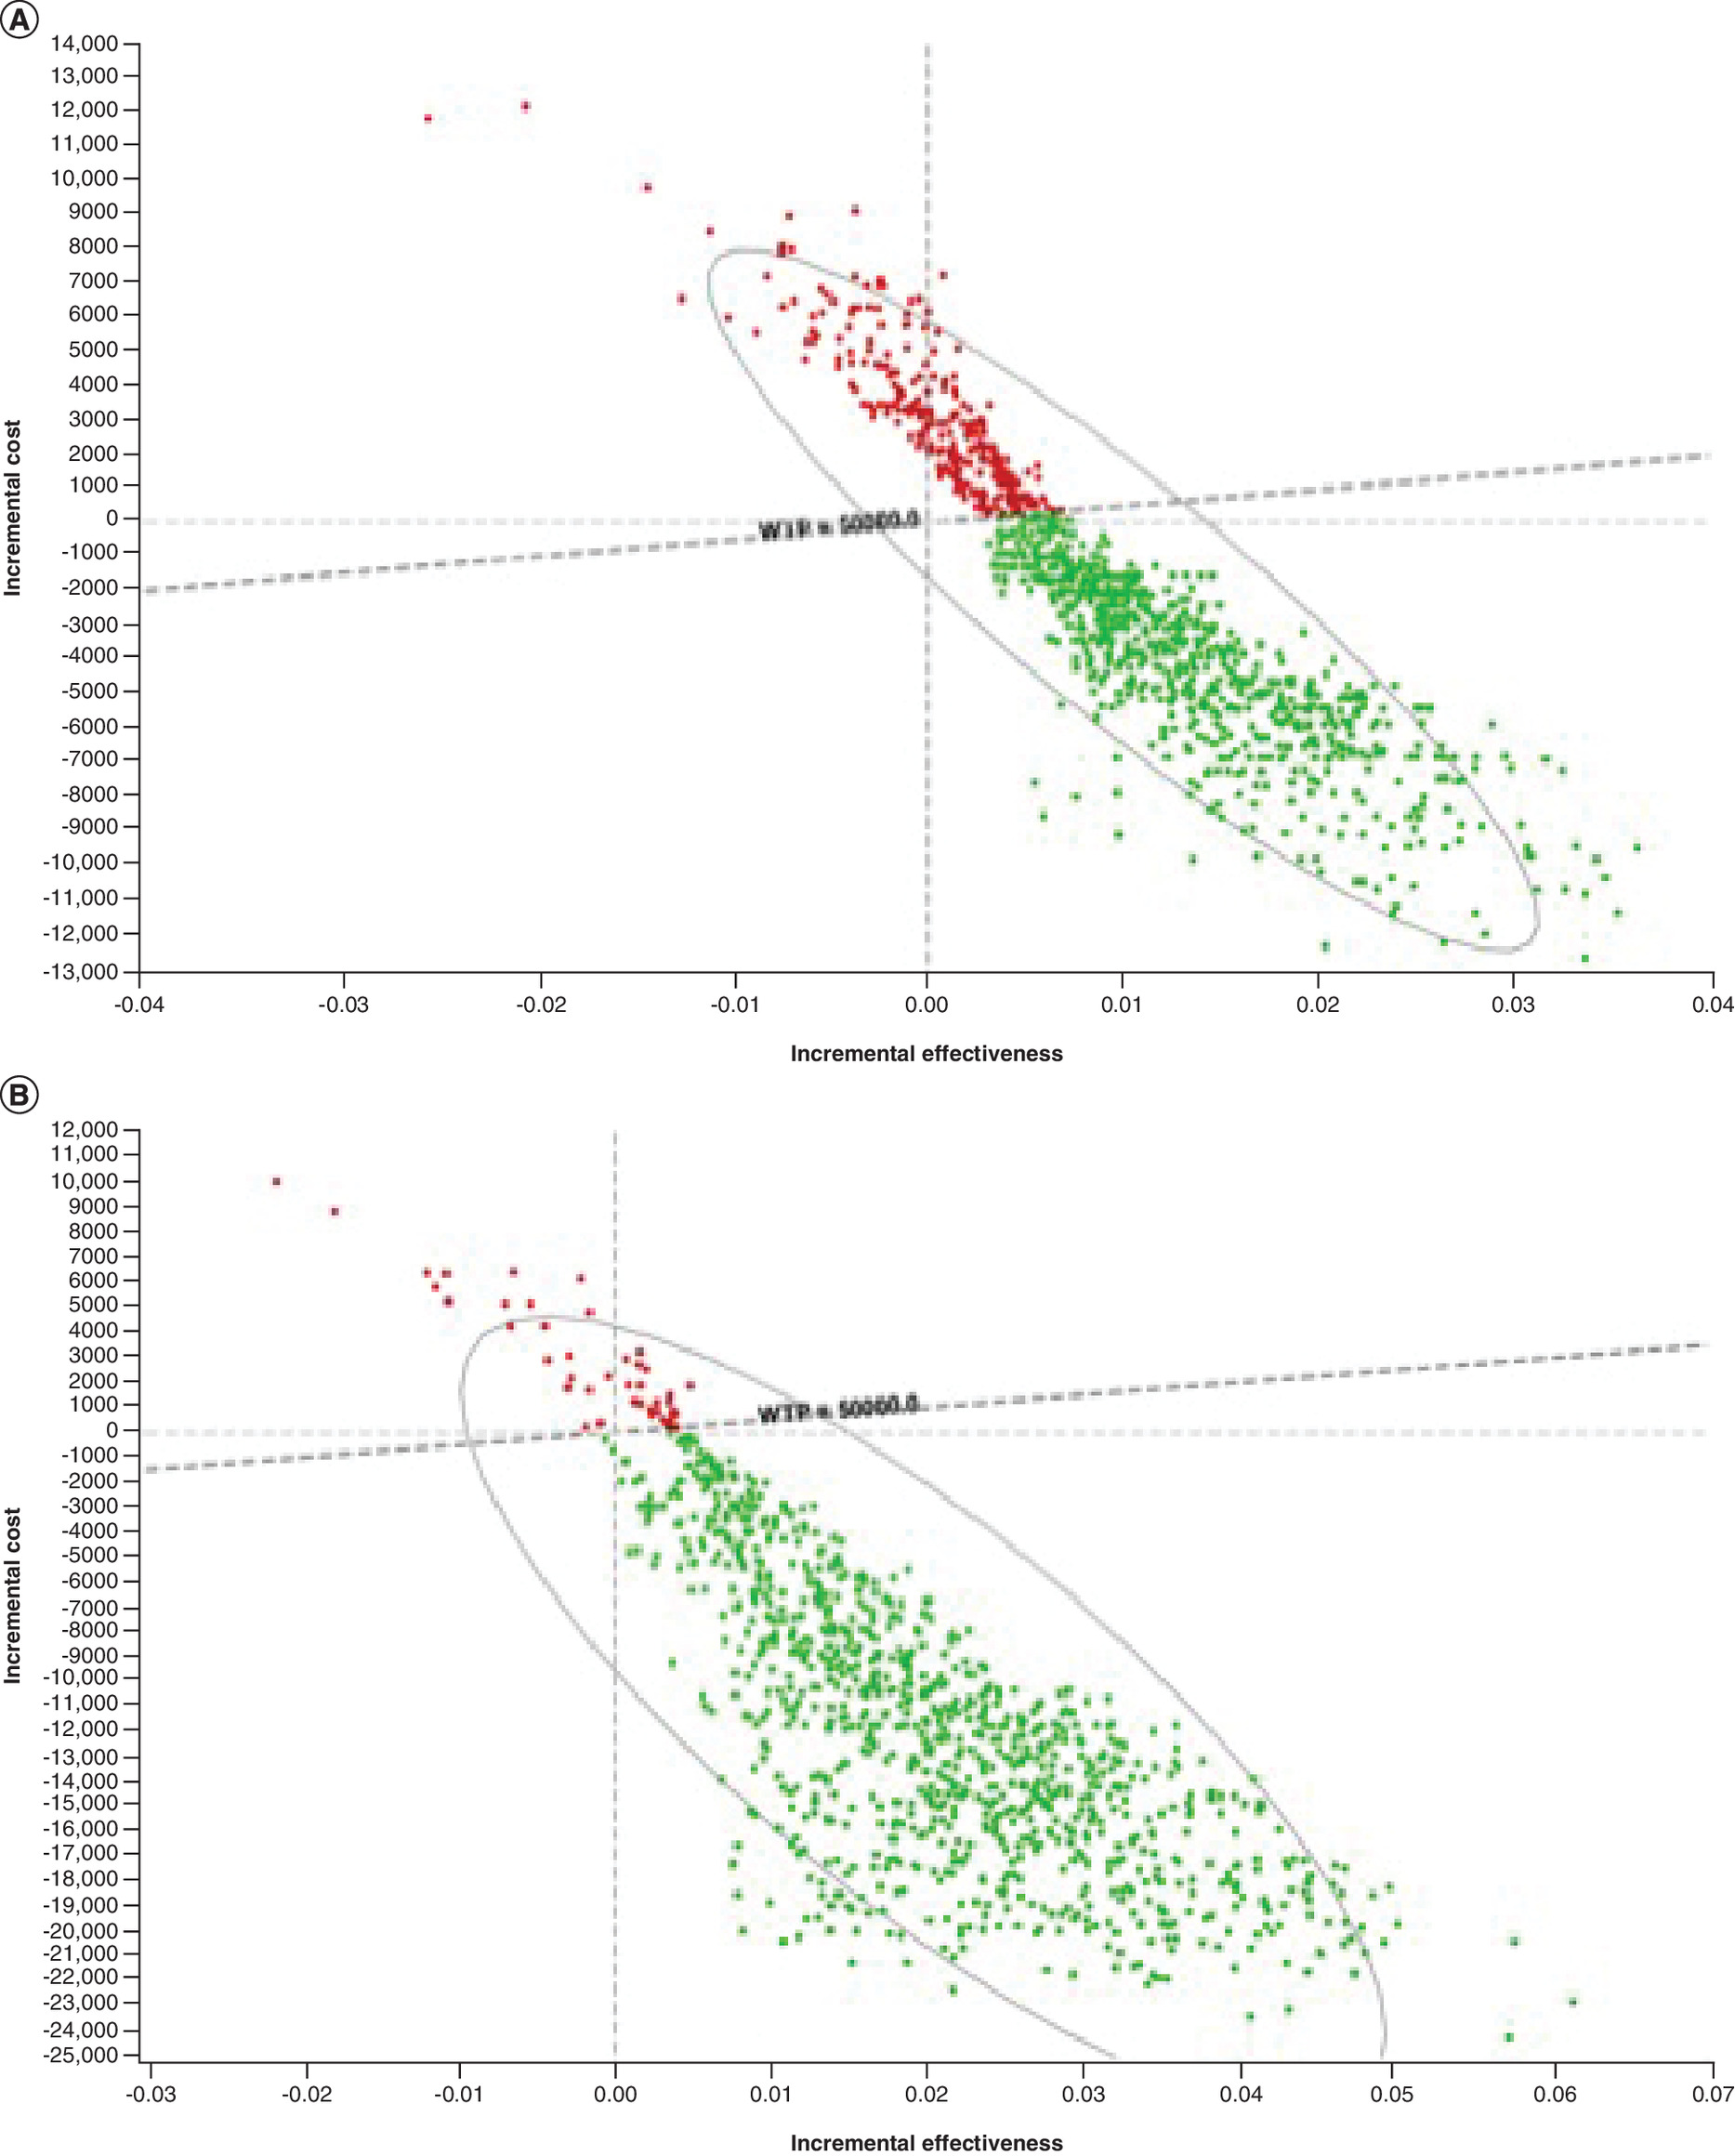
Figure 2. Cost-effectiveness results, private insurance and self-insured employer perspectives.
(A) Cost–effectiveness results of hypothetical patients, private insurance perspective. Each dot on the cost–effectiveness plane represents the result of hypothetical patient. The green dots (93.7%) represent all hypothetical patients were below the willingness-to-pay threshold of $50,000/QALY. The red dots (6.3%) represent the hypothetical patients above the willingness-to-pay threshold. (B) Cost–effectiveness results of hypothetical patients, self-insured employer perspective.
Each dot on the cost–effectiveness plane represents the result of hypothetical patient. The green dots (93.9%) represent all hypothetical patients were below the willingness-to-pay threshold of $50,000/QALY. The red dots (6.1%) represent the hypothetical patients above the willingness-to-pay threshold.
QALY: Quality-adjusted life-year.
Scenario analyses
OUDTEST remained a dominant strategy compared with SOC when changing the time period after surgery to 3- and 10-years for both the private insurer and self-insured employer perspectives (Table 3; Scenarios 1, 2, 7 and 8). The scenario analyses revealed the cost–effectiveness results were sensitive to varying levels of physician compliance to the OUDTEST test output. For the private insurers, OUDTEST continued to be cost-effective at a 25% noncompliance level (ICER = $1000/QALY; Scenario 3). However, OUDTEST was not cost-effective at physician non-compliance levels of 50% (Scenario 4; ICER = $127,500/QALY), 75% (Scenario 5; ICER = $254,050/QALY) and 100% (Scenario 6; ICER = $380,550). From the self-insured perspective, OUDTEST was a dominant strategy when varying time periods and when physician noncompliance was 25% (Scenarios 7–9). At higher levels of physician noncompliance, OUDTEST was not cost-effective. The ICERs were $108,450/QALY, $229,750/QALY and $428,550 for Scenarios 10, 11 and 12, respectively.
Discussion
The use of OUDTEST, as a means to identify patients at high risk of developing OUD and modifying postsurgical pain management, appeared to be a dominant strategy compared with prescribing opioid pain management therapy for all. Results were similar from the private insurer and self-employed perspective with job absenteeism added. A decrease in OUD cases postsurgery despite a higher up-front cost associated with the OUDTEST test contributed the most the lower costs and improved QALYs.
In the orthopedic population approximately 1 in 20 patients are likely to develop OUD after using opioids for postsurgical pain management with potential for life-long addiction [20,23,24,38,39]. The relatively high sensitivity and specificity of OUDTEST allowed for identification of high-risk patients susceptible to OUD. The provision of non-opioid pain management in this population resulted in the lower costs and improved QALYs across different lengths of follow-up time periods and was robust to one-way sensitivity analyses of the OUDTEST test and changes to the health-state utility values.
It might be suggested that non-opioid based postoperative pain management be used for all orthopedic patients. However, this is approach would be considered an unrealistic treatment option. Orthopedic physicians have used opioids for decades in postoperative pain management [22]. There may be resistance to changing their practice patterns due to limitations of prior assessment tools including the time to administer and lack of specificity. More importantly, current evidence-based guidelines recommend an individualized approach to pain management with inclusion of opioids as one of many options [22]. The risk of developing OUD is a multifaceted problem including psychological, social and biological factors. The OUDTEST will provide the physician objective information on the genetic risk of OUD risk and allow the development of an individualized approach to postoperative pain management.
Physician compliance with altering their pain management practices had the greatest effect on the results. If physicians do not adhere to the test results and prescribe non-opioid pain therapy to patients identified as high risk for OUD, the OUDTEST is no longer a cost-effective strategy. Physician compliance is a concern as many subjective risk assessment tools previously used have been shown to suffer from insufficient accuracy according to the CDC [49,50]. Therefore, a physician may be rooted in their own practices or succumb to patient demands and not follow the results of the OUDTEST diagnostic test. The limitations of prior assessments, strong desires to eliminate patient pain, and habit may be barriers to physician compliance. The objective nature of the OUDTEST may facilitate physician adoption along with larger clinical studies demonstrating its effectiveness. Though it may take time to adjust prior norms, the use of a one-time objective genetic diagnostic test, OUDTEST, offers physicians an objective means to change practice.
Use of an objective validated diagnostic screening tool for OUD may be novel, but is not for other conditions such as alcohol screening in emergency and outpatient settings, hepatitis C screening in adolescents, and screening for abdominal aortic aneurysms in males with a history of smoking. For example, one study found that screening at age 65 saved $260 per patient and increased 0.018 QALYs in a male population with prior history of smoking [51].
The genetic-based OUDTEST screens for the predisposition to a behavior, substance use. OUDTEST may provide important diagnostic information for both the orthopedic physician and the patient. However, genetic tests raise a few important concerns. First, the patient may suffer increased short-term physical pain from an alternative pain management program. Presumably the physician and patient will have a discussion regarding the best pain management course where the OUDTEST results are one of several considerations prior to deciding a pain management strategy. Further, the patient may have reservations about taking the OUDTEST due to possible use of the results beyond the decision to determine a pain management course. A patient may be concerned that results may be used by the insurance company or another entity in a negative manner. It was outside of the scope of this study to address the ethical considerations of genetic testing. In situations where, orthopedic physicians and patients are likely to change their pain management practices, OUDTEST was expected to save private insurers and self-employed insurers money and increase the quality of life for their beneficiaries.
Limitations
There are several important limitations associated with cost–effectiveness analyses. First, the study results are based on a clinical study of the OUDTEST to determine the probability of being at risk for developing for developing OUD disorder. The results of this study are predicated on the same limitations found in Donaldson (2021) [37]. One important note is all participants in the clinical trial consented to the OUDTEST. Our model started with this assumption and did not consider the costs or effects if a patient refused the OUDTEST. Second, while the model attempted to capture the key features of OUD treatment pathways, there are too many possibilities without necessitating simplifying assumptions, such as not allowing patients to switch insurers or employers during the follow-up period. Bias arising from these assumptions was mitigated by applying all assumptions equally to the OUDTEST cohort and SOC cohort. Thus, the cost–effectiveness results observed should be due to the knowledge obtained from the diagnostic test. Third, the long-term transition probabilities, costs, utilities, and utilization were obtained from the published literature. Therefore, they do not reflect the actual data from those that participated in the clinical study. The uncertainty in the results arising from this limitation was described in the sensitivity and scenario analysis allowing a more robust understanding of the potential cost–effectiveness of the OUDTEST. Fourth, the results of this analysis are limited to a general orthopedic population seeking elective surgery. Caution is warranted in attempting to generalize further. Finally, this analysis was based on a hypothetical patient population informed by the results of a randomized clinical trial. However, the trial did not follow patients for 5 years or track their costs. Based on our results, a longer randomized trial incorporating economic end points is justified.
Conclusion
The novel and robust machine learning diagnostic tool was expected to be a cost-effective solution in the campaign against OUD. The current challenges and high expenses associated with uncertain treatment programs merit investigation of preventative measures that may allow physicians and patients to seek non-opioid based pain management strategies if the risk of OUD is high. Results from this study indicated that, in addition to the demonstrated clinical utility, OUDTEST may be an economically sound option for private insurance companies and self-insured employers and warrants further dissemination.
•
Opioid use disorder (OUD) is a real and prevalent risk after orthopedic surgery.
•
Physicians must balance the challenge of properly addressing the acute pain from surgery and the risk of developing OUD.
•
Pain management guidelines suggest a personalized approach to postsurgical pain. However, few tools are available to assist the physician to develop a personalized approach.
•
A novel and robust machine learning algorithm for OUD assessment that analyzes fifteen alleles involved in the brain reward pathway has been shown to accurately assess a patient’s risk level of developing OUD.
•
To assess the value of this diagnostic test, a cost–utility analysis was performed from the perspectives of the insurance company and self-insured employer for those undergoing orthopedic surgery.
•
The results indicate that the diagnostic test was cost-saving and improved quality-adjusted life years.
•
Sensitivity analyses determined that physician compliance with altering a patient who may be at high risk of developing OUD was the most important parameter in determining if the diagnostic test was cost-effective.
•
This diagnostic tool may provide a clinically and economically sound option for physicians seeking to personalize postsurgical pain management and reduce the risk of their patient developing OUD.
Author contributions
PJ Mallow and KW Belk conceptualized the study design, conducted the analysis, interpreted the results and have contributed substantially to the final version of the manuscript and have approved it in its final form.
Financial & competing interests disclosure
Funding support for this study was provided by SOLVD Health, Inc. The funding agreement ensured the authors' independence in interpreting the data, writing and publishing the article. Health Clarity Solutions, LLC is a paid consultant to SOLVD Health, Inc. Peter J. Mallow is a paid consultant to Health Clarity Solutions, LLC. The authors have no other relevant affiliations or financial involvement with any organization or entity with a financial interest in or financial conflict with the subject matter or materials discussed in the manuscript apart from those disclosed.
No writing assistance was utilized in the production of this manuscript.
Data sharing statement
All data generated or analyzed during this study are available upon request.
Supplementary Material
File (appendix a.docx)
- Download
- 23.45 KB
References
Papers of special note have been highlighted as: • of interest; •• of considerable interest
1.
Schieber LS, Guy GP, Seth P. Trends and patterns of geographic variation in opioid prescribing practices by state, United States, 2006–2017. JAMA Netw. Open 2(3), e190665 (2019).
2.
Guy GP Jr, Zhang K, Bohm MK et al. Vital signs: changes in opioid prescribing in the United States, 2006–2015. MMWR Morb. Mortal. Wkly. Rep. 66(26), 697–704 (2017).
3.
CDC, Drug Overdose. Prescription opioid overdose death maps. https://www.cdc.gov/drugoverdose/deaths/prescription/maps.html
4.
CDC, National Center for Health Statistics. 2020. Wide-ranging online data for epidemiologic research (WONDER). http://wonder.cdc.gov
5.
Brummett CM, Evans-Shields J, England C et al. Increased health care costs associated with new persistent opioid use after major surgery in opioid-naive patients. J. Manag. Care Spec. Pharm. 1–12 (2021).
6.
Florence CS, Zhou C, Luo F, Xu L. The economic burden of prescription opioid overdose, abuse, and dependence in the United States, 2013. Med. Care 54(10), 901–906 (2016).
7.
Hah JM, Bateman BT, Ratliff J, Curtin C, Sun E. Chronic opioid use after surgery: implications for perioperative management in the face of the opioid epidemic. Anesth. Analg. 125(5), 1733–1740 (2017).
8.
Wyles CC, Hevesi M, Trousdale ER et al. The 2018 Chitranjan S. Ranawat, MD Award: developing and implementing a novel institutional guideline strategy reduced postoperative opioid prescribing after TKA and THA. Clin. Orthop. Relat. Res. 477(1), 104–113 (2019).
9.
Rudd RA, Seth P, David F, Scholl L. Increases in drug and opioid-involved overdose deaths - United States, 2010–2015. MMWR Morb. Mortal. Wkly. Rep. 65(50–51), 1445–1452 (2016).
10.
Larochelle MR, Liebschutz JM, Zhang F, Ross-Degnan D, Wharam JF. Opioid prescribing after nonfatal overdose and association with repeated overdose. Ann. Intern. Med. 165(5), 376–377 (2016).
11.
Wunsch H, Wijeysundera DN, Passarella MA, Neuman MD. Opioids prescribed after low-risk surgical procedures in the United States, 2004–2012. JAMA 315(15), 1654–1657 (2016).
12.
Calcaterra SL, Yamashita TE, Min SJ, Keniston A, Frank JW, Binswanger IA. Opioid prescribing at hospital discharge contributes to chronic opioid use. J. Gen. Intern. Med. 31(5), 478–485 (2016).
13.
Alam A, Gomes T, Zheng H, Mamdani MM, Juurlink DN, Bell CM. Long-term analgesic use after low-risk surgery: a retrospective cohort study. Arch. Intern. Med. 172(5), 425–430 (2012).
14.
Sun EC, Darnall BD, Baker LC, Mackey S. Incidence of and risk factors for chronic opioid use among opioid-naive patients in the postoperative period. JAMA Intern. Med. 176(9), 1286–1293 (2016).
15.
Quinlan J, Rann S, Bastable R, Levy N. Perioperative opioid use and misuse. Clin. Med. (Lond.) 19(6), 441–445 (2019).
16.
Coluzzi F, Bifulco F, Cuomo A et al. The challenge of perioperative pain management in opioid-tolerant patients. Ther. Clin. Risk Manag. 13, 1163–1173 (2017).
17.
Gulur P, Nelli AH. The Opioid-tolerant patient: opioid optimization. J. Arthroplasty 35(6S), S50–S52 (2020).
18.
Sceats LA, Ayakta N, Merrell SB, Kin C. Drivers, Beliefs, and Barriers Surrounding surgical opioid prescribing: a qualitative study of surgeons' opioid prescribing habits. J. Surg. Res. 247, 86–94 (2020).
19.
Sabatino MJ, Kunkel ST, Ramkumar DB, Keeney BJ, Jevsevar DS. Excess opioid medication and variation in prescribing patterns following common orthopaedic procedures. J. Bone Joint Surg. Am. 100(3), 180–188 (2018).
20.
Chen JH, Humphreys K, Shah NH, Lembke A. Distribution of opioids by different types of medicare prescribers. JAMA Intern. Med. 176(2), 259–261 (2016).
21.
Morris BJ, Mir HR. The opioid epidemic: impact on orthopaedic surgery. J. Am. Acad. Orthop. Surg. 23(5), 267–271 (2015).
22.
Soffin EM, Waldman SA, Stack RJ, Liguori GA. An evidence-based approach to the prescription opioid epidemic in orthopedic surgery. Anesth. Analg. 125(5), 1704–1713 (2017).
23.
Inacio MC, Hansen C, Pratt NL, Graves SE, Roughead EE. Risk factors for persistent and new chronic opioid use in patients undergoing total hip arthroplasty: a retrospective cohort study. BMJ Open 6(4), e010664 (2016).
24.
Zarling BJ, Yokhana SS, Herzog DT, Markel DC. Preoperative and postoperative opiate use by the arthroplasty patient. J. Arthroplasty 31(10), 2081–2084 (2016).
25.
Soffin EM, Lee BH, Kumar KK, Wu CL. The prescription opioid crisis: role of the anaesthesiologist in reducing opioid use and misuse. Br. J. Anaesth. 122(6), e198–e208 (2019).
26.
Bicket MC, Brat GA, Hutfless S, Wu CL, Nesbit SA, Alexander GC. Optimizing opioid prescribing and pain treatment for surgery: review and conceptual framework. Am. J. Health Syst. Pharm. 76(18), 1403–1412 (2019).
27.
Johnson RL, Amundson AW, Abdel MP et al. Continuous posterior lumbar plexus nerve block versus periarticular injection with Ropivacaine or Liposomal Bupivacaine for total hip arthroplasty: a three-arm randomized clinical trial. J. Bone Joint Surg. Am. 99(21), 1836–1845 (2017).
28.
Thiels CA, Anderson SS, Ubl DS et al. Wide variation and over prescription of opioids after elective surgery. Ann. Surg. 266(4), 564–573 (2017).
29.
Blanco C, Volkow ND. Management of opioid use disorder in the USA: present status and future directions. Lancet 393(10182), 1760–1772 (2019).
30.
Klimas J, Gorfinkel L, Fairbairn N et al. Strategies to identify patient risks of prescription opioid addiction when initiating opioids for pain: a systematic review. JAMA Netw. Open 2(5), e193365 (2019).
31.
Crist RC, Reiner BC, Berrettini WH. A review of opioid addiction genetics. Curr. Opin. Psychol. 27, 31–35 (2019).
32.
Berrettini W. A brief review of the genetics and pharmacogenetics of opioid use disorders. Dialogues Clin. Neurosci. 19(3), 229–236 (2017).
33.
Kringel D, Ultsch A, Zimmermann M et al. Emergent biomarker derived from next-generation sequencing to identify pain patients requiring uncommonly high opioid doses. Pharmacogenomics J. 17(5), 419–426 (2017).
34.
Wang SC, Chen YC, Lee CH, Cheng CM. Opioid addiction, genetic susceptibility, and medical treatments: a review. Int. J. Mol. Sci. 20(17), 4294 (2019).
35.
Elmallah RK, Ramkumar PN, Khlopas A et al. Postoperative pain and analgesia: is there a genetic basis to the opioid crisis? Surg. Technol. Int. 32, 306–314 (2018).
36.
Donaldson K, Demers L, Taylor K, Lopez J, Chang S. Multi-variant genetic panel for genetic risk of opioid addiction. Ann. Clin. Lab. Sci. 47(4), 452–456 (2017).
•• Demonstrates the viability of a genetic diagnostic test for identifying individuals who may be at an increased risk of developing opioid use disorder.
37.
Donaldson K, Cardamone D, Genovese M, Garbely J, Demers L. Clinical performance of a gene-based machine learning classifier in assessing risk of developing OUD in subjects taking oral opioids: a prospective observational study. Ann. Clin. Lab. Sci. 51(4), 451–460 (2021).
•• This was the clinical study that validated the use of a genetic test for accurately screening for the risk of opioid use disorder (OUD). The results of this analysis are based on this test.
38.
Politzer CS, Kildow BJ, Goltz DE, Green CL, Bolognesi MP, Seyler TM. Trends in opioid utilization before and after total knee arthroplasty. J. Arthroplasty 33(7S), S147–S153 e141 (2018).
• Highlights the substantial risk of developing OUD postorthopedic procedure.
39.
Kim KY, Anoushiravani AA, Chen KK, Roof M, Long WJ, Schwarzkopf R. Preoperative chronic opioid users in total knee arthroplasty-which patients persistently abuse opiates following surgery? J. Arthroplasty 33(1), 107–112 (2018).
• Highlights the substantial risk of developing OUD postorthopedic procedure.
40.
US Bureau of Labor Statistics (BLS). Labor Force Statistics from the Current Population Survey, 2019. https://www.bls.gov
41.
White AG, Spittle T, Fernan C, Billmyer E, Marrett E, Kwong WJ et al. Assessment of work loss associated with prescription-related opioid use disorder. JOEM 62(2), 217–222 (2020).
42.
Krebs E, Min JE, Evans E, Li L, Liu L, Huang D et al. Estimating state transitions for opioid use disorders. Med. Decis. Making 37, 483–497 (2017).
43.
Evans E, Li L, Min J, Huang D, Urada D, Liu L et al. Mortality among individuals accessing pharmacological treatment for opioid dependence in California, 2006–10. Addiction 110, 996–1005 (2015).
44.
Social Security Administration. Actuarial Life Table. 2016. https://www.ssa.gov/oact/STATS/table4c6.html
45.
Institute for Clinical and Economic Review (ICER). Abuse-deterrent formulations of opioids: effectiveness and value. https://www.icer.org
46.
Frank JW, Carey E, Nolan C et al. Increased nonopioid chronic pain treatment in the veterans' health administration, 2010–2016. Pain Med. 20(5), 869–877 (2019).
47.
Scarpati LM, Kirson NY, Jia ZB, Wen J, Howard J. Opioid abuse: a detailed examination of cost drivers over 24-Month follow-up period. J. Manag. Care Spec. Pharm. 23(11), 1110–1115 (2017).
48.
Jalali A, Ryan DA, Jeng PJ, McCollister KE, Leff JA, Lee JD et al. Health-related quality of life and opioid use disorder pharacotherapy: a secondary analysis of a clinical trial. Drug Alchol. Depend. 1(215), 108221 (2020).
49.
Jones CM, Paulozzi LJ, Mack KA. Sources of prescription opioid pain relievers by frequency of past-year nonmedical use United States, 2008–2011. JAMA Intern. Med. 174(5), 802–803 (2014).
50.
Webster LR, Webster RM. Predicting aberrant behaviors in opioid-treated patients: preliminary validation of the opioid risk tool. Pain Med. 6(6), 432–442 (2005).
51.
Phiri D, Mallow PJ, Rizzo JA. The cost-effectiveness of hand-held ultrasound screening for abdominal aortic aneurysm in older males with a history of smoking. JHEOR 1(2), 96–107 (2013).
Information & Authors
Information
Published In
Pages: 1349 - 1361
PubMed: 34672212
Copyright
© 2021 Future Medicine Ltd.
History
Received: 13 May 2021
Accepted: 6 October 2021
Published online: 21 October 2021
Keywords:
Topics
Authors
Metrics & Citations
Metrics
Article Usage
Article usage data only available from February 2023. Historical article usage data, showing the number of article downloads, is available upon request.
Citations
How to Cite
Cost–utility analysis of single nucleotide polymorphism panel-based machine learning algorithm to predict risk of opioid use disorder. (2021) Journal of Comparative Effectiveness Research. DOI: 10.2217/cer-2021-0115
Export citation
Select the citation format you wish to export for this article or chapter.
Citing Literature
- Yue Zhang, Ziwei Lin, Yot Teerawattananon, Katika Akksilp, Alec Morton, Yi Wang, Thittaya Prapinvanich, Thamonwan Dulsamphan, Wenjia Chen, The value for money of artificial intelligence-empowered precision medicine: a systematic review and regression analysis, npj Digital Medicine, 10.1038/s41746-025-02259-w, 9, 1, (2025).
- Tuukka Hakkarainen, Haavisto Ira, Leskelä Riikka-Leena, Methodological approaches in the economic evaluation of prognostic and predictive companion diagnostics: a systematic scoping review, Expert Review of Pharmacoeconomics & Outcomes Research, 10.1080/14737167.2025.2519744, 25, 7, (1037-1049), (2025).
- Nanna Kastrup, Annette W. Holst-Kristensen, Jan B. Valentin, Landscape and challenges in economic evaluations of artificial intelligence in healthcare: a systematic review of methodology, BMC Digital Health, 10.1186/s44247-024-00088-7, 2, 1, (2024).
- Jai Vithlani, Claire Hawksworth, Jamie Elvidge, Lynda Ayiku, Dalia Dawoud, Economic evaluations of artificial intelligence-based healthcare interventions: a systematic literature review of best practices in their conduct and reporting, Frontiers in Pharmacology, 10.3389/fphar.2023.1220950, 14, (2023).
- Scott F. Farrell, Pik-Fang Kho, Mischa Lundberg, Adrián I. Campos, Miguel E. Rentería, Rutger M.J. de Zoete, Michele Sterling, Trung Thanh Ngo, Gabriel Cuéllar-Partida, A Shared Genetic Signature for Common Chronic Pain Conditions and its Impact on Biopsychosocial Traits, The Journal of Pain, 10.1016/j.jpain.2022.10.005, 24, 3, (369-386), (2023).