An economic evaluation of reducing colorectal cancer surveillance intensity
Publication: Journal of Comparative Effectiveness Research
Abstract
Aim: Analyze the impact of national implementation of ‘low intensity’ post-treatment colorectal cancer surveillance compared with current practices. Materials & methods: Create a population-level Markov model to estimate impacts of expansion of low versus high intensity surveillance post-treatment on healthcare utilization, costs and caregiver time loss. Results: Shifting to low intensity colorectal cancer surveillance would reduce patient burden by 301,830 h per patient annually over 5 years. Cost reductions over 5 years were US$43.5 million for Medicare and US$4.2 million for Medicaid. Total societal cost savings equaled US$104.2 million. Conclusion: National implementation of low intensity post-treatment colorectal cancer surveillance has the potential to significantly reduce burden and costs on patients and their caregivers with no added risks to health.
Colorectal cancer (CRC) is estimated to affect more than 140,000 patients in the USA [1]. Optimal surveillance care can lessen the impact of CRC on survivors in remission. Surveillance by carcinoembryonic antigen (CEA) tests or CT scans provides patients and physicians with critical information about the likelihood of recurrence and survivorship care. While optimal frequency of surveillance testing is not known, recent work helps to provide some evidence on this issue [2]. For example, intensity of CRC surveillance may not be associated with either increased rates of detection of CRC recurrence, the rate at which patients undergo resection for recurrence, or survival [2]. If more frequent surveillance does not translate into better health outcomes than lower frequency surveillance, as suggested by Snyder and colleagues [2], then a national rollout of a low-intensity CRC surveillance strategy has the potential to impart substantial benefits via fewer annual number of CEA tests and CT scans, lower missed work time and travel costs, and accrue direct medical cost savings for patients and payers.
This paper estimates the economic impact of reducing the intensity of CRC surveillance via less frequent CEA tests and CT scans. CEA tests and CT scans are used to detect cancer recurrence during the 3 years after completion of CRC treatment. This study modeled the impacts of the changes in surveillance estimated by Snyder and colleagues [2] from the patient, family, employer and payer perspectives over a 5-year time period. This paper summarizes primary findings of this analysis, summarizes the Snyder and colleagues’ methods and findings, describes the modeling methods for this study, and presents results of the impact analysis.
Overview of Snyder et al.
Snyder and colleagues [2] used a retrospective cohort study design to investigate health outcomes-time to detection of CRC recurrence, rate of recurrence, resection for recurrence-for patients with different intensities of CRC post-treatment surveillance. The authors used data abstracted as part of the Commission on Cancer Special Study merged with records from the National Cancer Database (NCD). The study used a random sample of 8529 stage I–III CRC patients from the NCD who were treated at 1175 different facilities. Initial treatment began in 2006 and patients were followed until 2014. The NCD is one of the largest and most comprehensive cancer databases in the world. The authors estimated a random effects regression to predict the number of CEA tests and CT scans expected to occur in a facility based on patient characteristics. Facilities were classified as either ‘high intensity’ or ‘low intensity’. ‘High-intensity’ facilities were ones where the observed number of tests or scans exceeded the regression-expected number of tests or scans and all others were ‘low intensity’. Patients were classified as having received high- or low-intensity surveillance based on the facilities where they obtained treatment. Statistical significance was determined based on a p-value threshold of 0.05.
The study found no differences between patients in the low- versus high-intensity surveillance groups in baseline tumor characteristics (colon vs rectum; tumor size, stage, histology or grade; or treatment sequence). Analyses also demonstrated that high-intensity facilities were more likely than low-intensity facilities to be community-based facilities with patients who had lower incomes. Patients in high-intensity facilities had traveled further for CEA than those in low-intensity facilities. There were no differences in travel distance for imaging between high- and low-intensity facilities [2].
In the 3 years after surgery, low-intensity facilities conducted, on average, 1.63 CEA tests and 1.63 CT scans per patient, whereas high-intensity facilities conducted 4.37 CEA tests and 2.87 CT scans. The authors found no statistically significant association between the surveillance intensity and detection of recurrence for both tests (hazard ratio [HR] = 1.00 for CEA, p = 0.84; HR = 0.99 for CT scan, p = 0.98). The authors also found neither statistically significant differences in the proportion of patients who underwent resection for recurrence at 3 or 5 years by surveillance intensity (HR = 1.12 for CEA tests, p = 0.30; HR = 1.22 for CT scans, p = 0.06) nor statistically significant differences in 5- and 7-year survival rates by surveillance intensity (HR = 0.96 for CEA tests, p = 0.96; HR = 1.01 for CT scans, p = 0.86) [2].
Materials & methods
To analyze the potential national impact of patients receiving post-treatment surveillance after curative resection of CRC, we constructed a population-level Markov model. We used findings from Snyder et al. [2] to analyze the impacts of expanding low-intensity surveillance from the perspectives of the patient, family, employer and payer over 5 years (Figure 1). Each year of the model, a new cohort of patients enters the model at the surgical resection node shown in Figure 1. Patients receive either status quo (SQ) surveillance, which reflects the average of high- and low-intensity surveillance observed in Snyder et al. [2], or low-intensity surveillance for the duration of the surveillance regime. Each new cohort undergoes a surveillance regime, which lasts 3 years for patients who have undergone surgical resection. Patients stay in surveillance or face an all-cause risk of death for 3 years. Surviving patients receive surveillance for a maximum of 3 years. Adhering to the findings of the Snyder et al. [2] paper, the study team assumed no differences in mortality between the two surveillance strategies.
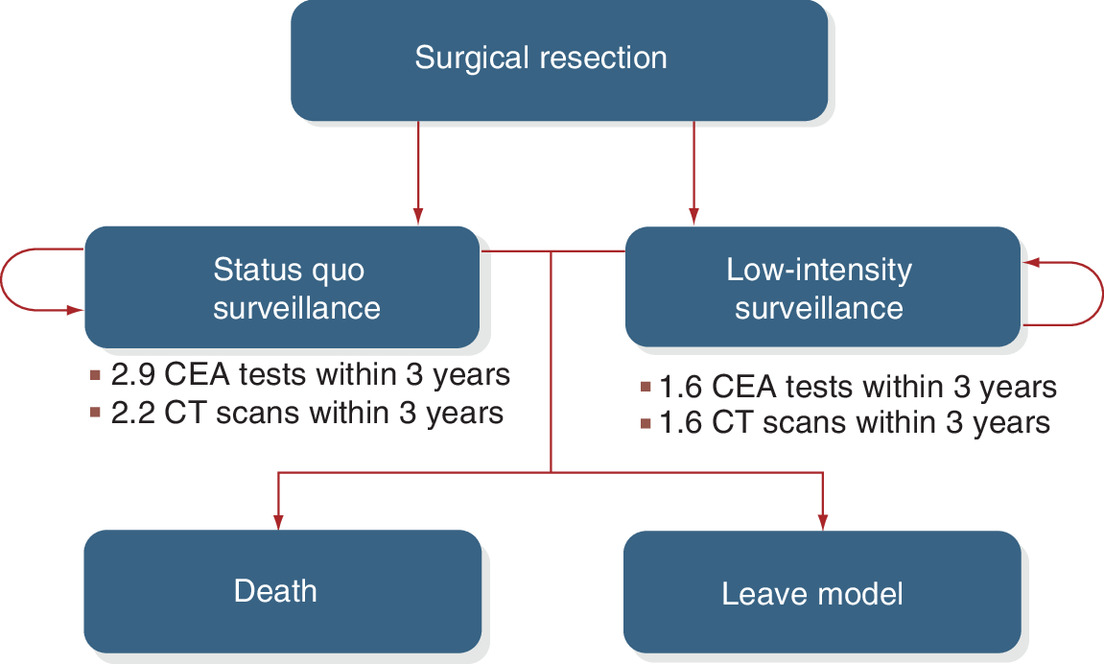
Figure 1. Markov model of post-surgical surveillance for patients with colorectal cancer resection.
CEA: Carcinoembryonic antigen.
Model parameters
We identified model parameters from publicly available data sources and the literature. The input values were reviewed and updated to reflect the input of a clinical expert. A full list of the model parameters and their sources can be found in the Supplementary material.
Population & clinical parameters
To estimate the base year population of patients undergoing resection, we applied the rate of resection [3] to the population of adults 18 and older in the United States and used SEER to estimate the number of patients eligible for low-intensity CRC surveillance [4,5]. We calculated the number of tests and scans for patients in the SQ strategy by weighting the average numbers of tests and scans of low-intensity and high-intensity patients by the numbers of low-intensity and high-intensity patients, respectively. The 5-year survival probability, 73.7 percent, was obtained from Snyder et al. [2] and converted to an annual rate [6].
Healthcare cost parameters
Healthcare cost parameters included patient copayments and direct medical costs for CEA tests and CT scans [7–9]. We used physician charges and reimbursements by Medicare and large private health plans, expected patient cost sharing for outpatient oncology care, and out of pocket costs for the uninsured from the published literature [7]. We derived direct medical cost estimates, such as the costs for CEA tests and CT scans borne by payers, from the Medicare Clinical Laboratory Fee Schedule, the Medicare Physician Fee Schedule, and the published literature [8,9]. The Medicare Fee Schedules provide a listing of fees Medicare uses to pay physicians for their services.
Productivity cost parameters
Informal healthcare sector costs include patient time and travel costs and the value of unpaid caregiving provided by family members. We first estimated patient and family wait and travel time for each appointment. We assumed the annual number of appointments is equal to the maximum of the annual number of CEA tests and the annual number of CT scans because patients can receive both services in the same visit. We used estimates of combined wait and travel time for CRC patients [10].
To avoid double-counting, other patient time-related losses, such as time lost from work, were excluded. However, productivity losses to employers were included. We assumed this non-healthcare sector cost to employers could be estimated as the value of productivity when an employee misses work to obtain medical care. Approximately 44% of CRC patients are older than 65 years, so employer productivity losses were estimated only for CRC patients younger than 65 years. The wage rate assumed for patients was also used to value employer productivity losses. To estimate costs to employers of missed work, we valued patient wait and travel time using a nationally representative median wage rate, including fringe benefits of 30%, of US$29.95 [11,12]. Travel costs for patients were based on the mileage reported in Snyder et al., applying a reimbursement rate of US$0.55 per mile [2]. To estimate the amount of unpaid caregiving provided by families, we assumed 41 percent of patients would be accompanied by a family member based on the rate of patient accompaniment found in observational studies [13]. The value of family members’ caregiving time was assumed to be US$16.90 per h, the 2018 median wage rate of nursing and home health aides, including fringe benefits [14].
Total societal costs were calculated as the sum of patient, payer and family costs. Societal cost estimates do not include employers’ productivity losses to avoid double counting of costs already accounted for and valued as patient-time costs. All costs were in 2018 dollars; future costs and outcomes were not discounted.
One-way & PSAs
We programmed the CRC model to conduct a series of one-way sensitivity analyses for all model parameters. Ranges for these parameters were either obtained from the literature, where the 95% CI was assumed to be the upper and lower bounds of the published parameter value or varied by ±20%. We produced tornado diagrams (Figures 2 & 3) to visually assess the sensitivity of model outcomes to varying each parameter individually across its plausible range, holding all other parameters at their baseline values.
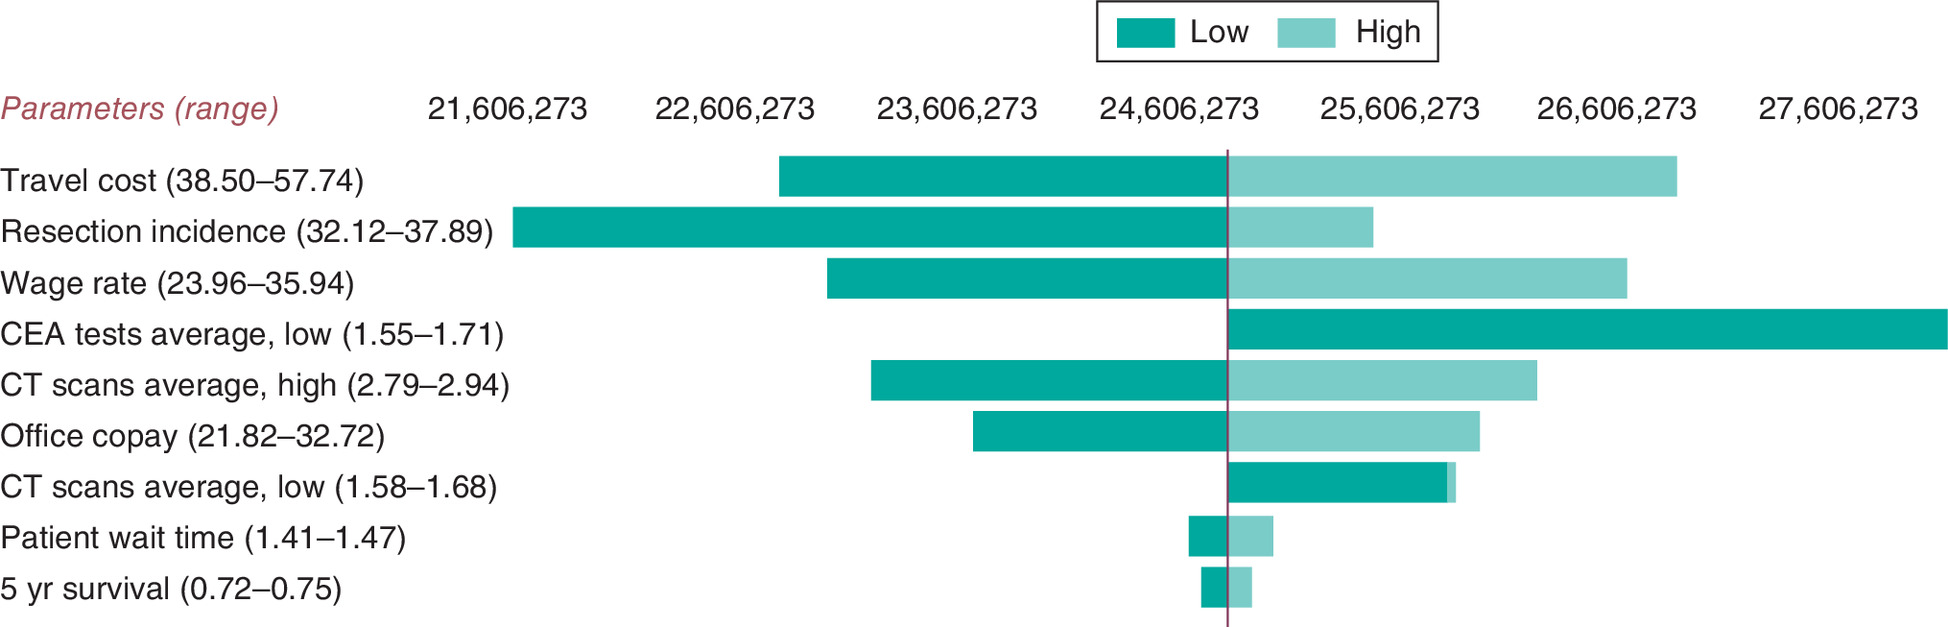
Figure 2. Tornado diagram of estimated colorectal cancer patient total costs showing one-way sensitivity analysis results for most impactful parameters, 5-year time horizon.
CEA: Carcinoembryonic antigen.
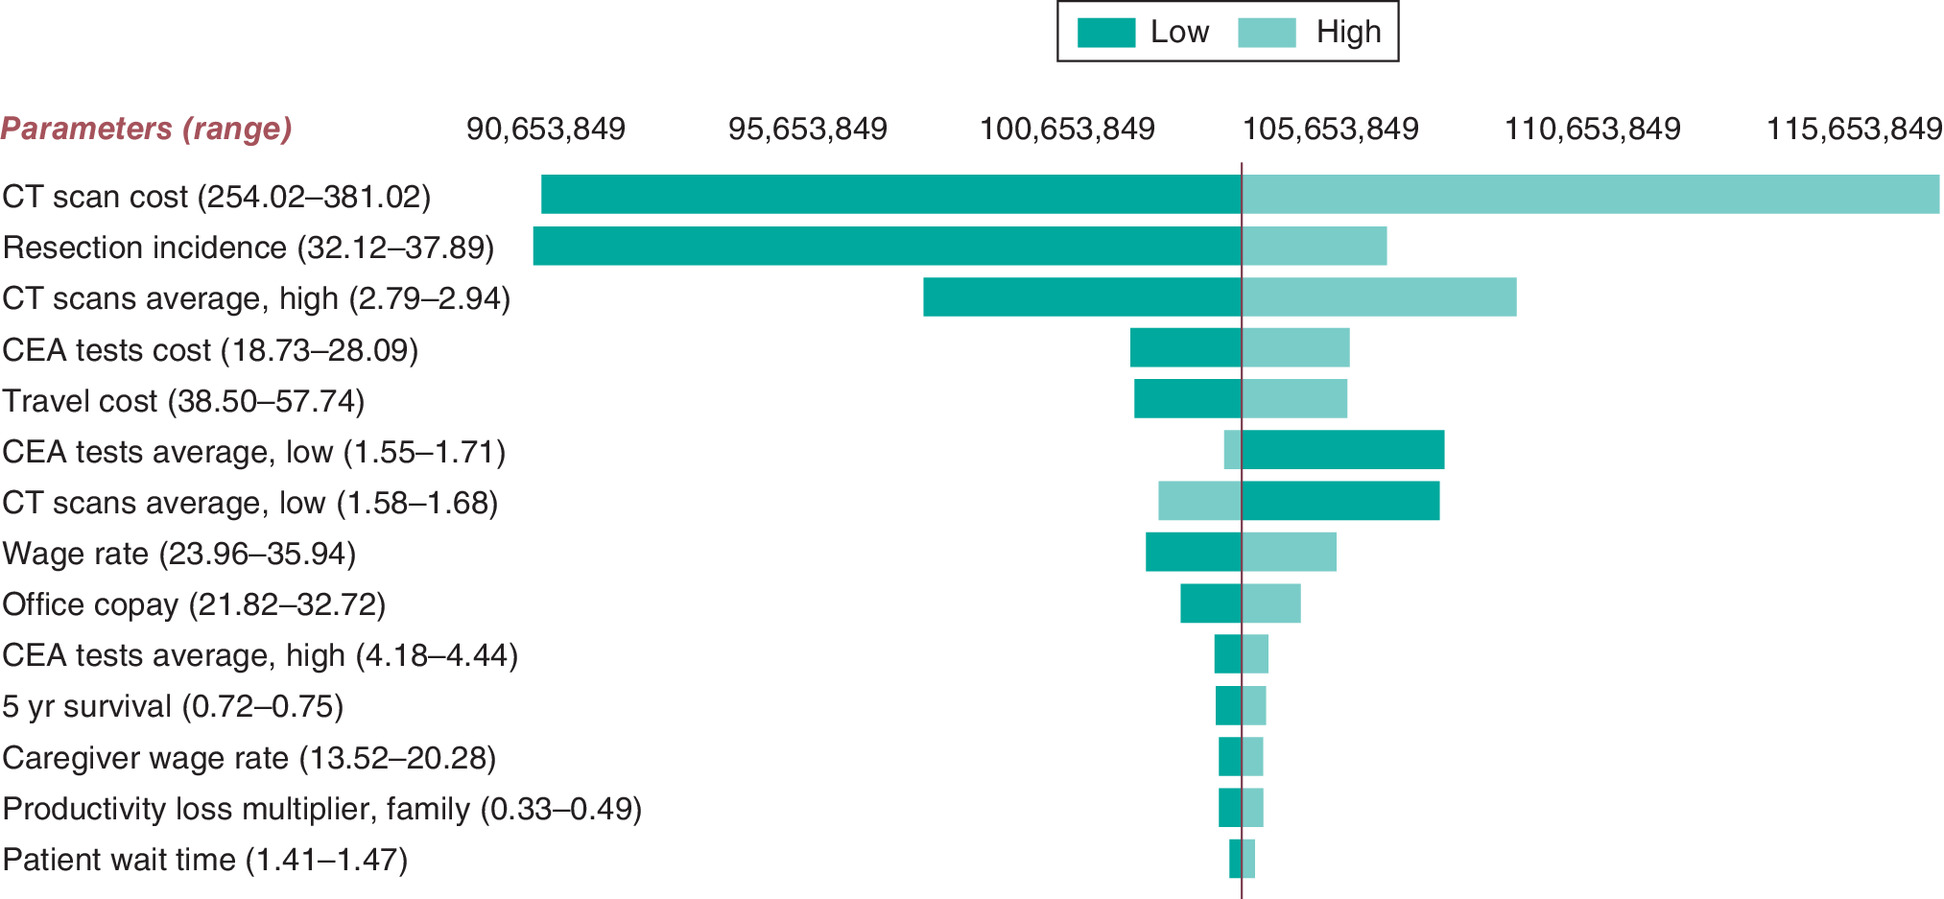
Figure 3. Tornado diagram of estimated societal costs for colorectal cancer patients showing one-way sensitivity analysis results for most impactful parameters, 5-year time horizon.
CEA: Carcinoembryonic antigen.
In addition to one-way sensitivity analyses, we conducted probabilistic sensitivity analyses (PSAs) to analyze how parameter uncertainty affects model results. We assumed a distribution for all parameters used in the impact analysis and simultaneously drew 1000 values for the analysis parameters from the assumed distributions to develop a distribution for each impact considered (e.g., CT scan costs). See Supplementary material. We conducted an additional scenario analysis extending the surveillance regime out through 5 years to examine the difference in impact relative to the default assumption of 3 years of surveillance because the clinical expert noted it is not uncommon for surveillance to last 5 years.
Economic impacts over 1-, 2- and 10-year time horizons were also analyzed.
Results
Our model estimated that approximately 90,000 individuals began undergoing CRC treatment each year. Individuals within the model underwent a 3-year surveillance regime to approximate the duration of CRC care. Over 5 years we estimated that 467,000 patients would undergo CRC postresection surveillance (Table 1).
| Outcome | A. Current practice | B. Low intensity surveillance | Difference (A - B) | Annual savings per patient |
|---|---|---|---|---|
| Utilization | ||||
| Curative resections | 467,210 | |||
| CEA tests | 1,010,600 | 562,290 | 448,320 | 0.96 |
| CT scans | 772,330 | 562,290 | 210,040 | 0.45 |
| Patient perspective | ||||
| Patient time, hours | 1,109,830 | 808,010 | 301,830 | 0.65 |
| Time and travel costs | $70,403,680 | $51,256,930 | $19,146,760 | $41 |
| Out-of-pocket medical costs | $21,061,290 | $15,333,530 | $5,727,760 | $12 |
| Total costs | $91,464,970 | $66,590,460 | $24,874,520 | $53 |
| Payer perspective | ||||
| Total payer costs | $268,886,750 | $191,700,070 | $77,186,680 | $165 |
| Medicare costs | $151,383,240 | $107,927,140 | $43,456,100 | $165 |
| Medicaid costs | $14,687,940 | $10,471,620 | $4,216,320 | $165 |
| Other payer costs | $102,815,570 | $73,301,310 | $29,514,260 | $165 |
| Family perspective | ||||
| Hours of unpaid caregiving | 456,140 | 332,090 | 124,050 | 0.27 |
| Total unpaid caregiving costs | $7,708,770 | $5,612,320 | $2,096,450 | $4.50 |
| Employer perspective | ||||
| Hours of absenteeism | 483,890 | 352,290 | 131,600 | 0.28 |
| Total productivity losses | $14,492,390 | $10,551,090 | $3,941,300 | $8.40 |
| Societal perspective | ||||
| Total healthcare sector costs | $289,948,040 | $207,033,600 | $82,914,440 | $177 |
| Total societal costs† | $368,060,490 | $263,902,850 | $104,157,650 | $223 |
Time horizon is 5 years and the surveillance strategy is for 3 years. Analysis assumes the low-intensity colorectal cancer surveillance as defined in Snyder et al. [2] is extended to all stage I–III US colorectal cancer patients. Analysis assumes any patients currently receiving high-intensity surveillance would all be shifted to low-intensity surveillance.
†
Total costs from the societal perspective includes the following: healthcare sector costs (payer spending, patient spending), informal healthcare sector costs (travel and time costs, family costs for unpaid caregiving) and nonhealthcare sector costs of productivity losses for patients.
CEA: Carcinoembryonic antigen.
Findings indicate that a national rollout of a low-intensity strategy has the potential to reduce the number of CEA tests and CT scans by 448,320 and 210,040 over 5 years, respectively. We found patients would gain 301,830 h of time as a result of fewer appointments for CRC surveillance, or about 0.65 h per patient per year.
Fewer tests translated into direct medical cost savings. Payers would incur US$77.2 million less in medical costs for CEA tests and CT scans, with the largest share of medical cost savings going to Medicare (US$43.5 million). Patients would have lower out-of-pocket costs, saving a total of US$5.7 million.
Other cost savings were US$19.1 million for avoided medical appointments and travel costs, US$2.1 million in avoided unpaid caregiving for medical visits, and US$3.9 million in employer costs for missed work. Total societal cost savings were US$104.2 million, including US$24.9 million for patients, US$77.2 million to payers and US$2.1 million for families. Approximately 80% of the societal cost savings were healthcare cost savings to payers and patients.
Sensitivity analyses
To assess the sensitivity of these findings to the analysis assumptions, we first conducted one-way sensitivity analyses for total patient and societal costs; results for the 5-year time horizon are depicted in tornado diagrams (Figures 2 & 3). Total patient costs are most sensitive to travel costs followed by variation in the resection incidence and the wage rate used to value patient time. Note that the ‘CEA test average-low’ bar is one-sided because this calculation is included in the weighted average for the SQ scenario, meaning higher numbers of tests can skew the differences between the SQ and low-intensity strategies. From the societal perspective, CT scan costs have the greatest impact followed by resection incidence.
We also conducted PSA, using 1000 iterations of the model to obtain credible ranges for the 5-year cost savings estimates (Table 2). The number of CEA tests averted varied from 405,840 to 496,420, and the resulting total cost savings for patients ranged between US$21.4 million and US$30.7 million. From a societal perspective, total cost savings ranged from US$90.4 million to US$127.9 million.
| Outcome | Impacts avoided or cost savings | Credible range lower bound | Credible range upper bound |
|---|---|---|---|
| Utilization | |||
| Number of CEA tests | 448,320 | 405,840 | 496,420 |
| Number of CT scans | 210,040 | 188,580 | 232,730 |
| Patient perspective | |||
| Patient time, hours | 301,830 | 275,540 | 359,990 |
| Time and travel costs | US$19,146,760 | US$16,285,050 | US$24,050,550 |
| Out-of-pocket medical costs | US$5,727,760 | US$4,652,960 | US$7,370,660 |
| Total costs | US$24,874,520 | US$21,462,340 | US$30,720,080 |
| Payer perspective | |||
| Total payer costs | US$77,186,680 | US$62,852,230 | US$95,734,610 |
| Family perspective | |||
| Hours of unpaid caregiving | 124,050 | 109,290 | 151,390 |
| Total unpaid caregiving costs | US$2,096,450 | US$2,963,450 | US$5,004,420 |
| Employer perspective | |||
| Hours of absenteeism | 131,600 | 116,340 | 160,550 |
| Total productivity losses | US$3,941,300 | US$3,156,680 | US$5,261,650 |
| Societal perspective | |||
| Total direct medical costs | US$82,914,440 | US$68,240,470 | US$102,602,560 |
| Total societal costs | US$104,157,650 | US$90,368,650 | US$127,854,010 |
CEA: Carcinoembryonic antigen.
Table 3 presents model results for various time horizons proportionate to the 5-year results. The 10-year time horizon produced costs that were roughly 2.2-times the 5-year horizon. We expect further extrapolation to be consistent with this finding.
| Analysis perspective | |||||
|---|---|---|---|---|---|
| Time horizon | Patient | Payer | Employer | Family | Societal† |
| 1 year | US$2,178,450 | US$6,759,830 | US$345,170 | US$183,600 | US$9,121,890 |
| 2 years | US$6,406,380 | US$19,879,260 | US$1,015,070 | US$539,940 | US$26,825,570 |
| 5 years | US$24,874,520 | US$77,186,680 | US$3,941,300 | US$2,096,450 | US$104,157,650 |
| 10 years | US$55,654,750 | US$172,699,060 | US$8,818,350 | US$4,690,650 | US$233,044,450 |
†
Total costs from the societal perspective include the following: healthcare sector costs (payer spending, patient spending) and informal healthcare sector costs (patient travel and time costs, family costs for unpaid caregiving).
In an additional sensitivity analysis that used a 5-year analysis horizon, we extended the surveillance regime to 5 years versus the 3 years assumed in primary analyses. In this scenario, total numbers of CEA tests and CT scans averted increased to 544,460 and 255,080, respectively. Cost-saving estimates increased to US$28.3 million and US$125.7 million for patient total costs and societal costs compared with US$24.9 million and US$104.2 million for a 3-year surveillance regime.
Discussion
Economic research by Yabroff et al. estimate total projected healthcare expenditures for CRC for patients in the Medicare program of US$14.02 billion in 2020 [15]. We modeled impacts of postresection CRC surveillance exclusively, analyzing the impacts of using low-intensity setting levels of CT scans and CEA testing compared with the SQ. We estimated total societal costs of US$368 million in the SQ surveillance scenario and $263 million for the low-intensity scenario, suggesting potential savings of US$104 million with the nationwide expansion of low-intensity surveillance.
Surveillance is a critical aspect of cancer care. To provide patients with the best possible care, patients and providers need to find the balance between and the impacts of surveillance and the impacts of possible recurrence. As new evidence emerges, such as that in Snyder et al. [2], we must revisit existing protocols and norms with regards to patient well-being.
We note that Snyder et al. [2] does not stand alone as evidence for reduced surveillance. A companion article, published in the same issue of JAMA as Snyder et al. [2], presented similar results based on a randomized controlled trial. In that study, over 2500 patients with stage II or III CRC were randomly assigned to 5 or 2 CEA and CT follow-up tests over 5 years post-treatment [16]. Like Snyder et al., the authors found no difference in 5-year survival between the two follow-up frequencies.
Our model predicts that there would be over 400,000 fewer CEA tests and 200,000 fewer CT scans. We estimate modest societal-level cost-savings resulting from a low-intensity strategy: $104.2 million over 5 years, with more than three-quarters of the savings going to payers. Because we modeled the outcomes of the Snyder et al. [2] study, this reduction in surveillance was assumed to have no negative impacts on mortality or CRC postresection complications. CRC surveillance requires considerable time and expense. The cost savings from the implementation of a low-intensity surveillance strategy would be shared across patients, payers, employers and caregivers, without worsening patient health outcomes.
Potential limitations
Although the model is robust and informed by clinical expertise in CRC, it nonetheless has some limitations. First, we assumed the SQ strategy was representative of CRC surveillance for most patients. Cost savings would be larger if patients had higher levels of CEA testing and CT scanning, such as the high-intensity surveillance regime presented in Snyder et al. [2] or consistent with recommendations from the National Comprehensive Cancer Network (NCCN) for Stages II and III CRC. For Stage I, NCCN [15] suggests CEA testing and CT scans only as needed. For Stages II and III, NCCN recommends follow-up care of a CEA test every 3–6 months for the first 2 years and then every 6 months for 3 more years and a CT scan every 6–12 months for 5 years.
Second, the model assumes no differences in resection or mortality between high- and low-intensity surveillance groups. Snyder et al. [2] found no statistically significant difference in either resection or mortality between high and low CT scan surveillance groups. However, we note that Snyder et al. [2] did find a higher proportion of patients who underwent resection for recurrence in the high- versus low-intensity surveillance facilities (HR = 1.22, p = 0.06). It is additionally possible that a longer follow-up time from Snyder et al. [2] could uncover more differences between the high- and low-intensity group and if so, that could impact cost savings estimates from our model.
Third, we value informal healthcare sector costs and productivity losses based on the time spent traveling to and in care, but these estimates may be subject to measurement error. The travel time estimates from Snyder et al. [2] do not align perfectly with those from Yabroff et al. [10]. In the absence of newer estimates of waiting time, the study team chose to use the Yabroff et al. [10] estimates because they were from a study that aimed to estimate times for colorectal cancer visits.
Fourth, we assumed an instantaneous and costless rollout of the low-intensity strategy. In reality, introducing such a strategy would require changes to physician surveillance behavior, which could take time and effort.
Our model also does not account for the psychological impacts of receiving high-intensity and low-intensity surveillance among CRC survivors. Augestad and colleagues review multiple studies finding limited evidence that CRC patient follow-up improves quality of life [17]. The authors also address the need for increased research on the psychological impacts of false positive tests on CRC survivors.
A final potential limitation is that the Snyder et al. [2] study only follows patients for 3 years of surveillance following resection. Had the patients been followed longer, researchers may have found that individuals in the high intensity surveillance group had lower time to detection of recurrence, lower recurrence rates or greater overall survival.
Conclusion
By modeling expanded low-intensity surveillance per Snyder et al. [2], we estimated considerable savings of time and medical spending to payers, patients and families with no worsening of outcomes. National implementation of the low-intensity CRC surveillance strategy compared with the SQ strategy has the potential to save society $104.2 million in costs over 5 years. Payers save $77.2 million in direct medical costs, with $43.5 million of these savings accruing to Medicare. Reduced costs to patients and families equal $27 million.
•
Research comparing low-intensity and high-intensity post-treatment colorectal cancer surveillance has found no association between intensity of surveillance and detection of colorectal cancer recurrence.
•
This paper constructs a Markov model to estimate the effects of a national rollout of low-intensity surveillance following curative resection for colorectal cancer.
•
Model parameters were identified from publicly available data sources and the literature.
•
Model results estimate considerable savings of time and medical spending to payers, patients and families with no worsening of health outcomes.
•
Model results estimate that a national rollout of a low-intensity strategy has the potential to reduce the number of carcinoembryonic antigen tests and CT scans by 448,320 and 210,040 over 5 years.
•
Fewer tests results in a decline in total healthcare sector costs by $82 million over 5 years.
•
Total cost savings, including indirect costs to patients and families, total over $104 million over 5 years.
•
Limitations include assumptions about representative levels of current surveillance, potential costs of rolling out a low-intensity strategy nationwide, psychological impacts of high-intensity surveillance among colorectal cancer survivors, and other measurement assumptions.
Acknowledgments
The authors would like to thank Y Zafar and T Hoerger for their valuable contributions and feedback.
Disclaimer
The contents of this work are solely the responsibility of the authors and do not necessarily represent the views of the Patient-Centered Outcomes Research Institute (PCORI), its Board of Governors or Methodology Committee.
Financial & competing interests disclosure
Research reported in this manuscript was funded through a contract with the Patient-Centered Outcomes Research Institute (PCORI) (IDIQ-SOW #16-INSIGHT-AOSEPP-ENG). The authors have no other relevant affiliations or financial involvement with any organization or entity with a financial interest in or financial conflict with the subject matter or materials discussed in the manuscript apart from those disclosed.
No writing assistance was utilized in the production of this manuscript.
Supplementary Material
File (supplementary materials.docx)
- Download
- 20.80 KB
References
1.
SEER (Surveillance Epidemiology and End Results Program). Cancer stat facts: colorectal cancer. https://seer.cancer.gov/statfacts/html/colorect.html (2018).
2.
Snyder RA, Hu C-Y, Cuddy A et al. Association between intensity of posttreatment surveillance testing and detection of recurrence in patients with colorectal cancer. JAMA 319(20), 2104–2115 (2018).
3.
Myer PA, Mannalithara A, Singh G, Ladabaum U. Proximal and distal colorectal cancer resection rates in the United States since widespread screening by colonoscopy. Gastroenterology 143(5), 1227–1236 (2012).
4.
U.S. Census Bureau. Quickfacts: United States. https://www.census.gov/quickfacts/fact/table/US#
5.
SEER. Age Distribution of Incidence Cases by Site, 2011-2015: All Races, Both Sexes. https://seer.cancer.gov/csr/1975_2015/results_single/sect_01_table.11_2pgs.pdf
6.
Briggs A, Sculpher M, Claxton K. Decision Modelling for Health Economic Evaluation. Chapter 4. Oxford University Press, NY, USA (2006).
7.
Dusetzina SB, Basch E, Keating NL. For uninsured cancer patients, outpatient charges can be costly, putting treatments out of reach. Health Affairs 34(4), 584–591 (2015).
8.
CMS (Centers for Medicare & Medicaid Services). Clinical laboratory fee schedule. https://www.cms.gov/Medicare/Medicare-Fee-for-Service-Payment/ClinicalLabFeeSched/Clinical-Laboratory-Fee-Schedule-Files-Items/18CLAB.html?DLPage=1&DLEntries=10&DLSort=2&DLSortDir=descending
9.
CMS (Centers for Medicare & Medicaid Services). Physician fee schedule. https://www.cms.gov/apps/physician-fee-schedule/search/search-criteria.aspx
10.
Yabroff KR, Davis WW, Lamont EB et al. Patient time costs associated with cancer care. J. Natl Cancer Inst. 99(1), 14–23 (2007).
11.
BLS DOL (Bureau of Labor Statistics, U.S. Department of Labor). Earnings, median usual weekly earnings, employed full time, 2018, by quarter. Labor force statistics from the Current Population Survey. Series ID LEU0252881500. https://www.bls.gov/cps/
12.
BLS DOL (Bureau of Labor Statistics, U.S. Department of Labor). Employer costs for employee compensation for December 2018 [News release]. https://www.bls.gov/regions/southwest/news-release/employercostsforemployeecompensation_regions.htm
13.
Wolff JL, Roter DL. Family presence in routine medical visits: a meta-analytical review. Social Sci. Med. 72(6), 823–831 (2011).
14.
BLS DOL (Bureau of Labor Statistics, U.S. Department of Labor). Earnings, median usual weekly earnings, employed full time, 2018. Labor force statistics from the Current Population Survey. Series ID LEU0254543600, LEU0258117500. https://www.bls.gov/cps/
15.
Yabroff KR, Mariotto AB, Feuer E, Brown ML. Projections of the costs associated with colorectal cancer care in the United States, 2000-2020. Health Econ. 17, 947–959 (2008).
16.
NCNN (National Comprehensive Cancer Network). NCCN guidelines for patients: colon cancer. https://www.nccn.org/patients/guidelines/colon/files/assets/common/downloads/files/colon.pdf
17.
Augestad KM, Rose J, Crawshaw B, Cooper G, Delaney C. Do the benefits outweigh the side effects of colorectal cancer surveillance? A systematic review. World J. Gastrointest. Oncol. 6(5), 104–111 (2014).
Information & Authors
Information
Published In
Pages: 99 - 107
PubMed: 34903040
Copyright
© 2021 Future Medicine Ltd.
History
Received: 14 March 2021
Accepted: 16 November 2021
Published online: 14 December 2021
Keywords:
Topics
Authors
Funding Information
Patient-Centered Outcomes Research Institute: IDIQ-SOW #16-INSIGHT-AOSEPP-ENG
Metrics & Citations
Metrics
Article Usage
Article usage data only available from February 2023. Historical article usage data, showing the number of article downloads, is available upon request.
Citations
How to Cite
An economic evaluation of reducing colorectal cancer surveillance intensity. (2021) Journal of Comparative Effectiveness Research. DOI: 10.2217/cer-2021-0065
Export citation
Select the citation format you wish to export for this article or chapter.
Citing Literature
- Thanh Lu, Sophia D'Angelo, Zohra Tayebali, Matthew Dempsey, Kristen Giombi, Olga Khavjou, Impact analysis of expanded access to ketamine for treatment-resistant depression, Journal of Comparative Effectiveness Research, 10.57264/cer-2024-0233, 14, 6, (2025).