Real-world healthcare resource utilization and costs of weekly versus every-2-week cetuximab in metastatic colorectal cancer
Publication: Journal of Comparative Effectiveness Research
Abstract
Aim: To compare healthcare resource utilization (HRU) and healthcare costs (HC) for every-2-week (Q2W) versus weekly (Q1W) cetuximab in metastatic colorectal cancer (mCRC). Patients & methods: Patients with mCRC receiving cetuximab plus chemotherapy in a line-agnostic setting. Cohort study of patients with mCRC treated with cetuximab and chemotherapy in IBM MarketScan. Analyses were weighted by inverse probability of treatment based on propensity score. Results: HRU was numerically lower with the Q2W versus Q1W regimen (weighted mean, 8.1 vs 9.5 encounters per-patient-per-month). The weighted average of HC was $17,653 and $16,469 per-patient-per-month for the Q2W and Q1W regimens, respectively; the difference between regimens decreased when restricting to CRC-related claims. Conclusion: HRU was lower and HC were similar between the Q2W and Q1W regimens.
Colorectal cancer (CRC) is the third leading cause of cancer-related deaths and the second most common cause of cancer deaths, with 53,200 CRC-related deaths expected in 2020 in the United States alone [1]. CRC is responsible for 900,000 deaths annually worldwide, with a higher CRC incidence rate observed in economically developed countries [2]. In the United States, CRC has a 5-year relative survival rate of 65%; this rate is much lower for those with metastatic CRC (mCRC), who have an average 5-year relative survival rate of only 14% [3].
The current standard of care for patients with unresectable mCRC is chemotherapy in combination with targeted therapy [4,5]. Anti-EGF receptor (EGFR) agents are indicated for EGFR-expressing, KRAS/RAS wild-type (wt) mCRC. Guidelines and routine clinical practice suggest that CRC should be tested for extended RAS and RAF mutations (KRAS, NRAS and BRAF) before considering anti-EGFR agents; these agents are recommended in the first-line (1L) setting for extended RAS and RAF wt tumors as well as for BRAF-V600E-mutant tumors [6,7]. In the United States, cetuximab is approved for the treatment of KRAS wt, EGFR-expressing mCRC as determined by a US FDA-approved test, with a limitation restricting use in patients with RAS mutations or with unknown RAS status since 2012 [8]. Although the approved schedule of cetuximab is an initial dose of 400 mg/m2 of body surface area followed by subsequent weekly (Q1W) doses of 250 mg/m2, numerous studies have been conducted to document and support the clinical use of a schedule of 500 mg/m2 cetuximab every 2 weeks (Q2W) [9–12]. Both the Q1W and the Q2W schedules are recommended in the National Comprehensive Cancer Network (NCCN) guidelines [4,5]. The Q2W regimen may be a more convenient option for patients with mCRC receiving cetuximab and is currently recommended and/or reimbursed for use in some countries in Europe and Asia [13–15]. However, few studies have specifically compared these two treatment regimens; those that have compared them have had limited sample sizes. Furthermore, the real-world implications regarding the healthcare resource utilization (HRU) and healthcare costs (HC) of these treatment regimens in daily practice are not well known.
This manuscript details the preplanned secondary end points from a recently published study reporting on the real-world effectiveness and safety of the Q2W versus the Q1W cetuximab-dosing regimen [16]. The objective of this study was to describe and compare HRU and HC for the Q2W versus Q1W cetuximab-dosing regimens in combination with chemotherapy for the treatment of mCRC. The aim was to determine whether synchronized administration of cetuximab with concomitant chemotherapy by using the cetuximab Q2W dosing regimen may result in lower HRU and HC.
Patients & methods
Study design
This was a longitudinal cohort study based on the secondary use of data from a large US claims database, IBM MarketScan, for patients with mCRC treated with cetuximab in combination with chemotherapy, irrespective of the treatment line, between 1 July 2010 and 31 December 2016. All data used in this study were derived from US-centric administrative claims and were deidentified and certified as Health Insurance Portability and Accountability Act (HIPAA) compliant per US Code of Federal Regulations CFR 46.116. The patients included in the study did not receive any interventions other than those administered by their healthcare providers independent of study data collection activities.
Patients
Eligible patients were required to sequentially meet all of the study criteria, which included having ≥2 consecutive cetuximab claims occurring within 28 days of each other, the first of which was considered to be the index date; administration of one round of chemotherapy within 28 days of the index date; ≥1 CRC diagnosis within 180 days around the index date; and age of ≥18 years at the index date (Figure 1).
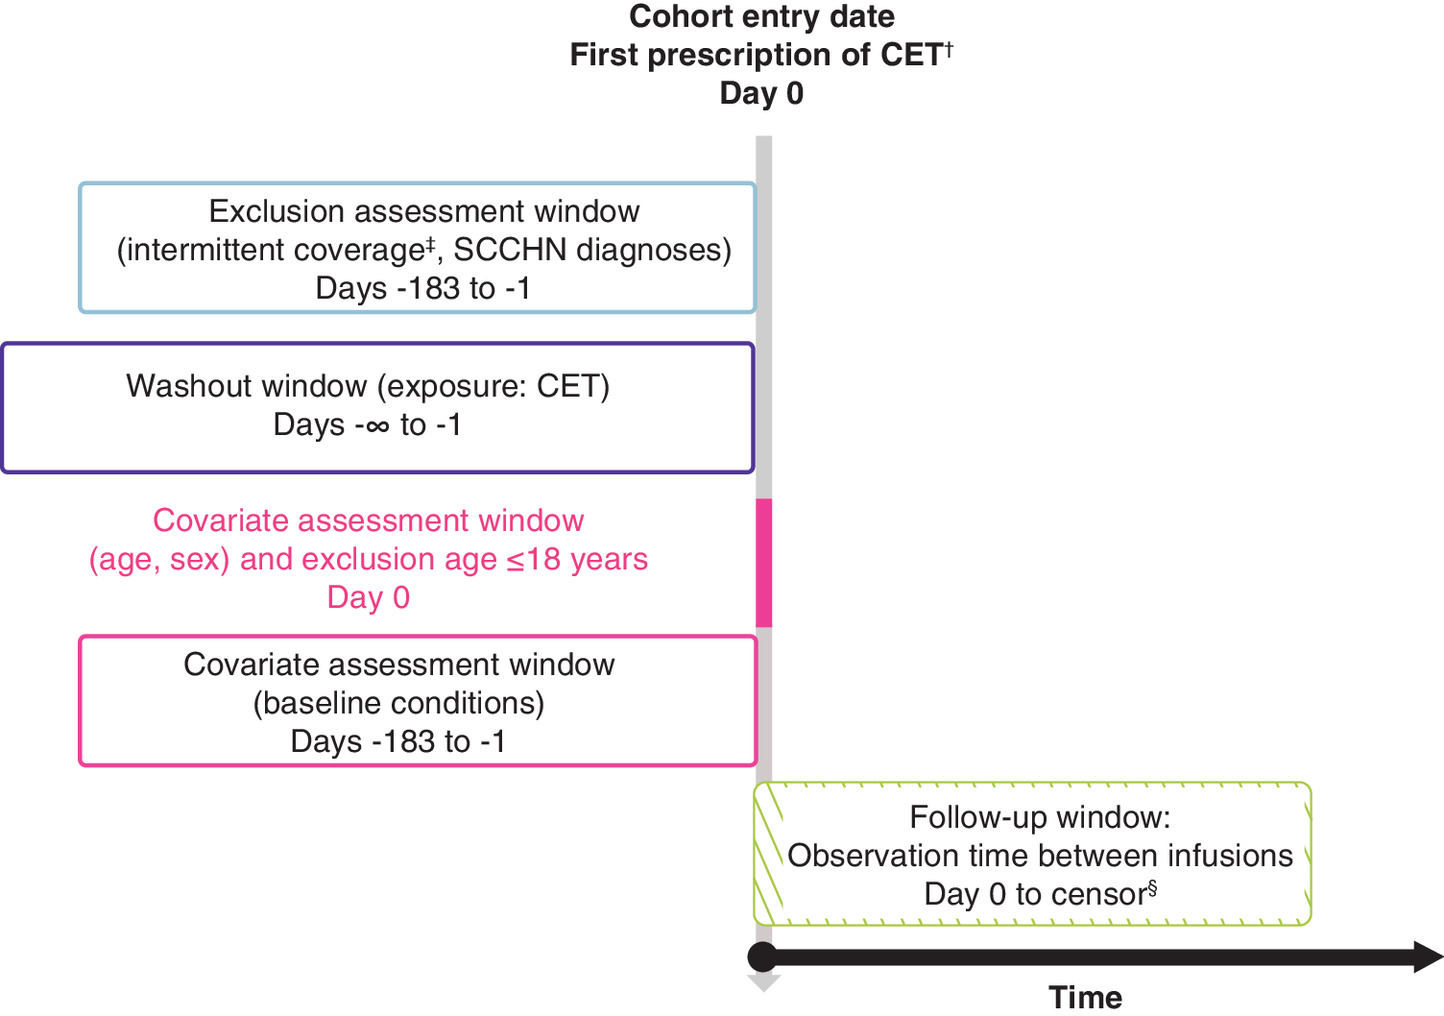
Figure 1. Study design.
†Eligibility requires that the second CET claim occurs within 28 days of the first claim. Additionally, a CET infusion claim had to occur within 28 days of the first claim, and a CRC diagnosis had to occur within 180 days of either of the two initial CET claims.
‡Up to 30-day gaps in insurance coverage were allowed.
§Earliest of death, loss of insurance coverage, CET discontinuation (>45 days between infusions) or end of study period (31 December 2016).
CET: Cetuximab; CRC: Colorectal cancer; SCCHN: Squamous cell carcinoma of the head and neck.
Patients were not eligible for the study if they fulfilled any of the following exclusion criteria: less than 180 days of continuous enrollment prior to the index date (with up to a 30-day gap allowed) to assess baseline characteristics; ≥1 diagnosis of squamous cell carcinoma of the head and neck (SCCHN) within the 180 days prior to the index date and any time thereafter, as cetuximab is also used for this indication [8]; ≥1 cetuximab claim any time before the index date; >120 years of age at the index date; or missing values for age or sex.
Exposure
Eligible patients were classified according to their observed cetuximab treatment patterns into one of the following cohorts: Q1W, patients treated with cetuximab once weekly, classified on the basis of a median time between sequential cetuximab claims of ≥4 and <11 days; Q2W, patients treated with cetuximab every 2 weeks, classified on the basis of a median time between sequential cetuximab claims of ≥11 and <19 days; and other, patients treated with a cetuximab regimen different from Q1W and Q2W, classified on the basis of any other median time between sequential cetuximab claims. The purpose of identifying the ‘other’ cohort was to ensure that patients considered to not have received either the Q1W or Q2W regimen were not included for analysis. As cetuximab-dosing information was not available for most cases and could not be derived from the data, for the purpose of this analysis, it was assumed that patients in the Q1W cohort received cetuximab at an initial dose of 400 mg/m2 followed by 250 mg/m2 weekly and patients in the Q2W cohort received cetuximab at 500 mg/m2 every 2 weeks as described in the literature and recommended by NCCN guidelines [4,5,9–12]. Patients with no evidence of systemic anticancer therapy for mCRC in the baseline period were presumed to have received cetuximab as 1L treatment (presumed 1L population).
The exposure period (i.e., the patient follow-up period) considered for analysis was defined as the time from the first cetuximab claim (index date) until the earliest of the following outcomes (and the date on which follow-up was considered to end): death due to any cause (date of death); loss of insurance coverage for more than 30 days (last date of insurance coverage +31 days); switch to another systemic treatment for mCRC, in the context of cetuximab discontinuation (date of last use of cetuximab); discontinuation of cetuximab, defined as more than 45 days between two sequential cetuximab claims (date of last use of cetuximab in first claim); or the end of the data availability/study period (31 December 2016). Death was identified through a proxy published in the CRC setting [17]. Indicators for death included the following: hospital discharge status of death; hospital or emergency event within 30 days of loss of insurance coverage; and use of cardiac-stimulating medications such as epinephrine or lidocaine, diagnosis codes for cardiac arrest or failure or procedure codes for resuscitation or defibrillation within 30 days of loss of insurance coverage.
Study outcomes
HRU observed during the exposure period covered overall inpatient admissions, overall outpatient visits and overall pharmacy services. Estimates of costs were based on the variable total pay in the MarketScan dataset, which includes payments by payers as well as patients, corresponding to each type of HRU identified. Overall costs corresponding to the sum of the costs from inpatient and outpatient care as well as pharmacy costs were considered. Costs were inflation-adjusted to 2016 US dollars based on the medical care component of the Consumer Price Index. HRU and HC were further stratified based on whether they were directly related to CRC (i.e., if the associated service had a diagnosis, primary or secondary, of CRC or had the following surgical procedure codes: 47120, 47122, 47125, 47130, 32480, 32482, 32484 or 32486) [18] or to skin toxicity (i.e., if the associated service had a diagnosis, primary or secondary, relating to skin toxicity).
Statistical analysis
HRU and HC were reported on a per-patient-per-month (PPPM) basis to account for variable lengths of follow-up and expressed with corresponding 95% CIs. The monthly HRU for services was calculated for each patient by dividing the cumulative HRU during follow-up over the total cetuximab exposure period expressed in months (T). The end of cetuximab exposure was considered to occur at the first of the following events: death, switch to another treatment, loss of insurance coverage for more than 30 days (loss of follow-up) or the end of the data availability/study period. The formula is as follows:
Monthly HC were calculated for each patient by dividing the total costs during follow-up over the total cetuximab exposure period expressed in months using the following formula:
In cases where the follow-up period was less than 30 days, the number of healthcare encounters was applied without adjusting to monthly values. An inverse probability of treatment weighting (IPTW) based on a high-dimensional propensity score (hdPS) methodology was used to account for potential confounding [19] between the cetuximab Q1W and Q2W regimens; this standardization allowed for comparisons across variables on different scales. As described in our previous paper [16], the following additional variables were added to the model: calendar year of index date, region of residence, type of insurance plan, chemotherapy used in combination with cetuximab and number of visits during the preindex period. Where possible, continuous forms of the prespecified variables were selected over categorical forms. Because the weighting was large for a minority of patients, stabilized weights were used for all analyses [20]. Balance among baseline characteristics was assessed using standardized differences. Standardized mean differences are presented in Figure 2, with the value of 0.1 (vertical line) taken as the threshold below which the covariates are considered balanced between the two groups.
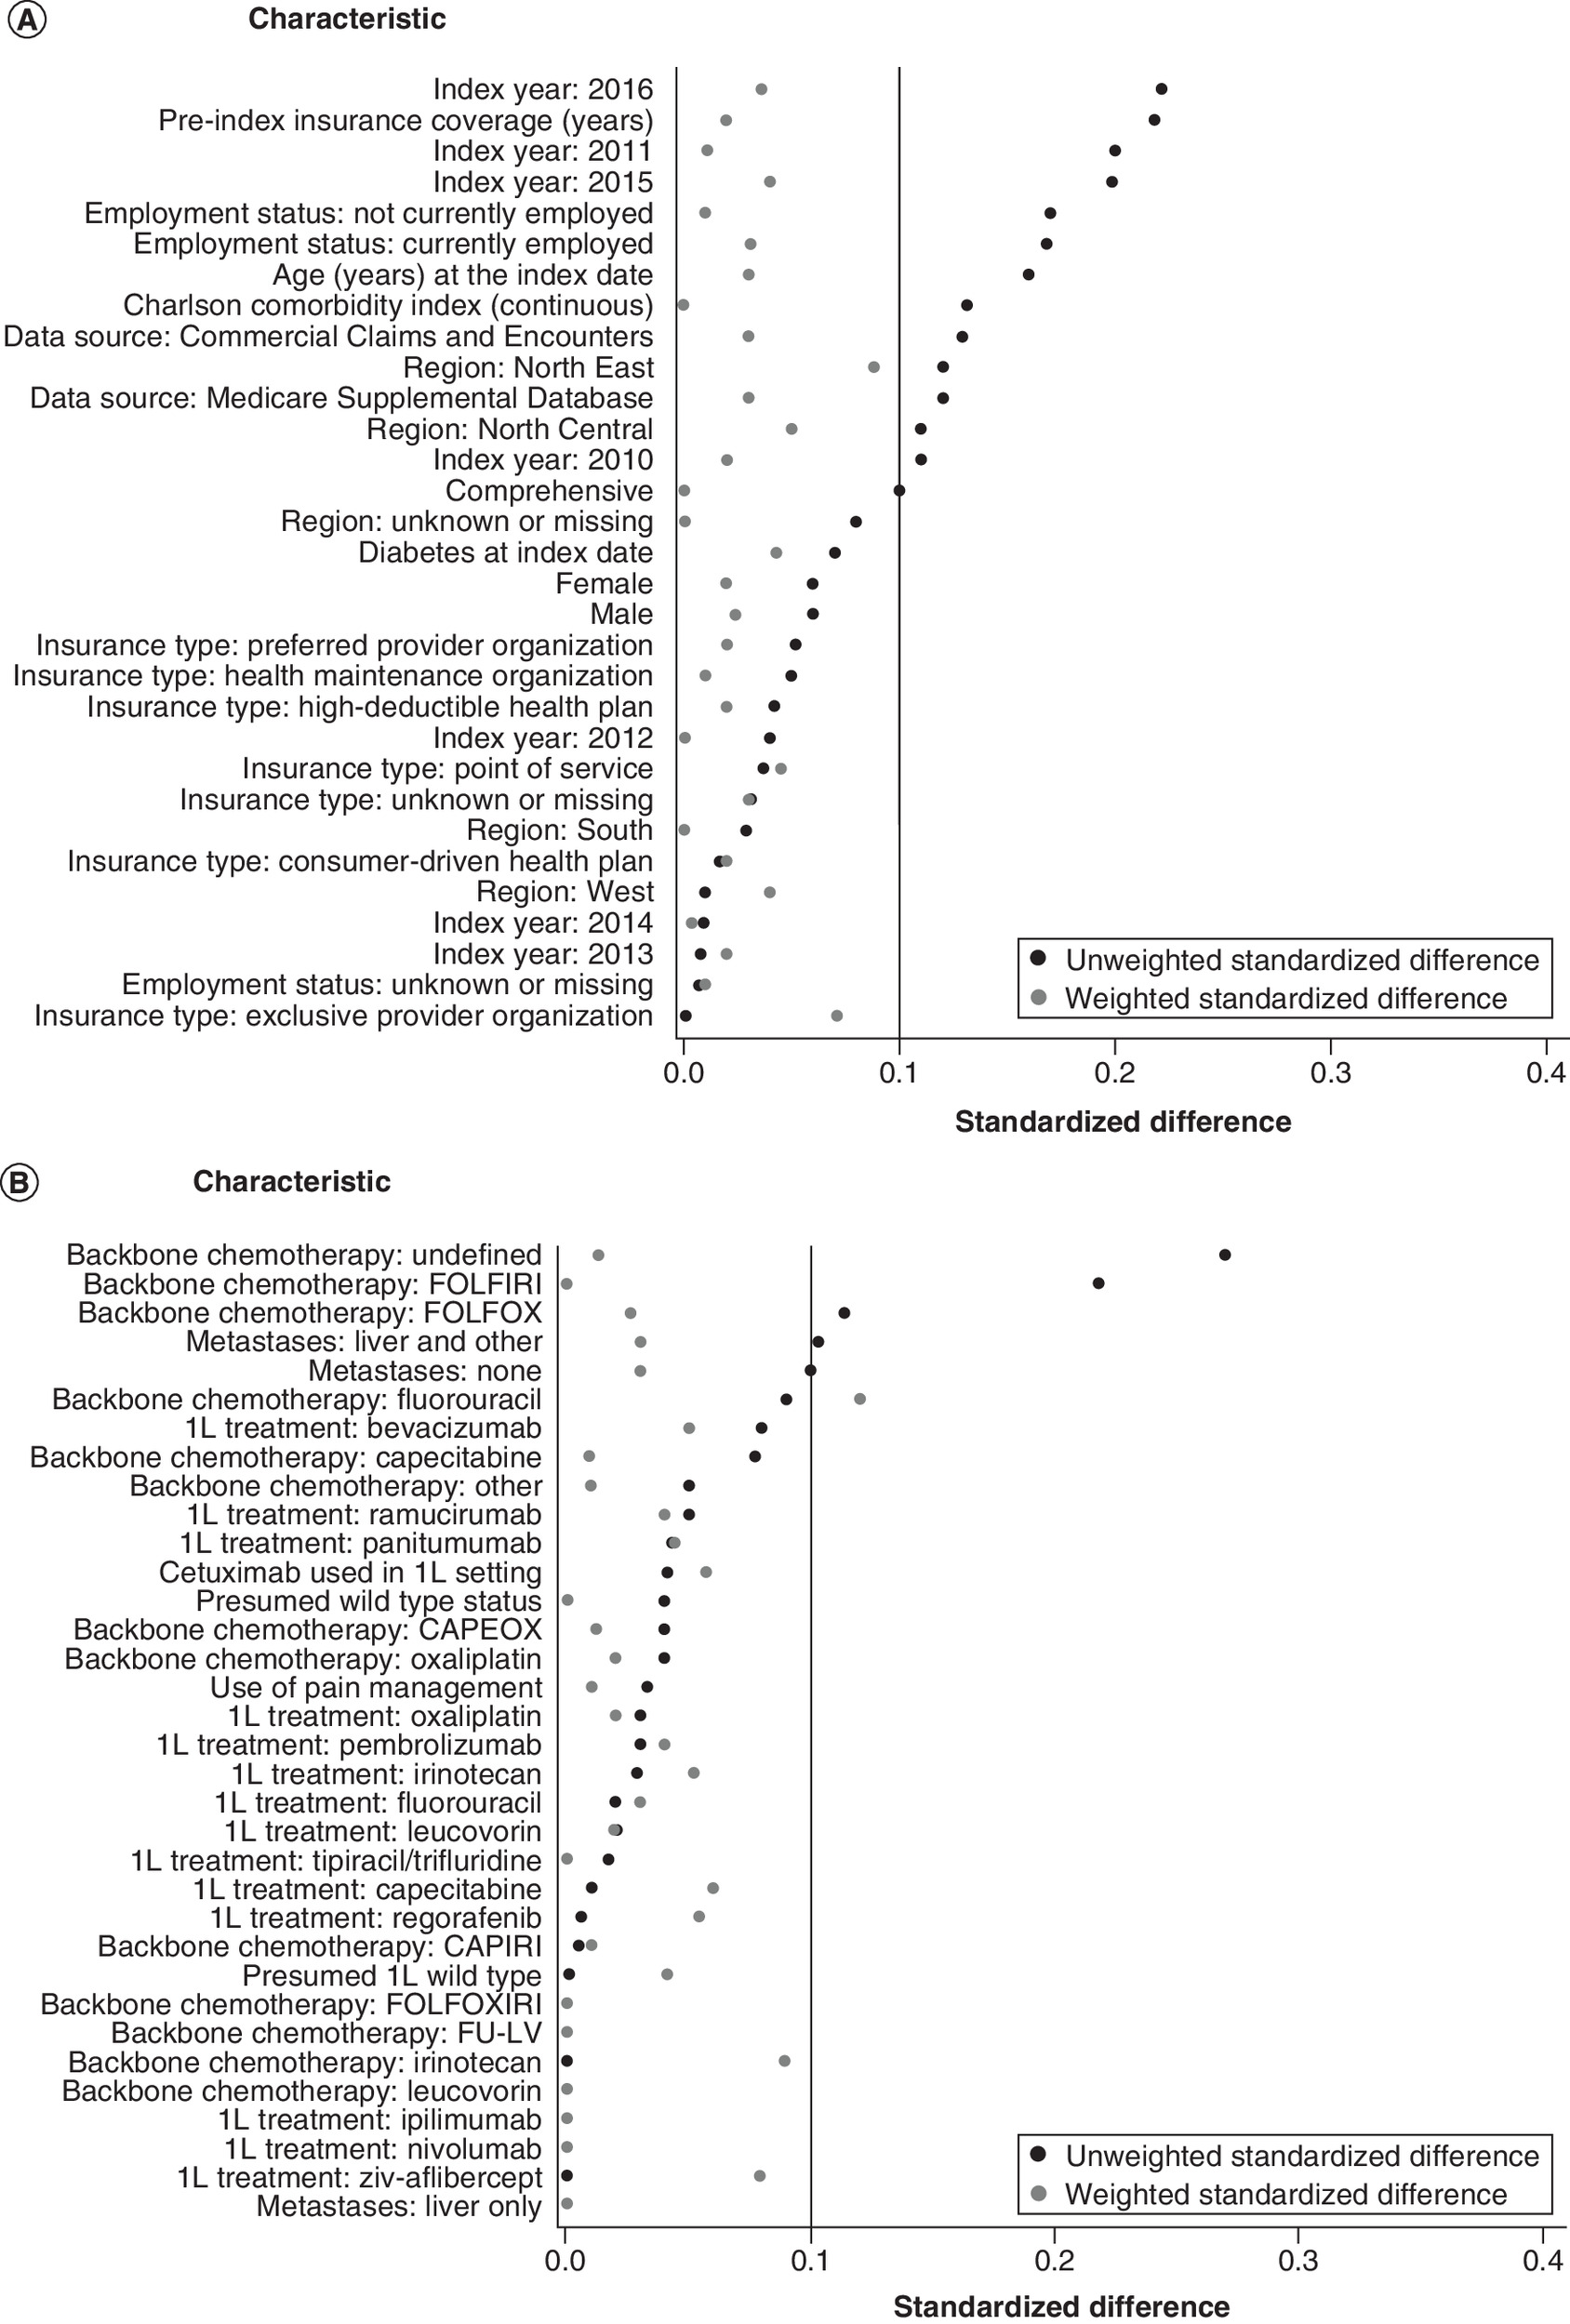
Figure 2. Absolute standardized differences of baseline characteristics before and after inverse probability of treatment weighting based on propensity score.
1L: First-line; CAPIRI: Capecitabine and irinotecan hydrochloride; CAPOX: Capecitabine and oxaliplatin; CCI: Charlson Comorbidity Index; FOLFIRI: Folinic acid, fluorouracil and irinotecan; FOLFOX: Folinic acid, fluorouracil and oxaliplatin; FOLFOXIRI: Folinic acid, fluorouracil, oxaliplatin and irinotecan; FU-LV: Fluorouracil and leucovorin.
Mean values of HRU and HC with corresponding 95% CIs (obtained from the parametrically asymptotic method) after IPTW were estimated overall, for each specific category of HRU and HC, and for stratification according to HRU and HC related to CRC or skin toxicity. Overall and categorized costs between the Q1W and Q2W regimens were compared using cost differences after IPTW based on generalized linear models (GLM) with gamma distribution (log-link). CRC-related costs were also compared with GLM; however, costs restricted to those associated with skin toxicity could not be compared due to the low number of these events.
Results
Exposure classification
A total of 2943 patients met the study eligibility criteria, with 1779 (60.4%) categorized as having received cetuximab Q1W and 951 (32.3%) categorized as having received cetuximab Q2W. The remaining 213 (7.2%) patients did not meet the criteria for allocation into the Q1W or Q2W dosing regimens and were not included for analysis. The Q1W cohort had a total of 27,161 cetuximab claims with an average of 8.1 days between claims (interquartile range: 7–7); 75.4% of the claims were exactly 7 days apart when considering all time spans between cetuximab claims after the index date. The mean absolute difference between the observed and expected duration for all cetuximab claims in the Q1W cohort was 1.17 days, and the root-mean-squared error was 1.86 days, suggesting that the standard time span between two cetuximab claims in this cohort differed by less than 2 days (vs the theoretical value of 7 days). The Q2W cohort had a total of 7678 cetuximab claims with an average of 15 days between claims (interquartile range: 14-14); 66.4% of the claims were exactly 14 days apart when considering all time spans between cetuximab claims after the index date. The mean absolute difference between the observed and expected duration for all cetuximab claims in the Q2W cohort was 1.33 days, and the root-mean-squared error was 2.02 days, suggesting that the standard time span between two cetuximab claims in this cohort differed by approximately 2 days (vs the theoretical value of 14 days; Supplementary Table 1).
Baseline characteristics
Patients in the Q1W and Q2W cohorts differed on a limited number of available baseline characteristics, including age ≥65 years (30.6 and 24.7%, respectively), number of patients currently employed (26.0 and 33.6%), number of patients with a chemotherapy backbone of FOLFIRI (folinic acid, fluorouracil and irinotecan; 24.5 and 34.4%) and number of patients with a chemotherapy backbone of undefined (19.5 and 9.8%; Table 1 & Supplementary Table 2 ). The median follow-up was 0.7 years (first and third quartiles: 0.3, 1.3) in Q1W, and 0.7 (first and third quartiles: 0.3, 1.4) in Q2W. The distribution of absolute standardized differences for baseline characteristics between the exposure groups before (black dots) and after (gray dots) hdPS-based IPTW is presented in Figure 2A and B. After applying IPTW, only the use of fluorouracil showed a standardized difference more than 0.1 between cohorts.
| Charactertistic | Q1W | Q2W | Total |
|---|---|---|---|
| Patients, n (%) | 1779 (65.2) | 951 (34.8) | 2730 (100) |
| Age at index date: ≥65 years, n (%) | 544 (30.6) | 235 (24.7) | 779 (28.5) |
| Sex: female, n (%) | 756 (42.5) | 376 (39.5) | 1132 (41.5) |
| MarketScan data source, n (%) | |||
| – Commercial claims and encounters | 1235 (69.4) | 715 (75.2) | 1950 (71.4) |
| – Medicare supplemental | 544 (30.6) | 236 (24.8) | 780 (28.6) |
| Employment status at index date, n (%) | |||
| – Not currently employed | 652 (36.6) | 272 (28.6) | 924 (33.8) |
| – Currently employed | 462 (26.0) | 320 (33.6) | 782 (28.6) |
| – Unknown or missing | 665 (37.4) | 359 (37.7) | 1024 (37.5) |
| Type of metastases, n (%) | |||
| – Other localizations only (no liver) | 843 (47.4) | 402 (42.3) | 1245 (45.6) |
| – Liver and other localizations | 936 (52.6) | 549 (57.7) | 1485 (54.4) |
| Chemotherapy used with cetuximab, n (%) | |||
| – FOLFOXIRI | 2 (0.1) | 1 (0.1) | 3 (0.1) |
| – FOLFIRI | 436 (24.5) | 327 (34.4) | 763 (27.9) |
| – FOLFOX | 101 (5.7) | 82 (8.6) | 183 (6.7) |
| – CAPIRI | 36 (2.0) | 20 (2.1) | 56 (2.1) |
| – CAPOX | 9 (0.5) | 2 (0.2) | 11 (0.4) |
| – 5-FU | 332 (18.7) | 143 (15.0) | 475 (17.4) |
| – Irinotecan | 448 (25.2) | 239 (25.1) | 687 (25.2) |
| – Undefined | 347 (19.5) | 93 (9.8) | 440 (16.1) |
| – Other† | 68 (3.8) | 44 (4.6) | 112 (4.1) |
| Cetuximab presumed to have been given as first-line, n (%) | 557 (31.3) | 316 (33.2) | 873 (32.0) |
†
Other regimens included capecitabine (n = 72) and oxaliplatin (n = 31).
5-FU: Fluorouracil; CAPIRI: Capecitabine and irinotecan hydrochloride; CAPOX: Capecitabine and oxaliplatin; FOLFIRI: Folinic acid, fluorouracil and irinotecan; FOLFOX: Folinic acid, fluorouracil and oxaliplatin; FOLFOXIRI: Folinic acid, fluorouracil, oxaliplatin and irinotecan; Q1W: Weekly; Q2W: Every-2-weeks.
Healthcare resource utilization
Overall, the mean all-purpose and CRC-related HRU was numerically higher for patients in the Q1W versus Q2W cohort (Table 2), both before and after adjustment with IPTW (Figure 3). The mean unadjusted overall HRU was 9.5 (Q1W) and 8.5 (Q2W) encounters PPPM. After hdPS-based IPTW, the mean adjusted overall HRU (95% CI) was 9.48 (9.29–9.67; Q1W) and 8.10 (7.86–8.34; Q2W) encounters PPPM. For HRU related to CRC claims only, the mean unadjusted overall HRU was 5.3 (Q1W) and 4.3 (Q2W) encounters PPPM. After adjustment by IPTW, the mean adjusted overall HRU (95% CI) was 5.44 (5.31–5.58; Q1W) and 4.07 (3.92–4.22; Q2W). Additional comparisons of unadjusted versus adjusted mean HRU PPPM can be found in Table 2. Adjusted HRU related to skin toxicity was not reported due to the low number of services rendered for this subgroup of events.
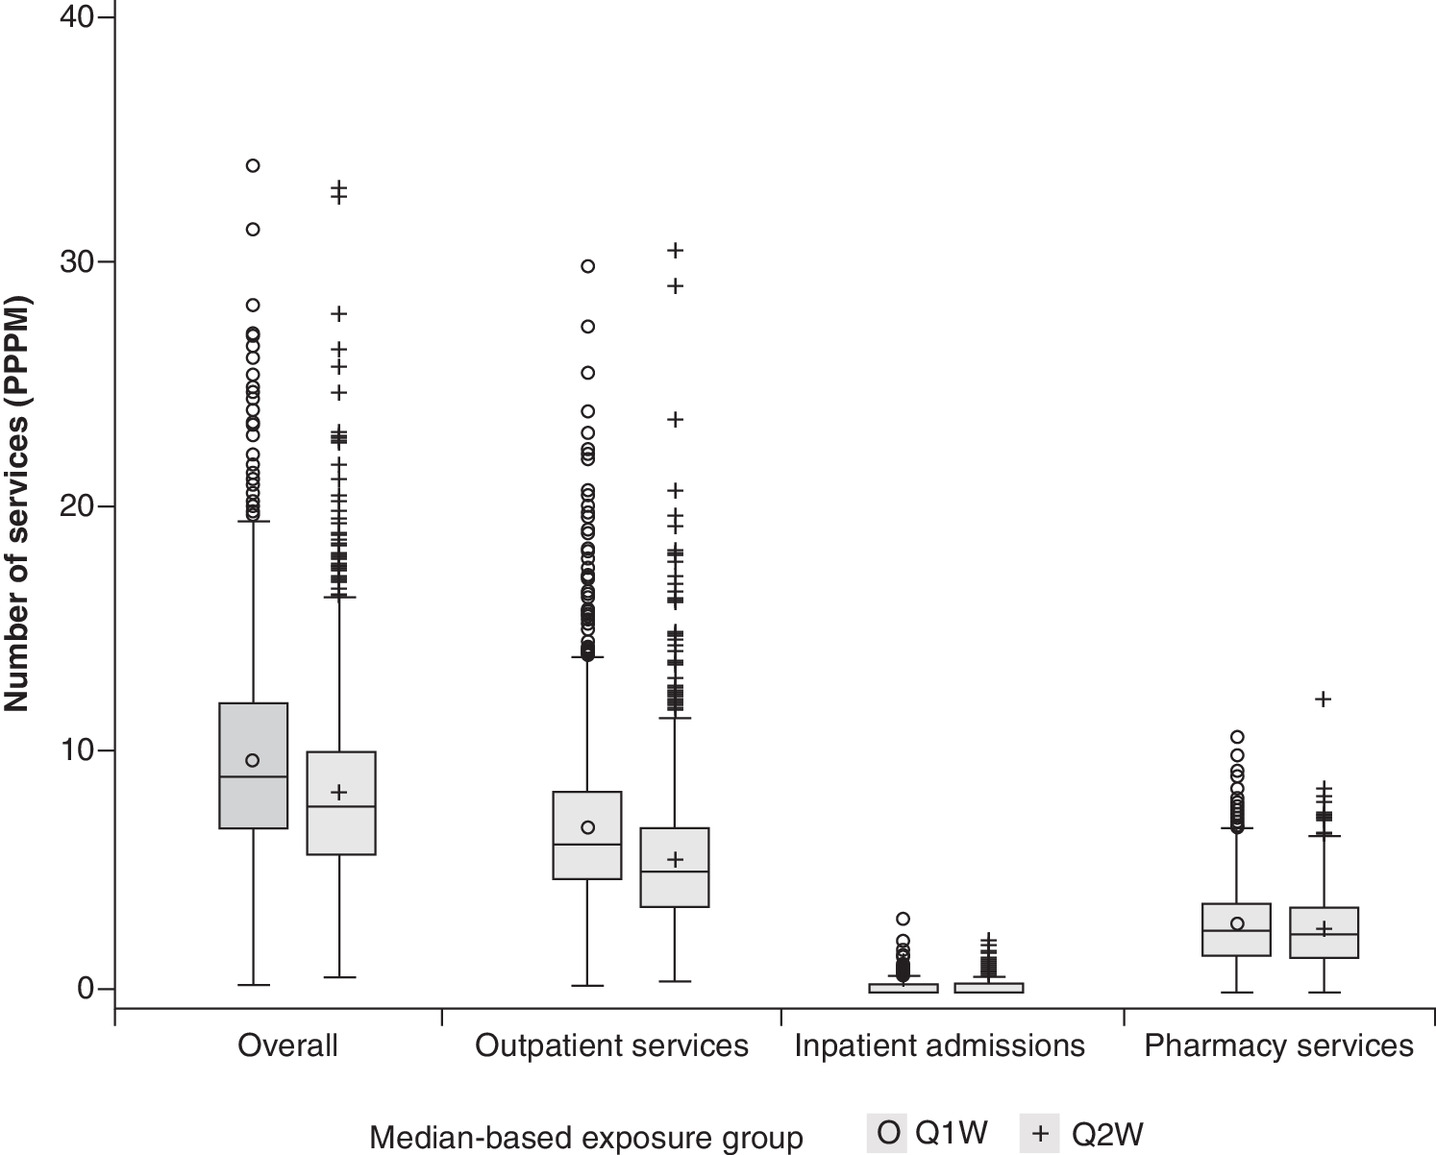
Figure 3. Box plots of all-purpose, outpatient and inpatient healthcare utilization by exposure to cetuximab every 2 weeks versus weekly after inverse probability of treatment weighting.
PPPM: Per-patient-per-month; Q1W: Weekly; Q2W: Every-2-weeks.
| Services | Unadjusted results | Weighted by inverse probability of treatment | ||||||||
|---|---|---|---|---|---|---|---|---|---|---|
| All-purpose, mean (SD) | CRC-related‡, mean (SD) | Related to skin toxicity, mean (SD) | All-purpose, mean (95% CI) | CRC-related, mean (95% CI) | ||||||
| Q1W | Q2W | Q1W | Q2W | Q1W | Q2W | Q1W | Q2W | Q1W | Q2W | |
| Overall | 9.5 (4.12) | 8.5 (4.05) | 5.3 (2.88) | 4.3 (2.49) | 0.1 (0.27) | 0.1 (0.27) | 9.48 (9.29–9.67) | 8.10 (7.86–8.34) | 5.44 (5.31–5.58) | 4.07 (3.92–4.22) |
| Outpatient | 6.7 (3.27) | 5.7 (3.14) | 5.2 (2.84) | 4.2 (2.45) | 0.1 (0.24) | 0.1 (0.27) | 6.70 (6.55–6.85) | 5.37 (5.19–5.55) | 5.32 (5.19–5.45) | 3.95 (3.80–4.09) |
| Inpatient | 0.2 (0.27) | 0.2 (0.27) | 0.1 (0.22) | 0.1 (0.21) | 0 (0.02) | 0 | 0.17 (0.16–0.19) | 0.18 (0.17–0.20) | 0.11 (0.10–0.12) | 0.12 (0.10–0.13) |
| Pharmacy | 2.6 (1.65) | 2.6 (1.63) | 0 (0.12) | 0 (0.04) | 0 (0.12) | 0 (0.04) | 2.60 (2.52–2.68) | 2.54 (2.44–2.65) | 0.01 (0–0.01) | 0 (0–0) |
†
PPPM figures were derived by dividing the total sum of HRU during follow-up by the total time of follow-up and then summarized across all patients.
‡
Defined as any claim that had a diagnosis code for primary or secondary CRC or a CPT for CRC surgery.
CPT: Current Procedural Terminology; CRC: Colorectal cancer; HRU: Healthcare resource utilization; PPPM: Per-patient-per-month; Q1W: Weekly; Q2W: Every 2 weeks; SD: Standard deviation.
Healthcare costs
Mean all-purpose HC were numerically lower for patients in the Q1W cohort compared with the Q2W cohort (Table 3), although this difference decreased after weighting (Figure 4) and was further reduced when restricting to CRC-related HC. The mean unadjusted overall HC were $15,611 (Q1W) and $20,570 (Q2W) PPPM. The adjusted mean overall HC (95% CI) were $16,469 (15,780.67–17,156.33) (Q1W) and $17,653 (16,540.27–18,765.90) (Q2W). For HRU related to CRC claims only, the mean unadjusted HC were $12,031 (Q1W) and $15,712 (Q2W). After hdPS-based IPTW, the mean adjusted HU (95% CI) were $12,885 (12,299.77–13,470.16) (Q1W) and $13,356 (12,370.70–14,342.17) (Q2W). No significant differences in costs were found between the Q1W and Q2W cohorts in the GLM after IPTW (Table 4). The ratio of all-purpose HC PPPM for Q2W over those of Q1W was 1.07 (p = 0.06). The ratio of CRC-related HC PPPM for Q2W over Q1W was 1.04 (p = 0.39). HC related to skin toxicities have not been reported due to the low number of events and thus low costs PPPM associated with them.
| Services | Unadjusted results | Weighted by inverse probability of treatment | ||||||||
|---|---|---|---|---|---|---|---|---|---|---|
| All-purpose, mean (SD) | CRC-related‡, mean (SD) | Related to skin toxicity, mean (SD) | All-purpose, mean (95% CI) | CRC-related, mean (95% CI) | ||||||
| Q1W | Q2W | Q1W | Q2W | Q1W | Q2W | Q1W | Q2W | Q1W | Q2W | |
| Overall | 15,610.8 (14,700.21) | 20,570.2 (21,015.83) | 12,031.5 (12,377.21) | 15,711.8 (18,917.47) | 155.9 (1142.35) | 150.5 (826.65) | 16,468.50 (15,780.67–17,156.33) | 17,653.09 (16,540.27–18,765.90) | 12,884.97 (12,299.77–13,470.16) | 13,356.44 (12,370.70–14,342.17) |
| Outpatient | 11,571.4 (11,170.95) | 15,561.8 (15,419.75) | 9,919.3 (10,283.66) | 13,178.5 (14,632.01) | 105.2 (974.08) | 131.4 (786.54) | 12,415.73 (11,870.82–12,960.65) | 12,783.33 (11,949.86–13,616.79) | 10,791.47 (10,286.03–11,296.91) | 10,890.65 (10,103.41–11,677.89) |
| Inpatient | 3248.2 (8174.44) | 4142.7 (12,831.95) | 2067.4 (6213.77) | 2515.0 (11,479.62) | 5.9 (160.36) | 0.8 (20.45) | 3231.01 (2865.39–3596.64) | 4086.56 (3431.20–4741.91) | 2046.73 (1773.60–2319.86) | 2456.72 (1901.09–3012.35) |
| Pharmacy | 791.2 (1643.39) | 865.6 (1525.37) | 44.8 (553.24) | 18.3 (263.14) | 44.8 (553.24) | 18.3 (263.14) | 821.76 (746.12–897.39) | 783.20 (695.85–870.55) | 46.77 (19.79–73.74) | 9.07 (0.00–20.69) |
†
PPPM figures were derived by dividing the total HC during follow-up by the total time of follow-up and then summarized across all patients.
‡
Defined as any claim that had a diagnosis code for primary or secondary CRC or a CPT procedure code for CRC surgery.
CPT: Current Procedural Terminology; CRC: Colorectal cancer; HC: Healthcare costs; PPPM: Per-patient-per-month; Q1W: Weekly; Q2W: Every 2 weeks; SD: Standard deviation.
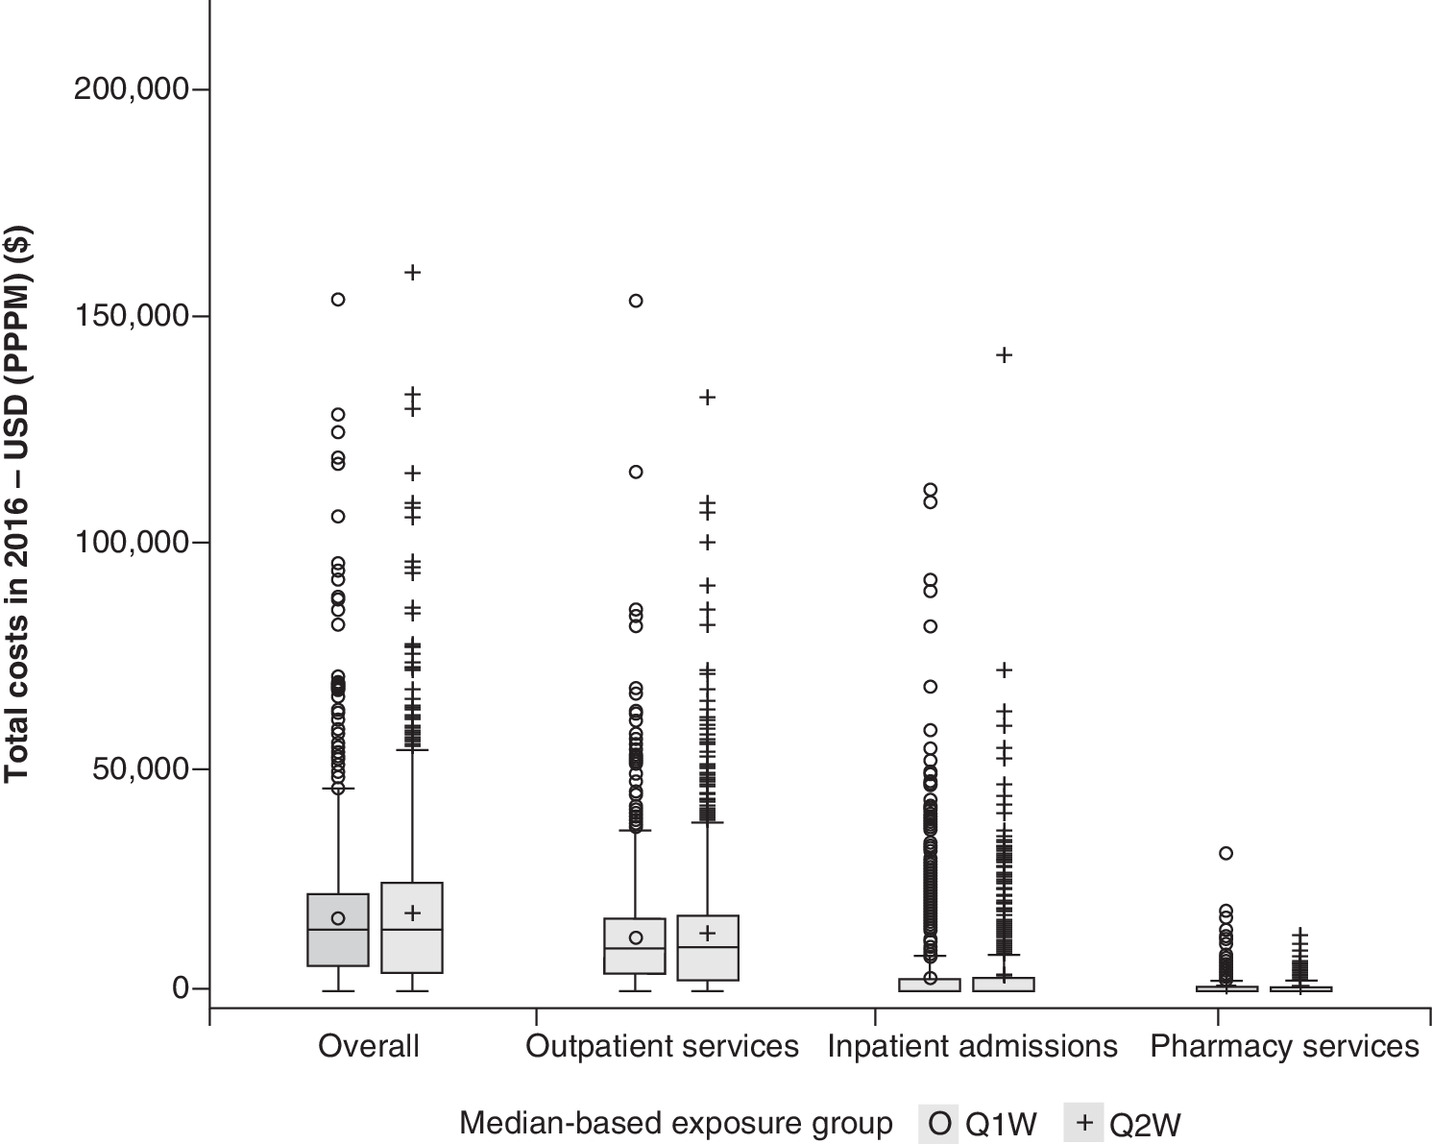
Figure 4. Box plots of all-purpose healthcare costs, outpatient costs and inpatient costs by exposure to cetuximab weekly versus every 2 weeks after inverse probability of treatment weighting.
PPPM: Per-patient-per-month; Q1W: Weekly; Q2W: Every 2 weeks; USD: US dollar.
| Cost category | All-purpose | CRC-related costs | ||
|---|---|---|---|---|
| Exponential of parameter estimate [Exp(β)] with 95% CI | p-value | Exponential of parameter estimate [Exp(β)] with 95% CI | p-value | |
| Overall resources | ||||
| Costs Q1W, USD PPPM | 14,947.59 (11,282.03–19,804.09) | 0.06 | 10,598.80 (7632.14–14,718.62) | 0.39 |
| Costs Q2W, USD PPPM | 16,039.45 (12,111.52–21,241.26) | 11,001.10 (7916.66–15,287.29) | ||
| Ratio, Q2W vs Q1W | 1.07 (1.00–1.15) | 1.04 (0.95–1.13) | ||
| Outpatient services | ||||
| Costs Q1W, USD PPPM | 11,395.90 (8513.09–15,254.91) | 0.44 | 9,712.87 (6970.78–13,533.61) | 0.82 |
| Costs Q2W, USD PPPM | 11,742.28 (8770.67–15,720.71) | 9,810.20 (7037.13–13,676.03) | ||
| Ratio, Q2W vs Q1W | 1.03 (0.95–1.11) | 1.01 (0.93–1.10) | ||
| Inpatient admissions | ||||
| Costs Q1W, USD PPPM | 124,718.93 (7945.94–1,957,579.78) | 0.30 | N/A | |
| Costs Q2W, USD PPPM | 29,581.82 (6931.28–126,251.50) | |||
| Ratio, Q2W vs Q1W | 0.24 (0.02–3.63) | |||
| Pharmacy services | ||||
| Costs Q1W, USD PPPM | 516.72 (303.80–878.86) | 0.50 | N/A | |
| Costs Q2W, USD PPPM | 492.51 (288.08–842.01) | |||
| Ratio, Q2W vs Q1W | 0.95 (0.83–1.10) | |||
CRC: Colorectal cancer; N/A: Not applicable due to low number of claims; PPPM: Per-patient-per-month; Q1W: Weekly; Q2W: Every 2 weeks; USD: US dollar.
Discussion
In this study, lower all-purpose and all-outpatient HRU for the Q2W cetuximab regimen versus the Q1W regimen (non-overlapping 95% CIs) for patients with mCRC treated with cetuximab in combination with chemotherapy were observed, after considering imbalances in baseline characteristics. Interestingly, the differences for inpatient or outpatient HRU were less than twofold, which would be expected based on the difference in cetuximab schedules and suggests that patients receiving cetuximab Q2W may receive additional services unrelated to CRC during their encounters compared with patients treated with cetuximab Q1W. Numerical differences were noted for costs between the two cohorts, with a weighted average of $17,653 PPPM for Q2W and $16,469 PPPM for Q1W. Notably, the difference between the two treatment regimens was reduced when restricting to CRC-related claims: $13,356 and $12,884 for Q2W and Q1W, respectively. The reduced difference in costs across both treatment schedules when restricting to CRC-related claims, associated with a lower (but less than twofold) HRU in the Q2W cohort, suggests that patients treated with the cetuximab Q2W regimen may have received additional more costly non-CRC services during their encounters compared with the patients treated with the Q1W regimen. Similar findings were obtained when using a GLM for cost analysis. While this could be an explanation, we did not test for this hypothesis as part of our study.
We did not observe the expected reduction in costs for the Q2W cohort despite the lower HRU for this group. One explanation for this observation may be that healthcare plans for the Q2W cohort were more comprehensive than those for the Q1W cohort, as there is a link between the comprehensiveness of insurance plans and employment status (‘employed’ status was more common among patients in the Q2W cohort). It is possible that clinicians were more likely to offer more expensive or a greater number of services, partly as a consequence of better insurance plans, a phenomenon known as supplier-induced demand. We are unable to test this hypothesis in the current study; however, it may be possible to test whether this pattern occurs in healthcare settings with less heterogeneity in the costs of encounters. However, it is unlikely that the patients in the Q2W cohort underwent a greater number of services, as this cohort had lower HRU versus the Q1W cohort. A second explanation is that those with better insurance may be less cost-conscious when requesting care services, which could result in a higher cost per HRU. Additionally, a patient with a higher-coverage plan may be more likely to visit a clinician than a patient with a lower-coverage plan. There could be added costs for this visit without a resulting claim for the additional services consumed, a phenomenon known as moral hazard. Third, although overall HRU was lower in the Q2W cohort with an overall similar cost between groups, the impact of so-called super users has not been assessed. It has been observed that a relatively small number of patients can utilize a disproportionally large number of resources, which would skew the distribution. The observed range of costs PPPM in this study suggests that this may be the case.
The current study provided longitudinal tracking of patient-level data for two cetuximab regimens (Q2W vs Q1W) in mCRC across multiple settings of care in the United States. A number of studies have examined the effectiveness of cetuximab Q2W versus Q1W when added to chemotherapy with respect to overall survival time in patients with RAS wt mCRC [21–23]. However, to the best of our knowledge, this is the first study comparing HRU and HC associated with Q1W and Q2W cetuximab regimens in an observational setting in mCRC. Both the all-cause and CRC-related HRU tended to be lower for patients receiving cetuximab Q2W versus Q1W, which is expected because the Q2W regimen requires fewer infusions than the Q1W regimen. The absence of differences in the ratio of costs between exposure groups and the numerically higher costs for patients receiving cetuximab Q2W were unexpected findings that may appear counterintuitive. When limited to CRC-related costs, no difference was seen between the two regimens, which suggests that patients treated with the Q2W regimen may be receiving additional non-CRC-related services during their visits versus patients treated with the Q1W regimen, however, exploration of these types of services have not been considered in our analyses. This conclusion is supported by the higher proportion of employed patients at baseline in the Q2W cohort (33.6%) than the Q1W cohort (26.0%), which is an indicator of broader insurance benefits and probably more costly services being provided to the Q2W patients. While commercial and Medicare coverage were used as covariates in the hdPS, the type of plan was not included. This hypothesis would have to be tested in a universal healthcare system, where differences in employment status are not expected to have a major impact on costs.
The claims data used in this study provide an accountant’s point of view and are expected to capture all meaningful HRU in a large population considered to have severe disease (>500 patients per cohort). The adjustment methods for our analysis utilized the high dimensionality of the data to account for both observed and potential unobserved confounders. Metastatic stage of disease could not be derived accurately from the claims database, as the associated records rely on the use of proxies for the identification of mCRC, which could lead to the inclusion of patients who may have been diagnosed with non-mCRC. However, this effect is thought to be minimal because we excluded all SCCHN diagnoses and required that all included patients received a combination of cetuximab and chemotherapy. Additionally, any risk of misclassification is unlikely to differentially impact each exposure group. Costs not leading to insurance claims, such as over-the-counter medications, were not accounted for; however, these are expected to be very low in a population of severely ill patients. Although this study had a short follow-up period, a sufficient number of events was observed to achieve sufficient power to compare the two cohorts, and the length of follow-up was similar for both treatment schedules, suggesting that any impact from this limitation would be the same across both treatment regimens. However, crude costs and HRU for a single regimen should be interpreted with caution given this short follow-up time.
Conclusion
This noninterventional study based on secondary use of data demonstrated numerically lower HRU and similar HC for patients with mCRC receiving cetuximab Q2W or Q1W regimens in combination with chemotherapy after accounting for differences in baseline characteristics. Aligning the administration schedule of cetuximab with that of concomitant chemotherapy may reduce the number of healthcare encounters or HRU. Reducing overall HRU or clustering HRU into fewer encounters reduces the burden of disease management for both patients and caregivers and may impact the planning of patient care at the institutional level. From a resource utilization perspective, the cetuximab Q2W regimen represents a cost-neutral option for the treatment of patients with mCRC, supporting the use of this regimen in daily practice. Similar studies should be conducted to reproduce our findings in different healthcare settings.
•
Cetuximab is approved by the FDA for use in KRAS wild-type metastatic colorectal cancer (mCRC) at an initial dose of 400 mg/m2 followed by 250 mg/m2 weekly (Q1W), but a schedule of 500 mg/m2 every 2 weeks (Q2W) is common in clinical practice.
•
The real-world implications regarding the healthcare resource utilization (HRU) and healthcare costs (HC) of these two treatment regimens in daily practice are not well known.
•
We performed a cohort study based on the secondary use of data from a large US claims database, IBM MarketScan, to describe and compare HRU and HC for the Q2W versus Q1W cetuximab-dosing regimens in combination with chemotherapy for the treatment of mCRC.
•
We found that the Q2W cetuximab regimen is associated with lower HRU versus the Q1W regimen for patients with mCRC-receiving cetuximab with chemotherapy; however, there was no associated reduction in HC.
•
From a resource utilization perspective, the cetuximab Q2W regimen represents a cost-neutral option for the treatment of patients with mCRC, supporting the use of this regimen in daily practice.
Author contributions
All the authors were involved in the conception, design and interpretation of the study and contributed to revision and approval of the manuscript.
Financial & competing interests disclosure
This work was funded by Merck KGaA, Darmstadt, Germany. All the authors are employees of Merck KGaA, Darmstadt, Germany. The authors have no other relevant affiliations or financial involvement with any organization or entity with a financial interest in or financial conflict with the subject matter or materials discussed in the manuscript apart from those disclosed.
Medical writing support was provided by Jayme Warischalk, PhD, ClinicalThinking Inc. (Hamilton, NJ, USA), which was also funded by Merck KGaA, Darmstadt, Germany in accordance with Good Publication Practice (GPP3) guidelines (http://www.ismpp.org/gpp3).
Ethical conduct of research
This study uses data derived from US-centric administrative claims that were deidentified and certified as HIPAA compliant per U.S. Code of Federal Regulations (CFR 46.116). According to the CFR, this study meets criteria for a waiver of informed consent for research purposes for two principal reasons: the principal risk of the research is a breach of confidentiality, and written informed consent would be the only link between personal data and the patients' identity (CFR 46.117c), and it meets the four points outlined in CFR 46.116, including that the research risks are minimal, the waiver will not adversely affect the rights and welfare of the participants, the research could not be practicably carried out without the waiver, and it would not be possible to provide the participants with additional pertinent information because the research data could not be used to identify them.
Open access
This work is licensed under the Attribution-NonCommercial-NoDerivatives 4.0 Unported License. To view a copy of this license, visit http://creativecommons.org/licenses/by-nc-nd/4.0/
Supplementary Material
File (suppl_file.docx)
- Download
- 22.52 KB
References
Papers of special note have been highlighted as: • of interest
1.
American Cancer Society. Key statistics for colorectal cancer (2020). www.cancer.org/cancer/colon-rectal-cancer/about/key-statistics.html
2.
Keum N, Giovannucci E. Global burden of colorectal cancer: emerging trends, risk factors and prevention strategies. Nat. Rev. Gastroenterol. Hepatol. 16(12), 713–732 (2019).
3.
Siegel RL, Miller KD, Goding Sauer A et al. Colorectal cancer statistics, 2020. CA Cancer J. Clin. 70(3), 145–164 (2020).
4.
National Comprehensive Cancer Network. NCCN Clinical Practice Guidelines in Oncology: Colon Cancer. Version 4. 2020. www.nccn.org/professionals/physician_gls/pdf/colon.pdf
5.
National Comprehensive Cancer Network. NCCN Clinical Practice Guidelines in Oncology: Rectal Cancer. Version 6. 2020. www.nccn.org/professionals/physician_gls/pdf/rectal.pdf
6.
García-Foncillas J, Sunakawa Y, Aderka D et al. Distinguishing features of cetuximab and panitumumab in colorectal cancer and other solid tumors. Front. Oncol. 9, 849 (2019).
7.
Dekker E, Tanis PJ, Vleugels JLA et al. Colorectal cancer. Lancet 394(10207), 1467–1480 (2019).
8.
FDA. Erbitux (cetuximab). Prescribing information (2019). www.accessdata.fda.gov/drugsatfda_docs/label/2019/125084s273lbl.pdf
9.
Mrabti H, De la Fouchardiere C, Desseigne F et al. Irinotecan associated with cetuximab given every 2 weeks versus cetuximab weekly in metastatic colorectal cancer. J. Cancer Res. Ther. 5(4), 272–276 (2009).
10.
Yeh Y-S, Chiang C-Y, Chen C-J et al. Efficacy and safety of weekly and biweekly cetuximab-combined FOLFIRI regimen as first-line setting in patients with metastatic colorectal cancer: experience in a southern Taiwan medical center. J. Soc. Colon Rectal Surgeon (Taiwan). 21, 59–68 (2010).
11.
Brodowicz T, Ciuleanu TE, Radosavljevic D et al. FOLFOX4 plus cetuximab administered weekly or every second week in the first-line treatment of patients with KRAS wild-type metastatic colorectal cancer: a randomized phase II CECOG study. Ann. Oncol. 24(7), 1769–1777 (2013).
12.
Li J, Li J. Therapeutic effect of biweekly cetuximab combined with first-line chemotherapy on KRAS/RAS wild-type advanced colorectal cancer. Int. J. Clin. Exp. Med. 12(10), 12348–12355 (2019).
13.
Tabernero J, Pfeiffer P, Cervantes A. Administration of cetuximab every 2 weeks in the treatment of metastatic colorectal cancer: an effective, more convenient alternative to weekly administration? Oncologist 13(2), 113–119 (2008).
14.
NICE. NICE Guidance: cetuximab and panitumumab for previously untreated metastatic colorectal cancer (2017). www.nice.org.uk/Guidance/ta439
15.
Phelip JM, Tougeron D, Leonard D et al. Metastatic colorectal cancer (mCRC): French intergroup clinical practice guidelines for diagnosis, treatments and follow-up (SNFGE, FFCD, GERCOR, UNICANCER, SFCD, SFED, SFRO, SFR). Dig. Liver Dis. 51(10), 1357–1363 (2019).
16.
Lamy F-X, Batech M, Boutmy E et al. Comparative effectiveness of weekly versus every-2-weeks cetuximab in metastatic colorectal cancer in a US insured population. J. Comp. Eff. Res. 9(16), 1117–1129 (2020).
17.
Song X, Zhao Z, Barber B et al. Characterizing medical care by disease phase in metastatic colorectal cancer. Am. J. Manag. Care. 17(Suppl. 5), SP20–SP25 (2011).
• Describes an algorithm that can be used to empirically identify and prioritize candidate covariates in order to integrate them into a propensity score-based confounder adjustment model.
18.
Paramore LC, Thomas SK, Knopf KB et al. Estimating costs of care for patients with newly diagnosed metastatic colorectal cancer. Clin. Colorectal Cancer. 6(1), 52–58 (2006).
• Describes the resource use patterns and costs of care for patients with metastatic colorectal cancer using retrospective claims data from selected US health plans.
19.
Schneeweiss S, Rassen JA, Glynn RJ et al. High-dimensional propensity score adjustment in studies of treatment effects using health care claims data. Epidemiology 20(4), 512–522 (2009).
• Describes a statistical approach that can be used to obtain appropriate estimates of variance of the main effects in regression models for the purpose of performing inverse probability of treatment weighting to reduce selection bias.
20.
Xu S, Ross C, Raebel MA et al. Use of stabilized inverse propensity scores as weights to directly estimate relative risk and its confidence intervals. Value Health 13(2), 273–277 (2010).
21.
Kasper S, Cheng A, Overkamp F et al. Noninferiority on overall survival of every-2-weeks vs weekly schedule of cetuximab for first-line treatment of RAS wild-type metastatic colorectal cancer. Ann. Oncol. 30(Suppl. 5), v198–v252 (2019).
22.
Brodowicz T, Vrbanec D, Kaczirek K et al. FOLFOX4 plus cetuximab administered weekly or every two weeks in first-line treatment of patients with KRAS and NRAS wild-type (wt) metastatic colorectal cancer (mCRC). J. Clin. Oncol. 32(Suppl. 3), LBA391 (2017).
23.
Lamy FL, Batech M, Salim S et al. Real-world study of cetuximab used every other week versus weekly in US patients with metastatic colorectal cancer (mCRC). J. Clin. Oncol. 37(Suppl. 15), e15087 (2019).
Information & Authors
Information
Published In
Pages: 353 - 364
PubMed: 33502247
Copyright
© 2021 Merck KGaA, Darmstadt, Germany. This work is licensed under the Attribution-NonCommercial-NoDerivatives 4.0 Unported License
History
Received: 27 October 2020
Accepted: 16 December 2020
Published online: 27 January 2021
Keywords:
Topics
Authors
Metrics & Citations
Metrics
Article Usage
Article usage data only available from February 2023. Historical article usage data, showing the number of article downloads, is available upon request.
Citations
How to Cite
Real-world healthcare resource utilization and costs of weekly versus every-2-week cetuximab in metastatic colorectal cancer. (2021) Journal of Comparative Effectiveness Research. DOI: 10.2217/cer-2020-0232
Export citation
Select the citation format you wish to export for this article or chapter.
Citing Literature
- Markus Schulze, XiaoZhe Wang, Jawad Hamad, Julia C. F. Quintanilha, Lincoln W. Pasquina, Julia F. Hopkins, Juergen Scheuenpflug, Zheng Feng, Real‐world genomic landscape of colon and rectal cancer, FEBS Open Bio, 10.1002/2211-5463.13957, 15, 4, (674-685), (2025).
- Liya Wang, Mukul Singhal, Adriana Valderrama, Bal Nepal, Shital Kamble, Madhulika Eluri, Usha Malhotra, Abby Siegel, Michael Grabner, Shilpi Swami, Milind Javle, Real-world treatment patterns, resource utilization and costs in biliary tract cancers in the USA, Future Oncology, 10.1080/14796694.2024.2379237, 20, 34, (2625-2636), (2024).
- Carsten Bokemeyer, Fortunato Ciardiello, Olivier Dubreuil, Joel Guigay, Stefan Kasper, Per Pfeiffer, Carmine Pinto, Kensei Yamaguchi, Takayuki Yoshino, Christoph Zielinski, Regina Esser, Josep Tabernero, Cetuximab Every 2 Weeks Versus Standard Weekly Dosing Administration Schedule, Future Oncology, 10.2217/fon-2023-0282, 20, 7, (393-407), (2023).
- Himani Aggarwal, Yimei Han, Kristin M Sheffield, Zhanglin Lin Cui, Real-world comparison between weekly versus biweekly dosing of cetuximab for metastatic colorectal cancer, Journal of Comparative Effectiveness Research, 10.2217/cer-2022-0143, 12, 2, (2023).
- Kelly M. Kenzik, Grant R. Williams, Robert Hollis, Smita Bhatia, Healthcare utilization trajectory among survivors of colorectal cancer, Journal of Cancer Survivorship, 10.1007/s11764-022-01206-y, 17, 3, (729-737), (2022).