Real-world comparison between weekly versus biweekly dosing of cetuximab for metastatic colorectal cancer
Publication: Journal of Comparative Effectiveness Research
Abstract
Aim: This real-world study aims to compare overall survival (OS) associated with biweekly (Q2W) versus weekly (Q1W) cetuximab dosing regimens for metastatic colorectal cancer (mCRC) treatment in the US. Methods: Adult patients with KRAS wild-type mCRC who received cetuximab ± chemotherapy from 2013 to 2019 were selected using Flatiron Health's electronic health records database. Propensity score matching was used to balance Q2W and Q1W cohorts on baseline patient characteristics. The Kaplan–Meier method was used for survival analyses. Several sensitivity analyses were conducted to assess the robustness of findings from the main analysis. Results: Of 1075 patients in the study, 60.7% received cetuximab Q1W and 39.3% Q2W. Median OS (95% confidence interval) in months was 17.2 (15.3, 18.8) for Q2W versus 14.3 (12.8, 16.0) for Q1W; p = 0.246. Similar OS between the dosing cohorts was observed in sensitivity analyses. Conclusion: Weekly and biweekly cetuximab had comparable effectiveness in this real-world study.
Colorectal cancer (CRC) is the third most diagnosed cancer as well as the third leading cause of cancer-related deaths among adults in the US. An estimated 151,030 individuals will be diagnosed with CRC in 2022 and 52,580 will die from the disease annually [1]. Approximately 20–25% of patients with CRC have metastatic disease (mCRC) at initial diagnosis, and up to 50% of patients diagnosed with earlier stage CRC advance to mCRC in their lifetime [2–5]. Patients with mCRC have poor outcomes, with five-year survival rates of approximately 14% [1,6]. Recent advances in treatments, including the availability of targeted therapies tailored to the clinical and molecular features of the tumor, have improved survival in patients with mCRC. In patients with mCRC with Kirsten rat sarcoma wild-type mCRC (KRAS WT mCRC), the addition of panitumumab or cetuximab, which targets the epidermal growth factor receptor (EGFR), to chemotherapy have improved survival outcomes [7,8].
Cetuximab (Erbitux®), an anti-EGFR immunoglobulin G1 monoclonal antibody, is indicated for the treatment of KRAS WT, EGFR-expressing, mCRC, as determined by an FDA-approved test [9]. Cetuximab is used in combination with FOLFIRI (fluorouracil, leucovorin, and irinotecan) for first-line treatment, or in combination with irinotecan in patients who are refractory to irinotecan-based chemotherapy. It is also used as a single agent in patients who have failed oxaliplatin and irinotecan-based chemotherapy or who are intolerant to irinotecan [10]. Cetuximab was originally approved in a dosing regimen that comprised an initial intravenous infusion of 400 mg/m2, followed by subsequent weekly doses (Q1W) of 250 mg/m2 [11,12]. On 6 April 2021, cetuximab was approved for use in a new biweekly dosing regimen (Q2W) in patients with mCRC in the US [13]. The newly approved dosing regimen comprises 500 mg/m2 dose of cetuximab administered as 120-min intravenous infusions every two weeks [13]. FDA's approval of the Q2W dosing regimen was based on efficacy results that used Flatiron Health's real-world data and population pharmacokinetic/pharmacodynamic (PK/PD) modeling analyses that compared predicted exposures and responses of cetuximab 500 mg Q2W to observed cetuximab 250 mg Q1W [14,15]. The application was also supported by a meta-analysis of efficacy and safety of clinical trials and real-world evidence on comparative effectiveness data of Q2W versus Q1W dosing regimen of cetuximab [16,17].
The standard cetuximab Q1W regimen is not aligned with the dosing schedule of chemotherapy regimens that are administered in combination with cetuximab [18]. These regimens include FOLFIRI, which is administered on a Q2W basis in first line of therapy (LOT1) [18,19], or irinotecan, which is often administered on a Q2W dose of 180 mg/m2 [20]. The approval of the cetuximab Q2W dosing regimen offers a convenient option for patients by allowing the administration of chemotherapy and cetuximab on same patient visits and reducing the number of required visits relative to the Q1W dosing regimen. Furthermore, the Q2W 500 mg/m2 dosing regimen has been shown to lower both direct and indirect (associated with loss of productivity of patients and their caregiver) costs of treatment [21]. A recently published real-world study using IBM® MarketScan® data also reported numerically lower healthcare resource utilization for Q2W versus Q1W dosing regimen in mCRC treatment [22].
The Q2W dosing regimen has been demonstrated to confer equivalent efficacy and safety compared with the Q1W dosing regimen for treatment of mCRC in a recent meta-analysis that included four studies with a total 381 patients [23]. However, there is limited real-world evidence on effectiveness of the Q2W dosing regimen compared with Q1W dosing regimen for treatment of mCRC. This study utilized the Flatiron Health's electronic health record (EHR) database to compare overall survival (OS) and time to treatment discontinuation (TTD) among KRAS WT mCRC patients treated with Q2W dosing regimen of cetuximab to patients treated with Q1W dosing regimen. Evidence from part of these analyses was used by the FDA to support the approval of the Q2W dosing regimen of cetuximab [13,14].
Methods
Study design
This is a retrospective, observational, comparative effectiveness study that utilized the Flatiron Health nationwide EHR-derived de-identified database. The Flatiron Health database is a longitudinal database, comprising de-identified patient-level structured and unstructured data, curated via technology-enabled abstraction [24,25]. The study period was from 1 January 2013 to 31 December 2019. During the study period, the de-identified data originated from approximately 280 cancer clinics (∼800 sites of care). The majority of patients in the database originated from community oncology practices [24]. To allow for at least six months of follow-up period, the index period was from 1 January 2013 to 30 June 2019. The index date was defined as the date of initiating cetuximab-containing regimen in LOT1, second line of therapy (LOT2), or third line of therapy (LOT3).
The patient data used in this non-interventional study have been de-identified in compliance with Health Insurance Portability and Accountability Act regulations. Ethical approval of a broad parent study protocol from Flatiron Health, including a waiver of informed consent, was obtained from a central Institutional Review Board.
Patient population
Adult patients (≥18 years of age) were included in the study if they: had ≥ two visits documented in the EHR, a confirmed diagnosis of stage IV or recurrent mCRC (obtained via abstraction of unstructured data) as of 1 January 2013, received cetuximab-containing regimens (cetuximab monotherapy or in combination with irinotecan, or FOLFIRI, or FOLFOX [fluorouracil, leucovorin, and oxaliplatin]) in LOT1, LOT2, or LOT3 during the index period, a documented biomarker status for KRAS WT before or up to 30 days after initiation date of cetuximab-containing regimens, and a gap of ≤90 days between the date of mCRC diagnosis and first structured activity (for example, office visits, labs, medication orders or administrations). Patients were excluded from the study if they had received bevacizumab or panitumumab or regorafenib in combination with cetuximab. The CRC diagnosis was identified using the International Classification of Diseases Ninth Revision (ICD)-9 codes 153.x, or 154.x, or ICD-10 codes C18x, C19x, C20x, or C21x.
Rules for Dosing Co,hort & LOT Determination
Patients eligible for the study were classified into Q1W, Q2W, or other dosing schedules based on the time gap between consecutive cetuximab administrations. Specifically, patients were assigned to Q1W cohort in a LOT if they had 70% or more cetuximab infusions with a gap of 4–10 days (weekly gap) from the previous infusion in the respective LOT. Patients were assigned to Q2W cohort in a LOT if they had 70% or more cetuximab infusions with a gap of 11–18 days (biweekly gap) from the previous infusion in the respective LOT. Patients who did not fall into either Q1W or Q2W cohort constituted the “other” cohort and were excluded from the comparative analyses.
All anti-cancer agents received by a patient within 28 days of the start of therapy constituted a LOT. A LOT is “advanced” if any anti-cancer agent was added to a regimen after 28 days of the start of the line of therapy. The LOT is also “advanced” if cetuximab is added to a regimen after 60 days from the start of the regimen. Flatiron Health-derived LOT rules in mCRC allowed for the addition of cetuximab within 60 days of the start of a regimen without advancing the line number. Therefore, the LOT is “advanced” if cetuximab is added to a regimen after 60 days from the start of the regimen.
Study end points & definitions
The primary end point was OS, that was calculated from the index date to the date of death for the overall cohort (LOT1 or LOT2 or LOT3) and for each LOT of the index cetuximab treatment (LOT1, LOT2, and LOT3, respectively). A composite mortality end point developed by Zhang et al. for EHR-derived data was used to determine the date of death [26]. The secondary end point was TTD, which was calculated from the first to last administration date of cetuximab in LOT1, LOT2 or LOT3. A patient was classified as discontinuing treatment at the last non-cancelled order or administration date uncensored if one of the three events were observed in the data: 1) patient advanced to a new LOT after discontinuing treatment in the previous LOT; 2) patients did not advance to a new LOT, however, they had a recorded date of death, or 3) patient did not advance to a new LOT and had no recorded date of death, however they had a gap of ≤120 days between the last cetuximab administration date and last clinical contact date in the dataset.
Statistical analysis
Propensity score matching was used to balance Q2W and Q1W cohorts on all measured baseline patient characteristics before comparing OS and TTD between the Q2W and Q1W cohorts. A logistic regression model was developed to generate propensity scores with the binary dosing schedule cohort (Q2W vs Q1W) as the dependent variable for overall population and for each LOT, respectively. The matching ratio between cohorts was 1:1 for the main analysis. A greedy propensity-score matching was conducted on the logit of propensity score against a caliper of width equal to 0.2 of the pooled standard deviation of the logit of the propensity scores [27]. All measured baseline patient characteristics were included as covariates in the propensity score matching models. The covariates included age (on the index date), gender, race, ethnicity, region of residence, practice type (academic vs community), body mass index (BMI) on the index date, cancer stage at initial diagnosis, Eastern Cooperative Oncology Group performance status (ECOG PS) on the index date, time from initial diagnosis to the index date, time from metastatic diagnosis to the index date, cancer site (colon vs rectal) at initial diagnosis, NRAS mutation status on the index date (positive, negative, or unknown), BRAF mutation status on the index date (positive, negative, or unknown), and chemotherapy backbone (FOLFIRI, FOLFOX, irinotecan, no chemotherapy). Line of therapy was included as a covariate only in the overall population model.
Descriptive statistics such as means, standard deviations (SD) were calculated for continuous variables. Absolute and relative frequencies and percentages were generated for categorical variables. P-values were calculated from t-tests for continuous variables and chi-squared tests for categorical variables. Kaplan–Meier method and Cox proportional hazards regression models were used to compare OS and TTD associated with Q2W versus Q1W cetuximab dosing schedules; results were reported as hazard ratios (HRs) with log-rank test p-values and 95% confidence intervals (CI). Patients with missing continuous variables were excluded from the propensity score model. Patients with missing categorical variables were classified into “missing/unknown” category and were included in both the propensity score and Cox proportional hazards regression models. A two-sided significance level of p < 0.05 was used for statistical comparisons. Statistical analyses were performed using Statistical Analysis System (SAS) Enterprise Guide 7.1.
Sensitivity analysis
Sensitivity analyses were conducted to assess the robustness of the effectiveness results from the main analysis. The first sensitivity analysis included the use of a stringent criterion to compare precise dosing schedule cohorts by including patients in the Q1W cohort who had 100% of cetuximab administrations with a time gap of 4–10 days from the previous cetuximab administration, and patients in Q2W cohort had 100% of cetuximab administrations with a time gap of 11–18 days from the previous cetuximab administration. The second sensitivity analysis excluded patients with a gap at ≥99th percentile of the distribution of time gap between the adjacent cetuximab administrations in the main analysis. The ≥99th percentile on the time gap distribution corresponded to greater than 35 days gap for the Q1W cohort and greater than 70 days gap for the Q2W cohort in the overall population. The third sensitivity analysis included the estimation of E-values to assess the impact of unmeasured confounders on the effectiveness results of the main analysis. The E-value is the minimum strength of association on the risk ratio scale that an unmeasured confounder would need to have with both the treatment (dosing schedule) and outcome conditional on the measured covariates to explain away a treatment-outcome association [28]. A small E-value implies low unmeasured confounding would be needed to explain away an effect estimate. The fourth sensitivity analysis excluded patients with unknown or missing ECOG PS in the main analysis. The fifth sensitivity analysis was conducted using a 1:2 matching ratio in which one patient from the Q2W cohort was matched to up to two patients in the Q1W cohort in the propensity score matching. The sixth sensitivity analysis involved using a reweighting method called entropy balancing to balance Q2W and Q1W cohorts on the measured baseline patient characteristics [29].
Results
Baseline characteristics of patients in Q1W and Q2W cohorts are reported in Table 1. A total of 1075 patients with mCRC were included in this study. Of these, 60.7% (n = 653) were classified as having received cetuximab Q1W and 39.3% (n = 422) as Q2W. In the Q1W cohort, 34.6% patients received cetuximab in LOT1; 44.7% in LOT2; and 20.7% in LOT3. In the Q2W cohort, 34.8% patients received cetuximab in LOT1; 43.8% in LOT2; and 21.3% in LOT3.
| Overall | LOT1 | LOT2 | LOT3 | |||||||||
|---|---|---|---|---|---|---|---|---|---|---|---|---|
| Q1W | Q2W | Q1W | Q2W | Q1W | Q2W | Q1W | Q2W | |||||
| n (%) 653 (60.7) | n (%) 422 (39.3) | p-value§ | n (%) 226 (34.6) | n (%) 147 (34.8) | p-value§ | n (%) 292 (44.7) | n (%) 185 (43.8) | p-value§ | n (%) 135 (20.7) | n (%) 90 (21.3) | p-value§ | |
| Median age (year) | 65.0 | 62.0† | 0.010 | 64.0 | 64.0 | 0.337 | 65.0 | 61.0 | 0.093 | 65.0 | 60.0† | 0.044 |
| Male, % | 59.3 | 58.5 | 0.811 | 61.1 | 57.8 | 0.533 | 59.6 | 58.4 | 0.793 | 55.6 | 60.0 | 0.509 |
| Cancer stage at initial diagnosis, % | ||||||||||||
| Stage I | 1.5 | 1.0† | 0.024 | 0.4 | 0.0† | 0.012 | 1.4 | 1.6‡ | 0.002 | 3.7 | 1.1 | 0.819 |
| Stage II | 7.0 | 12.1† | 8.4 | 12.9† | 7.2 | 15.1‡ | 4.4 | 4.4 | ||||
| Stage III | 29.4 | 28.7† | 39.8 | 26.5† | 24.0 | 33.5‡ | 23.7 | 22.2 | ||||
| Stage IV | 58.5 | 56.6† | 45.6 | 58.5† | 65.1 | 48.7‡ | 65.9 | 70.0 | ||||
| Race, % | ||||||||||||
| White | 66.5 | 68.3 | 0.695 | 67.3 | 62.0 | 0.217 | 66.1 | 75.1 | 0.102 | 65.9 | 64.4 | 0.845 |
| African American | 8.6 | 7.8 | 8.9 | 4.8 | 8.6 | 8.7 | 8.2 | 11.1 | ||||
| Asian | 3.8 | 3.6 | 2.2 | 4.1 | 5.1 | 3.8 | 3.7 | 2.2 | ||||
| Other | 13.9 | 11.6 | 15.0 | 19.1 | 13.4 | 6.0 | 13.3 | 11.1 | ||||
| Unknown/missing | 7.2 | 8.8 | 6.6 | 10.2 | 6.9 | 6.5 | 8.9 | 11.1 | ||||
| Ethnicity, % | ||||||||||||
| Hispanic | 13.2 | 7.6‡ | 0.004 | 12.8 | 10.2 | 0.442 | 12.7 | 4.9‡ | 0.005 | 14.8 | 8.9 | 0.187 |
| Non-Hispanic | 86.8 | 92.4‡ | 87.2 | 89.8 | 87.3 | 95.1‡ | 85.2 | 91.1 | ||||
| Practice type, % | ||||||||||||
| Academic | 0.8 | 3.3‡ | 0.002 | 0.9 | 2.0 | 0.343 | 0.7 | 3.2† | 0.034 | 0.7 | 5.6† | 0.028 |
| Community | 99.2 | 96.7‡ | 99.1 | 98.0 | 99.3 | 96.8† | 99.3 | 94.4† | ||||
| Region, % | 0.084 | 0.373 | 0.658 | 0.228 | ||||||||
| Northeast | 18.4 | 23.7 | 22.1 | 25.2 | 16.8 | 20.5 | 15.6 | 27.8 | ||||
| Midwest | 13.5 | 12.1 | 12.4 | 12.2 | 15.4 | 13.5 | 11.1 | 8.9 | ||||
| South | 36.8 | 30.6 | 38.9 | 29.3 | 32.5 | 30.8 | 42.2 | 32.2 | ||||
| West | 26.2 | 29.4 | 23.9 | 30.6 | 28.1 | 30.3 | 25.9 | 25.6 | ||||
| Unknown/missing | 5.2 | 4.3 | 2.7 | 2.7 | 7.2 | 4.9 | 5.2 | 5.6 | ||||
| BMI (kg/m2), % | 0.126 | 0.605 | 0.683 | 0.062 | ||||||||
| Underweight | 6.0 | 4.3 | 4.9 | 4.8 | 5.5 | 4.9 | 8.9 | 2.2 | ||||
| Normal | 31.7 | 34.4 | 31.0 | 37.4 | 31.9 | 33.5 | 32.6 | 31.1 | ||||
| Overweight | 30.8 | 30.8 | 32.7 | 32.7 | 29.5 | 29.2 | 30.4 | 31.1 | ||||
| Obese | 25.1 | 27.3 | 26.6 | 22.5 | 25.7 | 28.1 | 21.5 | 33.3 | ||||
| Unknown/missing | 6.4 | 3.3 | 4.9 | 2.7 | 7.5 | 4.3 | 6.7 | 2.2 | ||||
| ECOG PS, % | 0.031 | 0.095 | 0.240 | 0.467 | ||||||||
| 0 | 25.4 | 30.8† | 31.4 | 37.4 | 22.3 | 27 | 22.2 | 27.8 | ||||
| 1 | 26.7 | 30.8† | 18.1 | 22.5 | 30.5 | 35.7 | 32.6 | 34.4 | ||||
| 2+ | 9.50 | 9.20† | 5.30 | 8.8 | 11.6 | 11.4 | 11.9 | 5.6 | ||||
| Unknown/missing | 38.4 | 29.2† | 45.1 | 31.3 | 35.6 | 26.0 | 33.3 | 32.2 | ||||
| NRAS status, % | <0.001 | 0.001 | <0.001 | 0.001 | ||||||||
| Wild-type | 32.6 | 53.6‡ | 29.7 | 49.0‡ | 31.9 | 52.4‡ | 39.3 | 63.3‡ | ||||
| Mutation-positive | 1.2 | 0.7‡ | 0.4 | 0.7‡ | 1.7 | 0‡ | 1.5 | 2.2‡ | ||||
| Unknown/missing | 66.2 | 45.7‡ | 69.9 | 50.3‡ | 66.4 | 47.6‡ | 59.3 | 34.4‡ | ||||
| BRAF status, % | <0.001 | 0.068 | 0.004 | 0.003 | ||||||||
| Wild-type | 33.7 | 49.3‡ | 33.2 | 44.9 | 33.6 | 48.7‡ | 34.8 | 57.8‡ | ||||
| Mutation-positive | 4.3 | 4.3‡ | 4.0 | 4.1 | 4.5 | 4.3‡ | 4.4 | 4.4‡ | ||||
| Unknown/missing | 66.2 | 45.7‡ | 62.8 | 51.0 | 62.0 | 47.0‡ | 60.7 | 37.8‡ | ||||
| Chemotherapy backbone, % | 0.003 | 0.002 | 0.479 | 0.239 | ||||||||
| FOLFIRI | 45.3 | 47.4‡ | 52.7 | 46.9‡ | 46.9 | 50.8 | 29.6 | 41.1 | ||||
| FOLFOX | 12.7 | 18.0‡ | 25.2 | 40.8‡ | 5.5 | 6.5 | 7.4 | 4.4 | ||||
| Irinotecan | 28.2 | 27.0‡ | 10.2 | 8.8‡ | 33.9 | 33.5 | 45.9 | 43.3 | ||||
| Cetuximab monotherapy | 13.8 | 7.6‡ | 12.0 | 3.4‡ | 13.7 | 9.2 | 17.0 | 11.1 | ||||
| Cancer site at initial diagnosis, % | 0.797 | 0.275 | 0.934 | 0.618 | ||||||||
| Colon | 73.4 | 71.6 | 75.2 | 70.1 | 74.0 | 72.4 | 68.9 | 72.2 | ||||
| Rectum | 24.8 | 26.3 | 23.9 | 27.2 | 24.0 | 25.4 | 28.2 | 26.7 | ||||
| Colorectal NOS | 1.8 | 2.1 | 0.9 | 2.7 | 2.1 | 2.2 | 3.0 | 1.1 | ||||
| Median time from initial diagnosis to index date, day | 475.5 | 539.5 | 0.329 | 341.5 | 78.0† | 0.010 | 437.0 | 591.0‡ | 0.002 | 683.0 | 713.5 | 0.855 |
| Median time from metastatic diagnosis to index date, day | 238.0 | 237.5 | 0.208 | 40.0 | 39.0 | 0.751 | 297.0 | 329.0 | 0.641 | 497.0 | 564† | 0.027 |
†
Significant at p < 0.05.
‡
Significant at p < 0.01.
§
p-values were calculated from t-test for continuous variables and chi-squared test for categorical variables excluding the unknown/missing category.
ECOG PS: Eastern Cooperative Oncology Group Performance Status; FOLFIRI: Folinic acid, fluorouracil and irinotecan; FOLFOX: Folinic acid, fluorouracil and oxaliplatin. LOT1: First-line of therapy; LOT2: Second-line of therapy; LOT3: Third-line of therapy; NOS: Not otherwise specified; Q1W: Weekly; Q2W: Biweekly.
Baseline patient characteristics in the dosing cohorts
The Q1W cohort was older than the Q2W cohort (median age: 65 vs 62 years; p = 0.01; Table 1). The two dosing cohorts also differed significantly on ECOG PS; the Q2W cohort had a higher proportion of patients with ECOG PS of 0 or 1 compared with the Q1W (Q2W: 61.6% vs Q1W: 52.1%; p = 0.31). It is important to note that both cohorts had considerable missing data for ECOG PS (Q1W: 38.4%; Q2W: 29.2%).
There were significant differences in the cancer stage at initial diagnosis (p = 0.02) between the two dosing cohorts. In the Q1W cohort, 1.5% patients had stage I at initial diagnosis, 7.0% had stage II, 29.4% had stage III, and 58.5% had stage IV. In the Q2W cohort, 1.0% patients had stage I at initial diagnosis, 12.1% had stage II, 28.7% had stage III, and 56.6% had stage IV. A significantly greater proportion of patients in Q2W, compared with Q1W, had NRAS WT status (53.6% vs 32.6%; p < 0.001) or BRAF WT status (49.3% vs 33.7%; p < 0.001), although NRAS and BRAF status were not available for 45.7% of patients in the study (Table 1). In terms of chemotherapy used in combination with cetuximab, the two cohorts differed significantly (p = 0.003). Approximately 45.3% of patients were administered cetuximab Q1W in combination with FOLFIRI versus 47.4% in Q2W. There was also a significant difference in the use of FOLFOX in combination with cetuximab with greater proportions in the Q2W cohort (18%) versus the Q1W cohort (12.7%; Table 1).
In terms of similarities, both dosing cohorts had a greater proportion of males (Q1W: 59.3%; Q2W: 58.5%), white (Q1W: 66.5%; Q2W: 68.3%), and non-Hispanic patients (Q1W: 86.8%; Q2W: 92.4%). In both cohorts, over 96% of patients were seen in community oncology practices and over 30% were from the southern region of the US. Over half the patients in both cohorts were either overweight or obese. Site of initial CRC diagnosis (p = 0.797), median time from initial diagnosis to the index date (p = 0.329) and median time from metastatic diagnosis to the index date (p = 0.208) did not differ significantly between the dosing cohorts (Table 1).
The median (range) dosage of cetuximab in Q1W cohort was 246.1 (112.9–336.1) mg/m2; and 484.9 (185.0–532.7) mg/m2 for the Q2W cohort (Supplemental Table 1). The distribution of the time gap between consecutive cetuximab administrations was positively skewed with a long tail for both cohorts (median [range] for Q1W: 7 [1–756] days; Q2W: 14 (1–527] days). The 25th, 75th, 90th and 99th percentiles of the time gap between administrations for the Q1W cohort were 7, 7, 9, and 35 days, respectively; and that for the Q2W cohort were 14, 14, 20, and 70 days, respectively (Supplementary Table 2).
Propensity score-matched characteristics of patients in the dosing cohorts
The distribution of propensity scores on baseline patient characteristics showed a good overlap between both cohorts, suggesting that patients had approximately equal probabilities of being in either the Q1W or Q2W dosing cohort. The covariate balances were satisfactory (standardized mean difference <0.1) in the propensity score matching. After propensity score matching, Q1W and Q2W cohorts did not exhibit any statistically significant differences in their baseline characteristics (Supplementary Table 3).
Overall Survival & Time to Treatment Discontinuation
Patients in the Q2W cohort had similar median OS compared with patients in the Q1W cohort. Specifically, the median OS (in months) in propensity score-matched cohorts was 17.2 (95% CI: 15.3, 18.8) for Q2W versus 14.3 (95% CI: 12.8, 16.0) for Q1W; p = 0.246 (Table 2 & Figure 1). The HR for OS between the Q2W and Q1W cohorts was 0.90 (95% CI: 0.75, 1.08). There was no statistically significant difference in median OS between the dosing cohorts by LOT. The median OS (95% CI) in months for Q2W versus Q1W in LOT1: 29.1 (17.8, 36.9) versus 23.4 (13.1, 32.2, p = 0.347; LOT2: 15.4 (11.9, 18.7) versus 12.9 (11.1, 14.7), p = 0.504; and LOT3: 12.8 (9.4, 15.5) versus 12.5 (9.8, 15.6) p = 0.883. The HR (95% CIs) for Q2W versus Q1W in LOT1, LOT2 and LOT3 were 0.86 (0.62, 1.18), 0.92 (0.71, 1.19), and 0.97 (0.65, 1.44), respectively (Table 2).
| Population | Dosing schedule | N | Censoring rate (%) | Median OS (95% CI), Month | HR (95% CI) | Log-Rank p |
|---|---|---|---|---|---|---|
| Overall | Q1W (Reference) | 364 | 30.0 | 14.3 (12.8, 16.0) | 0.90 (0.75, 1.08) | 0.246 |
| Q2W | 364 | 35.4 | 17.2 (15.3, 18.8) | |||
| LOT1 | Q1W (Reference) | 121 | 38.0 | 23.4 (13.1, 32.2) | 0.86 (0.62, 1.18) | 0.347 |
| Q2W | 121 | 40.5 | 29.1 (17.8, 36.9) | |||
| LOT2 | Q1W (Reference) | 159 | 23.3 | 12.9 (11.1, 14.7) | 0.92 (0.71, 1.19) | 0.504 |
| Q2W | 159 | 31.5 | 15.4 (11.9, 18.7) | |||
| LOT3 | Q1W (Reference) | 70 | 24.3 | 12.5 (9.8, 15.6) | 0.97 (0.65, 1.44) | 0.883 |
| Q2W | 70 | 32.9 | 12.9 (9.4, 15.5) |
CI: Confidence interval; HR: Hazard ratio; LOT1: First-line of therapy; LOT2: Second-line of therapy; LOT3: Third-line of therapy; N: Number of patients; Q1W: Weekly; Q2W: Biweekly.
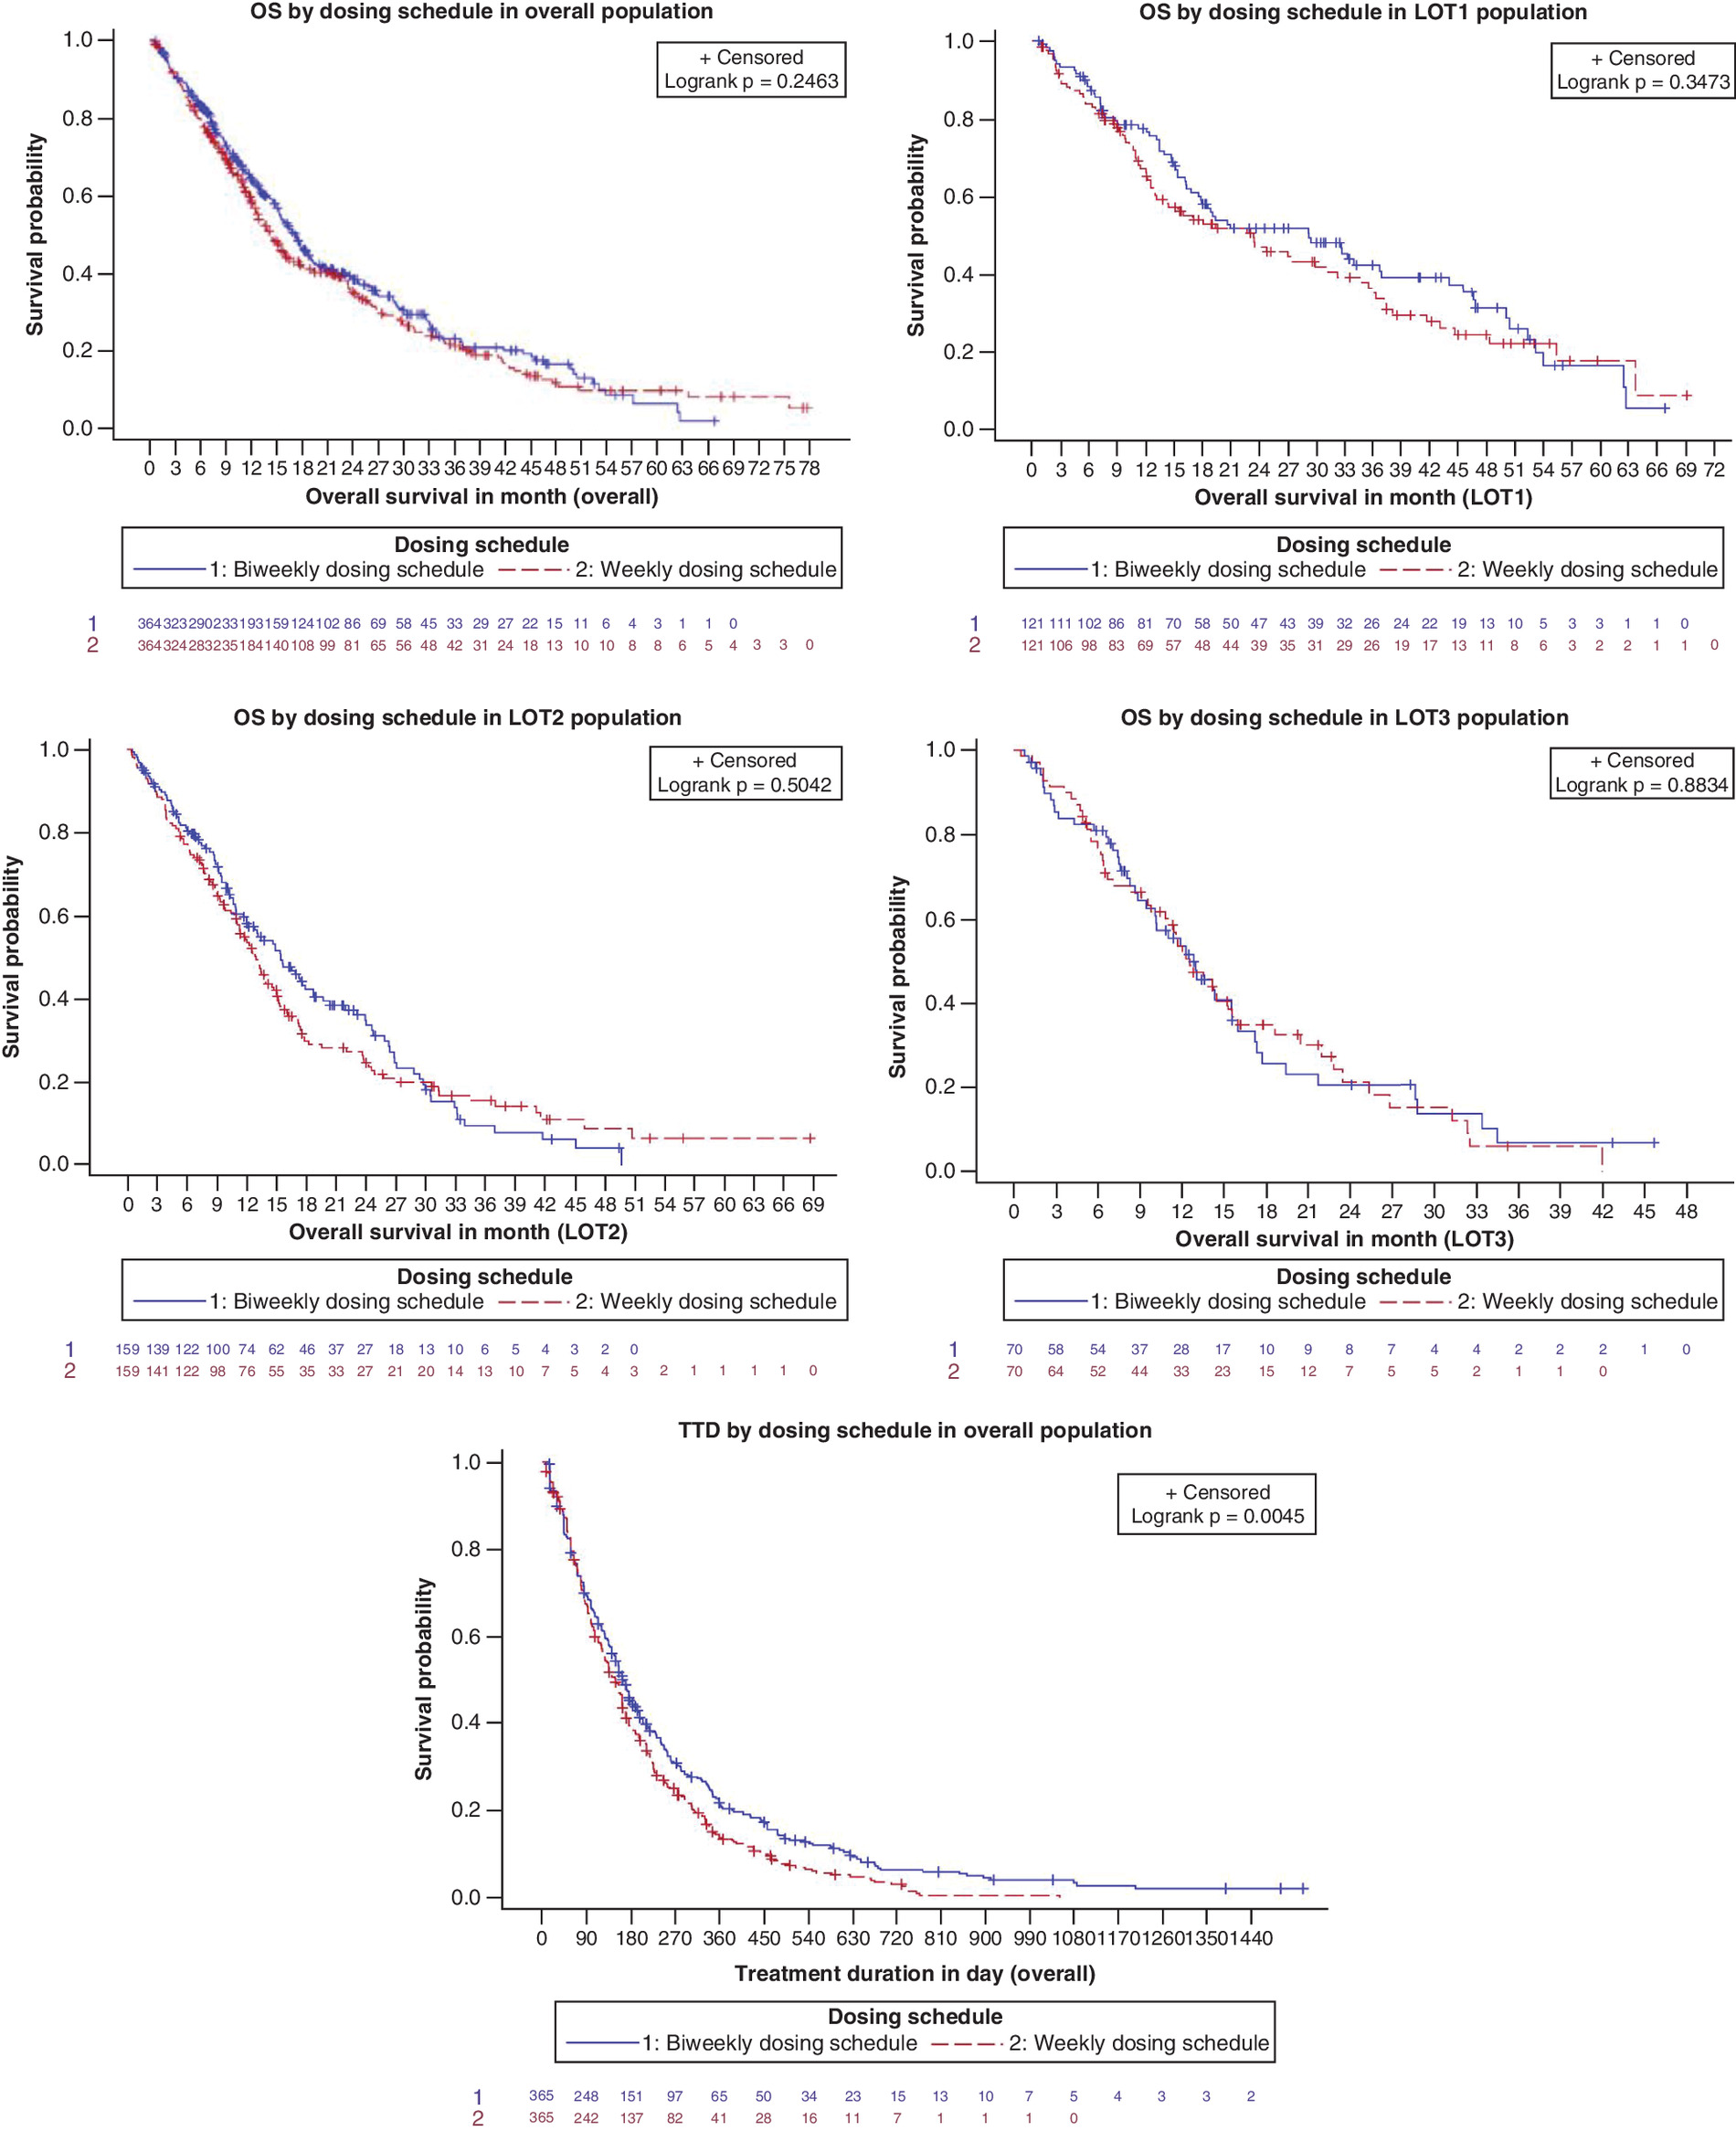
Figure 1. Kaplan–Meier curves for overall survival by line of therapy and for time to treatment discontinuation in overall population.
LOT: Line of therapy; LOT1: First-line of therapy; LOT2: Second-line of therapy; LOT3: Third-line of therapy; OS: Overall survival; TTD: Time to treatment discontinuation.
The TTD was significantly longer for the Q2W compared with the Q1W dosing cohort in the overall and LOT1 populations. In the overall population, median TTD (95% CI) was 163 (148, 179) days for Q2W versus 148 (127, 162) days for Q1W; log-rank p = 0.005. In the LOT1 population, median TTD (95% CI) was 177 (148, 260) days for Q2W versus 176 (155, 211) days for Q1W, log-rank p = 0.039; Table 3). No significant differences were observed in TTD between the Q2W and Q1W dosing cohorts in LOT2 (Q2W, 163 [132, 190] days vs Q1W, 134 [101, 169] days, log-rank p = 0.095; Table 3) and LOT3 populations (Q2W, 162 [86, 192] days vs Q1W, 140.5 [92, 176] days, log-rank p = 0.645; Table 3).
| Population | Dosing schedule | n | Censoring rate (%) | Median TTD (95% CI), day | HR (95% CI) | Log-rank p |
|---|---|---|---|---|---|---|
| Overall | Q1W (Reference) | 365 | 8.22 | 148.0 (127.0, 162.0) | 0.80 (0.69, 0.93) | 0.005† |
| Q2W | 365 | 12.60 | 163.0 (148.0, 179.0) | |||
| LOT1 | Q1W (Reference) | 123 | 8.94 | 176.0 (155.0, 211.0) | 0.75 (0.57, 0.99) | 0.039† |
| Q2W | 123 | 13.82 | 177.0 (148.0, 260.0) | |||
| LOT2 | Q1W (Reference) | 159 | 6.29 | 134.0 (101.0, 169.0) | 0.82 (0.65, 1.04) | 0.095 |
| Q2W | 159 | 12.58 | 163.0 (132.0, 190.0) | |||
| LOT3 | Q1W (Reference) | 70 | 5.71 | 140.5 (92.0, 176.0) | 0.92 (0.65, 1.31) | 0.645 |
| Q2W | 70 | 11.43 | 162.0 (86.0, 192.0) |
†
Significant at p < 0.05.
CI: Confidence interval; HR: Hazard ratio; LOT1: First-line therapy; LOT2: Second-line therapy; LOT3: Third-line therapy; N: Number of patients; Q1W: Weekly cetuximab dosing; Q2W: Biweekly cetuximab dosing.
Sensitivity analysis
Several sensitivity analyses were conducted to evaluate the robustness of findings of the main analysis. All sensitivity analyses showed concordance with the finding of similar OS between the dosing cohorts of the main analysis. The first sensitivity analysis used more stringent cohort identification criteria, i.e., the Q1W cohort had 100% of cetuximab administrations with a time gap of 4–10 days from the previous administration and Q2W cohort had 100% of cetuximab administrations with a gap of 11–18 days from the previous administration. This analysis found no significant difference in the OS between 1:1 matched Q2W versus Q1W cohort (HR [95% CI]:1.01 [0.77, 1.34], p = 0.092; Supplementary Table 4). A second sensitivity analysis was performed after excluding patients with a gap ≥99th percentile of the distribution of time gap between adjacent cetuximab administrations in the main analysis (long-time gap between administrations, Supplementary Table 2). No significant differences in OS were observed between the matched Q2W versus Q1W cohorts for the overall population and by LOT (HR [95% CI]: 0.91 [0.75, 1.10], p = 0.331; Supplementary Table 5). The third sensitivity analysis assessed the impact of potential unmeasured confounders on findings in the main analysis. From this analysis, the estimated E-values were as follows: 1.36 (overall population), 1.47 (LOT1), 1.32 (LOT2), and 1.17 (LOT3) (Supplementary Table 6). The E-values were small, suggesting that unmeasured confounding was unlikely to impact the finding of non-significant difference in OS between Q2W versus Q1W. In fact, a weak to moderate confounder may explain away the non-significant treatment effect even more toward the null.
The fourth sensitivity analysis assessed OS for Q2W versus Q1W cohorts after excluding patients with unknown or missing ECOG PS in the main analysis (38.4% of Q1W cohort and 29.2% of Q2W cohort). No significant difference in OS was observed in the 1:1 matched Q2W versus Q1W cohorts (HR [95% CI]: 0.88 [0.71, 1.10], p = 0.271; Supplementary Table 7). The fifth sensitivity analysis was conducted using a 1:2 matching ratio (one patient from the Q2W cohort was matched to up to two patients in the Q1W cohort) in the propensity score matching. The analysis found no significant differences in OS between matched Q2W versus Q1W cohorts in the overall population (HR [95% CI]: 0.90 [0.77, 1.06], p = 0.224; Supplementary Table 8). In the next sensitivity analysis using entropy balancing, the difference in OS between cohorts was significant for the overall population in favor of the Q2W cohort (HR [95% CI]: 0.83 [0.72, 0.96], p = 0.037; Supplementary Table 9).
Discussion
Randomized clinical trials have confirmed the efficacy of the standard weekly cetuximab as monotherapy or in combination with chemotherapy in patients with KRAS WT mCRC [30,31], which was the basis for the original cetuximab label for the weekly dosing regimen. However, the weekly dosing schedule of cetuximab is not fully aligned with dosing schedule of combination chemotherapy which is often administered on biweekly basis. The recent cetuximab label expansion in the US to include biweekly dosing regimen allows administration of cetuximab and chemotherapy on same visits that reduces the required visits and hence, offers a convenient option to both healthcare providers and patients. Furthermore, the biweekly dosing regimen is reported to reduce drug wastage and healthcare resource use, leading to lower direct and indirect treatment cost [14–16,20,21].
The present study compared cetuximab Q2W versus Q1W dosing regimens using Flatiron Health EHR-derived database for patients diagnosed with mCRC. The results demonstrated that OS was similar between Q2W and Q1W dosing cohorts in the overall population, and by lines of therapy (LOT1, LOT2, LOT3). The findings of no significant difference in OS between the two cohorts were confirmed by a series of sensitivity analyses using stringent criteria for cohort identification, excluding patients with long gaps between cetuximab administrations, excluding patients with missing ECOG PS, or by varying the matching ratio in the propensity score matching. Results in the overall population and for each LOT in the main analysis were also confirmed by an alternate method of balancing the cohorts, i.e., entropy balancing [29]. The sensitivity analyses demonstrated the robustness of the results from the main analysis in this study.
Findings of the present study are consistent with observations from previous reports that found similar survival outcomes with cetuximab Q1W and Q2W dosing regimens [30–33]. In the present study, the TTD was significantly longer for Q2W versus Q1W dosing schedule in the overall and in LOT1 populations. The convenience and lower cost of the Q2W dosing regimen may have contributed to a longer time on treatment for patients. No significant difference in TTD was observed between dosing cohorts in LOT2 and LOT3 populations, respectively.
Given the limited number of real-world studies comparing survival outcomes by cetuximab dosing regimens, the present study contributes to the growing body of literature in this area [22,34,35]. Past studies had used claims data or had limited sample sizes and unbalanced cohorts, whereas this study used EHR-based data with key clinical variables and balanced cohorts [22,36]. The robustness of the findings was confirmed by a battery of sensitivity analyses, and this is a strength of the present study. The findings of the present study are supported by existing pharmacokinetic, pharmacodynamics and clinical data on the efficacy and tolerability of 500 mg/m2 biweekly cetuximab for patients with mCRC in first and subsequent lines of treatment [37,38].
Nonetheless, there were a few limitations of the current study. The Flatiron Health EHR-derived de-identified data were predominantly from community oncology practices and might not represent the clinical practice in academic institutions. The database did not include information on primary tumor location and therefore, this variable could not be included in the propensity score matching analyses. Nevertheless, there is no evidence to suggest differences in the primary tumor location by dosing schedules that could have impacted the findings of this study. The ECOG PS was missing for 35% of patients though finding of similar OS between the dosing cohort did not change when patients with missing ECOG PS were excluded in the sensitivity analysis. A large proportion of the patients had unknown NRAS and BRAF status, however, the imbalances in the baseline characteristics of patients were corrected in the analysis of overall survival and time to treatment discontinuation using the propensity score matching technique. Some potential confounders for propensity score-based estimation technique might not have been observed. However, relatively small estimates of E-value indicated that weak to moderate unmeasured confounders could explain away the non-significant treatment effect toward null. In other words, these uncontrolled factors are less likely to impact on the results. The Flatiron Health LOT rules in mCRC allow for the addition of cetuximab within 60 days of the start of a regimen without advancing the line number. This rule has the potential to introduce “immortal time bias” of up to 60 days relative to the index date for a LOT in estimating OS associated with cetuximab. However, the rule was applied to both dosing cohorts. We further examined the time gap between the index date and the first cetuximab administration date and found the time gap had a range from 0 to 58 days for Q2W cohort and 0 to 57 days for Q1W cohort. Furthermore, 97% of Q2W cohort and 95% of Q1W cohort had cetuximab added within 28 days of the index date Therefore, it is likely that the immortal time bias impacted both Q1W and Q2W dosing cohorts in the same way.
Conclusion
Patients with KRAS WT mCRC treated with weekly and biweekly dosing regimens of cetuximab had comparable overall survival and time to discontinuation in this real-world study.
•
There is limited real-world evidence comparing survival outcomes in patients with mCRC treated with biweekly versus weekly dosing regimens of cetuximab.
•
This study utilized electronic health records data for patients with KRAS WT mCRC from 2013 to 2019 in the US to compare overall survival and time to treatment discontinuation in patients treated with biweekly versus weekly dosing regimens of cetuximab ± chemotherapy in the overall population and by line of therapy.
•
The results of this real-world study demonstrated similar overall survival between mCRC patients treated with biweekly versus weekly cetuximab dosing regimens in the overall population and by line of therapy.
•
Time to treatment discontinuation was similar between the mCRC patients treated with biweekly versus weekly cetuximab regimens in second and third line of therapy, respectively. However, time to treatment discontinuation was longer for patients treated with biweekly versus weekly dosing regimen in the overall population and first line of therapy, respectively.
•
The overall survival analyses were used with FDA as supportive evidence for label expansion to include biweekly dosing regimen for cetuximab.
Author contributions
All named authors meet the International Committee of Medical Journal Editors (ICMJE) criteria for authorship for this article. H Aggarwal, Y Han, KM Sheffield and ZL Cui contributed to the design and conception, acquisition of the data, analysis, and interpretation of the data for this study. All authors participated in writing and revising the manuscript.
Acknowledgments
A portion of these findings were presented at the ASCO Gastrointestinal Cancers Symposium 2021; H Aggarwal, Y Han and ZL Cui. Real-world data on overall survival associated with biweekly versus weekly cetuximab among metastatic colorectal cancer (mCRC) patients in the US. Presented at: the virtual 2021 ASCO Gastrointestinal Cancers Symposium; 15–17 January 2021 (Abstract 33).
Financial & competing interests disclosure
The study was funded by Eli Lilly and Company, USA. Y Han, KM Sheffield, ZL Cui are full-time employees of Eli Lilly and Company. H Aggarwal was an employee of Eli Lilly and Company when this study was conducted. The authors have no other relevant affiliations or financial involvement with any organization or entity with a financial interest in or financial conflict with the subject matter or materials discussed in the manuscript apart from those disclosed.
E Seth and R Ravishankar Ulpe, employees of Eli Lilly Services India Pvt. Ltd, provided medical writing support.
Ethical conduct of research
This is an observational study that uses previously collected data and does not impose any form of intervention and was performed in accordance with the Helsinki Declaration of 1964 and its later amendments. Data have been deidentified to protect subject privacy and to be fully compliant with the US patient confidentiality requirements, including the Health Insurance Portability and Accountability Act of 1996, and did not require institutional review board waiver or approval.
Open access
This work is licensed under the Attribution-NonCommercial-NoDerivatives 4.0 Unported License. To view a copy of this license, visit http://creativecommons.org/licenses/by-nc-nd/4.0/
Supplementary Material
File (supplementary materials.docx)
- Download
- 63.88 KB
References
Papers of special note have been highlighted as: • of interest; •• of considerable interest
1.
Siegel RL, Miller KD, Fuchs HE, Jemal A. Cancer statistics, 2022. CA Cancer J. Clin. 135(05), 584–590 (2022).
2.
Cokkinides V, Albano J, Samuels A, Ward M, Thum J. American Cancer Society: Cancer facts and figures. American Cancer Society, GA, USA (2005).
3.
Wang X-W, Zhang Y-J. Targeting mTOR network in colorectal cancer therapy. World J. Gastroenterol. 20(15), 4178 (2014).
4.
Kindler HL, Shulman KL. Metastatic colorectal cancer. Curr. Treat. Options Oncol. 2(6), 459–471 (2001).
5.
Kurkjian C, Kummar S. Advances in the treatment of metastatic colorectal cancer. Am. J. Ther. 16(5), 412 (2009).
6.
Siegel RL, Miller KD, Fedewa SA et al. Colorectal cancer statistics, 2017. CA Cancer J. Clin. 67(3), 177–193 (2017).
7.
Peeters M, Price T. Biologic therapies in the metastatic colorectal cancer treatment continuum–applying current evidence to clinical practice. Cancer Treat. Rev. 38(5), 397–406 (2012).
• Rationale for using drugs that target epidermal growth factor receptor (EGFR) and improve survival outcomes in patients with mCRC
8.
Biller LH, Schrag D. Diagnosis and Treatment of Metastatic Colorectal Cancer: A Review. JAMA 325(7), 669–685 (2021).
9.
ERBITUX® (cetuximab). HIGHLIGHTS OF PRESCRIBING INFORMATION. Eli Lilly and Company and ImClone Systems, NJ, USA (2019). www.accessdata.fda.gov/drugsatfda_docs/label/2019/125084s273lbl.pdf
10.
ERBITUX- cetuximab solution [package insert]. ImClone LLC, NJ, USA (2020). https://dailymed.nlm.nih.gov/dailymed/drugInfo.cfm?setid=8bc6397e-4bd8-4d37-a007-a327e4da34d9
11.
Ocvirk J, Brodowicz T, Wrba F et al. Cetuximab plus FOLFOX6 or FOLFIRI in metastatic colorectal cancer: CECOG trial. World J. Gastroenterol. 16(25), 3133 (2010).
12.
European Medicines Agency. Erbitux. Merck Europe B.V (2020). www.ema.europa.eu/en/medicines/human/EPAR/erbitux
• Evidence on previously approved dosing regimens of Cetuximab
13.
US Food & Drug Administration. FDA approves new dosing regimen for cetuximab (2021). www.fda.gov/drugs/resources-information-approved-drugs/fda-approves-new-dosing-regimen-cetuximab#:∼:text=On%20April%206%2C%202021%2C%20the,the%20head%20and%20neck%20(SCCHN
14.
Zhao X, Iqbal S, Valdes IL, Dresser M, Girish S. Integrating real-world data to accelerate and guide drug development: a clinical pharmacology perspective. Clin. Transl. Sci. 15(10), 2293–2302 (2022).
15.
Tabernero J, Pfeiffer P, Cervantes A. Administration of cetuximab every 2 weeks in the treatment of metastatic colorectal cancer: an effective, more convenient alternative to weekly administration? Oncologist 13(2), 113–119 (2008).
•• Derived the pharmacokinetics of cetuximab 250 mg/m2 Q1W vs 500 mg/m2 Q2W from 19 clinical studies of patients with various solid tumor types, including colorectal cancer (CRC).
16.
Bokemeyer C, Bondarenko I, Hartmann J et al. Efficacy according to biomarker status of cetuximab plus FOLFOX-4 as first-line treatment for metastatic colorectal cancer: the OPUS study. Ann. Oncol. 22(7), 1535–1546 (2011).
17.
Hubbard JM, Alberts SR. Alternate dosing of cetuximab for patients with metastatic colorectal cancer. Gastrointest Cancer Res. 6(2), 47–55 (2013).
•• This literature review concluded that cetuximab biweekly dosing is a viable treatment option with a benefit-risk profile comparable to those obtained with weekly dosing.
18.
Cunningham D, Humblet Y, Siena S et al. Cetuximab monotherapy and cetuximab plus irinotecan in irinotecan-refractory metastatic colorectal cancer. N. Engl. J. Med. 351(4), 337–345 (2004).
19.
Kotake M, Aoyama T, Munemoto Y et al. Multicenter phase II study of infusional 5-fluorouracil (5-FU), leucovorin, and oxaliplatin, plus biweekly cetuximab as first-line treatment in patients with metastatic colorectal cancer (CELINE trial). Oncol Letters. 13(2), 747–753 (2017).
20.
Pfeiffer P, Nielsen D, Bjerregaard J, Qvortrup C, Yilmaz M, Jensen B. Biweekly cetuximab and irinotecan as third-line therapy in patients with advanced colorectal cancer after failure to irinotecan, oxaliplatin and 5-fluorouracil. Ann. Oncol. 19(6), 1141–1145 (2008).
21.
Mennini FS, Marcellusi A, Fabiano G, Rimassa L, Santoro A, Personeni N. Budget impact of bimonthly use of cetuximab in patients diagnosed with metastatic colorectal cancer. Future Oncol. 15(18), 2107–2112 (2019).
22.
Pescott CP, Boutmy E, Batech M, Ronga P, Lamy F-X. Real-world healthcare resource utilization and costs of weekly versus every-2-week cetuximab in metastatic colorectal cancer. J. Comp. Eff. Res. 10(5), 353–364 (2021).
•• This article reports the real-world healthcare resource utilization of biweekly vs weekly dosing regimen of cetuximab in mCRC treatment
23.
Matsuda A, Yamada T, Jamjittrong S et al. Comparison between biweekly and weekly cetuximab in patients with metastatic colorectal cancer: a meta-analysis. Anticancer Res. 40(6), 3469–3476 (2020).
24.
Ma X, Long L, Moon S, Adamson BJS, Baxi SS. Comparison of Population Characteristics in Real-World Clinical Oncology Databases in the US: Flatiron Health, SEER, and NPCR. www.medrxiv.org/content/10.1101/2020.03.16.20037143v1.full.pdf
25.
Birnbaum B, Nussbaum N, Seidl-Rathkopf K et al. Model-assisted cohort selection with bias analysis for generating large-scale cohorts from the EHR for oncology research. https://arxiv.org/ftp/arxiv/papers/2001/2001.09765.pdf
26.
Zhang Q, Gossai A, Monroe S, Nussbaum NC, Parrinello CM. Validation analysis of a composite real-world mortality endpoint for patients with cancer in the United States. Health Serv. Res. 56(6), 1281–1287 (2021).
27.
Austin PC. Optimal caliper widths for propensity-score matching when estimating differences in means and differences in proportions in observational studies. Pharm Stat. 10(2), 150–161 (2011).
28.
VanderWeele TJ, Ding P. Sensitivity analysis in observational research: introducing the E-value. Ann. Intern. Med. 167(4), 268–274 (2017).
29.
Hainmueller J. Entropy balancing for causal effects: a multivariate reweighting method to produce balanced samples in observational studies. Politic Analysis 20(1), 25–46 (2012).
30.
Van Cutsem E, Köhne C-H, Láng I et al. Cetuximab plus irinotecan, fluorouracil, and leucovorin as first-line treatment for metastatic colorectal cancer: updated analysis of overall survival according to tumor KRAS and BRAF mutation status. J. Clin. Oncol. 29(15), 2011–2019 (2011).
31.
Van Cutsem E, Lenz HJ, Köhne CH et al. Fluorouracil, leucovorin, and irinotecan plus cetuximab treatment and RAS mutations in colorectal cancer. J. Clin. Oncol. 33(7), 692–700 (2015).
32.
Bokemeyer C, Van Cutsem E, Rougier P et al. Addition of cetuximab to chemotherapy as first-line treatment for KRAS wild-type metastatic colorectal cancer: pooled analysis of the CRYSTAL and OPUS randomised clinical trials. Eur. J. Cancer 48(10), 1466–1475 (2012).
33.
Kasper S, Foch C, Messinger D et al. Noninferiority of cetuximab every-2-weeks versus standard once-weekly administration schedule for the first-line treatment of RAS wild-type metastatic colorectal cancer. Eur. J. Cancer 144, 291–301 (2021).
34.
Brodowicz T, Ciuleanu TE, Radosavljevic D et al. FOLFOX4 plus cetuximab administered weekly or every second week in the first-line treatment of patients with KRAS wild-type metastatic colorectal cancer: a randomized phase II CECOG study. Ann. Oncol. 24(7), 1769–1777 (2013).
• They demonstrated that the combination of cetuximab biweekly with FOLFOX4 was comparable with the efficacy and safety profile observed for FOLFOX4 plus standard weekly cetuximab in the first-line treatment of patients with KRAS wild-type metastatic colorectal cancer.
35.
Mrabti H, De la Fouchardiere C, Desseigne F et al. Irinotecan associated with cetuximab given every 2 weeks versus cetuximab weekly in metastatic colorectal cancer. J. Cancer Res. Ther. 5(4), 272–276 (2009).
36.
Lamy F-X, Batech M, Boutmy E, Ronga P, Salim S, Pescott CP. Comparative effectiveness of weekly versus every-2-weeks cetuximab in metastatic colorectal cancer in a US-insured population. J. Comp. Eff. Res. 9(16), 1117–1129 (2020).
37.
Zekri J, Farag K, Al-Saadi R, Ashour M, Haggag R. Safety and efficacy of biweekly cetuximab based chemotherapy for patients with metastatic colorectal cancer. J. Unexplored Med. Data 1, 15–20 (2016).
• This paper validates the tolerability and efficacy of 500 mg/m biweekly cetuximab for patients with metastatic colorectal cancer.
38.
Tabernero J, Ciardiello F, Rivera F et al. Cetuximab administered once every second week to patients with metastatic colorectal cancer: a two-part pharmacokinetic/pharmacodynamic phase I dose-escalation study. Ann. Oncol. 21(7), 1537–1545 (2010).
Information & Authors
Information
Published In
Copyright
© 2023 Eli Lilly and Company. This work is licensed under the Attribution-NonCommercial-NoDerivatives 4.0 Unported License
History
Received: 8 August 2022
Accepted: 9 January 2023
Published online: 27 January 2023
Keywords:
Topics
Authors
Funding Information
Metrics & Citations
Metrics
Article Usage
Article usage data only available from February 2023. Historical article usage data, showing the number of article downloads, is available upon request.
Citations
How to Cite
Real-world comparison between weekly versus biweekly dosing of cetuximab for metastatic colorectal cancer. (2023) Journal of Comparative Effectiveness Research. DOI: 10.2217/cer-2022-0143
Export citation
Select the citation format you wish to export for this article or chapter.
Citing Literature
- Jennifer S. Wang, Benny Johnson, Caitlin C. Murphy, Racial, Ethnic, and Socioeconomic Survival Disparities in Early-Onset Metastatic Colorectal Cancer, JAMA Network Open, 10.1001/jamanetworkopen.2025.53146, 9, 1, (e2553146), (2026).
- Bazarbashi Shouki, Alnajjar Abdelsalam, Al Sharm Abdullah, Alshammari Kanan, Al Sherhi Ahmed, Dawoud Emad, Heinemann Volker, Aseafan Mohamed, Chehal Aref, Alghamdi Mohammed, Hamza Dina, Khoury Maroun, Venniyoor Ajit, Mahrous Mervat, Rasul Kakil, Elsamany Shereef, Trad Diaeddine, Management of metastatic colorectal cancer: consensus in the Gulf Cooperation Council countries, Therapeutic Advances in Medical Oncology, 10.1177/17588359241299324, 17, (2025).
- Lan Ni, Azhar Zaman Khan, Amanda Long, Ling Gao, Nikki Toms, Elena Gonzalez‐Gugel, Susan Holsmer‐Brand, Yong Lin, Paolo Abada, Sandra Dickin, Declan O'Dea, Ran Wei, Min‐Hua Jen, Himani Aggarwal, Optimizing the Dosing Regimen of Cetuximab and Ramucirumab Using the Model‐Informed Drug Development Paradigm, Clinical Pharmacology & Therapeutics, 10.1002/cpt.2919, 114, 1, (77-87), (2023).