A comparative cost analysis between two quick diagnosis units of different levels of complexity
Publication: Journal of Comparative Effectiveness Research
Abstract
Aim: To compare by micro-costing the costs incurred by quick diagnosis units of tertiary and second-level hospitals. Patients & methods: We included 407 patients from a tertiary and secondary hospital unit. A bottom-up approach was applied. Results: Cost per patient was €577.5 ± 219.6 in the tertiary versus €394.7 ± 92.58 in the secondary unit (p = 0.0559). Mean number of visits and ratio of successive/first visits were significantly higher in the former (3.098 and 2.07 vs 2.123 and 1.12, respectively). Personnel and indirect costs including their percent contribution to overall costs accounted for the main differences. Conclusion: A greater volume of appointments, number of staff and staff time and a greater complexity of patients from the tertiary hospital unit justified the differences in cost outcomes.
Once an admirable model of universal healthcare, the Spanish public system suffered a severe financial downturn at the time of the last recession with repercussions at multiple levels. In addition to provision of basic health services, health outcomes of population were affected in a system already strained by many years of structural and financial debts and perpetually slanted toward acute inpatient care [1,2]. Yet public authorities did not take the opportunity to reorganize and improve public healthcare services and lessen the financial burden, with some notable exception. The realization that hospitalizations and hospital care were one leading cause of excessive healthcare expenses opened the way for a shift from traditional ‘bed-based’ inpatient care to hospital-based ambulatory and outpatient care services [3,4]. A systematic review published in JAMA Internal Medicine in 2016 showed that alternative ambulatory approaches to inpatient care for patients with medical conditions were associated, as compared with traditional inpatient admission, with similar health outcomes and similar or higher patient-reported satisfaction levels [5]. In addition, although heterogeneous, analysis of cost data indicated that all alternative strategies were associated with global savings.
These alternative models for conditions conventionally designed to require hospitalization do not involve an overnight stay or multi-day stay in hospital and include, to mention a few, observation units, hospitals-at-home, daycare centers and quick diagnosis units. While the former were developed decades ago and extended to additional medical conditions in recent years, quick diagnosis units became a new paradigm of innovation in hospital ambulatory medicine in the 2000s and 2010s [3–6]. By sidestepping unnecessary and expensive admissions for purely diagnostic purposes, today these units represent a well-established healthcare delivery model reportedly associated with high-quality indicators related to patient safety, mortality and return hospitalizations [5,7,8]. Conceived to achieve expeditious diagnosis for serious medical conditions potentially associated with cancer including, among others, severe anemia, unintentional weight loss and abnormal lymphadenopathy or lumps [9–12], quick diagnosis units have also been reported to decrease the number of inappropriate referrals by primary care centers to the emergency department [10].
Although limited, available reported data suggest that the quick diagnosis unit approach may be cost-effective. Former studies estimating the healthcare costs of these units mostly included informal cost analyses of single units [13,14] or were performed with the standpoint of comparing the costs of these patients with those of inpatients of the same institution hospitalized for the same condition [10–12,15]. While these investigations have been helpful for the objective assessment of the actual costs incurred by quick diagnosis units of single centers, studies comparing the cost outcomes of units of different hospitals are lacking. A former clinical study comparing the two quick diagnosis units described in the current study (i.e., a unit of a tertiary hospital and a unit of a second-level district hospital), showed that, while the operating procedures of both were similar, the patterns of patients’ presentation, referral and final diagnoses were different [16]. Notably, compared with the secondary hospital unit, patients from the tertiary hospital unit were significantly more likely to present with ‘urgent’ and serious conditions (e.g., severe anemia requiring transfusion, fever of unknown origin and gastrointestinal symptoms including rectorrhagia and dysphagia) and to have a diagnosis of cancer. The authors concluded that the results (added) evidence to the convenience of (quick diagnosis units) in urban district hospital centers for diagnostic purposes’ and that, to gain further insights into the favorable economic impact of these units, an economic evaluation comparing both units should be explored next [16].
Therefore, the objective of this study was to investigate the costs associated with the diagnostic assessment of patients with potentially severe diseases managed at two quick diagnosis units of hospitals with different levels of complexity in Barcelona. A micro-costing analysis based on resource consumption data from the two centers was applied.
Materials & methods
Settings
This study was conducted in the quick diagnosis unit of a public tertiary university hospital with 855 beds and a reference population of 550,000 (Tertiary Unit) and the quick diagnosis unit of a second-level district hospital with 160 beds (Secondary Unit), both in Barcelona. The latter is the healthcare provider for a population of 140,000 inhabitants. Both units are integrated in the internal medicine departments of their respective hospitals. The Tertiary Unit is located in an adult daycare center of the hospital, which is staffed with physicians from different specialties and equipped with armchairs and recovery rooms for procedures requiring sedation. The structure, indications for referral and operating procedures of these units have been reported previously [6,12,14,16]. Briefly, they work as ambulatory clinics evaluating patients with suspected severe disorders whose general physical condition is acceptable enough to enable them to go to hospital for investigations and appointments, then back to home. The clinical indications for referral to both units are the same. The general working protocol of both consists of a rapid first appointment after referral from primary care centers or the emergency departments of the hospitals (usually within 5 days), followed by preferential programming of diagnostics tests and subsequent visits until a diagnosis is made. Staff at the unit of the tertiary hospital includes a consultant general internist, a senior internal medicine resident, nursing, and administrative staff. The unit is open 5 days a week [10,11]. In contrast, the unit of the secondary hospital is staffed with two part-time general internists as well as administrative personnel [14,16].
Population & data description
All patients aged ≥18 years who attended the two quick diagnosis units at least once between 1 January 2009 and 1 January 2017 were potentially eligible to be included in the study. Patients who did not complete their clinical evaluation or were lost to follow-up or death before a diagnosis was made were excluded. Inappropriate referrals and referrals from nonconventional sources were not considered either.
The study base population consisted of 407 patients from each unit. While 407 was the actual number of consecutive patients evaluated at the Secondary Unit during the 8-year period, we selected a random sample of 407 from 6960 consecutive patients evaluated at the Tertiary Unit during the same period. By means of online random sampling software (https://www.randomizer.org/), randomization was performed for each year of the study to match the annual number of patients of the unit of the secondary hospital unit (Figure 1).
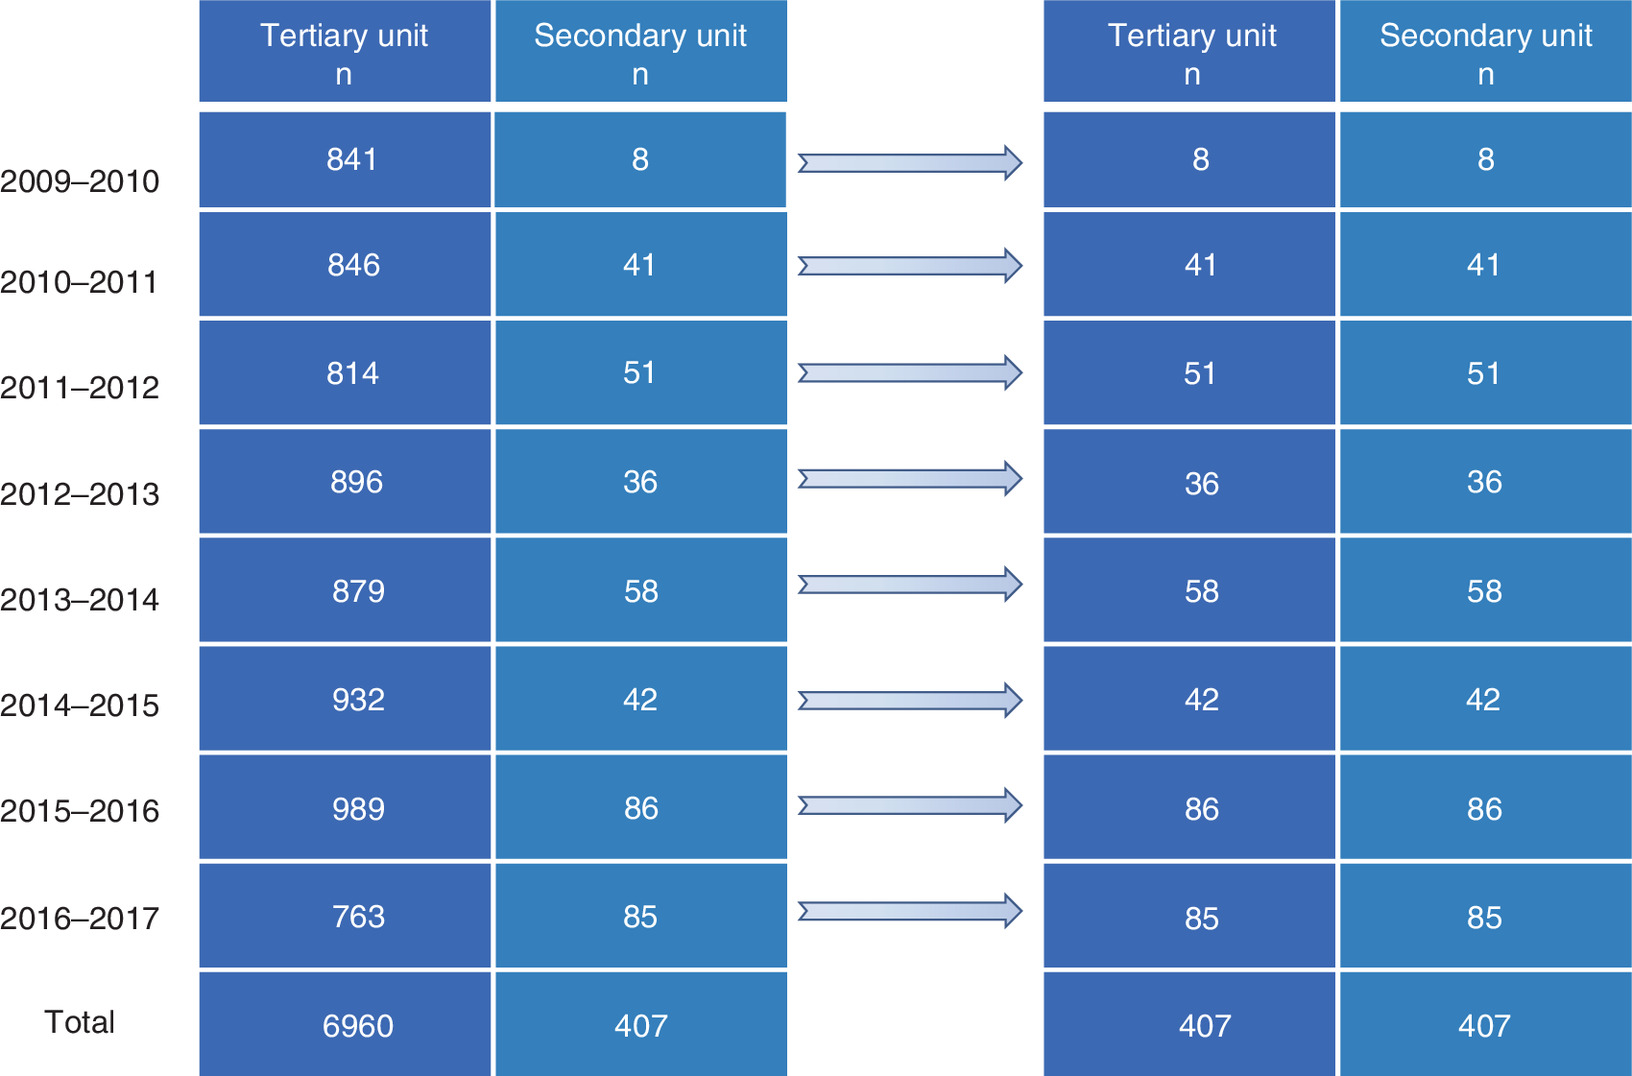
Figure 1. After exclusion of ineligible patients, all consecutive patients referred to the quick diagnosis unit of the second-level hospital for each year from 1 January 2009 to 1 January 2017 were included in the study.
In order to match the yearly and total number of patients of this unit, all consecutive patients fulfilling the inclusion criteria who were referred to the unit of the tertiary hospital during the same period were randomized on a yearly basis.
Computerized medical records stored in the information systems of the hospitals were compiled. Demographic, clinical, and economic data were analyzed to determine the patient sample and calculate the costs. Data collected included age, gender, referral sources, clinical indications for referral, total number of visits and ratio of successive/first visits, time-to diagnosis and final diagnosis. For the study purpose, indications for referral were dichotomized into symptoms suggestive of cancer versus other symptoms and final diagnosis was subdivided into malignant versus nonmalignant diseases. The study was carried out in line with the principles of the Declaration of Helsinki. Approvals were granted by the research ethics committee of the tertiary university hospital and the network of hospitals to which the second-level hospital belongs to (Comitè d'Ètica de la Investigació Clínica [CEIC]-Unió Catalana d'Hospitals). Need for informed consent was waived due to the retrospective design of this study.
Cost determination & calculation
The costs generated during the diagnostic evaluation process of both units were analyzed based on a bottom-up approach (micro-costing) by which all services provided are collected exhaustively and corresponding prices are allocated. Micro-costing approaches stipulate all the resources spent in the provision of healthcare service [17,18].
The micro-costing analysis of this study was performed from the healthcare provider perspective and, for all included patients, relevant costs were obtained from the finance departments of the two hospitals.
The primary outcome variable of the study was the mean cost per patient, which was determined by summing all the single cost components that contributed to patient management until a diagnosis was made (i.e., from the first to the last visit). Specifically, overall costs were first categorized into direct costs, indirect costs and structural costs. Then, direct costs were split off into three cost categories: personnel costs; costs of diagnostic tests and costs associated with specialist consultation and referral of patients. Personnel or staff costs were calculated according to the staff time dedicated to each unit (clinicians, nursing and administrative staff). These costs corresponded to the cumulative work time dedicated multiplied by the average hourly income of the corresponding staff category. The costs of diagnostic procedures including laboratory and pathology investigations, imaging examinations and endoscopies and biopsy and cytology techniques were directly calculated using the unit cost of each test as provided by the respective finance departments. Direct costs attributable to specialist consultation and referral of patients were also incorporated. Indirect and structural costs were finally imputed to the computation. Indirect cost components mainly included operation and maintenance costs such as painting and repairs, laundry, catering, cleaning services, sterilization and costs of energy. Structural costs mostly concerned medical consultation costs and capital costs (e.g., equipment and construction). Indirect and structural costs also included depreciation and amortization costs. Indirect costs and structural costs were imputed according to the cost accounting system of the hospitals. In particular, the finance departments determine each year a specific percentage of indirect and structural costs which is directly assigned to each healthcare facility. This percentage is reviewed on a yearly basis. We also determined the percentage distribution of direct, structural, and indirect costs relative to the mean total cost per patient. Another variable of interest for the study was the mean cost per visit. Neither costs borne by patients nor costs of referring agencies were included in the analysis. All costs were adjusted for inflation to 2016 Euros (€).
Statistical analysis
Categorical data were compared with the χ2 or Fisher’s exact test, as appropriate and results are reported as absolute and relative frequencies. Quantitative variables with a normal distribution were compared with t-tests and results are reported as the mean and standard deviation (SD), while variables with a skewed distribution were compared with the nonparametric Mann–Whitney U test and results are expressed as the median and interquartile range. The threshold for significance was set at p < 0.05 (all tests 2-tailed). All analyses were performed with GraphPad Prism v8 (GraphPad Software, CA, USA).
Results
Study population
The general characteristics of the patients from both units are displayed in Table 1. More patients from the Secondary Unit were women and no significant differences were observed in mean age between the two units. Patients from the Tertiary Unit were significantly more likely than those from the Secondary Unit to be referred from the emergency department (61.2 vs 17.0%, respectively; p < 0.0001), whereas patients from the Secondary Unit were mostly referred from primary care centers (69.0%). The rate of referrals for symptoms suggestive of cancer was 33.2% in the Tertiary and 26.0% in the Secondary Unit (p = 0.0012) and patients from the former unit were more likely to have a final diagnosis of malignancy (19.7 vs 14.3%, respectively; p = 0.0020). While the total number of visits in the Tertiary Unit was significantly higher than that in the secondary center unit (3.098 ± 0.6584 vs 2.123 ± 0.2171, respectively; p = 0.0064) (as it was the ratio of successive/first visits [2.07 ± 0.2241 vs 1.12 ± 0.1034; p = 0.0070, respectively]), the mean time to diagnosis was significantly shorter in the former (8 [interquartile range, 4–13] vs 12 [1–28], respectively; p < 0.0001; Table 1).
| Characteristics | Tertiary unit (n = 407) | Secondary unit (n = 407) | p-value |
|---|---|---|---|
| Age (years), mean ± SD | 60.9 ± 17.54 | 62 ± 20.00 | 0.1524 |
| Sex, n (%) | 0.0351 | ||
| – Female | 208 (51.1) | 228 (56.0) | |
| – Male | 199 (48.9) | 179 (44.0) | |
| Referral departments & centers, n (%) | |||
| – Emergency department | 249 (61.2) | 69 (17.0) | <0.0001 |
| – Primary care | 130 (31.9) | 281 (69.0) | |
| – Outpatients clinics | 20 (4.9) | 49 (12.0) | |
| – Other | 8 (2.0) | 8 (2.0) | |
| Indication for referral, n (%) | 0.0012 | ||
| – Symptoms suggestive of cancer | 135 (33.2) | 106 (26.0) | |
| – Other symptoms | 272 (66.8) | 301 (74.0) | |
| Total number of visits, mean ± SD | 3.098 ± 0.6584 | 2.123 ± 0.2171 | 0.0064 |
| Ratio of successive/first visits, mean ± SD | 2.07 ± 0.2241 | 1.12 ± 0.1034 | 0.0070 |
| Final diagnosis, n (%) | 0.0020 | ||
| – Malignancy | 80 (19.7) | 58 (14.3) | |
| – Nonmalignant disease | 327 (80.3) | 349 (85.7) | |
| Time-to-diagnosis (days) | <0.0001 | ||
| – Mean ± SD | 11.40 ± 6.75 | 23 ± 34 | |
| – Median (IQR) | 8 (4–13) | 12 (1–28) |
IQR: Interquartile range; SD: Standard deviation.
Cost outcomes
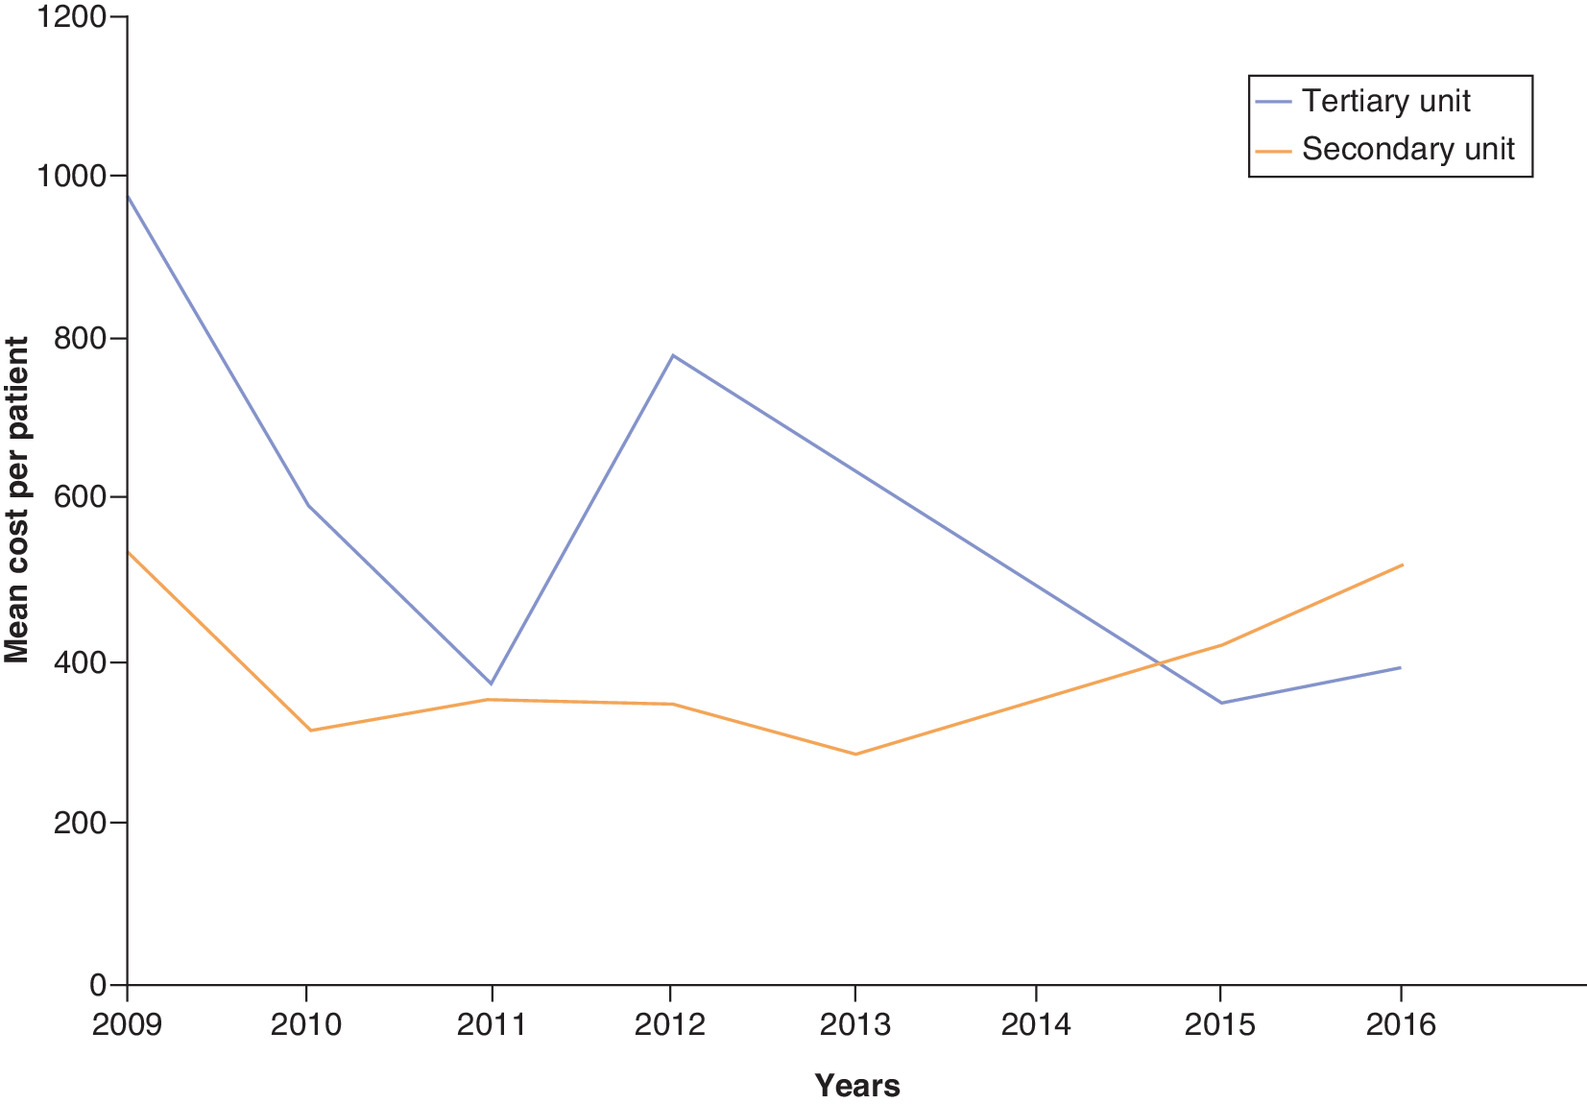
Tables 2 and 3 show the primary outcomes of the study from the service-provider perspective. The mean total cost per patient of the Tertiary Unit was €577.50 ± 219.60, varying from a minimum of €353.2 to a maximum of €975.8 per patient and year, while the mean cost of the Secondary Unit was €394.70 ± 92.58 per patient, ranging from a minimum of €289.6 to a maximum of €539.1 per patient and year (p for difference between the two units = 0.0559; Figure 2). The mean cost per visit of both units was similar (€182.8 ± 41.47 in the Tertiary vs €184.6 ± 29.41 in the Secondary Unit; p = 0. 0.9056). An analysis of general costs revealed that direct and structural costs per patient of the two units were not significantly different. Conversely, indirect costs of the Tertiary Unit were significantly higher than those of the secondary center unit (€49.93 ± 19.90 vs €12.42 ± 2.344, respectively; p = 0.0018; Table 2).
| General costs | Tertiary unit (n = 407) | Secondary unit (n = 407) | p-value |
|---|---|---|---|
| Total cost/patient (€), mean ± SD | 577.5 ± 219.6 | 394.7 ± 92.58 | 0.0559 |
| Total cost/visit (€), mean ± SD | 182.8 ± 41.47 | 184.6 ± 29.41 | 0.9056 |
| Direct costs/patient (€) | |||
| – Mean ± SD | 459.8 ± 183.2 | 321.7 ± 85.05 | 0.0750 |
| – Percentage contribution to mean total cost/patient, mean (95% CI) | 79.13 (77.12–81.14) | 81.15 (77.53–84.76) | 0.3327 |
| Structural costs/patient (€) | |||
| – Mean ± SD | 67.78 ± 19.17 | 60.51 ± 16.18 | 0.4793 |
| – Percentage contribution to mean total cost/patient, mean (95% CI) | 12.28 (10.05–14.51) | 15.57 (12.24–18.90) | 0.1285 |
| Indirect costs/patient (€) | |||
| – Mean ± SD | 49.93 ± 19.90 | 12.42 ± 2.344 | 0.0018 |
| – Percentage contribution to mean total cost/patient, mean (95% CI) | 8.595 (8.377–8.813) | 3.284 (2.618–3.950) | <0.0001 |
SD: Standard deviation.
| Direct cost components | Tertiary unit (n = 407) | Secondary unit (n = 407) | p-value |
|---|---|---|---|
| Personnel (€) | |||
| – Mean ± SD | 68.75 ± 14.90 | 36.90 ± 3.276 | 0.0011 |
| – Percentage contribution to mean total cost/patient, mean (95% CI) | 12.58 (10.64–14.51) | 9.746 (8.029–11.46) | 0.0373 |
| Laboratory & Pathology (€) | |||
| – Mean ± SD | 197.6 ± 111.6 | 96.63 ± 34.44 | 0.0729 |
| – Percentage contribution to mean total cost/patient, mean (95% CI) | 32.60 (22.63–42.56) | 25.78 (18.22–33.33) | 0.2098 |
| Imaging & endoscopy (€) | |||
| – Mean ± SD | 169.5 ± 81.80 | 157.4 ± 73.94 | 0.5956 |
| – Percentage contribution to mean total cost/patient, mean (95% CI) | 29.36 (23.44–35.28) | 38.36 (30.73–45.99) | 0.0060 |
| Biopsy & cytology techniques (€) | |||
| – Mean ± SD | 19.67 ± 10.48 | 23.34 ± 26.54 | 0.6042 |
| – Percentage contribution to mean total cost/patient, mean (95% CI) | 3.678 (2.152–5.203) | 5.478 (1.551–9.404) | 0.3524 |
| Specialist consultation & referral (€) | |||
| – Mean ± SD | 4.273 ± 2.780 | 7.503 ± 4.854 | 0.2227 |
| – Percentage contribution to mean total cost/patient, mean (95% CI) | 0.9188 (0.3693–1.468) | 1.789 (1.148–2.430) | 0.0804 |
SD: Standard deviation.
An individual assessment of the five single components of direct costs showed that personnel costs per patient of the tertiary hospital unit were significantly higher than those of the other unit (€68.75 ± 14.90 vs €36.90 ± 3.28; p = 0.0011). Moreover, laboratory and pathology costs were nonsignificantly higher in the former (€197.6 ± 111.6 vs €96.63 ± 34.44, respectively; p = 0.0729). Other direct cost components, namely imaging and endoscopy, biopsy and cytology techniques and specialist consultation and referral were not significantly different (Table 3).
We further looked at the relative burden of the different cost categories on the mean total cost per patient. In both units, direct costs accounted for the largest proportion of cost per patient without significant differences (79.13 percent [95% CI, 77.12–81.14] in the Tertiary vs 81.15 percent [77.53–84.76] in the Secondary Unit; p = 0.3327). In addition, no significant differences were found in the average contribution of structural costs to the cost per patient of both units. However, the contribution of indirect costs was significantly greater for the unit of the tertiary center (8.595 [8.377–8.813] vs 3.284 percent [2.618–3.950], respectively; p < 0.0001; Table 2).
When looking at the mean share of each direct cost component relative to the mean total cost per patient, laboratory and pathology costs along with imaging and endoscopy costs accounted for the largest share, with a significantly greater contribution of imaging and endoscopy costs of the secondary versus tertiary center unit. Whereas costs of biopsy and cytology techniques and specialist consultation and referral accounted for a tiny fraction of the cost per patient of both units without relevant differences, personnel or staff costs of the Tertiary Unit accounted, on average, for a significantly greater amount (12.58 percent [10.64–14.51] vs 9.746 percent [8.029–11.46], respectively; p = 0.0373; Table 3).
We also examined the relevant costs of patients from both units according to clinical data, namely, reasons for referral and final diagnosis (Tables 4 & 5). In general, results were consistent with the overall results (Table 1). Added to significant differences in referral sources and total number of visits (including visits ratio), the overall average costs of the two units in both groups of patients were higher than those in the baseline population. Specifically, for referrals for symptoms suggestive of cancer, mean cost per patient of the Tertiary Unit was €782.52 ± 191.56 and it was €562.21 ± 94.55 in the Secondary Unit (p = 0.0537). For patients with a final diagnosis of malignancy, mean cost per patient of the Tertiary Unit was €1069.17 ± 218.64 while it was €827.65 ± 151.83 in the other unit (p = 0.0871). Consistent with the results of the principal analysis, both for patients referred for suspected cancer and those with an eventual cancer diagnosis, cost differences continued to lie in personnel and indirect costs with significant differences between the two units (Tables 4 & 5).
| Characteristics | Tertiary unit (n = 135) | Secondary unit (n = 106) | p-value |
|---|---|---|---|
| Age (years), mean ± SD | 64.34 ± 13.60 | 62.24 ± 19.71 | 0.1163 |
| Sex, n (%) | 0.2349 | ||
| – Female | 61 (45.2) | 51 (48.1) | |
| – Male | 74 (54.8) | 55 (51.9) | |
| Referral departments & centers, n (%) | <0.0001 | ||
| – Emergency department | 88 (65.2) | 17 (16.0) | |
| – Primary care | 39 (28.9) | 63 (59.4) | |
| – Outpatients clinics | 8 (5.9) | 23 (21.7) | |
| – Other | 0 (0.0) | 3 (2.8) | |
| Total number of visits, mean ± SD | 3.431 ± 1.5321 | 2.443 ± 1.1630 | 0.0385 |
| Ratio of successive/first visits, mean ± SD | 2.39 ± 0.4864 | 1.40 ± 0.3022 | 0.0411 |
| Final diagnosis, n (%) | 0.0499 | ||
| – Malignancy | 55 (40.7) | 37 (34.9) | |
| – Nonmalignant disease | 80 (59.3) | 69 (65.1) | |
| Time-to-diagnosis (days) | 0.0001 | ||
| – Mean ± SD | 10.22 ± 6.03 | 19.53 ± 26.12 | |
| – Median (IQR) | 7 (5–9) | 12 (5.00–25.75) | |
| Direct costs/patient (€), mean ± SD | |||
| – Personnel | 76.50 ± 18.37 | 43.16 ± 4.34 | 0.0375 |
| – Laboratory & pathology | 243.55 ± 120.45 | 119.10 ± 42.62 | 0.0683 |
| – Imaging & endoscopy | 311.65 ± 93.12 | 289.40 ± 108.71 | 0.7759 |
| – Biopsy & cytology techniques | 36.24 ± 12.18 | 42.37 ± 35.20 | 0.8344 |
| – Specialist consultation & referral | 6.70 ± 2.53 | 11.76 ± 5.80 | 0.1520 |
| Structural costs/patient (€), mean ± SD | 48.22 ± 15.78 | 43.05 ± 16.55 | 0.9315 |
| Indirect costs/patient (€), mean ± SD | 59.66 ± 21.13 | 14.84 ± 2.38 | <0.0001 |
| Total cost/patient (€), mean ± SD | 782.52 ± 191.56 | 562.21 ± 94.55 | 0.0537 |
IQR: Interquartile range; SD: Standard deviation.
| Characteristics | Tertiary unit (n = 80) | Secondary unit (n = 58) | p-value |
|---|---|---|---|
| Age (years), mean ± SD | 65.23 ± 15.77 | 68.28 ± 15.96 | 0.1425 |
| Sex, n (%) | 0.0410 | ||
| – Female | 36 (45.0) | 31 (53.4) | |
| – Male | 44 (55.0) | 27 (46.6) | |
| Referral departments & centers, n (%) | <0.0001 | ||
| – Emergency department | 52 (65.0) | 9 (15.5) | |
| – Primary care | 23 (28.8) | 35 (60.3) | |
| – Outpatients clinics | 4 (5.0) | 12 (20.7) | |
| – Other | 1 (1.3) | 2 (3.4) | |
| Indication for referral, n (%) | 0.1311 | ||
| – Symptoms suggestive of cancer | 55 (68.8) | 37 (63.8) | |
| – Other symptoms | 25 (31.3) | 21 (36.2) | |
| Total number of visits, mean ± SD | 3.723 ± 1.7435 | 2.740 ± 1.3747 | 0.0436 |
| Ratio of successive/first visits, mean ± SD | 2.69 ± 0.7454 | 1.72 ± 0.5357 | 0.0462 |
| Time-to-diagnosis (days) | 0.0586 | ||
| – Mean ± SD | 9.52 ± 5.77 | 13.33 ± 14.81 | |
| – Median (IQR) | 7.5 (4.5–11) | 8 (2–21) | |
| Direct costs/patient (€), mean ± SD | |||
| – Personnel | 78.30 ± 19.01 | 46.55 ± 3.89 | 0.0493 |
| – Laboratory & pathology | 250.62 ± 117.43 | 122.56 ± 49.72 | 0.1103 |
| – Imaging & endoscopy | 453.04 ± 110.20 | 420.70 ± 141.12 | 0.8253 |
| – Biopsy & cytology techniques | 61.16 ± 17.90 | 75.33 ± 51.86 | 0.4059 |
| – Specialist consultation & referral | 9.03 ± 2.21 | 15.85 ± 6.44 | 0.2398 |
| Structural costs/patient (€), mean ± SD | 155.23 ± 68.39 | 138.58 ± 18.26 | 0.9072 |
| Indirect costs/patient (€), mean ± SD | 61.79 ± 29.30 | 15.37 ± 2.59 | <0.0001 |
| Total cost/patient (€), mean ± SD | 1.069.17 ± 218.64 | 827.65 ± 151.83 | 0.0871 |
IQR: Interquartile range; SD: Standard deviation.
Discussion
We performed an analysis of costs using micro-costing techniques to determine and compare the costs associated with the diagnostic evaluation of ambulatory patients managed at two different quick diagnosis units in Barcelona. Our study showed that, even though statistical significance was not reached, the mean cost per patient of the unit of the tertiary hospital was moderately higher than the cost of the unit of the secondary center. However, costs of personnel and indirect costs of the Tertiary Unit, including both the monetary value and the percent contribution to the overall cost, were significantly higher.
Studies have shown that noninpatient care alternative strategies to hospital admission, which are best exemplified by daycare centers, hospitals-at-home, and, more recently, quick diagnosis units, effectively improve patient flow and ease the pressure on the availability of hospital beds [4,10,19]. Although quick diagnosis units have multiplied across tertiary and secondary Spanish hospitals during the last 15 years, reported studies analyzing their role as an alternative ambulatory care model to inpatient admission come just from a few centers [6,13,16,20,21]. In general, observational studies have concluded that the clinical efficiency of quick diagnosis units is similar to that of conventional hospitalization for diagnostic purposes but that the costs associated with the ambulatory management of these patients are lower than the cost applied to the same disorders in the inpatient setting [9–11,13,15,16,22,23].
With the exception of a cost minimization analysis comparing a quick diagnosis unit of a tertiary hospital versus hospitalization [15], studies analyzing the economic outcomes of these units have mainly involved informal cost evaluations. Two systematic reviews by authors from the United States analyzed all the reported articles about quick diagnosis units and found that the average cost savings from fixed costs of hospitalization ranged from €1764 to 2514 per patient in the quick diagnosis unit model compared with inpatient matched controls. Further, an economic saving of 7–8.76 inpatient beds per day was reported [5,7]. As far as we can tell, ours is the first study to compare the costs associated with the diagnostic assessment of patients managed at quick diagnosis units of hospitals of different level of complexity.
Though limited to the Spanish public system, a healthcare model similar to quick diagnosis units has been operating in the Scandinavian countries since the early 2010s. The differentiated approach works as an urgent referral pathway for patients with unspecific, serious symptoms, who are referred from primary care centers to the so-called ‘diagnostic centre’, a unit staffed with several specialists and equipped with a sort of facilities for diagnostic investigations. Although studies of patients assessed through this pathway have reported a number of high-quality indicators [24,25], no articles analyzing the incurred costs have been published to date.
In our study, the distribution of cost components of both units showed a similar pattern, with direct costs per patient, which include personnel costs, being the greatest contributors to overall costs (79.1% in the Tertiary vs 81.2% in the Secondary Unit). While diagnostic examinations accounted for the largest share of overall costs without significant differences (66.97% [(€386.77/577.50] in the Tertiary vs 70.27% [€277.37/394.70] in the Secondary Unit), the contribution of indirect costs per patient to the total cost, although significantly different, was relatively small (8.6 vs 3.3%, respectively). However, the differences in indirect and personnel costs observed in our study must be interpreted considering the similarities and differences of the two hospitals and their respective quick diagnosis units. Patients managed at the tertiary hospital are often referred from smaller, secondary hospitals including the second-level hospital reported here. Unlike the latter, the tertiary hospital has a full complement of services, highly specialized staff and high technological equipment. Although the clinical indications for referral and working methods of both units are similar, the volume of patients evaluated, the number of staff, and the contribution of staff time to the unit of the tertiary center are considerably greater. Yet the reported cost differences per patient cannot be explained by the volume of patients since results are shown per patient and not as a global count.
The analysis of clinical data revealed some salient findings. Time to diagnosis, which is considered an indicator of high-healthcare quality of quick diagnosis units [5–7], was significantly shorter in the tertiary center unit (8 vs 12 days, respectively; p < 0.0001). Although the cost per visit of the two units was similar (€182.8 in the Tertiary vs €184.6 in the Secondary Unit), we found significant differences in the total number of visits (i.e., first and successive appointments until diagnosis) including the ratio of successive/first visits, which were higher in the Tertiary Unit (3.1 and 2.1 vs 2.1 and 1.1, respectively). Accordingly, the differences in the mean cost per patient between the tertiary and secondary unit (€577.5 vs 394.7, respectively; p = 0.0559) should be mainly ascribed to the higher number of appointments in the former. While significant differences in indirect costs reflect the higher rate of operation and maintenance costs as expected for a unit located in a well-resourced daycare center, personnel costs are strongly linked to the number and ratio of visits.
When looking at the possible reasons for the higher number of visits in the Tertiary Unit, the following points must be considered. As shown in Table 1, the rate of referrals from the emergency department was 61.2% in the Tertiary Unit compared with only 17% in the Secondary Unit and these differences were more pronounced for patients referred for symptoms suggestive of cancer and patients with a diagnosis of cancer. In particular, while patients from the Tertiary Unit were significantly more likely to have symptoms suggestive of cancer as referral reason and cancer as final diagnosis, 65.1% (140/215) of them were referred to the unit after presentation to the emergency department. In contrast, the emergency department was the original referral source of only 15.9% (26/164) of patients with both suspected cancer and a cancer diagnosis assessed at the Secondary Unit (Tables 4 & 5). Furthermore, as partly reflected by these differences, patients from the secondary center unit were in general more likely to have milder and less acute or ‘urgent’ symptoms than those from the Tertiary Unit including, among others, unexplained fatigue, osteoarticular symptoms and nonspecific laboratory abnormalities. A former study showed that, with a lower number of visits, patients from the secondary center unit required fewer investigations to achieve a diagnosis than patients from the other unit [16], suggesting that their management was more straightforward. Specifically, patients from the Tertiary Unit were significantly more likely than those from the Secondary Unit to undergo endoscopies (17 vs 11%), ultrasonographies (15 vs 8%) and cytology/biopsy studies (21 vs 10%) and differences were more pronounced when analyzing diagnostic tests according to age groups and final diagnosis. For instance, among patients aged ≥65 years, those from the Tertiary Unit underwent significantly more CT scans (38 vs 25%), MRI examinations (13 vs 7%), ultrasonographies (19 vs 6%) and cytology/biopsy studies (26 vs 9%). Also, among patients with malignancy, those from the Tertiary Unit underwent, compared with Secondary Unit patients, a significantly higher number of CT scans (84 vs 69%), MRI examinations (40 vs 13%), ultrasonographies (50 vs 2%) and cytology/biopsy studies (79 vs 47%) [16]. Differences in cytology/biopsy studies are especially relevant since most of them involve invasive diagnostic procedures (mainly computed tomography- or ultrasound-guided biopsy or fine-needle aspiration cytology of abnormal areas of tissue and organs [e.g., liver, pancreas, lung and bone]) requiring admission to hospital for the day of the procedure.
Taken together, all these results suggest that a greater level of complexity of the medical disorders evaluated at the tertiary center unit most likely accounted for the differences in the volume and ratio of visits and the overall costs between the two units.
Implications
By virtue of our results, we envisage some practical applications from a health policy perspective. Although the two hospitals described in this report belong to the same health area in Barcelona and the tertiary hospital is the referral center for patients managed at the secondary hospital, their quick diagnosis units are independent. It is, nevertheless, feasible to design a functional model involving integrated quick diagnosis units of the same health areas with shared working protocols and even resources. Accordingly, eligible patients could be referred to these units depending on the complexity of their disorders or, for instance, the availability of spaces in the unit or could they also be referred based on criteria of efficiency or cost optimization (i.e., adjusted to the type of hospital and its resources), irrespective of the source of referral.
Limitations
We acknowledge some limitations. In addition to its retrospective nature, costs related to the miles driven by the patient or anyone accompanying them or the contribution of patients’ and caregivers’ time (i.e., a societal perspective) were not included in the cost estimates. Nonetheless, based on a former study of patients from the unit of the tertiary center that included costs of patient transportation to and from the unit and costs of accompanying personnel [11], this issue is unlikely to undermine the levels of overall costs. An additional limitation of the study is the fact that study data were obtained from two urban medical centers in a single geographic region and that the quick diagnosis unit care delivery approach seems unique to the Spanish National Health System, thus precluding a generalizability of the results.
Conclusion
Our investigation found that the main driver of the cost differences between the quick diagnosis units of a tertiary and secondary hospital was the total number of visits and successive/first visits ratio. Owing to a higher number of visits, the mean cost per patient of the unit of the tertiary hospital was near-significantly higher than that of the secondary hospital unit. When costs per patient were split off into categories, significant differences were only observed for personnel or staff costs and indirect costs, which were higher in the tertiary center unit. A greater level of diagnostic and clinical complexity of the patients managed at this unit added to the own characteristics of the unit including the number of staff and the contribution of staff time were the leading factors contributing to the observed differences.
The results from this study justify additional research efforts to replicate and validate the favorable economic outcomes of these units in other healthcare settings and inform policy decisions on spending priorities that are relevant to hospital-based ambulatory care and quick diagnosis units.
•
Formal economic studies comparing the costs of patient management at quick diagnosis units of different hospitals and different levels of complexity are lacking.
•
Through a bottom-up micro-costing approach from the healthcare provider perspective, we investigated the costs associated with the diagnostic process of two quick diagnosis units of a tertiary and second-level hospital.
•
The mean time to diagnosis, which is considered an indicator of high-healthcare quality of quick diagnosis units, was significantly shorter in the unit of the tertiary hospital.
•
Patients from the tertiary hospital unit presented with more serious clinical conditions and required more visits to be diagnosed than those of the secondary hospital unit.
•
The micro-costing analysis revealed similar costs per visit but a moderately, near-significantly higher mean cost per patient of the unit of the tertiary hospital.
•
An analysis of the cost components that contributed to patient management (i.e., personnel costs, costs of investigations, procedures and consultations, structural costs and indirect costs) showed significantly higher personnel and indirect costs in the unit of the tertiary hospital.
•
The average contribution of personnel and indirect costs relative to the total cost per patient was also significantly higher in the tertiary hospital unit.
•
When analyzing separately patients referred for symptoms suggestive of cancer and patients with a final diagnosis of cancer, cost differences continued to lie in personnel and indirect costs.
•
We conclude that the greater complexity of the conditions evaluated in the unit of the tertiary hospital and the own characteristics of this unit including the number of staff and contribution of staff time explained the differences in cost outcomes.
Author contributions
All authors contributed to the study conception and design. Material preparation, data collection and analysis were performed by X Bosch, EMPalacín, MJM Peñas, Y Compta and Jordi Ramon. The first draft of the manuscript was written by X Bosch and all authors commented on previous versions of the manuscript. All authors revised the work critically for important intellectual content, approved the version to be published and agree to be accountable for all aspects of the work in ensuring that questions related to the accuracy or integrity of any part of the work are appropriately investigated and resolved.
Financial & competing interests disclosure
The authors have no relevant affiliations or financial involvement with any organization or entity with a financial interest in or financial conflict with the subject matter or materials discussed in the manuscript. This includes employment, consultancies, honoraria, stock ownership or options, expert testimony, grants or patents received or pending, or royalties.
No writing assistance was utilized in the production of this manuscript.
Ethical conduct of research
The study was carried out in line with the principles of the Declaration of Helsinki. Approvals were granted by the Research Ethics Committee of the Hospital Clínic of Barcelona and the network of hospitals to which Hospital Plató belongs to (Comitè d'Ètica de la Investigació Clínica [CEIC]-Unió Catalana d'Hospitals). Need for informed consent was waived due to the retrospective design of this study.
Data sharing statement
The authors certify that this manuscript reports original clinical trial data. Data reported in this manuscript are available within the article. Additional data from the study are available upon reasonable request.
References
1.
Bosch X. Reforming Spanish health care: a matter of survival. Health Policy 119(1), 107–110 (2015).
2.
Karanikolos M, Mladovsky P, Cylus J et al. Financial crisis, austerity, and health in Europe. Lancet 381(9874), 1323–1331 (2013).
3.
Pericás JM, Aibar J, Soler N, López-Soto A, Sanclemente-Ansó C, Bosch X. Should alternatives to conventional hospitalisation be promoted in an era of financial constraint? Eur. J. Clin. Invest. 43(6), 602–615 (2013).
4.
Corbella X, Barreto V, Bassetti S et al. Hospital ambulatory medicine: a leading strategy for Internal Medicine in Europe. Eur. J. Intern. Med. 54, 17–20 (2018).
5.
Conley J, O'Brien CW, Leff BA, Bolen S, Zulman D. Alternative strategies to inpatient hospitalization for acute medical conditions: a systematic review. JAMA Intern. Med. 176(11), 1693–1702 (2016).
6.
Bosch X, Aibar J, Capell S, Coca A, López-Soto A. Quick diagnosis units: a potentially useful alternative to conventional hospitalisation. Med. J. Aust. 191(9), 496–498 (2009).
7.
Gupta S, Sukhal S, Agarwal R, Das K. Quick diagnosis units--an effective alternative to hospitalization for diagnostic workup: a systematic review. J. Hosp. Med. 9(1), 54–59 (2014).
8.
Bosch X, Ladino A, Moreno-Lozano P, Jordán A, López-Soto A. Trends in hospitalization of patients with potentially serious diseases evaluated at a quick diagnosis clinic. Diagnostics (Basel) 10(8), 585 (2020).
9.
Bosch X, Palacios F, Inclán-Iríbar G et al. Quick diagnosis units or conventional hospitalisation for the diagnostic evaluation of severe anaemia: a paradigm shift in public health systems? Eur. J. Intern. Med. 23(2), 159–164 (2012).
10.
Bosch X, Jordán A, López-Soto A. Quick diagnosis units: avoiding referrals from primary care to the ED and hospitalizations. Am. J. Emerg. Med. 31(1), 114–123 (2013).
11.
Bosch X, Sanclemente-Ansó C, Escoda O et al. Time to diagnosis and associated costs of an outpatient vs inpatient setting in the diagnosis of lymphoma: a retrospective study of a large cohort of major lymphoma subtypes in Spain. BMC Cancer 18(1), 276 (2018).
12.
Bosch X, Jordán A, Coca A, López-Soto A. Quick diagnosis units versus hospitalization for the diagnosis of potentially severe diseases in Spain. J. Hosp. Med. 7(1), 41–47 (2012).
13.
Capell S, Comas P, Piella T et al. Unidad de diagnóstico rápido: un modelo asistencial eficaz y eficiente. Experiencia de 5 años [Quick and early diagnostic outpatient unit: an effective and efficient assistential model. Five years experience]. Med. Clin. (Barc.) 123(7), 247–250 (2004).
14.
Montori-Palacín E, Ramon J, Compta Y et al. Quick diagnosis units: predictors of time to diagnosis and costs. Medicine (Baltimore) 99(30), e21241 (2020).
15.
Sanclemente-Ansó C, Bosch X, Salazar A et al. Cost-minimization analysis favors outpatient quick diagnosis unit over hospitalization for the diagnosis of potentially serious diseases. Eur. J. Intern. Med. 30, 11–17 (2016).
16.
Montori-Palacín E, Prieto-González S, Carrasco-Miserachs I et al. Quick outpatient diagnosis in small district or general tertiary hospitals: a comparative observational study. Medicine (Baltimore) 96(22), e6886 (2017).
17.
Tarricone R. Cost-of-illness analysis. What room in health economics? Health Policy 77(1), 51–63 (2006).
18.
Frick KD. Microcosting quantity data collection methods. Med. Care 47(1 Suppl. 7), S76–S81 (2009).
19.
Bosch X, Escoda O, Nicolás D et al. Primary care referrals of patients with potentially serious diseases to the emergency department or a quick diagnosis unit: a cross-sectional retrospective study. BMC Fam. Pract. 15, 75 (2014).
20.
Sanclemente-Ansó C, Salazar A, Bosch X et al. A quick diagnosis unit as an alternative to conventional hospitalization in a tertiary public hospital: a descriptive study. Pol. Arch. Med. Wewn. 123(11), 582–588 (2013).
21.
Rubio-Rivas M, Vidaller A, Pujol i Farriols R, Mast R. Unidad de diagnóstico rápido en un hospital de tercer nivel. Estudio descriptivo del primer año y medio de funcionamiento [Rapid diagnosis unit in a third level hospital. Descriptive study of the first year and a half]. Rev. Clin. Esp. 208(11), 561–563 (2008).
22.
Bosch X, Moreno P, Ríos M, Jordán A, López-Soto A. Comparison of quick diagnosis units and conventional hospitalization for the diagnosis of cancer in Spain: a descriptive cohort study. Oncology (Basel) 83(5), 283–291 (2012).
23.
Bosch X, Moreno P, Guerra-García M, Guasch N, López-Soto A. What is the relevance of an ambulatory quick diagnosis unit or inpatient admission for the diagnosis of pancreatic cancer? A retrospective study of 1004 patients. Medicine (Baltimore) 99(11), e19009 (2020).
24.
Vedsted P, Olesen F. A differentiated approach to referrals from general practice to support early cancer diagnosis - the Danish three-legged strategy. Br. J. Cancer 112(Suppl. 1), S65–S69 (2015).
25.
Stenman E, Palmér K, Rydén S et al. Diagnostic spectrum and time intervals in Sweden's first diagnostic center for patients with nonspecific symptoms of cancer. Acta Oncol. 58(3), 296–305 (2019).
Information & Authors
Information
Published In
Pages: 381 - 392
PubMed: 33709770
Copyright
© 2021 Future Medicine Ltd.
History
Received: 25 September 2020
Accepted: 18 December 2020
Published online: 12 March 2021
Keywords:
Topics
Authors
Metrics & Citations
Metrics
Article Usage
Article usage data only available from February 2023. Historical article usage data, showing the number of article downloads, is available upon request.
Citations
How to Cite
A comparative cost analysis between two quick diagnosis units of different levels of complexity. (2021) Journal of Comparative Effectiveness Research. DOI: 10.2217/cer-2020-0212
Export citation
Select the citation format you wish to export for this article or chapter.
Citing Literature
- Elisabet Montori-Palacín, Xavier Bosch, Unidades de Diagnóstico Rápido: de la necesidad evidenciada por una crisis económica y una pandemia a su estandarización y extensión, Medicina Clínica, 10.1016/j.medcli.2023.12.003, 162, 7, (333-335), (2024).
- Elisabet Montori-Palacín, Xavier Bosch, Quick Diagnosis Units: Towards the standardization and expansion to the National Health System, Medicina Clínica (English Edition), 10.1016/j.medcle.2023.12.006, 162, 7, (333-335), (2024).
- Alesha Wale, Chukwudi Okolie, Jordan Everitt, Amy Hookway, Hannah Shaw, Kirsty Little, Ruth Lewis, Alison Cooper, Adrian Edwards, The Effectiveness and Cost-Effectiveness of Community Diagnostic Centres: A Rapid Review, International Journal of Public Health, 10.3389/ijph.2024.1606243, 69, (2024).