Economic impact of multigene panel testing for hereditary breast and ovarian cancer
Publication: Journal of Comparative Effectiveness Research
Abstract
Aim: Healthcare utilization and costs were compared following 25-gene panel (panel) or single syndrome (SS) testing for hereditary breast and ovarian cancer. Materials & methods: Retrospective cohort study of patients unaffected by cancer with panel (n = 6359) or SS (n = 4681) testing for hereditary breast and ovarian cancer (01 January 2014 to 31 December 2016). Groups were determined by test type and result (positive, negative, variant of uncertain significance [VUS]). Results: There were no differences in total unadjusted healthcare costs between the panel (US$14,425) and SS (US$14,384) groups (p = 0.942). Among VUS patients in the panel and SS groups, mean all-cause costs were US$14,404 versus US$20,607 (p = 0.361) and mean risk-reduction/early detection-specific costs were US$718 versus US$679 (p = 0.890), respectively. Adjusted medical costs were not significantly different between panel and SS cohorts. Conclusion: Healthcare utilization and costs were comparable between the SS and panel tests overall and for patients with VUS.
Inherited pathogenic variants in BRCA1 and BRCA2 have long been associated with a high-risk predisposition for breast and ovarian cancer. As genomic technology has advanced, published studies have shown that approximately 4–11% of patients at high-risk for hereditary breast and ovarian cancer (HBOC) syndrome have pathogenic variants in genes other than BRCA1 and BRCA2, including ATM, CDH1, CHEK2, NBN, PALB2, PTEN, STK11, TP53, BRIP1, RAD51C, RAD51D, MSH2, MLH1, MSH6, PMS2, EPCAM and STK11 [1–7]. Understanding the magnitude of increased cancer risk associated with these variants is important to guide management recommendations for risk-reduction and early detection strategies [8–12]. While a pathogenic variant in a highly penetrant gene (fivefold or greater increased risk) may warrant risk-reducing surgery, a similar result in a moderate penetrance gene (two- to fourfold increased risk) may only warrant additional screening.
Next-generation sequencing has allowed for simultaneous testing of multiple cancer genes, increasing the scope and speed of HBOC testing while reducing costs [13,14]. This has resulted in the increased accessibility of multigene panel testing, providing a broad picture of the genetic heterogeneity of cancer syndromes. Individuals carrying pathogenic variants in cancer predisposition genes can make more informed decisions regarding their future healthcare, including steps toward risk-reduction and early detection via screening, surgery and/or chemoprevention that may not have been indicated based upon family history alone [7]. In a recent study, researchers recommended patients with breast cancer undergo expanded panel testing, as almost half of patients with a pathogenic or likely pathogenic variant who would benefit from clinically actionable and/or management guidelines currently in development were missed by current testing guidelines [15].
Despite the benefits of multigene panel testing, the technology has been subject to some criticism [5,16–19]. The magnitude of cancer risk may not be as well quantified for some less characterized genes compared with BRCA1 and BRCA2. In addition, testing for variants in multiple genes can increase the likelihood of finding variants of uncertain significance (VUS), which some argue may increase unwarranted surgical or screening interventions [5,20–26]. Despite this, little to no data exist describing the real-world economic burden of multigene panel testing for HBOC. This study compared all-cause and risk-reduction/early detection-specific healthcare utilization and costs among patients who underwent genetic testing with the 25-gene panel (panel) test versus single syndrome (SS) test for HBOC in a managed care setting.
Materials & methods
Data sources
This retrospective cohort study used Myriad Genetic Laboratories, Inc.’s (Myriad) test result database linked to administrative claims data from the Optum Research Database (ORD). Using Optum’s De-identified Linking Software, a unique and de-identified value was created for each necessary individual attribute within the two databases and the resulting de-identified keys were used to establish the de-identified linkages. This parallel process allowed for de-identified linking of individuals from the two databases with no exchange of Protected Health Information. The ORD is a nationally representative, de-identified research database that contains included enrollment information and medical and pharmacy claims. Medical claims included diagnosis and procedure codes from the International Classification of Diseases, 9th and 10th Revisions, Clinical Modification (ICD-9-CM, ICD-10-CM); Current Procedural Terminology, Version 4 (CPT-4) procedure codes; HealthCare Common Procedure Coding System codes; revenue codes; and site of service codes. Outpatient pharmacy claims, available for approximately 38% of study patients, included National Drug Codes for dispensed medications. De-identified data were used to support this analysis; therefore, pursuant to the Health Insurance Portability and Accountability Act, an Institutional Review Board approval or waiver of authorization was not required.
Study sample selection & group assignment
The patient sample consisted of a majority commercial and a small number of Medicare Advantage enrollees included in both Myriad’s test result database and the ORD. Patients must have had ≥1 claim for a panel test (CPT codes 81211, 81213 and 81479 on the same day) or ≥1 claim for a SS test (CPT codes 81211 or 81213) between 1 January 2014 and 31 December 2016, with the name Myriad on the same claim as the specified CPT codes. The date of the first test claim was considered the index date. Test type identified in the ORD was confirmed in the linked Myriad test result database. Patients were also required to have continuous enrollment in the health plan with medical benefits for ≥6 months prior to (baseline period) and ≥12 months including and following (follow-up period) the index date and be ≥18 years of age as of the index date. A follow-up period of 12 months was required to adequately capture healthcare utilization and costs. Patients with a prior claim for HBOC genetic testing, a prior nondiagnostic claim with a cancer diagnosis during the baseline period or a claim indicating a personal history of cancer during the study period were excluded. Exclusion of patients with a personal history of cancer at the time of testing removed the effect of treatment for a cancer diagnosed prior to genetic testing on healthcare utilization and costs.
The SS test identified an elevated risk of HBOC, hereditary pancreatic cancer, prostate cancer and melanoma due to variants in BRCA1 and BRCA2. The panel test identified an elevated risk for eight hereditary cancers (breast, ovarian, colorectal, endometrial, melanoma, pancreatic, gastric and prostate) due to variants in the following genes: BRCA1, BRCA2, ATM, CDH1, CHEK2, NBN, PALB2, PTEN, STK11, TP53, BRIP1, RAD51C, RAD51D, MSH2, MLH1, MSH6, PMS2, EPCAM, APC, BARD1, BMPR1A, CDK4, CDKN2A, MUTYH and SMAD4. Variant classification was based on joint guidelines from the American College of Medical Genetics and Genomics and the Association for Molecular Pathology [27], as previously described [28,29]. Patients were assigned to groups based on the test received (panel or SS) and test result: positive (identification of ≥1 pathogenic variant [laboratory classification of deleterious or suspected deleterious] or a variant with a special interpretation finding noting possible increased cancer risks), VUS (identification of ≥1 variant without sufficient evidence of increased cancer risk and no pathogenic variants), negative (no identification of pathogenic variants or VUS). This resulted in six groups: panel–positive, panel–VUS, panel–negative, SS–positive, SS–VUS, SS–negative. The positive group included individuals with variants reported as ‘Special Interpretation,’ such as monoallelic MUTYH pathogenic variants and APC I1307K. This reflects the reporting of these findings as potentially actionable based on personal and family cancer history and/or ancestry.
Measures
All variables were measured over the 6-month baseline period through the 12-month follow-up period.
Baseline patient demographic & clinical characteristics
Characteristics assessed during the baseline period included age, gender, insurance type, pharmacy coverage, geographic region, Charlson comorbidity index [30,31] and co-morbidities (identified with Clinical Classifications Software managed by the Agency for Healthcare Research [AHRQ] based on ICD-9-CM and ICD-10-CM codes) [32,33].
Outcomes
All-cause utilization, categorized as ambulatory (office and hospital outpatient) visits, emergency room visits and inpatient admissions, was identified during the baseline and follow-up periods. The number and percentage of patients with claims indicating care at these sites were calculated. Utilization of risk-reduction/early detection-specific interventions was also assessed during the follow-up period as the percentage of patients with medical claims for breast or ovarian cancer imaging (breast MRI, mammography or transvaginal ultrasound), surgical procedures (mastectomy or bilateral salpingo-oophorectomy), biopsy, CA-125 monitoring and chemoprevention (tamoxifen or oral contraceptives among patients with pharmacy claims).
All-cause healthcare costs (health plan- and patient-paid amounts) categorized as medical costs (ambulatory, emergency, inpatient and other costs) and pharmacy costs were captured during the baseline and follow-up periods. Mean total cost amounts were calculated for each group and adjusted using the annual medical care component of the Consumer Price Index (CPI) to account for inflation between 2014 and 2016. Risk-reduction/early detection-specific healthcare costs were calculated as the CPI-adjusted combined health plan- and patient-paid amounts related to breast and ovarian cancer imaging, surgical procedures, biopsy, CA-125 monitoring and chemoprevention in the follow-up period.
Analysis
All comparisons were analyzed descriptively. Numbers and percentages were provided for dichotomous and polychotomous variables and means and standard deviations were provided for continuous variables. Chi-square tests and unpaired t-tests were used to compare categorical and continuous variables, respectively. Three generalized linear models with gamma distributions and log link (using a stepwise selection methodology) were examined to account for confounding of the relationship between the test group and the number of all-cause ambulatory visits, costs associated with all-cause ambulatory visits and total medical costs. The models were adjusted for test result, age category (18–34, 35–44, 45–54, 55–64 and ≥65 years), region, baseline Charlson co-morbidity score, varying baseline AHRQ co-morbidities, baseline count of ambulatory visits, and other baseline cost and utilization measures depending on which variables were indicated by stepwise selection for model inclusion.
Results
Demographic & clinical characteristics
A total of 11,040 patients met inclusion and exclusion criteria; 6359 in the panel group and 4681 in the SS group (Figure 1). Among the panel group, 5.9% tested positive, 60.3% negative and 33.8% VUS. Among the SS group, 2.4% tested positive, 95.2% negative and 2.4% VUS. In the panel group, pathogenic variants were most common in MUTYH (31.3%), BRCA2 (10.4%), APC (10.2%), BRCA1 (8.6%), CHEK2 (8.6%), ATM (7.5%) and PALB2 (5.1%). Among patients who tested positive in the SS group, 51.3% had a BRCA1 variant and 48.7% had a BRCA2 variant. Most study patients were female (98.1% panel, 99.0% SS; p = 0.041) and commercially insured (99.3% panel, 98.9% SS; p < 0.001) (data not shown). Mean age was slightly lower (43.2 vs 43.7 years; p = 0.041) as was the Charlson comorbidity score (0.19 vs 0.22; p = 0.041) among the panel group compared with the SS group. Slightly more patients in the panel group versus the SS group had pharmacy coverage through the health plan (39.6 vs 36.5%; p < 0.001).
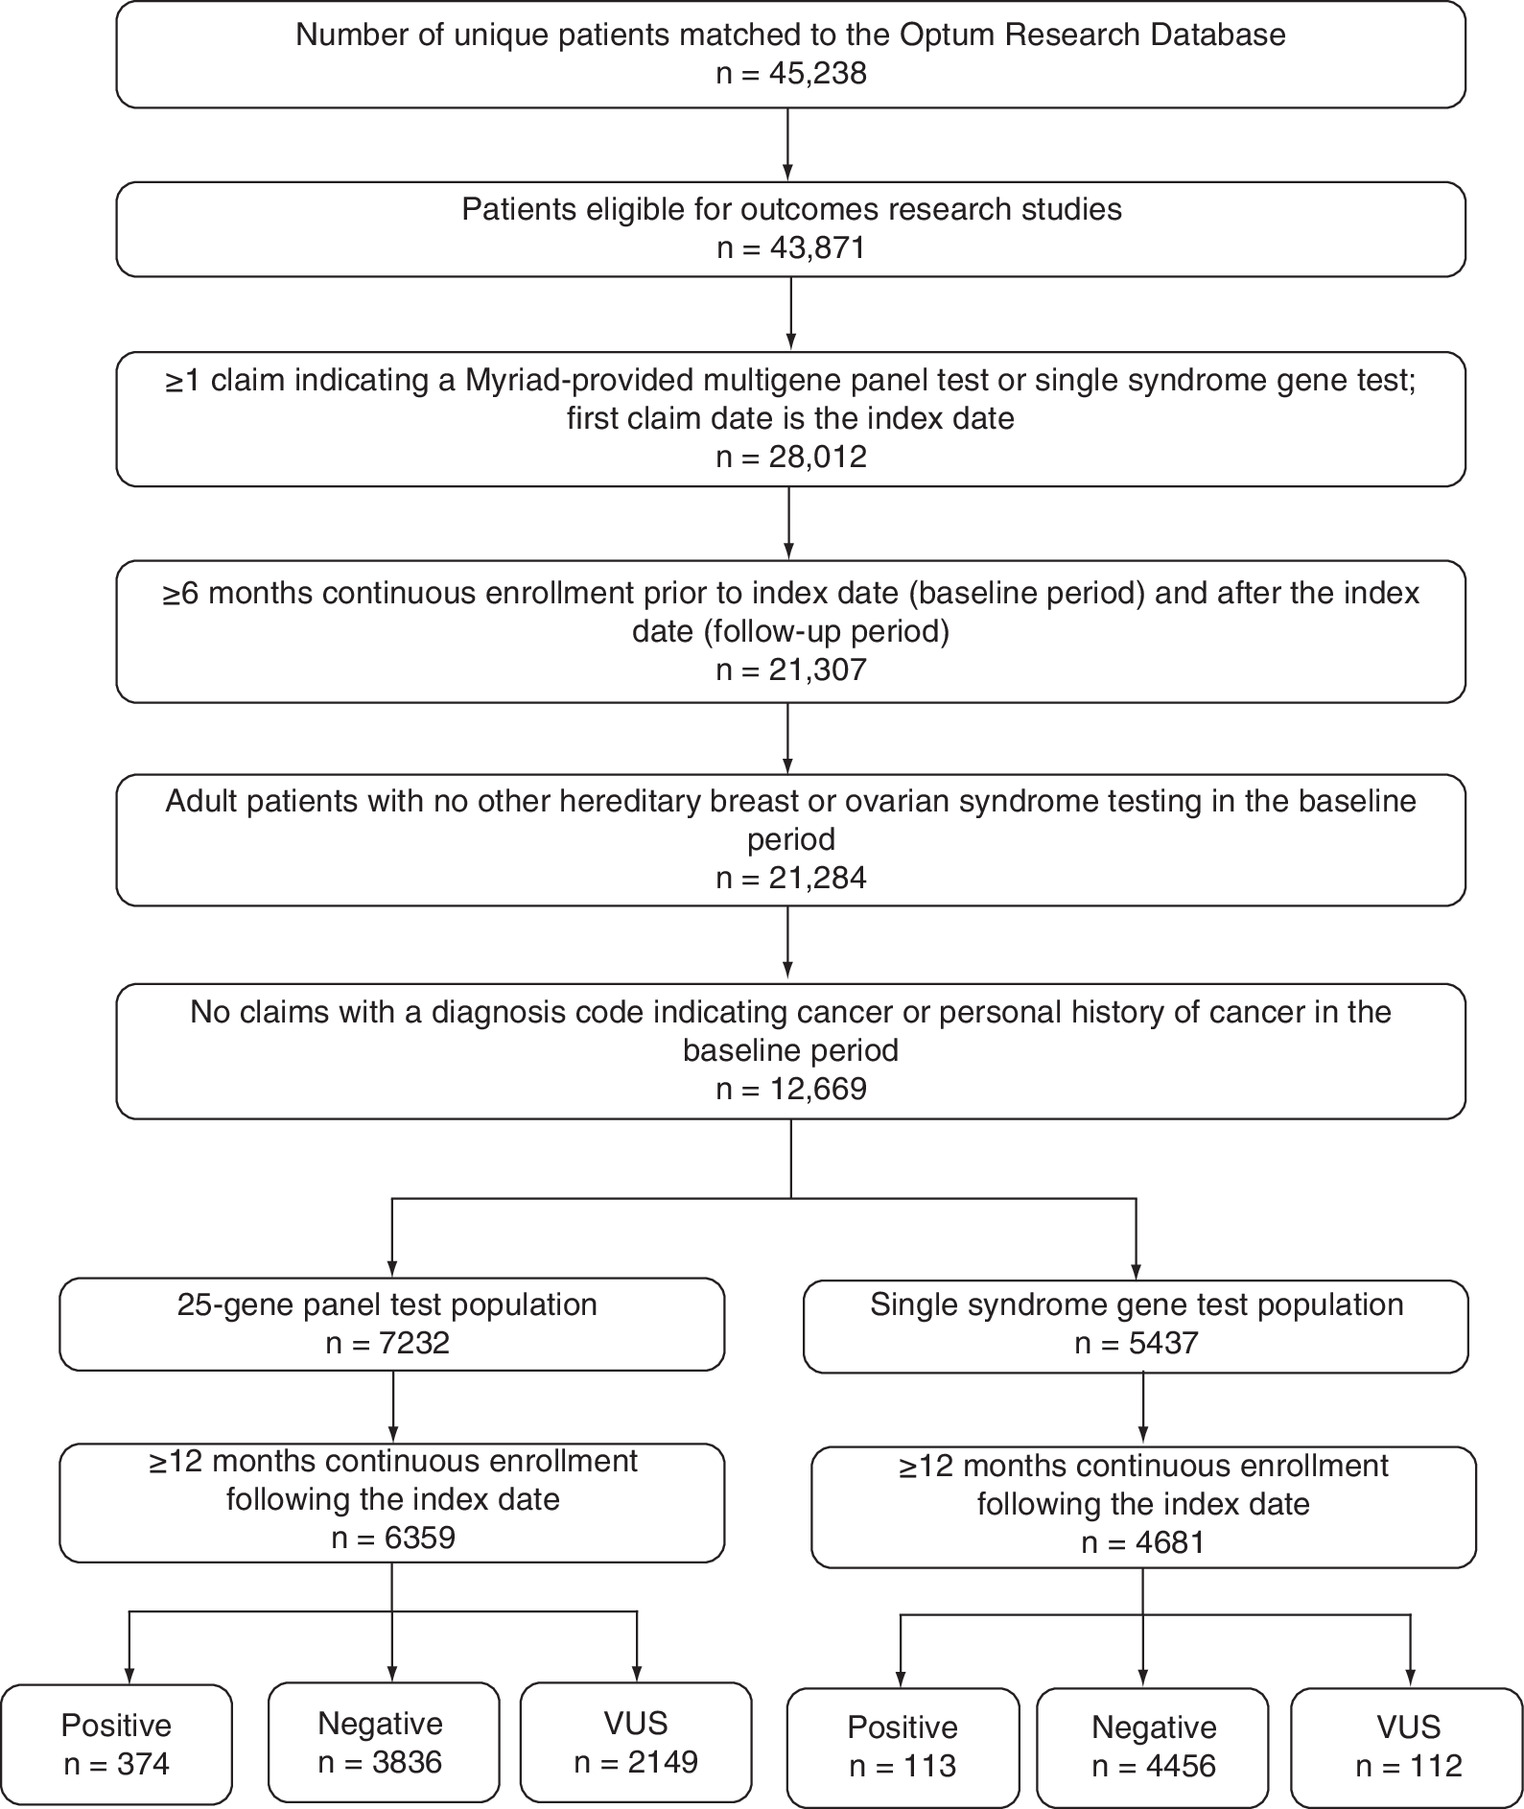
Figure 1. Study sample selection.
VUS: Variant of unknown significance.
Healthcare utilization
Baseline healthcare utilization was similar between the panel and SS groups and across all test results with the exception of emergency room visits among VUS patients. Patients with a VUS result on the panel test had more emergency room visits compared with VUS patients who received the SS test (0.6 vs 0.3 mean visits; p = 0.041).
Overall, there were no significant differences in follow-up all-cause healthcare utilization among patients who underwent panel compared with SS testing (Table 1). Almost all patients had an all-cause ambulatory visit during the 12-month follow-up period, averaging 1.4 to almost two visits per month and approximately 32% had an emergency room visit. Ambulatory visit counts did not differ between the panel versus the SS groups either before (16.5 vs 16.7; p = 0.631) or after adjustment (17.3 vs 17.3, p = 0.809). When test results were considered in unadjusted analyses, a higher proportion of patients who were positive experienced an inpatient stay in the SS versus panel group (18.6 vs 8.3%; p = 0.002), with a higher mean number of hospitalizations (0.23 vs 0.07; p = 0.021).
| Healthcare resource | 25-gene panel | Single syndrome | ||||||
|---|---|---|---|---|---|---|---|---|
| Total (n = 6359) | Positive (n = 374) | Negative (n = 3836) | VUS (n = 2149) | Total (n = 4681) | Positive (n = 113) | Negative (n = 4456) | VUS (n = 112) | |
| All-cause | ||||||||
| Ambulatory visit, n (%): | 6329 (99.5) | 373 (99.7) | 3817 (99.5) | 2139 (99.5) | 4655 (99.4) | 113 (100.0) | 4431 (99.4) | 111 (99.1) |
| – Mean count (SD) | 16.5 (16.9) | 21.1 (19.7) | 16.3 (16.9) | 16.2 (16.5) | 16.7 (17.1) | 22.5 (17.6) | 16.5 (17.1) | 16.3 (16.3) |
| ER visit, n (%): | 2017 (31.7) | 127 (34.0) | 1210 (31.5) | 680 (31.6) | 1486 (31.8) | 37 (32.7) | 1419 (31.8) | 30 (26.8) |
| – Mean count (SD) | 1.2 (3.9) | 1.1 (3.3) | 1.2 (4.0) | 1.1 (3.8) | 1.1 (3.5) | 0.8 (2.2) | 1.2 (3.5) | 1.0 (3.1) |
| Inpatient stay, n (%): | 395 (6.2) | 31 (8.3)† | 235 (6.1) | 129 (6.0) | 316 (6.8) | 21 (18.6)† | 288 (6.5) | 7 (6.3) |
| – Mean count (SD) | 0.1 (0.3) | 0.1 (0.4)† | 0.1 (0.3) | 0.1 (0.3) | 0.1 (0.3) | 0.2 (0.5)† | 0.1 (0.3) | 0.1 (0.2) |
| Risk-reduction/early detection-specific, n (%): | ||||||||
| – Any | 4208 (66.2)‡ | 275 (73.5) | 2466 (64.3)‡ | 1467 (68.3) | 3252 (69.5)‡ | 91 (80.5) | 3085 (69.2)‡ | 76 (67.9) |
| – Surgical procedure | 152 (2.4)‡ | 23 (6.2)‡ | 76 (2.0)‡ | 53 (2.5) | 172 (3.7)‡ | 22 (19.5)‡ | 146 (3.3)‡ | 4 (3.6) |
| – Imaging | 3915 (61.6)‡ | 265 (70.9) | 2290 (59.7)‡ | 1360 (63.3) | 3044 (65.0)‡ | 86 (76.1) | 2887 (64.8)‡ | 71 (63.4) |
| – Biopsy | 173 (2.7) | 22 (5.9) | 95 (2.5) | 56 (2.6) | 141 (3.0) | 11 (9.7) | 129 (2.9) | 1 (0.9) |
| – CA-125 monitoring | 332 (5.2) | 49 (13.1)‡ | 164 (4.3) | 119 (5.5) | 242 (5.2) | 37 (32.7)‡ | 201 (4.5) | 4 (3.6) |
| Chemoprevention§: | ||||||||
| – Valid, n | 2520 | 154 | 1540 | 826 | 1706 | 36 | 1628 | 42 |
| – n (%) | 480 (19.1) | 22 (14.3) | 285 (18.5) | 173 (20.9) | 325 (19.1) | 8 (22.2) | 308 (18.9) | 9 (21.4) |
†
Indicates p-value < 0.05 in the comparison of 25-gene panel vs single syndrome test.
‡
Indicates p-value < 0.001 in the comparison of 25-gene panel vs single syndrome test.
§
Only among patients with pharmacy benefit for the entire study period.
ER: Emergency room; SD: Standard deviation; VUS: Variant of unknown significance.
Risk-reduction/early detection-specific healthcare utilization among patients who had panel testing (n = 6359) was lower compared with those who had SS testing (n = 4681; 69.5 vs 66.2%; p < 0.001; Table 1). Imaging was the most commonly utilized intervention regardless of test type or result, with approximately 63% of patients undergoing at least one imaging study. Significantly more patients in the SS group underwent imaging compared with the panel group (65.0 vs 61.6%; p < 0.001). In addition, risk-reducing surgery was more common within the SS group compared with the panel group (3.7 vs 2.4%; p < 0.001).
There were no significant differences in the overall risk-reduction/early-detection-specific utilization among patients who tested positive in the panel (n = 374) versus SS group (n = 113; 73.5 vs 80.5%; p = 0.131; Table 1). Among patients who tested positive, those in the SS group had a higher percentage of claims for both risk-reducing surgery (19.5 vs 6.2%; p < 0.001) and CA-125 monitoring (32.7 vs 13.1%; p < 0.001) compared with patients in the panel group.
Among patients who tested negative (n = 8292), overall risk-reduction/early detection-specific utilization was lower in the panel group compared with the SS group (64.3 vs 69.2%; p < 0.001; Table 1). This included increased utilization of risk-reducing surgery (3.3 vs 2.0%; p < 0.001) and imaging (64.8 vs 59.7%; p < 0.001) within the SS group.
In the VUS group, there was no difference in the overall utilization of risk-reduction/early detection-specific interventions for breast or ovarian cancer among the panel (n = 2149) or SS groups (n = 112; 68.3 vs 67.9%; p = 0.928; Table 1). In addition, there were no significant differences in any category of risk-reduction/early-detection interventions.
When follow-up all-cause healthcare utilization was compared across test results, positive patients receiving either the panel or SS tests had a significantly higher count of ambulatory visits compared with patients who tested negative or VUS (p ≤ 0.007 for all comparisons). Additionally, among patients who received the SS test, both the percentage of patients who had an inpatient stay and the mean number of inpatient stays were significantly higher among those who tested positive compared with those who tested negative or VUS (p ≤ 0.005 for all comparisons). There were no significant differences in follow-up all-cause healthcare utilization among patients who tested negative compared with patients who tested VUS in either the panel or SS test. Patients who tested positive (n = 487) also received more risk-reduction/early detection-specific interventions compared with patients with other test results (negative or VUS), regardless of test type.
Healthcare costs
Baseline healthcare costs were similar between the panel and SS groups (US$4120 vs US$3975; p = 0.458). Total unadjusted mean annual follow-up healthcare costs were similar between the panel and SS groups (US$14,425 vs US$14,384, p = 0.942; Figure 2). When test results were considered, there were no significant differences in total healthcare costs for patients in the panel and SS groups who tested negative or VUS.
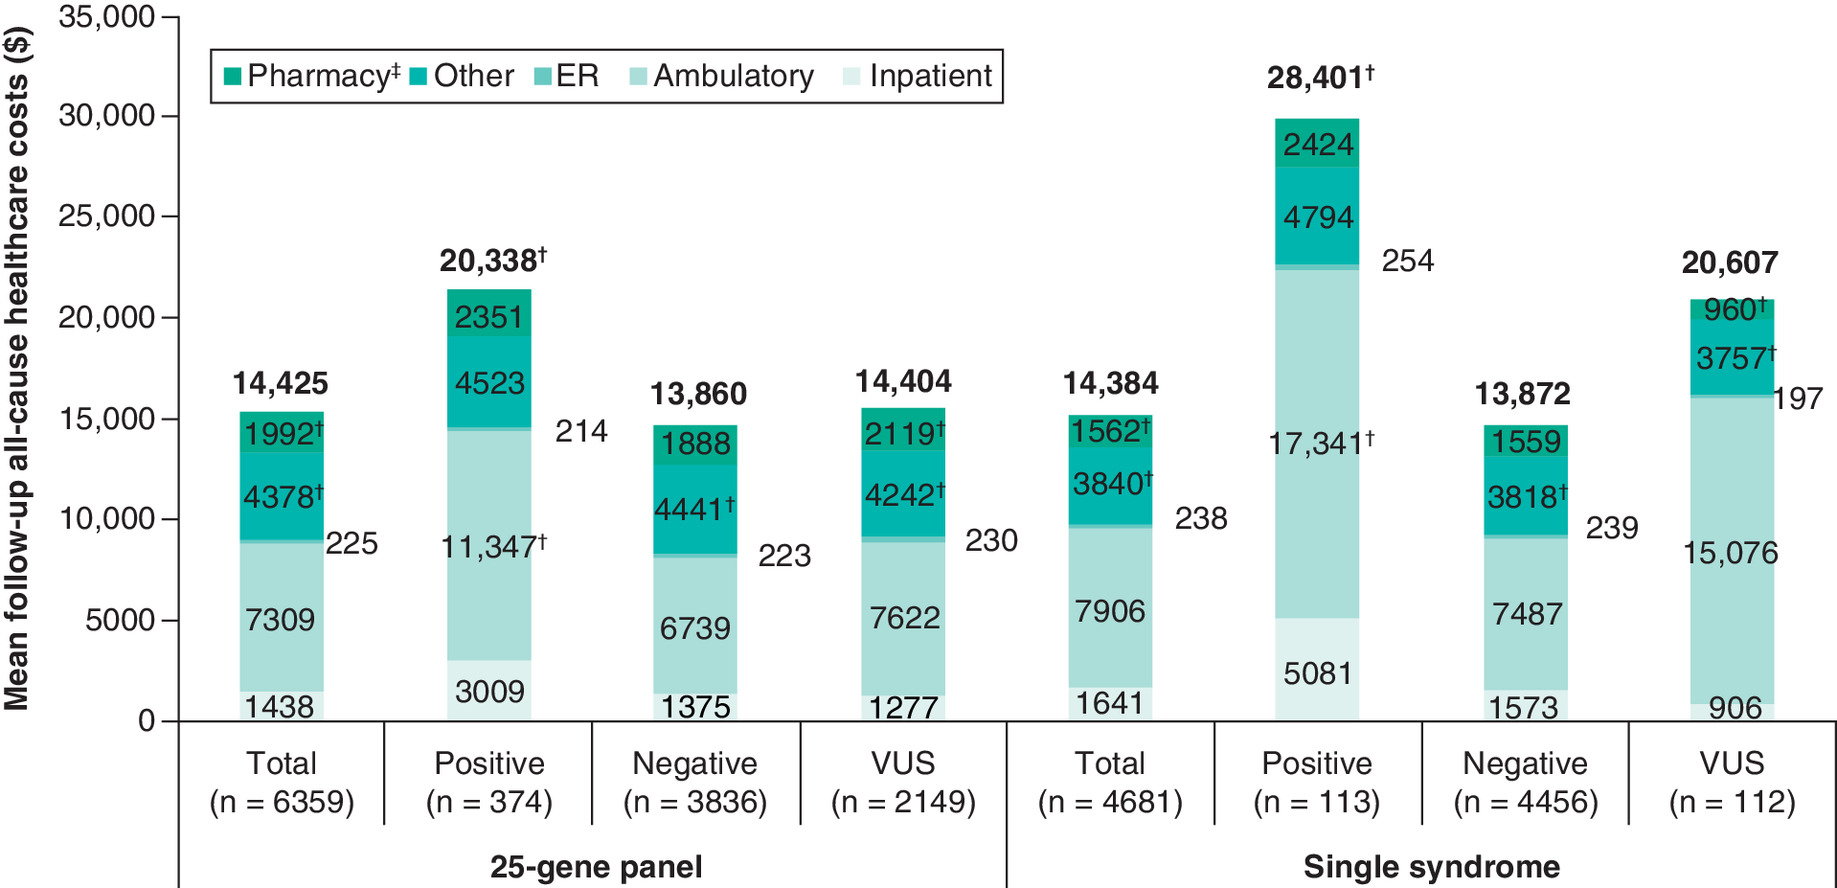
Figure 2. Mean unadjusted all-cause healthcare costs in the 12-month follow-up period.
†p < 0.05 in comparison of 25-gene panel versus single syndrome test.
‡Only among patients with pharmacy benefit for the entire study period.
ER: Emergency room; VUS: Variant of unknown significance.
Mean annual follow-up healthcare costs were the highest among patients who tested positive, regardless of test type (Figure 2). Unadjusted total and medical costs were significantly higher among patients who tested positive in the SS test compared with those in the panel group (overall costs: US$28,401 vs US$20,338, p = 0.032; medical costs: US$27,469 vs US$19,092; p = 0.023). Ambulatory costs accounted for more than half of the total healthcare costs and were higher in positive patients in the SS group compared with those in the panel group (US$17,341 vs US$11,347; p = 0.040). After adjustment for confounding variables, costs were not significantly different between the test groups (adjusted medical costs: US$13,546 SS vs US$13,557 panel, p = 0.978; adjusted ambulatory costs: US$8064 SS vs US$7765 panel; p = 0.338).
Mean annual risk-reduction/early detection-specific healthcare costs were lower among the panel group compared with the SS group in the overall study population in unadjusted analyses (US$763 vs $1044; p = 0.028; Figure 3). Costs were higher among positive patients in the SS group compared with the panel group (US$6052 vs $2267; p = 0.014) due to significantly higher costs for breast cancer surgical procedures (US$4362 vs US$1453; p = 0.041; data not shown). While costs for imaging were similar among both groups (Figure 3), costs for breast cancer-specific imaging were significantly lower among the panel group compared with the SS group (US$320 vs US$464; p = 0.048). Among patients who tested negative, those in the SS group had higher overall mean annual risk-reduction/early detection-specific costs compared with the panel group (US$926 vs US$642; p = 0.014; Figure 3). This was driven by significantly higher costs for breast cancer-specific surgical procedures within the SS group (US$348 vs US$188; p = 0.022). Patients who tested VUS had similar mean risk-reduction/early detection-specific costs regardless of test type (US$718 panel and US$679 SS; p = 0.890).

Figure 3. Mean unadjusted preventative care costs by test result over the 12-month follow-up period.
†p < 0.05 in comparison of 25-gene panel versus single syndrome test.
‡Only among patients with pharmacy benefit for the entire study period.
§For patients where multiple procedures (e.g., surgery and biopsy) were received during the same inpatient stay (n = 3), the total inpatient cost is included in each category.
VUS: Variant of unknown significance.
Among VUS patients in the panel and SS groups, mean all-cause costs were US$14,404 versus US$20,607 (p = 0.361), respectively. When comparing annual costs across test results, follow-up mean estimates for total healthcare costs were similar for patients who tested VUS or negative within the panel group (US$14,404 [SD US$34,920] vs US$13,860 [SD US$26,113]; no statistical testing), and costs were higher among patients who tested VUS compared with negative in the SS group (US$20,607 [SD US$71,191] vs US$13,872 [SD US$26,577]; no statistical testing). Follow-up mean total costs were higher among patients who tested positive in both the panel and SS groups compared with those who tested negative (p < 0.001 for both groups). In the panel group, patients who tested positive had significantly higher total costs (p = 0.002), ambulatory costs (p = 0.020), inpatient costs (p = 0.041) and other medical costs (p = 0.013) than patients who tested VUS. There were no significant differences in follow-up healthcare costs among those who tested VUS and those who tested negative in either the panel or SS groups. Patients who tested positive had the highest risk-reduction/early detection-specific costs regardless of test type.
Discussion
This was a retrospective claims study that examined healthcare utilization and costs in patients who underwent panel versus SS testing for HBOC. This study showed that overall healthcare utilization and costs were not different for patients who had panel or SS testing. Regardless of test type, positive patients had the highest mean estimates for risk-reduction/early detection-specific utilization and costs; however, both utilization and costs were higher in the SS group compared with the panel group. Specifically, utilization of risk-reducing surgery and CA-125 monitoring was significantly higher among patients who had SS testing. This likely reflects the relative penetrance of the variants detected as part of SS and panel testing. Of the patients who tested positive by panel, 32.4% (n = 121) had a pathogenic variant in a gene that met NCCN guidelines for risk-reducing surgery (BRCA1, BRCA2, BRIP1, MSH2, MLH1, MSH6, PMS2, RAD51C, RAD51D) [7]. In comparison, all positive patients in the SS group had pathogenic variants in BRCA1 and BRCA2 genes and met guidelines for risk-reducing surgery and risk-reducing therapy, such as tamoxifen [7]. The differences in utilization and corresponding risk-reduction/early detection-specific costs between the panel and SS groups were consistent with gene-specific medical management recommendations.
Previous studies of multigene panel testing have shown higher VUS rates compared with rates for SS testing [2,28,34–36]. This is consistent with findings in the current study where the VUS rate was 33.8% in the panel group compared with 2.4% in the SS group. Despite the increased VUS rate, there were no differences in overall or risk-reduction/early detection-specific healthcare utilization among patients who tested VUS in the panel versus SS group. Of note, mean estimates for utilization and costs were similar between patients who tested VUS versus negative within the panel group. Although overtreatment of patients with VUS results is commonly cited as a criticism of panel testing [20–23], the data presented here do not substantiate such concern. Our data suggest that patients in the panel group who received VUS had no evidence of overtreatment, which is consistent with professional society guidelines. This is also consistent with a previous study among multigene-tested patients newly diagnosed with breast cancer that found the rates of contralateral risk-reducing mastectomy were not elevated among patients who tested VUS compared with those who tested negative (p = 0.37) [37].
In contrast to what was observed in the panel group, patients with a VUS result from a SS test had higher mean estimates for overall healthcare costs compared with those who tested negative; however, these differences were not significant. One possible explanation for the difference between panel and SS groups may be the unique medical management tool for panel test recipients that provided detailed clinical guidance (according to societal guidelines) based on test result and family history, likely increasing compliance with professional guidelines. Although patients with evidence of a personal history of cancer were excluded from the study, it is possible that the SS group may have been higher risk, with increased rates of family cancer history. In this case, additional intervention may have been based on increased familial risk. The rates of family cancer history for the SS and panel testing groups could not be directly assessed as family history codes were not specific enough to be informative; however, Mersch et al. have demonstrated that individuals who received SS testing may be higher risk than those who received panel testing [38].
In addition, risk-reduction/early detection-specific utilization and overall healthcare costs were higher among negative patients in the SS group compared with the panel group. The high percentage of risk-reduction intervention among negative patients was largely due to receipt of at least one imaging procedure during follow-up. Physicians of patients who meet criteria for hereditary testing may encourage imaging regardless of the genetic test result. Given this, it is possible that a more comprehensive test result provided by panel testing may reassure physicians and patients that a negative test result is a true negative. The SS test only identifies variants in the BRCA1 and BRCA2 genes, which may leave patients and physicians to consider surveillance screening as a precaution in high-risk patients based upon strong family history.
Limitations
Results of this study should be interpreted in light of the inherent limitations associated with claims data analyses. Claims data are subject to coding errors and may be incomplete. There may be differences between the underlying risk (i.e., severity of family cancer history) in the panel and SS groups; however, we could not adjust for family cancer history because the available codes lacked the specificity needed. By restricting our analysis to unaffected individuals, bias between the cohorts should be minimized as a family cancer history would be required to meet HBOC testing criteria regardless of whether SS or panel testing was ordered. Healthcare received within a clinical trial may not generate claims for some or all services. Statistical tests were not adjusted for multiple comparisons; therefore, the probability of replicating all statistically significant differences observed in this study is decreased. Due to coding variations, the receipt of some risk-reduction/early detection-specific interventions may not have been captured. Evaluation of drugs available through pharmacy benefits was limited to the 38% who had pharmacy benefits through their health plan. Healthcare costs were adjusted for inflation over the study period using the CPI, which may have overstated the rate of medical price inflation [39]. However, all groups were adjusted using CPI, so comparisons between groups were not affected. Lastly, the study population was from a managed care population and conclusions may not be generalizable to other populations, including the uninsured and those outside the United States. Given the limitations listed above, future research that adjusts for potential confounders may be useful.
Conclusion
Patients who received multigene panel testing had similar all-cause and lower risk-reduction/early detection-specific healthcare utilization and costs compared with patients who received SS HBOC testing, despite a substantially higher VUS rate among panel test recipients. Patients with a VUS result had similar all-cause and risk-reduction/early detection-specific utilization and costs regardless of the test performed. This study found no evidence that VUS detected by multigene panel testing contributed to unnecessary burden to the healthcare system.
•
Testing for variants in multiple genes can increase the likelihood of finding variants of uncertain significance (VUS), which some argue may increase unwarranted surgical or screening interventions.
•
To test this hypothesis, this study compared all-cause and risk-reduction/early detection-specific healthcare utilization and costs among patients in a managed care setting who underwent genetic testing for hereditary breast and ovarian cancer who received either a single syndrome (SS) test for BRCA1 and BRCA2 genes or a 25-gene panel test (panel).
•
This study found no significant differences in overall or risk-reduction/early detection-specific healthcare utilization among patients who tested VUS in the panel versus SS test groups.
•
Additionally, there were no significant differences in follow-up all-cause healthcare utilization among patients who tested negative compared with patients who tested VUS in either the panel or SS test groups.
•
This study also found no significant differences in mean follow-up all-cause costs among VUS patients in the panel versus SS test group (US$14,404 vs US$20,607; p = 0.361).
•
Additionally, there were no significant differences in healthcare costs among those who tested VUS and those who tested negative in either the panel or SS test groups.
•
There were also no significant differences in mean follow-up risk-reduction/early detection-specific costs between VUS patients in the panel versus SS test groups (US$718 vs US$679; p = 0.890).
•
This study found no evidence that VUS detected by multigene panel testing contributed to an unnecessary burden to the healthcare system.
Author contributions
S Dacosta Byfield participated in study concept and design, acquisition of data, analysis and interpretation of data, and drafting and critical review of the manuscript. H Wei was responsible for analysis and interpretation of data, and critical review of the manuscript. M DuCharme participated in analysis and interpretation of data and drafting and critical review of the manuscript. JM Lancaster was responsible for acquisition of data, analysis and interpretation of data, and drafting and critical review of the manuscript.
Financial & competing interests disclosure
This work was funded by Myriad Genetics Laboratories, Inc. S Dacosta Byfield was an employee or Optum at the time the study was completed and is now employed by UnitedHealth Group. M DuCharme is an employee of Optum. JM Lancaster is an employee of Myriad Genetics Laboratories, Inc. H Wei was an employee of Myriad Genetics Laboratories, Inc. at the time this study was completed. The authors have no other relevant affiliations or financial involvement with any organization or entity with a financial interest in or financial conflict with the subject matter or materials discussed in the manuscript apart from those disclosed.
Deja Scott-Shemon, an employee of Optum, provided medical writing services, which was funded by Myriad Genetics Laboratories, Inc.
Open access
This work is licensed under the Attribution-NonCommercial-NoDerivatives 4.0 Unported License. To view a copy of this license, visit http://creativecommons.org/licenses/by-nc-nd/4.0/
References
1.
Tung N, Battelli C, Allen B et al. Frequency of mutations in individuals with breast cancer referred for BRCA1 and BRCA2 testing using next-generation sequencing with a 25-gene panel. Cancer 121(1), 25–33 (2015).
2.
Tung N, Lin NU, Kidd J et al. Frequency of germline mutations in 25 cancer susceptibility genes in a sequential series of patients with breast cancer. J. Clin. Oncol. 34(13), 1460–1468 (2016).
3.
Maxwell KN, Wubbenhorst B, D'Andrea K et al. Prevalence of mutations in a panel of breast cancer susceptibility genes in BRCA1/2-negative patients with early-onset breast cancer. Genet. Med. 17(8), 630–638 (2015).
4.
Desmond A, Kurian AW, Gabree M et al. Clinical actionability of multigene panel testing for hereditary breast and ovarian cancer risk assessment. JAMA Oncol. 1(7), 943–951 (2015).
5.
Kurian AW, Hare EE, Mills MA et al. Clinical evaluation of a multiple-gene sequencing panel for hereditary cancer risk assessment. J. Clin. Oncol. 32(19), 2001–2009 (2014).
6.
Kraus C, Hoyer J, Vasileiou G et al. Gene panel sequencing in familial breast/ovarian cancer patients identifies multiple novel mutations also in genes others than BRCA1/2. Int. J. Cancer 140(1), 95–102 (2017).
7.
National Comprehensive Cancer Network. Genetic/familial risk assessment: breast and ovarian, version 1.2018 (2018). www.nccn.org
8.
Tung N, Domchek SM, Stadler Z et al. Counselling framework for moderate-penetrance cancer-susceptibility mutations. Nat. Rev. Clin. Oncol. 13(9), 581–588 (2016).
9.
Saslow D, Boetes C, Burke W et al. American Cancer Society guidelines for breast screening with MRI as an adjunct to mammography. CA Cancer J. Clin. 57(2), 75–89 (2007).
10.
Daly MB, Pilarski R, Axilbund JE et al. Genetic/familial high-risk assessment: breast and ovarian, version 2.2015. J. Natl Compr. Canc. Netw. 14(2), 153–162 (2016).
11.
Robson ME, Bradbury AR, Arun B et al. American Society of Clinical Oncology policy statement update: genetic and genomic testing for cancer susceptibility. J. Clin. Oncol. 33(31), 3660–2667 (2015).
12.
Mainiero MB, Lourenco A, Mahoney MC et al. ACR appropriateness criteria breast cancer screening. J. Am. Coll. Radiol. 13(11S), R45–R49 (2016).
13.
Stadler ZK, Schrader KA, Vijai J et al. Cancer genomics and inherited risk. J. Clin. Oncol. 32(7), 687–698 (2014).
14.
Domchek SM, Bradbury A, Garber JE et al. Multiplex genetic testing for cancer susceptibility: out on the high wire without a net? J. Clin. Oncol. 31(10), 1267–1270 (2013).
15.
Beitsch PD, Whitworth PW, Hughes K et al. Underdiagnosis of hereditary breast cancer: are genetic testing guidelines a tool or an obstacle? J. Clin. Oncol. 37(6), 453–460 (2019).
16.
Fecteau H, Vogel KJ, Hanson K et al. The evolution of cancer risk assessment in the era of next generation sequencing. J. Genet. Couns. 23(4), 633–639 (2014).
17.
Grissom AA, Friend PJ. Multigene panel testing for hereditary cancer risk. J. Adv. Pract. Oncol. 7(4), 394–407 (2016).
18.
Easton DF, Pharoah PD, Antoniou AC et al. Gene-panel sequencing and the prediction of breast-cancer risk. N. Engl. J. Med. 372(23), 2243–2257 (2015).
19.
Thompson ER, Rowley SM, Li N et al. Panel testing for familial breast cancer: calibrating the tension between research and clinical care. J. Clin. Oncol. 34(13), 1455–1459 (2016).
20.
Kurian AW, Li Y, Hamilton AS et al. Gaps in incorporating germline genetic testing into treatment decision-making for early-stage breast cancer. J. Clin. Oncol. 35(20), 2232–2239 (2017).
21.
Welsh JL, Hoskin TL, Day CN et al. Clinical decision-making in patients with variant of uncertain significance in BRCA1 or BRCA2 genes. Ann. Surg. Oncol. 24(10), 3067–3072 (2017).
22.
Yu PP, Vose JM, Hayes DF. Genetic cancer susceptibility testing: increased technology, increased complexity. J. Clin. Oncol. 33(31), 3533–3534 (2015).
23.
Plon SE, Eccles DM, Easton D et al. Sequence variant classification and reporting: recommendations for improving the interpretation of cancer susceptibility genetic test results. Hum. Mutat. 29(11), 1282–1291 (2018).
24.
O'Leary E, Iacoboni D, Holle J et al. Expanded gene panel use for women with breast cancer: identification and intervention beyond breast cancer risk. Ann. Surg. Oncol. 24(10), 3060–3066 (2017).
25.
Kapoor NS, Curcio LD, Blakemore CA et al. Multigene panel testing detects equal rates of pathogenic BRCA1/2 mutations and has a higher diagnostic yield compared to limited BRCA1/2 analysis alone in patients at risk for hereditary breast cancer. Ann. Surg. Oncol. 22(10), 3282–3288 (2015).
26.
Balmana J, Digiovanni L, Gaddam P et al. Conflicting interpretation of genetic variants and cancer risk by commercial laboratories as assessed by the prospective registry of multiplex testing. J. Clin. Oncol. 34(34), 4071–4078 (2016).
27.
Richards S, Aziz N, Bale S et al. Standards and guidelines for the interpretation of sequence variants: a joint consensus recommendation of the American College of Medical Genetics and Genomics and the Association for Molecular Pathology. Genet. Med. 17(5), 405–424 (2015).
28.
Eggington JM, Bowles KR, Moyes K et al. A comprehensive laboratory-based program for classification of variants of uncertain significance in hereditary cancer genes. Clin. Genet. 86(3), 229–237 (2014).
29.
Esterling L, Wijayatunge R, Brown K et al. Impact of a cancer gene variant reclassification program over a 20-year period. JCO Precis Oncol. 4, 944–954 (2020).
30.
Quan H, Li B, Couris CM et al. Updating and validating the Charlson comorbidity index and score for risk adjustment in hospital discharge abstracts using data from 6 countries. Am. J. Epidemiol. 173(6), 676–682 (2011).
31.
Bayliss EA, Ellis JL, Shoup JA et al. Association of patient-centered outcomes with patient-reported and ICD-9-based morbidity measures. Ann. Fam. Med. 10(2), 126–133 (2012).
32.
Agency for Healthcare Research and Quality. Clinical Classification Software (CCS) for ICD-9-CM (2020). www.hcup-us.ahrq.gov/toolssoftware/ccs/ccs.jsp
33.
Agency for HealthcareResearch and Quality. Comorbidities definedby Healthcare Cost and Utilization Project (HCUP) comorbidity software (2015). www.hcup-us.ahrq.gov/toolssoftware/comorbidity/comorbidity.jsp
34.
Frey MK, Kim SH, Bassett RY et al. Rescreening for genetic mutations using multi-gene panel testing in patients who previously underwent non-informative genetic screening. Gynecol. Oncol. 139(2), 211–215 (2015).
35.
Lincoln SE, Kobayashi Y, Anderson MJ et al. A systematic comparison of traditional and multigene panel testing for hereditary breast and ovarian cancer genes in more than 1000 patients. J. Mol. Diagn. 17(5), 533–544 (2015).
36.
Rosenthal ET, Bernhisel R, Brown K et al. Clinical testing with a panel of 25 genes associated with increased cancer risk results in a significant increase in clinically significant findings across a broad range of cancer histories. Cancer Genet. 218-219, 58–68 (2017).
37.
Pederson HJ, Gopalakrishnan D, Noss R et al. Impact of multigene panel testing on surgical decision making in breast cancer patients. J. Am. Coll. Surg. 226(4), 560–565 (2018).
38.
Mersch J, Brown N, Pirzadeh-Miller S et al. Prevalence of variant reclassification following hereditary cancer genetic testing. JAMA 320(12), 1266–1274 (2018).
39.
Dunn A, Grosse SD, Zuvekas SH. Adjusting health expenditures for inflation: a review of measures for health services research in the United States. Health Serv. Res. 53(1), 175–196 (2018).
Information & Authors
Information
Published In
Pages: 207 - 217
PubMed: 33491479
Copyright
© 2021 Myriad Genetics Inc. This work is licensed under the Attribution-NonCommercial-NoDerivatives 4.0 Unported License
History
Received: 4 September 2020
Accepted: 30 November 2020
Published online: 25 January 2021
Keywords:
Topics
Authors
Funding Information
Myriad Genetics Laboratories
Metrics & Citations
Metrics
Article Usage
Article usage data only available from February 2023. Historical article usage data, showing the number of article downloads, is available upon request.
Citations
How to Cite
Economic impact of multigene panel testing for hereditary breast and ovarian cancer. (2021) Journal of Comparative Effectiveness Research. DOI: 10.2217/cer-2020-0192
Export citation
Select the citation format you wish to export for this article or chapter.