The prognostic impact of renal function decline during hospitalization for myocardial infarction
Publication: Journal of Comparative Effectiveness Research
Abstract
Aim: We analyzed the mortality risk of myocardial infarction (MI) patients according to renal function, observed during hospitalization. Materials & methods: Patients hospitalized for MI between 2006 and 2018 were followed (n = 5659). We divided the sample into four groups by estimated glomerular filtration (eGFR) [ml/min]: normal functions (lowest eGFR during hospitalization >60); transiently moderate insufficiency (lowest eGFR >30 and ≤60, highest >60); permanently moderate insufficiency (highest eGFR >30 and ≤60); severe insufficiency (highest and lowest eGFR ≤30). Results: Permanently moderate renal insufficiency indicates increased 5-years all-cause mortality (hazard risk ratio: 2.27 [95% CIs: 1.87–2.75], p < 0.0001), but a similar risk was found in patients with the only transient decline of renal functions (hazard risk ratio: 2.08 [95% CIs: 1.70–2.55], p < 0.0001). Both moderate insufficiency subgroups (transient/permanent) did not statistically differ regarding mortality risk. Conclusion: Even just fluctuation of eGFR toward moderate insufficiency during hospitalization represents an important prognostic indicator in MI patients.
Coronary artery disease and renal insufficiency are often present in the same patient concomitantly and one of these conditions affects the other. It is well known that the majority of end-stage renal disease patients die from a cardiovascular complication (rather than from uremia) and vice versa, impaired glomerular filtration represents one of the most important factors of prognosis in patients with any form of cardiovascular disease [1–3]. The pathophysiology of interaction between cardiovascular system and kidney is complex, involving neurohormones (namely renin–angiotensin system, natriuretic peptides, etc.), inflammatory processes, oxidative stress, metabolic disturbances as well as accelerated atherosclerosis [4]. A well-known clinical manifestation of this interaction is cardiorenal syndrome [5], associated with heart failure and a substantial increase in mortality risk [6,7]. However, adverse heart–kidneys interaction may also occur subclinically.
A transient decrease in glomerular filtration is a very common phenomenon in hospitalized patients. In clinical practice, it is usually interpreted as the prerenal mechanism (relative dehydration/redistribution of blood flow), mild drug-induced kidney injury (e.g., by furosemide or some antihypertensive drugs). In the specific situation of postmyocardial infarction (MI) patients, the transient decrease in glomerular filtration is frequently interpreted as a side effect of iodinated contrast agent, used for coronary angiography. The corresponding creatinine increase accounts for tens of percent, and it usually does not attract much clinical attention. On the other hand, acute kidney injury, moderate renal insufficiency, or just unfavorable trajectory of creatinine during hospitalization is a very strong indicator of poor prognosis in various clinical situations (irrespective of primary diagnosis or the course of hospitalization) [8–12]; for that reasons is serum creatinine or glomerular filtration rate included in several scoring systems (e.g., GRACE, APACHE-II, MELD score, etc.). However, it is not entirely clear, whether we should use the highest or the lowest value of creatinine (obtained during hospitalization) for this scoring.
In the present study, we aimed to assess the long-term mortality risk of patients hospitalized for MI and showing fluctuations of glomerular filtration toward moderate renal insufficiency. We raised the question, whether the lowest glomerular filtration value, observed during hospitalization should be used for mortality risk assessment or other scoring purposes, rather than the highest one.
Materials & methods
All procedures performed in this study were following the Good Clinical Practice principles and ethical standards formulated in the 1964 Declaration of Helsinki and its later amendments. The study protocols were approved by the Ethics Committees of the University Hospital in Pilsen. The data were stored and evaluated under the provisions of the Czech Data Protection Act. All patients evaluated in the analysis signed a written informed consent when they were admitted to the hospital, in other words, at baseline visit of this follow-up.
Design & study population
The analysis represents a prospective cohort study of mortality risk in patients after MI. Patients hospitalized between 1 January 2006 and 31 December 2018 for any form of the acute coronary syndrome (Type I MI) were identified from the hospital records, whereas this main criterion was based on final primary diagnosis, formally stated in the discharge summary. All included subjects had to undergo coronary angiography in connection with qualifying hospitalization and were treated according to the usual standard, in other words, either with coronary angioplasty, coronary bypass graft or conservative approach, followed by standard secondary preventive measures (dual antiplatelet treatment, statins, beta-blockers, renin–angiotensin system blockers, etc. – all based on clinical judgment of responsive physician). From this initial pool (6458 subjects) we excluded those, who deceased during qualifying hospitalization (n = 80), patients older than 85 years the day they were admitted to the hospital (n = 203) and those who have available only two or fewer creatinine estimations during hospitalization (n = 516, see the next paragraph).
Data collection & its management
Vital status of patients was registered up to 31 May 2019, using the National Registry of the Institute of Health Information and Statistics of the Czech Ministry of Health. Death certificates and available documentation in hospital information systems were reviewed and used to specify the cause of death. All other data are based on information contained in the hospital information system (i.e., no formal examination was done in conjunction with this study). The hospital is involved in the system of regular quality control of all procedures (instruments, laboratory estimations, etc.) and standard commercial kits and analytical platforms were used for laboratory estimates. Namely, for creatinine estimation was used commercial kit based on Jaffe methods and COBAS 8000 analytical platform (ROCHE Diagnostics, Basel, Switzerland).
As outcomes, we used all-cause or cardiovascular mortality during the first 5 years of follow-up. Cardiovascular cause of death was based on information from hospital records (discharge letter, inspection list, etc.) or if not available (for those dying at home) stated as the primary cause of death (ICD-10 codes were used) in death certificates. Moreover, we also calculated the risk of death during 1st year, between day 31 and day 1856 (i.e., 5-years mortality risk in those, who survived at least 30 days) and death between day 366 and day 2191 (i.e., 5-years mortality in those, who survived at least one year after MI).
As exposure we used renal functions ascertained during hospitalization; being initially hospitalized on the intensive care unit, repeated (daily) creatinine estimation is a regular part of medical care in these patients. Using individual creatinine value we calculate estimated glomerular filtration (eGFR) by chronic kidney disease epidemiology collaboration (CKD-EPI) formula [13] (only those patients having at least three measurements were analyzed, in total, we have available 24,436 individual values of eGFR). The sample was divided into four subgroups as follows: Group A, normal or only mild decrease of renal function- all individual eGFR values >60 ml/min; Group B, transiently moderate renal insufficiency (fluctuation between a normal function or moderate decrease of eGFR) – the lowest individual eGFR >30 and ≤60 but the highest >60 ml/min (the mutual sequence of high and low values was not taken into account); Group C, a permanently moderate renal insufficiency – both, the highest and lowest eGRF >30 and ≤60 ml/min; Group D, severe renal insufficiency – any individual eGFR ≤30 ml/min (both cut-off points, 60 and 30 ml/min were chosen with respect The National Kidney Foundation’s Kidney Disease Outcomes Quality Initiative [14] and referred to Grade 3 and Grade 4 or 5 renal insufficiency, respectively). From other covariates, coronary revascularization (coronary angioplasty or coronary bypass graft) means only if these procedures were realized in connection with the qualifying coronary event. Information about ST-elevation MI (STEMI) comes from coronary angiography report, where a declaration of this fact is mandatory (as the statement of indication). Information about ‘history of hypertension’ is based on this diagnosis, stated in the discharge summary, while ‘diabetes mellitus’ was found to be present, if any of fasting glucose level during hospitalization was ≥7 mmol/l, any nonfasting ≥11.1 mmol/l, treatment with antidiabetics recommended or this diagnosis formally stated in the discharge summary. ‘Overt heart failure’ was defined as ejection fraction ≤40%, BNP during hospitalization ≥300 ng/l (Abbott Laboratories, IL, USA) or NT-proBNP ≥900 ng/l (ROCHE), or if heart failure was formally stated in discharge summary again. Troponin ≥100-times ULN category is based on peak concentration during hospitalization and was defined as troponin I >0.4 ng/ml (AccuTnI, Beckman-Coulter, CA USA) or hs-troponin T >140 ng/l (ROCHE).
Statistical analyses were performed using STATISTICA 8 (StatSoft Inc, OK, USA) and STATA 8 (STATA Corp LP, TX, USA). Conventional descriptive methods were applied, in other words, the mean and standard deviation for continuous variables or frequency for categorical ones. Cox proportional hazard model was performed to identify the relationship between exposure (categorized renal functions) and defined outcomes. Censored data were used for the final analysis. Power calculations revealed that our population of patients was sufficiently large to estimate the expected incidence of all four defined outcomes with a 5% relative precision level. Statistical significance was considered present at the p-value of 0.05.
Results
Baseline cross-sectional data & outcomes
In total 5659 initially stabilized post-MI patients were followed in this study. Their baseline characteristics are listed in Table 1. During the median 1913 days (interquartile range: 841–2920) of follow-up, 1456 patients (25.7% of the sample) deceased and 1181 (20.9%) of these fatal events were considered as cardiovascular. Standardized 1-years incidences of all-cause and cardiovascular death were 7.1 and 6.5%, respectively, while 5-years incidences of both outcomes 17.3 and 14.3%, respectively. Moreover, 5-years incidences of all-cause and cardiovascular death in a subsample of patients who survived at least 30 days (n = 5557) were 15.8 and 12.8%, respectively, while in those who survived at least 1 year (n = 5258) 11.0 and 8.4%, respectively.
| Variables | Full sample | Categories of renal function [ml/min]¶ | p1 (B vs A) | p2 (C vs A) | p3 (C vs B) | |||
|---|---|---|---|---|---|---|---|---|
| all eGFR >60 (A) | eGFR transiently >30 & ≤60 (B) | all eGFR >30 & ≤60 (C) | any eGFR ≤30 (D) | |||||
| n | 5659 | 3505 | 743 | 1060 | 351 | – | – | – |
| Age (years) | 64.2 (11.4) | 59.9 (10.6) | 67.8 (9.1) | 73.3 (8.0) | 72.8 (9.0) | <0.0001 | <0.0001 | <0.0001 |
| Gender (% of males) | 71.5 | 80.8 | 63.0 | 54.1 | 49.0 | <0.0001 | <0.0001 | <0.0001 |
| Hospitalization ≥10 days (%) | 11.5 | 5.5 | 29.1 | 10.9 | 36.8 | <0.0001 | <0.0001 | <0.0001 |
| Myocardial infarction with ST-elevation | 33.8 | 38.2 | 30.7 | 25.3 | 21.4 | 0.008 | <0.0001 | 0.076 |
| Percutaneous coronary angioplasty† (%) | 78.6 | 81.7 | 75.2 | 74.7 | 65.8 | <0.0001 | 0.026 | 0.697 |
| Coronary artery bypass graft† (%) | 7.2 | 7.4 | 6.9 | 5.3 | 8.6 | 0.042 | <0.0001 | 0.3 |
| History of hypertension (%) | 68.4 | 62.1 | 72.5 | 81.1 | 84.6 | 0.026 | <0.0001 | 0.004 |
| LDL-cholesterol (mmol/l) | 3.26 (1.03) | 3.37 (1.02) | 3.12 (0.97) | 3.08 (1.02) | 2.90 (1.17) | <0.0001 | 0.001 | 0.708 |
| LDL ≥1.8 mmol/l (%) | 93.3 | 85.5 | 93.2 | 90.6 | 83.6 | 0.587 | 0.001 | 0.471 |
| Fasting glycemia (mmol/l) | 8.16 (3.47) | 7.52 (2.77) | 8.68 (3.79) | 8.70 (3.77) | 10.68 (5.01) | <0.0001 | <0.0001 | 0.786 |
| Diabetes mellitus‡ (%) | 58.4 | 53.3 | 67.2 | 62.9 | 77.8 | <0.0001 | 0.029 | 0.052 |
| Overt heart failure¶ (%) | 34.4 | 24.0 | 49.8 | 45.7 | 71.2 | <0.0001 | <0.0001 | <0.0001 |
| Peak troponin ≥100-times ULN | 62.8 | 62.1 | 72.5 | 61.3 | 74.1 | <0.0001 | 0.03 | <0.0001 |
| Atrial fibrillation (%) | 7.9 | 19.1 | 16.5 | 25.6 | <0.0001 | 0.001 | <0.0001 | |
| Minimal eGFR§ (ml/min) | 65.8 (21.9) | 79.5 (13.2) | 51.8 (6.6) | 45.6 (8.2) | 19.7 (7.5) | <0.0001 | <0.0001 | <0.0001 |
| Maximal eGFR§ (ml/min) | 74.1 (21.4) | 85.9 (13.6) | 72.3 (10.7) | 49.9 (7.3) | 33.8 (18.9) | <0.0001 | <0.0001 | <0.0001 |
†
During qualifying hospitalization or indicated due to current coronary event.
‡
Highest fasting glucose ≥7 or nonfasting ≥11.1 mmol/l, treatment with antidiabetics or formally stated diagnosis of diabetes in discharge summary.
§
By CKD-EPI standard (lowest or highest value of creatinine during hospitalization was used).
¶
See Methods for the exact definition.
p-values adjusted for age and gender.
CKD-EPI: Chronic Kidney Disease Epidemiology Collaboration; eGFR: Estimated glomerular filtration; ULN: An upper limit of normal.
Renal function categories & mortality risk
The survival curves according to 4 defined categories of renal function are shown in Figure 1. As can be expected, the lowest survival was observed in patients with severe renal insufficiency (group D). However, inferior survival we observed also in a subgroup with permanent (C) or transient (B) moderate renal insufficiency. A nearly similar pattern was observed for either all-cause or cardiovascular mortality.
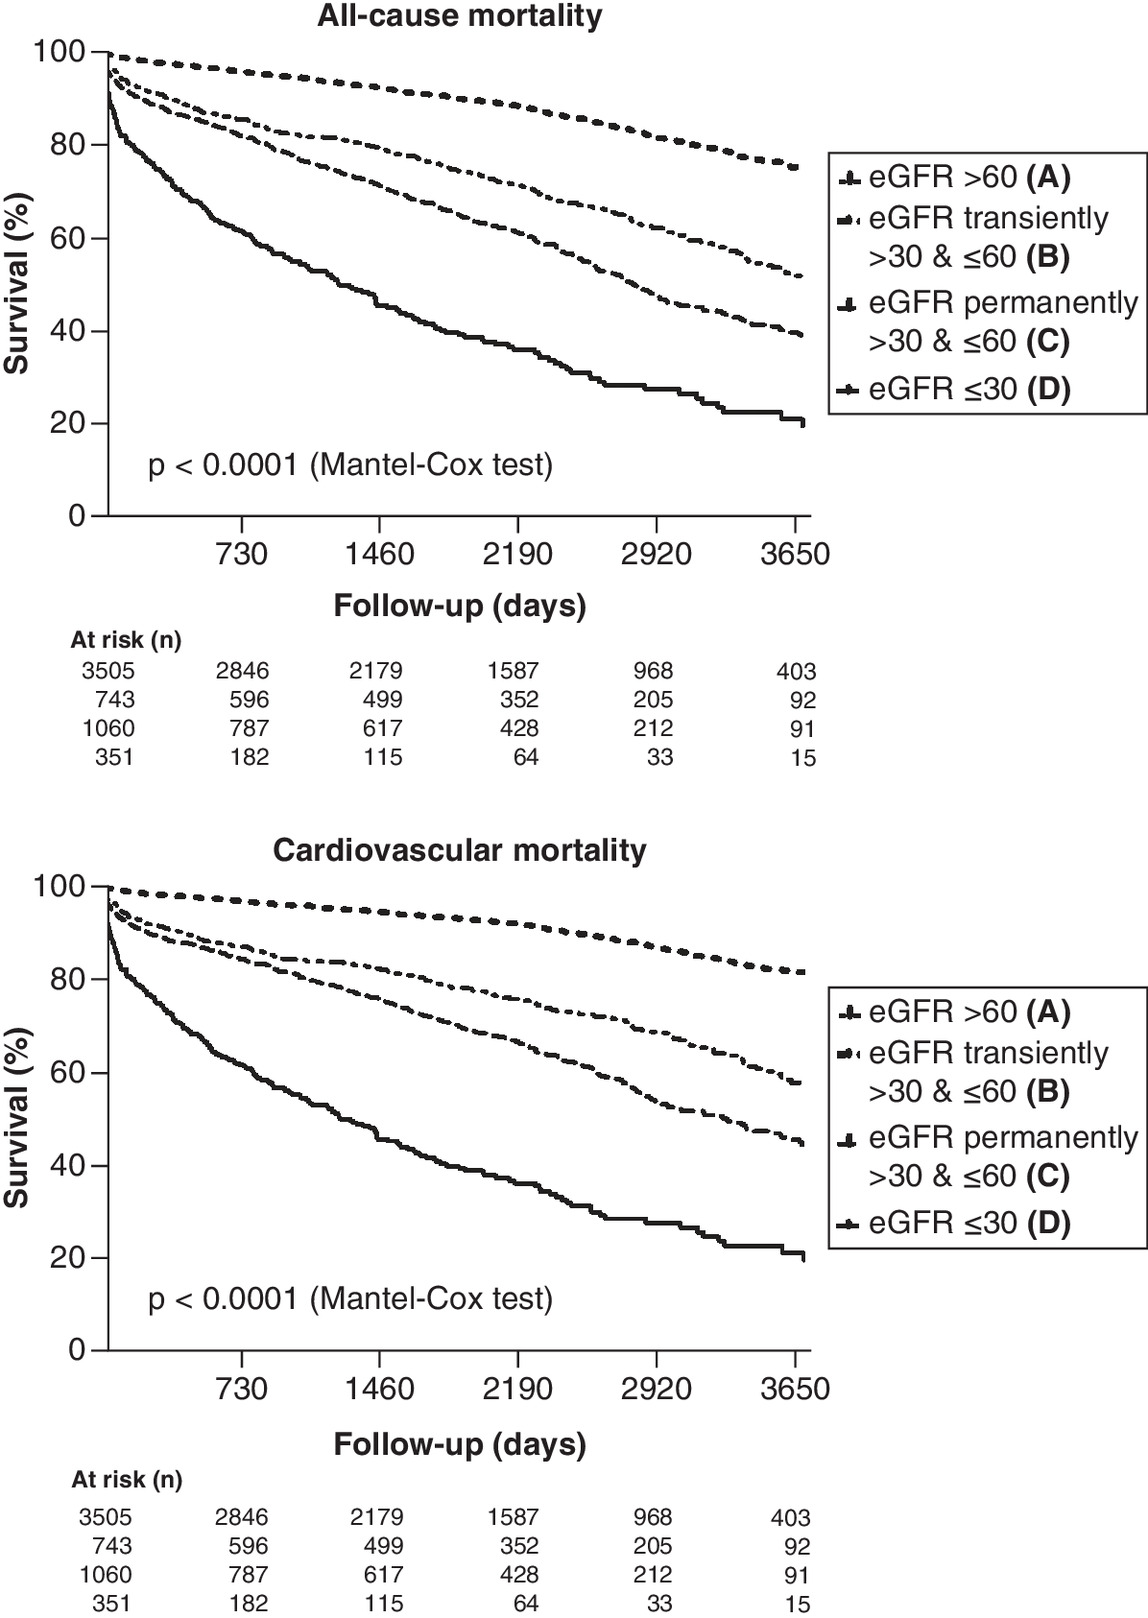
Figure 1. Kaplan–Meier survival curves for renal function categories (see Methods for definitions).
eGFR: Estimated glomerular filtration.
We performed a series of Cox regression analyses to assess the relative risk attributable to the staging of renal functions (Table 2). In the partially adjusted model, patients with severe renal insufficiency (D group) showed about six-eight-times higher relative risk of 1- or 5-years all-cause or cardiovascular mortality (compared with patients with sustained eGFR >60 ml/min). Patients with the lowest eGFR ≤60 ml/min showed more than three-times higher risk of 1-year mortality (both, all-cause or cardiovascular), while more than twofold higher risk of 5-years mortality, and it did not matter whether the decline was transient (group B) or permanent (group C). Moreover, we also compared one against the other group with permanent and with only transient renal insufficiency (C vs B group)- the mortality risk differences were only marginal.
| Renal function catagories | All-cause | Cardiovascular | ||
|---|---|---|---|---|
| HRR (95% CI) | p-value | HRR (95% CI) | p-value | |
| 1-year mortality risk | ||||
| – eGFR ≥60 ml/min (A) | 1 | – | 1 | – |
| – eGFR transiently >30 and ≤60 ml/min (B) | 2.88 (2.07–4.01) | <0.0001 | 3.07 (2.17–4.36) | <0.0001 |
| – eGFR permanently >30 and ≤60 ml/min (C) | 3.12 (2.27–4.31) | <0.0001 | 3.29 (2.34–4.62) | <0.0001 |
| – eGFR <30 ml/min (D) | 7.56 (5.40–10.59) | <0.0001 | 7.96 (5.56–11.38) | <0.0001 |
| – eGFR transiently >30 and ≤60 ml/min (B) | 1 | – | 1 | – |
| – eGFR permanently >30 and ≤60 ml/min (C) | 1.14 (0.85–1.52) | 0.397 | 1.10 (0.81–1.48) | 0.561 |
| 5-years mortality risk | ||||
| – eGFR ≥60 ml/min (A) | 1 | – | 1 | – |
| – eGFR transiently >30 and ≤60 ml/min (B) | 2.08 (1.70–2.55) | <0.0001 | 2.46 (1.95–3.09) | <0.0001 |
| – eGFR permanently >30 and ≤60 ml/min (C) | 2.27 (1.87–2.75) | <0.0001 | 2.47 (1.97–3.04) | <0.0001 |
| – eGFR <30 ml/min (D) | 6.43 (5.17–8.00) | <0.0001 | 7.65 (6.01–9.73) | <0.0001 |
| –eGFR transiently >30 and ≤60 ml/min (B) | 1 | – | 1 | – |
| – eGFR permanently >30 and ≤60 ml/min (C) | 1.14 (0.94–1.39) | 0.173 | 1.09 (0.89–1.35) | 0.397 |
| 5-years mortality risk, if survival at least 30 days† | ||||
| – eGFR ≥60 ml/min (A) | 1 | – | 1 | – |
| – eGFR transiently >30 and ≤60 ml/min (B) | 1.92 (1.55–2.38) | <0.0001 | 2.30 (1.80–2.92) | <0.0001 |
| – eGFR permanently >30 and ≤60 ml/min (C) | 2.08 (1.70–2.54) | <0.0001 | 2.28 (1.81–2.87) | <0.0001 |
| – eGFR <30 ml/min (D) | 6.15 (4.90–7.73) | <0.0001 | 7.38 (5.72–9.52) | <0.0001 |
| – eGFR transiently >30 and ≤60 ml/min (B) | 1 | – | 1 | – |
| –eGFR permanently >30 and ≤60 ml/min (C) | 1.14 (0.93–1.40) | 0.194 | 1.10 (0.97–1.47) | 0.404 |
| 5-years mortality risk, if survival at least 365 days‡ | ||||
| – eGFR ≥60 ml/min (A) | 1 | – | 1 | – |
| – eGFR transiently >30 and ≤60 ml/min (B) | 1.63 (1.29–2.07) | <0.0001 | 1.93 (1.46–2.54) | <0.0001 |
| – eGFR permanently >30 and ≤60 ml/min (C) | 1.76 (1.41–2.20) | <0.0001 | 1.86 (1.43–2.41) | <0.0001 |
| – eGFR <30 ml/min (D) | 5.23 (3.99–6.86) | <0.0001 | 6.52 (4.79–8.87) | <0.0001 |
| – eGFR transiently >30 and ≤60 ml/min (B) | 1 | 1 | ||
| – eGFR permanently >30 and ≤60 ml/min (C) | 1.13 (0.90–1.43) | 0.303 | 1.11 (0.85–1.44) | 0.452 |
Cox proportional hazard model; following covariates were included into the full model: age decade, gender, year of the event, percutaneous coronary angioplasty and coronary artery bypass graft; categories of renal functions referred to those in Figure 2.
†
Fatal event occured between day 31 and day 1856 after beginning (day 0) of qualifying hospitalization for myocardial infarction and those who deceased in first 30 days (n = 103) excluded from analysis.
‡
Fatal event occurred between day 366 and day 2191 and those who deceased in first 365 days (n = 402) excluded from analysis.
eGFR: Estimated glomerular filtration; HRR: Hazard risk ratio.
In the next step, we excluded those who deceased in the first 30 days (Table 2, 3rd row) and then those who deceased in the first year after qualifying MI (Table 2, 4th row). The results were more-than-less similar.
In Table 3 we compared two approaches to assess the presence of moderate renal insufficiency (patients categorized as severe renal insufficiency, in other words, group D, were excluded). Model A represents the approach if the diagnosis of moderate renal insufficiency is based on the lowest individual eGFR (≤60 ml/min, C plus B group, transient plus permanent). Thus defined moderate renal insufficiency was associated with a 70–90% higher risk of 5-years all-cause or cardiovascular death and was found in nearly 35% of subjects. In contrast, moderate renal insufficiency, defined as the highest individual eGFR >30 and ≤60 ml/min (C group, permanent only) was found just in nearly 21% of subjects and had roughly the same predictive potential (Table 3, model B).
| Covariates | Model 1 (B plus C vs A)† | Model 2 (C vs A)† | ||
|---|---|---|---|---|
| HRR (95% CI) | p-value | HRR (95% CI) | p-value | |
| All-cause mortality | ||||
| – Age decade | 1.57 (1.45–1.72) | <0.0001 | 1.58 (1.43–1.75) | <0.0001 |
| – Male gender | 1.18 (0.99–1.40) | 0.068 | 1.13 (0.92–1.38) | 0.247 |
| – Year of hospitalization | 1.00 (0.97–1.04) | 0.804 | 0.98 (0.95–1.02) | 0.338 |
| – Hospitalization ≥10 days | 1.17 (0.95–1.43) | 0.139 | 1.14 (0.87–1.48) | 0.337 |
| – ST-elevation myocardial infarction | 0.93 (0.76–1.14) | 0.494 | 0.96 (0.76–1.20) | 0.694 |
| – Percutaneous coronary intervention | 0.68 (0.55–0.82) | <0.0001 | 0.74 (0.59–0.93) | 0.011 |
| – Coronary artery bypass graft | 1.16 (0.84–1.60) | 0.382 | 1.10 (0.74–1.64) | 0.641 |
| – History of hypertension | 0.87 (0.72–1.06) | 0.162 | 0.86 (0.68–1.07) | 0.179 |
| – Diabetes mellitus | 1.25 (1.04–1.49) | 0.015 | 1.28 (1.04–1.57) | 0.019 |
| – LDL cholesterol ≥1.8 mmol/l | 0.74 (0.57–0.97) | 0.027 | 0.76 (0.56–1.03) | 0.073 |
| – Atrial fibrillation | 1.27 (1.04–1.55) | 0.02 | 1.43 (1.13–1.80) | 0.003 |
| – Overt heart failure | 2.22 (1.87–2.63) | <0.0001 | 2.09 (1.73–2.54) | <0.0001 |
| – Peak troponin ≥100-times of ULN | 1.11 (0.92–1.34) | 0.272 | 1.03 (0.84–1.27) | 0.791 |
| – eGFR >30 & ≤60 ml/min – based on lowest individual value | 1.86 (1.54–2.25) | <0.0001 | – | – |
| – eGFR >30 & ≤60 ml/min – based on highest individual value | – | – | 1.94 (1.56–2.42) | <0.0001 |
| Cardiovascular mortality | ||||
| – Age decade | 1.62 (1.47–1.79) | <0.0001 | 1.65 (1.47–1.85) | <0.0001 |
| – Male gender | 1.09 (0.90–1.31) | 0.397 | 1.03 (0.83–1.29) | 0.776 |
| – Year of hospitalization | 1.00 (0.97–1.04) | 0.849 | 0.98 (0.94–1.02) | 0.242 |
| – Hospitalization ≥10 days | 1.09 (0.87–1.36) | 0.47 | 1.03 (0.77–1.38) | 0.855 |
| – ST-elevation myocardial infarction | 0.94 (0.75–1.18) | 0.584 | 0.98 (0.76–1.26) | 0.853 |
| – Percutaneous coronary intervention | 0.63 (0.50–0.78) | <0.0001 | 0.66 (0.51–0.85) | 0.002 |
| – Coronary artery bypass graft | 1.28 (0.90–1.81) | 0.496 | 1.32 (0.86–2.01) | 0.204 |
| – History of hypertension | 0.94 (0.75–1.17) | 0.804 | 0.97 (0.74–1.26) | 0.811 |
| – Diabetes mellitus | 1.36 (1.12–1.67) | 0.003 | 1.40 (1.11–1.77) | 0.005 |
| – LDL cholesterol ≥1.8 mmol/l | 0.73 (0.55–0.97) | 0.028 | 0.74 (0.54–1.03) | 0.075 |
| – Atrial fibrillation | 1.36 (1.10–1.69) | 0.005 | 1.56 (1.21–2.00) | 0.001 |
| – Overt heart failure | 2.66 (2.19–3.22) | <0.0001 | 2.46 (1.98–3.07) | <0.0001 |
| – Peak troponin ≥100-times of ULN | 1.16 (0.94–1.43) | 0.166 | 1.07 (0.84–1.35) | 0.579 |
| – eGFR >30 and ≤60 ml/min – based on lowest individual value | 2.02 (1.63–2.51) | <0.0001 | – | – |
| – eGFR >30 and ≤60 ml/min – based on highest individual value | – | – | 2.04 (1.59–2.62) | <0.0001 |
An exploratory analysis was done using conventional categories of ejection fraction (≤40%, 41–50% and <50%) instead of ‘overt heart failure’ (see Methods for definition) as a covariate. The results were confirmatory (all cause mortality hazard risk ratios for moderate renal insufficiency were 2.04 [95% CIs: 1.54–2.72]; p < 0.0001 in model A or 1.85 [95% CIs: 1.41–2.43]; p < 0.0001 in model B; not in Table).
Discussion
The key finding of our study is that only the fluctuation of renal function toward moderate renal insufficiency (grade 3 by Kidney Disease Outcomes Quality Initiative classification), observed during hospitalization, indicates a worse prognosis of MI patients. More strictly defined moderate renal insufficiency (not only a permanent but also the transient decrease of eGFR) accounted for about a third of our sample and was associated with about a twofold higher risk of a fatal coronary event in the future.
Numerous studies observed, that even moderate impairment of renal functions negatively influenced the long-term prognosis of post-MI patients. A recent large observational study from New Zealand on 20,604 post-MI patients undergoing coronary angiography reported, that grade 3 renal insufficiency subjects (eGFR >30 and ≤60 ml/min) showed a significant 2.5-times higher risk of all-cause mortality [2]. Another registry-based study on 19,475 patients showed virtually similar data [3] and also subanalysis of several interventional trials reported confirmatory results (irrespective of treatment strategy used) [15,16]. This is all in agreement with the present study, but our data has now shown that the lowest eGFR value (highest creatinine) should be used to assess renal function during hospitalization. In the context of our results is also important the paper by Khoury and colleagues [17]. In this analysis, STEMI patients with renal insufficiency at admission showed higher 30-days mortality, even if their renal function improved during hospitalization (creatinine values decreased by 0.3 mg/dl or more). Although this study used a different definition of transient renal impairment, its conclusions are very similar to ours. We also exploratory applied the Khoury et al. [17] definition to our cohort. Taking 5-years cardiovascular mortality as the outcome, hazard risk ratio for transient renal insufficiency would be 1.40 (95% CIs: 1.12–1.74); p = 0.003 (and 5.4% of our sample would be classified as transient renal insufficiency, accordingly).
The important question remained what is the underlying mechanism of the transient decrease of renal functions. The most plausible explanation of this phenomenon is that represents an early clinical manifestation of kidney disease, probably ‘uncovered’ by stress situations caused by recent or ongoing myocardial ischemia. As already mentioned, the pathophysiological interplay between heart and kidney is well evident and poor outcomes in these particular subjects should be accounted for the adverse effect of renal insufficiency on the cardiovascular system. Kofman and colleagues [18] analyzed long-term renal outcomes among STEMI patients undergoing percutaneous coronary intervention, who developed acute kidney injury during initial hospitalization; chronic kidney disease was observed in 59% of them, within 90–180 days postdischarge. Moreover, in concert with our study, this phenomenon was also associated with worse survival [18]. Unfortunately, in our subjects, we are not able to systematically follow the further development of renal function in the coming years. The median highest eGFR (the best value) in subjects with a transient insufficiency (B group) was by nearly 8 ml/min lower than the lowest eGFR (the worst value) in the control group (A). It seems that subject with transient decrease represents some kind of grey zone between normal and insufficient renal function.
Another hypothesis is that transient decrease of renal function is only secondary and is just an indirect surrogate of a more severe course of hospitalization for MI leading to higher mortality risk afterward. We do our best to adjust the mortality risk to all available baseline factors, potentially associated with poorer survival, such as clinical phenotype of infarction (STEMI or nonSTEMI), severity and time circumstances of ischemia (leading to higher peak troponin), multivessel disease (indicated to coronary artery bypass graft), heart failure as well as the generally severe course of illness (leading to prolonged hospitalization). Moreover, the adverse effect of fluctuation toward moderate insufficiency persisted also in rather stable patients, in other words, those who survived at least 1 year after MI.
In theory, the higher number of eGFR measurements may also increase the chance of observing a lower value of eGFR, and it probably indicates a need for prolonged hospitalization again (with possible consequences regarding individual long-term prognosis). On the other hand, the observed mortality risk of transient decrease of eGFR sustained in our cohort, even if also these potential covariates were exploratory included in the full regression model (not in Results).
We can also speculate about the role of contrast injury on the background of observed transient moderate renal insufficiency (because all enrolled patients underwent coronary angiography). Even though in clinical practice this explanation of transient renal insufficiency was used by far the most common, the real incidence of contrast nephropathy is much less low. A recent meta-analysis on 1602 subjects after STEMI reported that contrast-induced acute kidney injury was observed in only 1–2% subjects and no major difference in this condition was observed among single-vessel and multi-vessel interventions (with markedly different amount of contrast dye) [19]. There are also voices calling into question the very existence of contrast nephropathy. A meta-analysis on 107,335 subjects studied the incidence of renal insufficiency after a CT scan. Whether the contrast was used or not, no significant differences in the occurrence of renal insufficiency, need for renal replacement therapy, as well as in all-cause mortality were observed [20]. It is also necessary to stress, that we did not observe any convincing time sequence between contrast dye administration and decrease of eGFR in the present study (not in Results). Unfortunately, we no information about other, potentially ‘nephrotoxic’ drugs, used during hospitalization. The only exception was furosemide, which was associated with the gradually increased relative risk of renal insufficiency (more than three-times). On the other hand, when furosemide treatment was included in the full model, the association between transient moderate renal insufficiency and mortality risk was not significantly affected (and the same is true for spironolactone).
The crucial question is always, whether the presence of an additive risk indicator leads to any change, regarding individual treatment. It is well evident that the second generation of P2Y12 antagonists (ticagrelor and prasugrel) has more favorable outcomes than older clopidogrel [4,21]. Relative recent subanalysis of the PLATO trial by James and colleagues [15], compared the safety/efficacy of ticagrelor among eGFR subgroups. Patients with eGFR <60 ml/min (by Cocroft–Gault or Modification of Diet in Renal Disease Study formula) showed not only a significantly higher incidence of major cardiovascular events but also relatively better efficacy of ticagrelor over clopidogrel. Conversely, in patients with eGFR ≥60 ml/min was no substantial difference in efficacy of ticagrelor-based and clopidogrel-based dual antiplatelet therapy (DAPT) (relative risk reduction for ticagrelor vs clopidogrel was 29% if eGFR <60 ml/min but only 10% if eGFR ≥60 ml/min; p for interaction = 0.02) [15]. Similarly, in PEGASUS-TIMI 54 trial, prolonged DAPT (used until the third year after MI) based on ticagrelor showed relatively higher risk reduction in patients with eGFR <60 ng/ml [22]. Also efficacy of low-dose anticoagulant (rivaroxaban 2.5 mg b.i.d.) in stable vascular patients (COMPASS trial) was more pronounced in patients with eGFR <60 ml/min, than in those higher baseline values [23]. Therefore, it seems that the presence of even mild renal impairment may help identify patients who could benefit from a more ‘tailored’ treatment approach.
Study limitations
Our analysis had several limitations. Being limited to the circumstances of the acute phase of MI, we could not appreciate several factors of the individual risk of our patients. In the first line, we know nothing about individual long-term adherence to the recommended target values of conventional factors, prescription, dosage and adherence to usual pharmacotherapy in secondary prevention and other important indicators (e.g., the persistence of smoking). On the other hand, all patients received standard recommendations on treatment after MI (DAPT, statins, beta-blockers, RAAS blockers…) plus information about necessary lifestyle changes (nonsmoking, etc.) at discharge from the hospital. A subsample of about 680 patients was also examined in the course of EUROASPIRE III–V study nearly 1 year after qualifying coronary event – no substantial differences in long-term pharmacotherapy and adherence to recommended targets among equivalent subgroups of renal functions were found [24]. Indeed, the run-in period of our study is very long (2006–2018) and many things have changed in terms of acute management or principles of secondary prevention during this time. In this regard, we were able to adjust our results only for the year in which the MI occurred, but no longer for all these individual circumstances.
It would be quite interesting to know the post-discharge development of renal functions in our patients, but these data are not available to us.
Conclusion
Moderate renal insufficiency seems to be a very simple indicator (biomarker) of additive individual mortality risk in chronic coronary artery disease patients. To our opinion, the definition of this condition should include also a transient decline during hospitalization for acute MI. Thus strictly defined renal insufficiency is surprisingly common in post-MI patients (about a third).
What is already known on this subject?
•
Impaired glomerular filtration represents important prognostic factors in patients after myocardial infarction.
•
Transient decrease of renal functions during hospitalizations is often seen phenomenon in clinical practice.
What did this study add?
•
Even transient decrease of estimated glomerular filtration during few days after myocardial infarction indicates substantial long-term mortality risk.
•
The lowest value of glomerular filtration during hospitalization should be used for further consideration.
Acknowledgments
In our work, we used data that came from the efforts of many doctors, nurses and other hospital staff, all of whom also owe our thanks.
Financial & competing interests disclosure
The present study was supported by Specific Academic Research Project of Charles University (grant SVV 2020-2022, No 260 537) and by Charles University Research Fund (PROGRESS, project Q39). The authors have no other relevant affiliations or financial involvement with any organization or entity with a financial interest in or financial conflict with the subject matter or materials discussed in the manuscript apart from those disclosed.
No writing assistance was utilized in the production of this manuscript.
Ethical conduct of research
The authors state that they have obtained appropriate institutional review board approval or have followed the principles outlined in the Declaration of Helsinki for all human or animal experimental investigations. In addition, for investigations involving human subjects, informed consent has been obtained from the participants involved.
References
1.
Matsushita K, Ballew SH, Coresh J. Cardiovascular risk prediction in people with chronic kidney disease. Curr. Opin. Nephrol. Hypertens. 25(6), 518–523 (2016).
2.
Pilmore HL, Xiong F, Choi Y et al. Impact of chronic kidney disease on mortality and cardiovascular outcomes after acute coronary syndrome: a nationwide data linkage study (ANZACS-QI 44). Nephrology (Carlton) 25(7), 535–543 (2020).
3.
Scholz SS, Lauder L, Ewen S et al. One-year clinical outcomes in patients with renal insufficiency after contemporary PCI: data from a multicenter registry. Clin. Res. Cardiol. 109(7), 845–856 (2019).
4.
Zannad F, Rossignol P. Cardiorenal syndrome revisited. Circulation 138(9), 929–944 (2018).
5.
Ronco C, Bellasi A, Di Lullo L. Cardiorenal syndrome: an overview. Adv. Chronic Kidney Dis. 25(5), 382–390 (2018).
6.
Damman K, Navis G, Voors AA et al. Worsening renal function and prognosis in heart failure: systematic review and meta-analysis. J. Card. Fail. 13(8), 599–608 (2007).
7.
Heywood JT, Fonarow GC, Costanzo MR, Mathur VS, Wigneswaran JR, Wynne J. High prevalence of renal dysfunction and its impact on outcome in 118,465 patients hospitalized with acute decompensated heart failure: a report from the ADHERE database. J. Card. Fail. 13(6), 422–430 (2007).
8.
Thakar CV, Christianson A, Freyberg R, Almenoff P, Render ML. Incidence and outcomes of acute kidney injury in intensive care units: a Veterans Administration study. Crit. Care Med. 37(9), 2552–2558 (2009).
9.
Laszczynska O, Severo M, Mascarenhas J, Paiva JA, Azevedo A. Serum creatinine trajectories in real-world hospitalized patients: clinical context and short-term mortality. J. Investig. Med. 68(4), 870–881 (2020).
10.
Hirayama A, Goto T, Hasegawa K. Association of acute kidney injury with readmissions after hospitalization for acute exacerbation of chronic obstructive pulmonary disease: a population-based study. BMC Nephrol. 21(1), 116 (2020).
11.
Chertow GM, Burdick E, Honour M, Bonventre JV, Bates DW. Acute kidney injury, mortality, length of stay, and costs in hospitalized patients. J. Am. Soc. Nephrol. 16(11), 3365–3370 (2005).
12.
Thakar CV, Liangos O, Yared JP et al. ARF after open-heart surgery: influence of gender and race. Am. J. Kidney Dis. 41(4), 742–751 (2003).
13.
Levey AS, Stevens LA, Schmid CH et al. A new equation to estimate glomerular filtration rate. Ann. Intern. Med. 150(9), 604–612 (2009).
14.
K/DOQI clinical practice guidelines for chronic kidney disease: evaluation, classification, and stratification. Am. J. Kidney Dis. 39(1 Suppl. 2), S1–S266 (2002).
15.
James S, Budaj A, Aylward P et al. Ticagrelor versus clopidogrel in acute coronary syndromes in relation to renal function: results from the Platelet Inhibition and Patient Outcomes (PLATO) trial. Circulation 122(11), 1056–1067 (2010).
16.
Tomaniak M, Chichareon P, Klimczak-Tomaniak D et al. Impact of renal function on clinical outcomes after PCI in ACS and stable CAD patients treated with ticagrelor: a prespecified analysis of the GLOBAL LEADERS randomized clinical trial. Clin. Res. Cardiol. 109(7), 930–943 (2020).
17.
Khoury S, Margolis G, Ravid D, Rozenbaum Z, Keren G, Shacham Y. Outcomes of early and reversible renal impairment in patients with ST segment elevation myocardial infarction undergoing percutaneous coronary intervention. Eur. Heart J. Acute Cardiovasc. Care 9(7), 684–689 (2018).
18.
Kofman N, Margolis G, Gal-Oz A et al. Long-term renal outcomes and mortality following renal injury among myocardial infarction patients treated by primary percutaneous intervention. Coron. Artery Dis. 30(2), 87–92 (2019).
19.
Chatterjee S, Kundu A, Mukherjee D et al. Risk of contrast-induced acute kidney injury in ST-elevation myocardial infarction patients undergoing multi-vessel intervention-meta-analysis of randomized trials and risk prediction modeling study using observational data. Catheter Cardiovasc. Interv. 90(2), 205–212 (2017).
20.
Aycock RD, Westafer LM, Boxen JL, Majlesi N, Schoenfeld EM, Bannuru RR. Acute kidney injury after computed tomography: a meta-analysis. Ann. Emerg. Med. 71(1), 44–53.e44 (2018).
21.
Hamm CW, Bassand JP, Agewall S et al. ESC Guidelines for the management of acute coronary syndromes in patients presenting without persistent ST-segment elevation: The Task Force for the management of acute coronary syndromes (ACS) in patients presenting without persistent ST-segment elevation of the European Society of Cardiology (ESC). Eur. Heart J. 32(23), 2999–3054 (2011).
22.
Magnani G, Storey RF, Steg G et al. Efficacy and safety of ticagrelor for long-term secondary prevention of atherothrombotic events in relation to renal function: insights from the PEGASUS-TIMI 54 trial. Eur. Heart J. 37(4), 400–408 (2016).
23.
Fox KAA, Eikelboom JW, Shestakovska O, Connolly SJ, Metsarinne KP, Yusuf S. Rivaroxaban plus aspirin in patients with vascular disease and renal dysfunction: from the COMPASS Trial. J. Am. Coll. Cardiol. 73(18), 2243–2250 (2019).
24.
Mayer O, Bruthans J, Rychecká M. Změny úrovně sekundární prevence ischemické choroby srdeční mezi lety 1995 a 2017. Vnitr. Lek. 64, 1190–1199 (2018).
Information & Authors
Information
Published In
Pages: 219 - 228
PubMed: 33541131
Copyright
© 2021 Future Medicine Ltd.
History
Received: 15 May 2020
Accepted: 27 November 2020
Published online: 5 February 2021
Keywords:
Topics
Authors
Metrics & Citations
Metrics
Article Usage
Article usage data only available from February 2023. Historical article usage data, showing the number of article downloads, is available upon request.
Citations
How to Cite
The prognostic impact of renal function decline during hospitalization for myocardial infarction. (2021) Journal of Comparative Effectiveness Research. DOI: 10.2217/cer-2020-0085
Export citation
Select the citation format you wish to export for this article or chapter.
Citing Literature
- Tereza Nezbedová, Otto Mayer, (Intra-individual variability of lipoprotein(a) and its potential impact on treatment decisions regarding this risk factor), Cor et Vasa, 10.33678/cor.2024.064, 66, 5, (481-486), (2024).
- L. A. Kamyshnikova, D. S. Pisankina, K. S. Gorbachevskaya, G. V. Biryukov, M. S. Sviridova, I. V. Kalashnikova, Risk factors and diagnostic markers for acute coronary syndrome in chronic kidney disease, The Clinician, 10.17650/1818-8338-2023-17-1-K675, 17, 1, (21-27), (2023).
- Otto Mayer, Jan Bruthans, Simona Bilkova, Jitka Seidlerova, Josef Jirak, Jan Filipovsky, The prognosis and therapeutic management of patients hospitalized for heart failure in 2010-2020, Biomedical Papers, 10.5507/bp.2022.020, 166, 3, (312-321), (2022).
- Lenka Kielbergerová, Otto Mayer, Jan Bruthans, The mortality risk of patients hospitalized for ischemic stroke between 2003 and 2019, Vnitřní lékařství, 10.36290/vnl.2022.040, 68, 3, (E04-E11), (2022).