Medication review with follow-up for cardiovascular outcomes: a trial based cost–utility analysis
Publication: Journal of Comparative Effectiveness Research
Abstract
Aim: To assess the trial-based cost–effectiveness of medication review with follow-up compared with usual care in primary care. Materials & methods: A cluster randomized controlled trial included patients if they were independent older adults, receiving five or more prescriptions, with moderate or high cardiovascular risk. Costs were estimated from the public healthcare sector perspective, and health benefits were measured as quality-adjusted life years. Both of which were used to calculate the incremental cost–effectiveness ratio. Results: Twelve centers completed the study, six (146 patients) in the intervention group and six (145 patients) in the control group. The base-case analysis showed an incremental cost–effectiveness ratio of US$ (2019) 434.4/quality-adjusted life year (95% CI 64.20–996.03). Conclusion: The intervention was cost-effective in the public primary care setting.
Lay abstract
Aim: To assess if a pharmacy service called ‘medication review’ represents value for money to the Chilean healthcare system. Materials & methods: A trial that included older adults, receiving five or more medications, with moderate to high risk of having events such as strokes or heart attack was conducted. A cost–effectiveness analysis was performed comparing the costs and the benefits of the intervention with usual care. Results: At the end of the trial, 146 patients were on the intervention group, whereas 145 were on the control group. Medication review generated more costs, but also increased benefits. Conclusion: Medication review was good value for money for the Chilean healthcare system.
Noncommunicable diseases (NCDs) are the leading cause of mortality globally, with cardiovascular diseases (CVDs) being the primary cause [1]. Moreover, CVDs such as stroke or ischaemic heart disease have acute and long-term consequences placing a significant burden on healthcare systems. This situation was exemplified in a study conducted in 2018, showing that CVDs were the leading cause of disability-adjusted life years (DALYs), accounting for 18.9% of all NCDs’ DALYs [2]. Consequently, the increased health burden is also expected to translate into increased costs. It is expected that by 2030 CVDs will generate global costs of 1 trillion United States dollars (US$) [3]. A similar trend is expected to occur in Latin America, with costs rising by 22% by 2030 from an economic burden estimated at 26 billion US$ in 2010 [3].
Risk factors which contribute to CVDs have been well documented in the literature. Some of them are modifiable and can be addressed through interventions that target patients’ behaviors or through the use of medications [4]. Evidence-based clinical practice guidelines include the management of some of the most relevant risk factors through pharmacological and non-pharmacological strategies. These are mainly focused on hypertension, Type 2 diabetes mellitus (T2DM) and dyslipidemia [5–7]. Despite the availability of these widely implemented management guidelines, there is evidence proving that therapeutic objectives are not always being achieved. A recent study conducted in Latin American countries analyzed a range of cardiovascular indicators in a cohort of 5458 patients. Authors identified low rates of ideal cardiovascular health, with a high prevalence of elevated blood pressure, fasting glucose and total cholesterol [8]. These findings suggest that more efforts to evaluate and implement effective CVDs prevention and management strategies should be considered.
In Chile, CVDs represent 27.5% of all-cause of mortality and, generate an expenditure between 1.5 and 1.8% of the country’s GDP [9]. In addition, the proportion of patients not reaching their target values remains high, where 32% of hypertensive patients and 55% of T2DM patients did not achieve their desired blood pressure and glycated hemoglobin levels respectively [10,11]. The Chilean public healthcare sector tackles CVD risk factors under three pillars: the primary care setting, the CVD prevention program and the pharmacy fund [12,13]. Primary care centers deliver healthcare services under the family medicine model promoted by the Pan-American Health Organization [14,15]. Within this level of care, the CVD prevention program guides healthcare professionals intending to control risk factors in order to prevent premature morbidity and mortality and to improve patients’ quality of life [16]. The latest program report shows that there were 2.3 million patients (32.9% of the potential target population) enrolled in 2018 [17]. In addition, the pharmacy fund for NCDs focused on CVD prevention was implemented to support access to medicines [9]. One of its components was an increase in the number of pharmacists available for primary care. According to the fund recommendations, these professionals should have the role of managing primary care pharmacies and to promote/ensure the rational use of medications through professional pharmacy services [9,18].
Since pharmacists were introduced to the primary care setting, the CVD prevention program has recognized them as one of the pillars within the healthcare team [16]. This program, in line with guidelines released by The Pan-American Health Organization, recommends that pharmacists should perform patient-centered services to aid patients to reach their specific targets in CVD risk factors [19]. One of these services is the medication review with follow-up (MRF) service. This recommendation is supported by evidence that suggests that MRF is effective in controlling CVD risk factors. A meta-analysis of ambulatory patients that compared MRF with usual care found that therapeutic goal attainment was improved in hypertension (OR 2.73 95% prediction interval [PI] 1.05–7.08), T2DM (OR 3.11 95% PI 1.17–5.88) and dyslipidemia (OR 1.91 95% PI 1.05–3.46), which in turn is expected to lead to fewer CVD events [20].
Despite proven clinical effectiveness of many innovations and interventions, their implementation has been limited because of scarce economic and human resources. In this context, economic evaluations (like cost–effectiveness analysis) provide a critical role in healthcare policy, generating evidence on the value of health technologies that is often used by decision-makers. This assessment compares the costs and benefits of an intervention to the best available alternative in a given jurisdiction, in other words, if additional costs are worth the extra benefits gained [21]. Findings from a recent systematic review also support MRF as a cost-effective intervention that could assist in minimizing the burden of CVD [22].
Considering the clinical and economic impact that CVDs have globally, the recent inclusion of pharmacists in the Chilean primary healthcare setting and the potential benefits of MRF on these diseases, a clustered randomized controlled trial was conducted to evaluate the impact of this intervention in elderly CVD patients. The objective of this research was to assess the cost–effectiveness of the addition of MRF to usual care compared with usual care alone in the primary care setting from the public healthcare sector perspective.
Materials & methods
Trial design
The trial is registered and described in clinicaltrials.gov (NCT03502109). In brief, this was a cluster randomized controlled trial, undertaken from January 2018 to July 2019, where pharmacists interviewed patients every 4 months over 1 year. This study evaluated the addition of a pharmacist-led MRF to usual care compared with usual care alone in the primary care setting. Each primary care center was considered a cluster, and all were located in Santiago, Chile. Centers were deemed eligible if they had a full-time pharmacist available to allocate ten hours per week for the trial-related activities. Participant pharmacists were required to register data in the patient’s medical record and to have access to a private consultation room. Primary care centers were the unit of randomization. Simple randomization was conducted in Excel©.
Target population
Inclusion criteria were elderly adults (65 years or older) using polypharmacy (five or more prescription medications [23]), enrolled in a CVD prevention program and deemed as independent according to the Barthel index for activities of daily living [24]. Patients were excluded if they had low coronary heart disease risk [25].
Intervention
The intervention had three main components: pharmacists’ training, a practice change facilitator and the MRF service itself. MRF was implemented using a methodology adapted to primary care based on previously published methods [26,27]. These components were extensively described according to the TIDieR checklist to aid intervention’s replicability (Supplementary Material 1) [28]. The three components are described as follows:
•
Pharmacists’ training: Before patient recruitment pharmacists in the intervention group were trained in a 5-day workshop for a total of 15 h. These sessions covered MRF methods, interprofessional collaboration, assessment of vital signs, health education, interview skills and CVDs pharmacotherapy.
•
MRF:
Each patient in the intervention group received MRF using a step-wise approach which included:
◦
Medical record review: Before the patient’s first visit, the pharmacist reviewed the patient’s medical and pharmacy records to retrieve relevant information such as comorbidities, prescription medicines and previous pathology tests results.
◦
First visit: The pharmacist interviewed the patient assessing all medications used, verifying his/her knowledge about the medications taken, treatment adherence, perception of effectiveness and of safety [29]. CVD risk factors management was also assessed.
◦
Pharmacotherapy assessment: Based on the information collected in the first visit, the pharmacist developed a care plan identifying any uncontrolled health and drug-related problems. The care plan included the outcome of the pharmacist’s assessment, clinical goals tailored to the patient, recommendations directed to the patient’s general practitioner (GPs) and structured educational interventions tailored at each patient’s needs. The latter was planned listing educational goals, the content, activities, expected time for completion and performance indicators [30,31].
◦
Second visit: Educational interventions were prioritized if possible to ensure that barriers in this matter would not interfere with changes in therapy.
◦
Recommendations to the GP: The pharmacist met with the patient’s GP to discuss medication-related recommendations. These suggestions encompassed the prescription, change or removal of a medication, prevention of adverse drug reactions, prevention of interactions, dosing changes and administration issues.
◦
Third and fourth visits: The pharmacist communicated the changes in prescriptions which had to be previously accepted by the GP. In addition, the pharmacist assessed the outcomes of previous interventions and reinforced recommendations if necessary.
•
Practice change facilitator: To aid in the implementation of MRF, a practice change facilitator provided follow-up to pharmacists periodically in the intervention group. The facilitator was a pharmacist with experience conducting MRF, trained in the trial methods, and data collection. The objective of these visits was to assist with the fidelity of the intervention, detecting and addressing relevant factors affecting the delivery of MRF [32].
Usual care
Economic evaluation
This research was conducted and reported in accordance with the Consolidated Health Economic Evaluation Reporting Standards (CHEERS) statement and the local guideline for economic evaluations [33,34].
Measurements & valuation of patient-reported outcomes
Health-related quality of life was measured using the Spanish version for Chile of the EuroQol five-dimension three-level questionnaire (EQ-5D-3L) provided by the EuroQoL Research Foundation [35,36]. The pharmacist administered the survey at each patient’s visit. The results of the questionnaire were used to estimate utility scores derived from the published Chilean tariff that used the time trade-off method to assess preferences [36]. With these scores, quality-adjusted life years (QALYs) were calculated using the area under the curve method [37].
Resource use & costs
Costs were estimated from the public healthcare system perspective. According to this perspective, health resources such as pharmacists’ time, GPs’ time, practice change facilitators’ time, pathology tests and medications, were measured directly from the trial. Other resources such as medication-related hospitalizations, emergency department visits and specialists’ visits were obtained from local published data where available. Unit prices were obtained from local sources and are summarized in Supplementary Material 2 [38–41].
To determine if hospitalizations were medicine-related, three GPs evaluated them using a methodology adapted from Malet-Larrea et al. [42]. Inter-rater agreement between GPs was determined using Cohen’s kappa index, while Fleiss’s kappa index was used to test for overall agreement [43,44]. These indexes were classified according to Landis and Koch (1977) criteria [45].
Currency, price date & conversion
Analytic methods
Baseline characteristics were compared using the t-student or the chi-square tests according to the type of variable. A cost–effectiveness analysis was conducted according to the intention to treat principle (base-case). In this analysis, costs and QALYs were estimated for each study group. This information was used to compute the incremental cost–effectiveness ratio (ICER), a ratio that represents the additional cost per additional unit of benefit, and is presented below [21]:
Following the intention to treat principles, missing data was addressed using multiple imputations as missing data was assumed to be missing at random with complete baseline covariates data. This process was conducted through chained equations and predictive mean matching by study group. This method was chosen as it accounts for non-normally distributed variables and ensures plausible imputed values [48]. This technique generated 20 imputed datasets and results were combined using Rubin’s rules [49].
Costs and QALYs were estimated through a random-effects model accounting for clustering and covariates. For costs, the maximum likelihood approach was used, while for QALYs, the restricted maximum likelihood model was selected [50]. In both cases, the model fit was tested with the Akaike Information Criterion (AIC) in multiple imputed datasets following the methods suggested by Chaurasia et al. [51]. This assessment was performed using ordinary least squares regression, generalized linear models and multilevel models with restricted and unrestricted maximum likelihood approach and is reported in Tables 1 & 2. Models were adjusted for age, gender, CVD history, coronary heart disease risk above 10%, T2DM diagnosis, number of comorbidities, educational level, marital status, more than nine prescribed medications, baseline medication adherence and BMI higher than 32 kg/m2. For QALYs, the baseline utility score was also used.
| Quality-adjusted life years | Log-likelihood (arithmetic mean) | Akaike information criteria | Log-likelihood (geometric mean) | Geometric Akaike information criteria |
|---|---|---|---|---|
| Nonmixed Models | ||||
| Ordinary least squares | 318.94 | -10,3310.50 | 15.95 | -5142.73 |
| Log-normal GLM | 226.65 | -73,410.82 | 11.33 | -3647.74 |
| Mixed models | ||||
| Linear REML | 273.54 | -88,602.96 | 13.68 | -4407.35 |
| Linear ML | 326.11 | -105,634.70 | 16.31 | -5258.94 |
| Log-normal GLM | 228.41 | -73,979.58 | 11.42 | -3676.18 |
GLM: Generalized linear model; ML: Maximum likelihood; RELM: Restricted maximum likelihood.
| Costs | Log-likelihood (arithmetic mean) | Akaike information criteria | Log-likelihood (geometric mean) | Geometric Akaike information criteria |
|---|---|---|---|---|
| Nonmixed Models | ||||
| Ordinary least squares | -3,954.46 | 1,281,270.37 | -197.72 | 64,086.32 |
| Log-normal GLM | -3,953.34 | 1,280,904.41 | -197.67 | 64,068.02 |
| Mixed Models | ||||
| Linear REML | -3,819.03 | 1,237,389.91 | -190.95 | 61,892.30 |
| Linear ML | -3,950.70 | 1,280,050.80 | -197.54 | 64,025.34 |
| Gamma-log GLM | -3,948.80 | 1,279,436.59 | -197.44 | 63,994.63 |
GLM: Generalized linear model; ML: Maximum likelihood; RELM: Restricted maximum likelihood.
Sampling uncertainty was handled by bootstrapping costs and QALYs pairs through a non-parametric approach. To account for the clustering of data, replications were stratified by primary care center [52]. This technique generated 1000 iterations that were used to calculate the 95% CI around the ICER using the percentile method [53]. However, as the interpretation of 95% CI is troublesome in this type of analysis, the cost–effectiveness plane was used to visually assess the results [54]. If benefits gains at extra costs are observed, there is no obvious choice. In this situation, the cost–effectiveness threshold represents the opportunity cost of funding an intervention, in other words, the benefits forgone of disinvestment in other areas of healthcare [55]. The World Health Organization and local guidelines suggest using a cost–effectiveness threshold between one and three GDP per capita [33,56]. We decided to use the stringent definition of one GDP per capita which, according to The World Bank (2018) it was $15 923 for Chile ($16 207 when adjusted to 2019 US$) [57]. In addition, to assess the probability of the intervention being cost–effectiveness at different thresholds, an acceptability curve was plotted [58].
Robustness of the results was assessed evaluating different scenarios. First, we performed a per-protocol analysis with patients that complied with all four visits and had complete health-related quality of life data. Second, a scenario using the maximum likelihood approach for QALYs regressions was performed as the restricted maximum likelihood approach limits variance and therefore uncertainty. Finally, an analysis was conducted specifically for centers that provided cost data of medication-related hospitalizations, specialists’ visits and emergency department visits.
Heterogeneity was also assessed by evaluating changes in the ICER in different subgroups. The relevant subgroups identified were patients with coronary heart disease risk higher than 10%, BMI above 32 kg/m2, 75 years or older, T2DM diagnosis and more than nine prescribed medications.
Results
Twenty-four primary care centers were initially recruited (Figure 1). Twelve (50%) finished the trial, six (174 patients) in the intervention group and six (150 patients) in the control group. Centers that dropped out did not provide any patient data. Of these patients, 146 completed all four visits in the former and 145 in the latter. Eight patients in the control group did not provide health-related quality of life data; therefore, 137 patients were considered in the per-protocol analysis. Baseline characteristics were similar between groups; however, there were significant differences in marital status, number of chronic diseases and CVD history (Table 3).
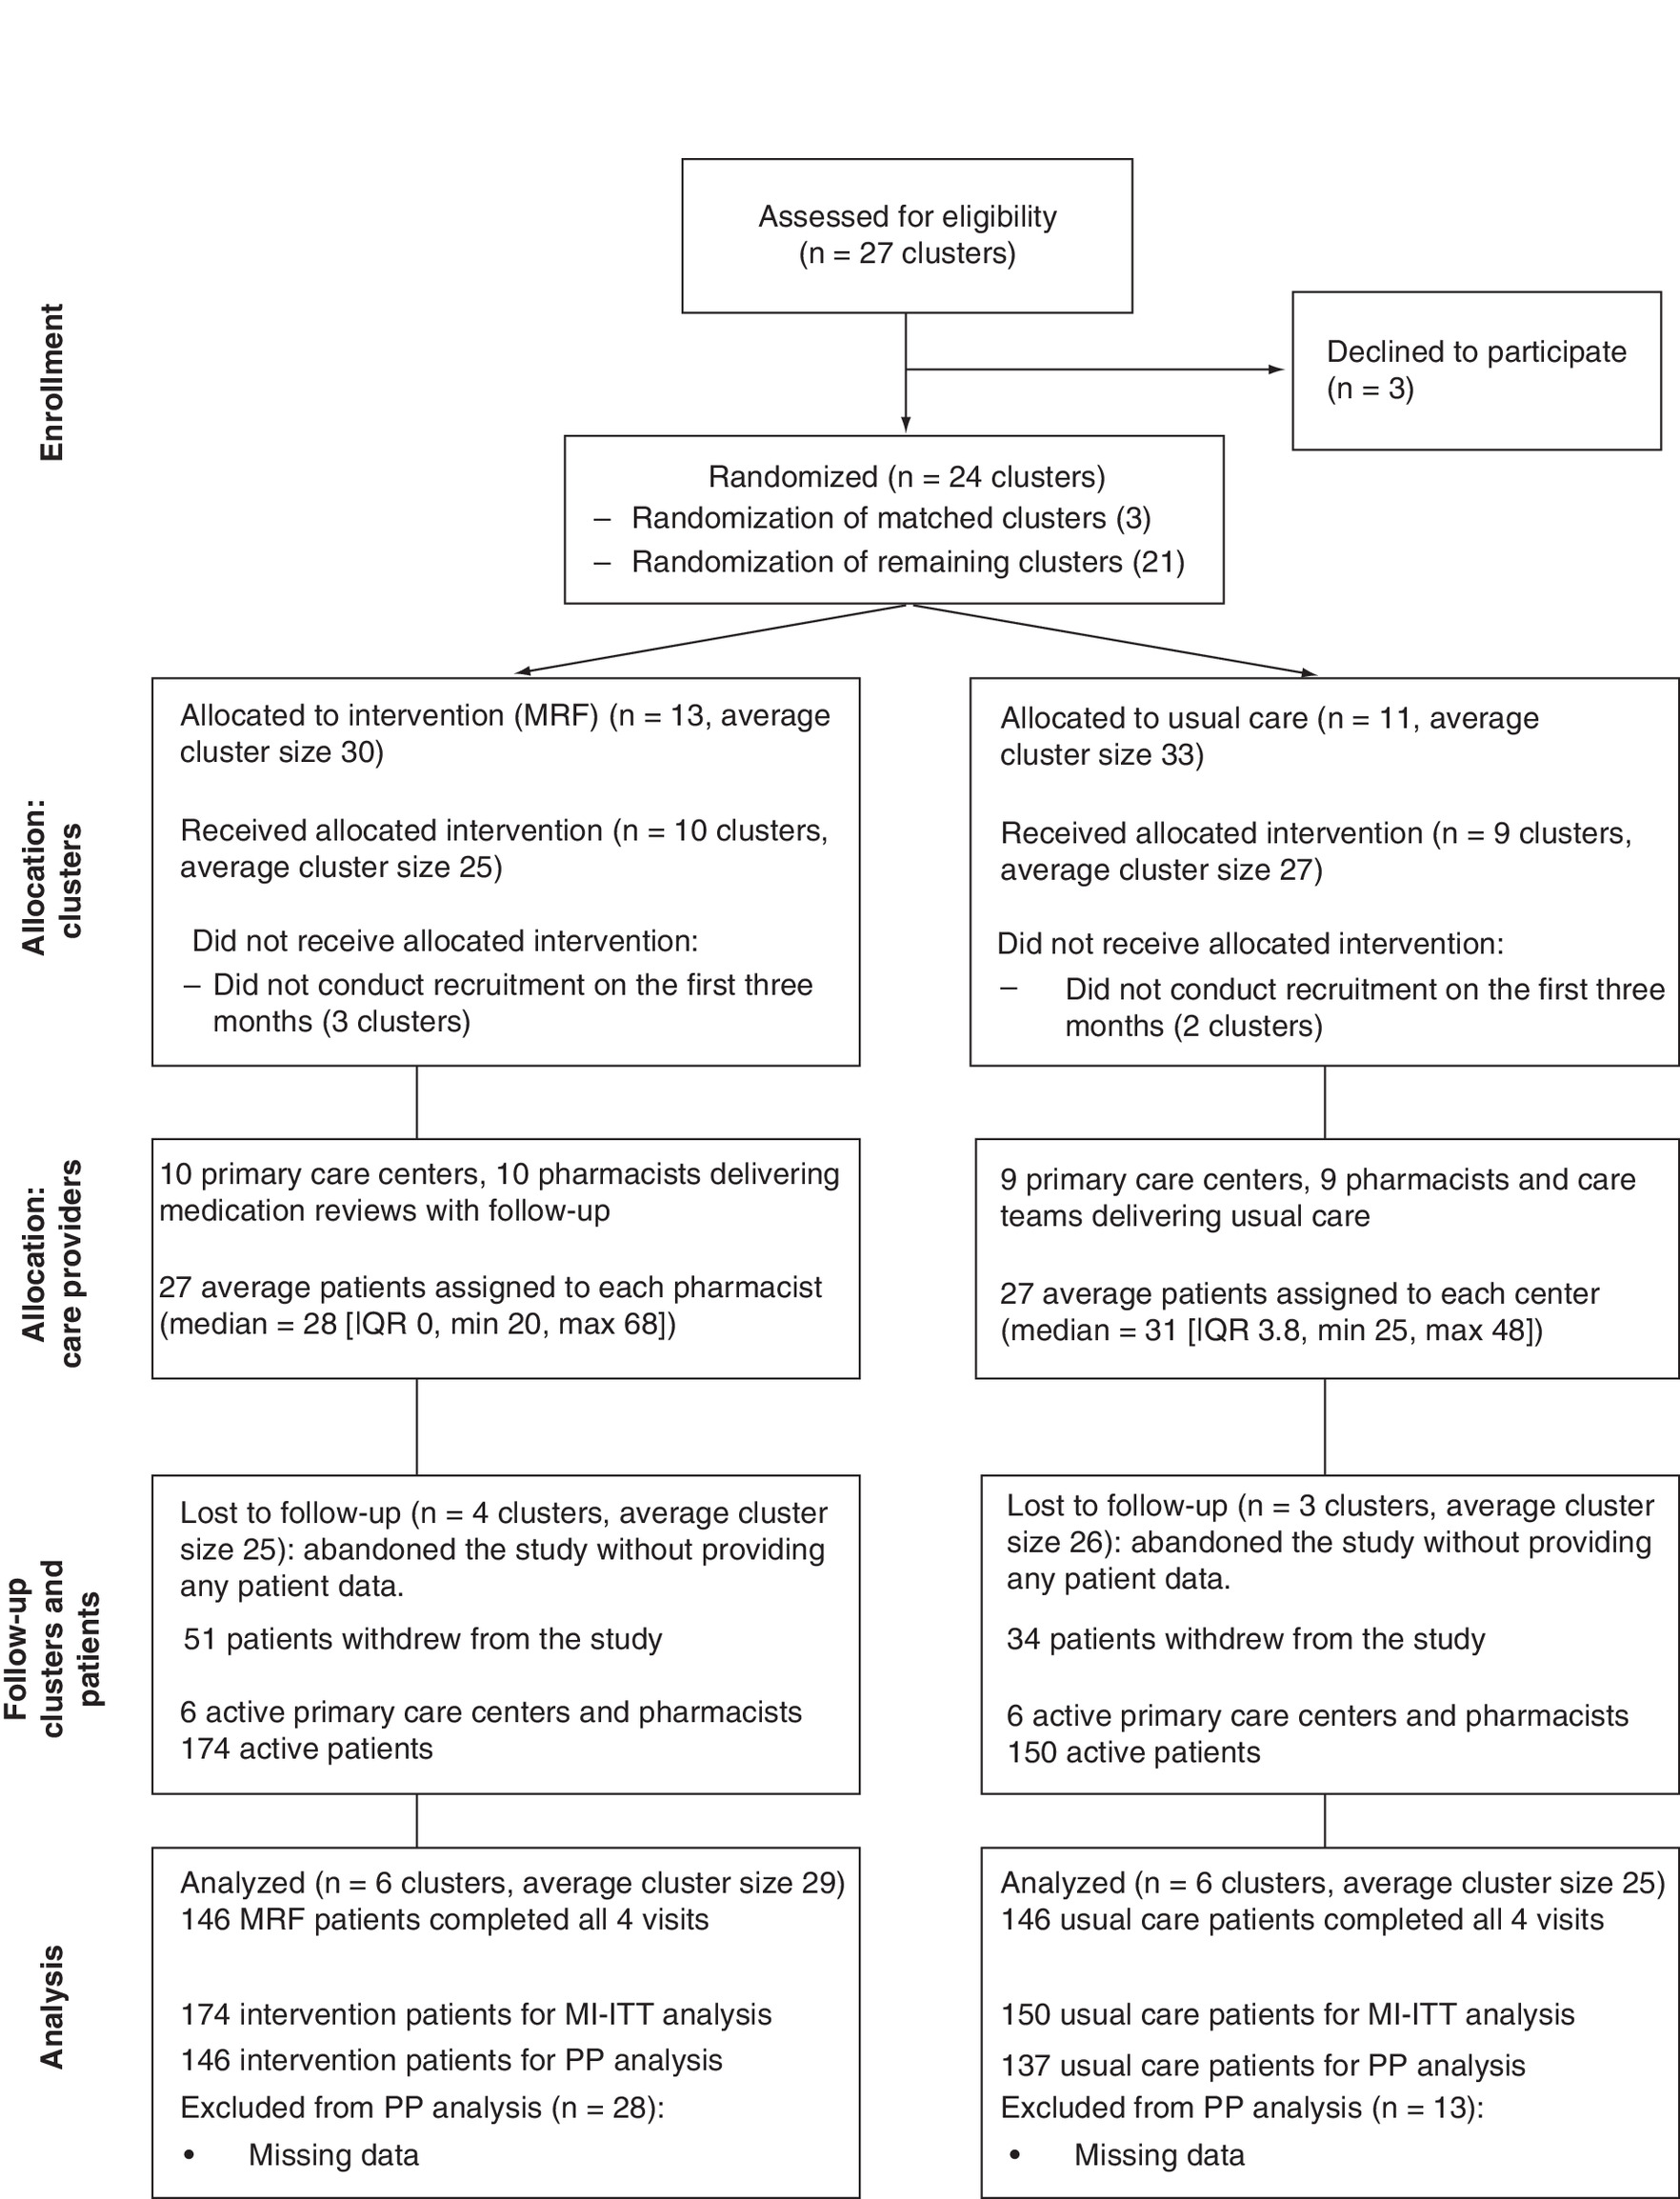
Figure 1. Consolidated Standards of Reporting Trials flowchart for the trial.
IQR: Interquartile range; MI-ITT: Multiple imputation intention-to-treat; MRF: Medication review with follow-up; PP: Per-protocol.
| Baseline | Intervention (n = 174) | Usual care (n = 150) | p-value |
|---|---|---|---|
| Age, mean (SD), years | 73 (6) | 74 (6) | 0.13 |
| Female (%) | 126 (72) | 107 (71) | 0.83 |
| With partner (%) | 103 (59) | 64 (43) | 0.00‡ |
| Educational level No education (%) Primary studies (%) Secondary studies (%) Tertiary studies (%) | 79 (45) 57 (33) 33 (19) 5 (3) | 71 (47) 57 (38) 20 (13) 2 (1) | 0.76 0.32 0.16 0.32 |
| BMI, mean (SD), kg/m2 | 31 (6) | 31 (5) | 0.60 |
| Number of chronic diseases, mean (SD) | 4 (1) | 4 (2) | 0.00‡ |
| Number of medications, mean (SD) | 8 (3) | 8 (2) | 0.09 |
| Coronary heart disease risk, mean (SD), %† | 10 (3) | 9 (3) | 0.93 |
| Hypertension (%) | 174 (100) | 150 (100) | 1 |
| Type 2 diabetes mellitus (%) | 107 (62) | 93 (62) | 0.93 |
| Smokers (%) | 25 (14) | 18 (12) | 0.53 |
| Cardiovascular disease history (%) | 33 (19) | 22 (15) | 0.01‡ |
| Baseline utility, mean (SD) | 0.56 (0.28) | 0.59 (0.27) | 0.38 |
| EQ-5D VAS, mean (SD) | 63 (21) | 68 (19) | 0.06 |
n = 324.
†
n = 269 patients.
‡
p < 0.05.
EQ-5D: EuroQoL five dimension questionnaire; SD: Standard deviation; VAS: Visual analogue scale.
Health-related quality of life utility scores are presented in Table 4. Utility scores on the first visit were 0.56 (±0.28) for the MRF group and 0.59 (±0.27) for usual care. After correcting for clustering and covariates, the baseline difference was negligible and not statistically significant (-0.00022, 95% CI -0.058–0.58). Although the difference did increase in the second and third visit, it did not achieve statistical significance until the fourth visit with a difference of 0.13 (95% CI 0.04–0.23).
| Utility scores | Mean (SEM) | Difference (95% CI)† | |
|---|---|---|---|
| MRF (n = 174) | Usual care (n = 150) | ||
| 1st visit | 0.56 (0.021) | 0.59 (0.022) | -0.00022 (-0.058–0.58) |
| 2nd visit | 0.56 (0.21) | 0.58 (0.23) | 0.021 (-0.03–0.08) |
| 3rd visit | 0.61 (0.21) | 0.56 (0.24) | 0.064 (-0.0030–0.13) |
| 4th visit | 0.65 (0.18) | 0.55 (0.25) | 0.13 (0.040–0.23) |
†
Adjusted by clustering and covariates.
MRF: Medication review with follow-up; SEM: Standard error of the mean.
As per healthcare resources for the base-case, pharmacists required 149.42 min per patient (±24.42) and GPs 64.07 (±20.53). Pharmacists’ initial training was conducted for 15 h, and practice change facilitators spent a mean of 225.83 (±179.16) min with each pharmacist. Cost savings of US$35.73 (95% CI: -11.38–82.84) were estimated for prescribed medications and US$9.91 (95% CI -13.01–32.83) for pathology tests (Table 5). Taking into account all intervention’s components (pharmacists time, GPs time, initial training and practice-change facilitators time), costs savings did not offset total costs, with a difference of US$27.37 (95% CI 0.65–54.09).
| Resources | Mean costs (SEM) | Difference (95% CI) | |
|---|---|---|---|
| MRF (n = 174) | Usual care (n = 150) | ||
| Medications | US$161.86 (10.10) | US$193.34 (12.34) | -US$35.73 (-82.84–11.38)† |
| Pathology tests | US$127.73 (2.46) | US$136.87 (1.66) | -US$9.91 (-32.83–13.01)† |
| Pharmacist time | US$55.14 (1.84) | – | US$59.75 (40.14–79.35)† |
| GPs time | US$12.22 (0.76) | – | US$12.77 (9.39–16.16)† |
| Training | US$2.41 | – | US$2.41 |
| Practice change facilitator | US$2.82 | – | US$2.82 |
| Total | US$368.50 (11.35) | US$329.82 (12.54) | US$27.37 (0.65–54.09)† |
†
Adjusted by clustering and covariates.
GP: General practitioner; MRF: Medication review with follow-up; SEM: Standard error of the mean.
A subset of clusters (three in each arm with 228 patients) had data available of medication-related hospitalizations, specialists’ visits and emergency department visits (Table 6). The GPs’ evaluation of medication-related hospitalizations yielded inter-rater agreement as substantial (Kappa = 0.64 95% CI: 0.38–0.9), moderate (Kappa = 0.43 95% CI 0.15–0.71) and fair (Kappa = 0.30 95% CI −0.01–0.61), while the overall agreement was moderate (Kappa = 0.45 95% CI: 0.35–0.54). With this assessment, it was found that medication-related hospitalizations costs were reduced by 43.53% in the MRF group compared with the usual care arm.
| Resource | MRF | Usual care | ||
|---|---|---|---|---|
| Per patient resource use mean (SD) | Mean costs (SD) | Resource use mean (SD) | Mean costs (SD) | |
| Medication related hospitalizations | 0.06 (0.27) | US$178.15 (921.59) | 0.08 (0.33) | US$315.45 (1449.56) |
| Specialists’ visits | 3.09 (4.86) | US$76.69 (120.61) | 1.56 (2.76) | US$38.63 (68.42) |
| Emergency department visits | 0.36 (0.82) | US$11.91 (27.20) | 0.25 (0.66) | US$8.10 (21.76) |
| Total | 3.51 (5.24) | US$266.74 (949.75) | 1.88 (3.09) | US$362.18 (1469.10) |
n = 228 patients.
MRF: Medication review with follow-up; SD: Standard deviation.
In the base-case cost–effectiveness analysis, 0.063 QALYs were gained, at an additional cost of US$27.37, which yielded an ICER of US$434.4/QALY (Table 7). Uncertainty was assessed by plotting bootstrapped iterations in the cost–effectiveness plane (Figure 2). In this graph, it was observed that 98.8% of the iterations had increased QALYs at additional costs, while 1.2% were dominant (increased QALYs at less cost). All the iterations were located below the cost–effectiveness threshold, therefore were considered cost-effective. In addition, the acceptability curve showed that 50% of the iterations were cost-effective at a threshold of US$473/QALY, reaching 100% at a threshold of US$1700/QALY (Figure 3). Both values are below the suggested cost–effectiveness threshold of US$16 207/QALY.
| Patient group | Incremental QALY (95% CI†) | Incremental costs (95% CI†) | ICER $/QALY (95% CI†) | NE | SE | NW | SW | n |
|---|---|---|---|---|---|---|---|---|
| Base-case§ | 0.063 (0.044–0.082) | US$27.37 (0.65–54.09) | US$434.40 (64.20–996.03) | 98.8% | 1.2% | 0% | 0% | 324 |
| Per-protocol | 0.072 (0.048–0.095) | US$27.27 (-2.22–56.75) | US$380.93 (-7.46–938.99) | 97.5% | 2.5% | 0% | 0% | 283 |
| Hospitalizations, specialists and ED costs | 0.055 (0.031–0.079) | US$9.57 (-31.43–50.57) | US$173.86 (-536.61–1042.18) | 68.2% | 31.8% | 0% | 0% | 228 |
| More than nine medications | 0.11 (0.067–0.16) | US$23.00 (-78.55–124.55) | US$202.18 (-748.90–1205.65) | 59.0% | 41.0% | 0% | 0% | 72 |
| BMI | 0.076 (0.032–0.12) | US$33.12 (-8.85–75.09) | US$437.59 (-26.58–1582.02) | 96.7% | 3.2% | 0.1% | 0% | 101 |
| Type 2 diabetes mellitus | 0.093 (0.061–0.13) | US$45.27 (-5.46–95.99) | US$486.34 (-53.80–1166.76) | 96.5% | 3.5% | 0% | 0% | 180 |
| Older than 75 | 0.044 (0–0.089) | US$41.66 (1.93–81.39) | US$945.218 (-128.09–5091.20) | 96.3%‡ | 2.9% | 0.8% | 0% | 115 |
| Coronary heart disease risk >10% | 0.084 (0.031–0.14) | US$40.14 (-24.58–104.87) | US$476.03 (-228.51–1986.16) | 91.3% | 8.6% | 0.1% | 0% | 110 |
†
Bootstrapped CI.
‡
Four iterations over the cost–effectiveness threshold.
§
Every patient had hypertension.
ED: Emergency department; ICER: Incremental cost–effectiveness ratio; NE: North eastern quadrant; NW: North western quadrant; QALY: Quality-adjusted life years; SE: South eastern quadrant; SW: South western quadrant.
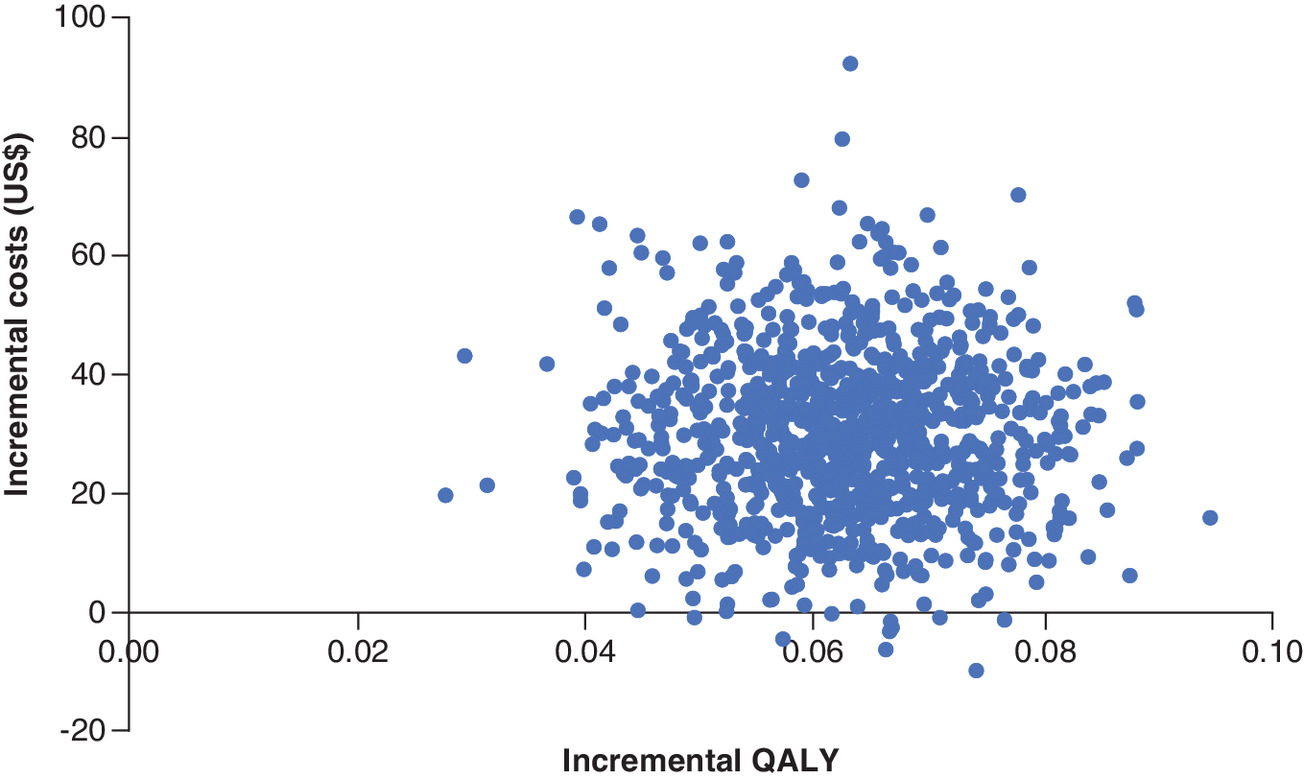
Figure 2. Cost–effectiveness plane of bootstrapped replications from base-case analysis adjusted by clustering and covariates.
QALY: Quality-adjusted life years; US$: United States dollars.
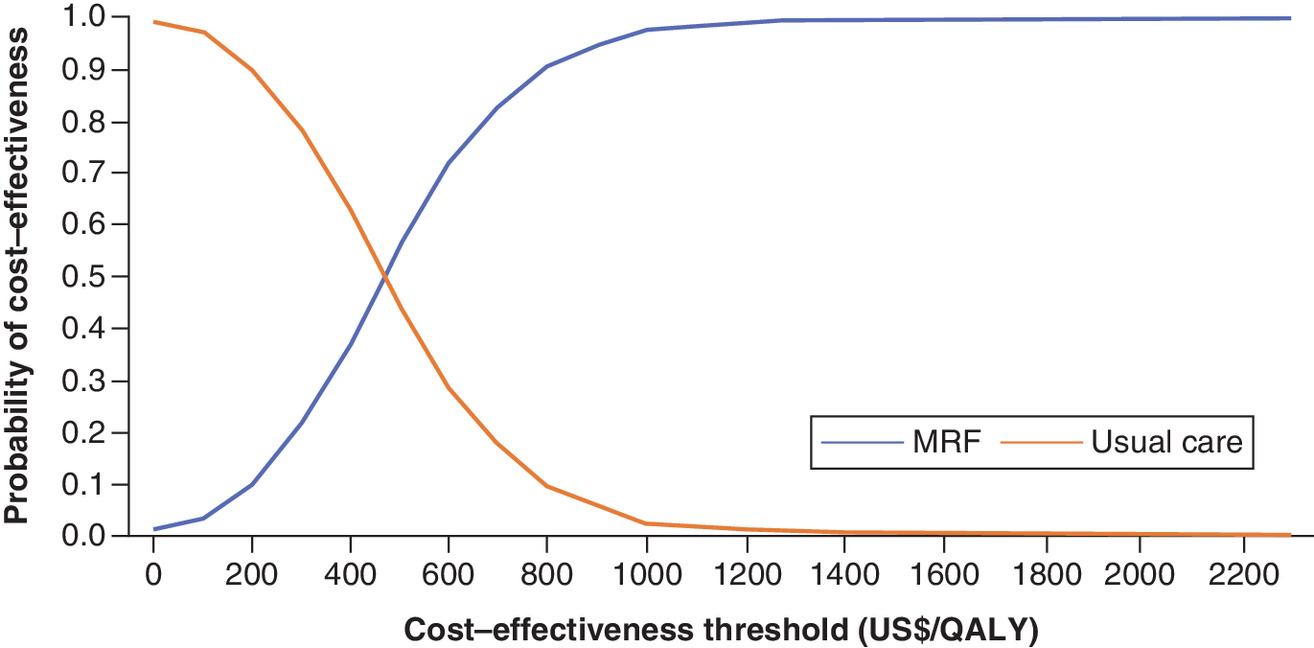
Figure 3. Acceptability curve of bootstrapped replications from base-case analysis adjusted by clustering and covariates.
MRF: Medication review with follow-up; QALY: Quality-adjusted life years; US$: United States dollar.
In the scenario analysis, when the per-protocol (Table 7) or when the maximum likelihood approach to model QALYs (Supplementary Material 3) approaches were assessed, a minimal impact was observed in the ICER. However, it was found that dominant ICER iterations increased to 31.8% when centers with available medication-related hospitalizations, specialists’ visits and emergency department visits data, were evaluated.
The subgroup analysis showed similar results to the base-case analysis (Table 7). When patients with more than nine prescriptions were evaluated, the ICER although similar to the base-case, increased dominant iterations considerably to 41.0%.
Discussion
The present study evaluated the cost–effectiveness of adding a pharmacist-led MRF to usual care compared with usual care alone in preventing CVDs in primary care patients. The evaluation deemed the intervention as cost-effective compared with usual care alone in the base-case analysis from the public healthcare sector perspective. Notably, when additional data was included in the analysis (i.e., hospitalizations, specialists’ visits and emergency department visits), a cost-saving trend was observed, with a higher proportion of dominant iterations. Similar results were obtained in the subgroup analysis of those patients using nine or more prescription medicines.
To the best of our knowledge, this is the first cost–utility analysis alongside a cluster randomized controlled trial of pharmacist-led MRF focused on the prevention of CVDs [22]. Nonetheless, other trial-based cost–utility studies assessing MRFs without the cluster design have been conducted. In Nigeria, Adibe et al. reported a randomized controlled trial of MRF compared with usual care in patients with T2DM treated with oral hypoglycaemic drugs and followed them up for a year [59]. Gains of 0.12 QALYs with incremental costs of $69 were estimated. These values translated to an ICER of US$571/QALY, with 52% of the iterations falling below Nigeria’s suggested cost–effectiveness threshold. Another study in Brazil by Obreli-Neto et al. evaluated MRF compared with usual care in diabetic and hypertensive elderly patients over a period of 3 years [60]. That study showed a health gain of 1.3 QALY at an additional cost of US$77.74 per patient, resulting in an ICER of $59.76/QALY. Sampling uncertainty was not evaluated in that study. All these results are in line with our findings, where the economic evaluation yielded a mean ICER of US$434.40/QALY below the suggested cost–effectiveness threshold. The difference is that our results show less sampling uncertainty yielding 98.8% of the iterations as cost-effective and 1.2% dominant. In addition, it is important to note that these analyses, as well as ours, were conducted in patients with increased CVD risk, such as those with T2DM. This issue was previously described in a study compared the cost–effectiveness of MRF on scenarios that accounted for patients with different CVD risk [61]. They observed in scenarios with a higher risk that MRF compared with usual care tended to be either dominant or with lower ICERs than lower risk scenarios. It may be that the cost–effectiveness of these interventions is more evident in more complex patients.
In the scenario where specialists’ visits, emergency department visits and hospitalizations were evaluated in centers with available data, a significant impact in the cost–effectiveness results were observed. This effect was shown as 31.8% of the iterations were considered dominant. Nonetheless, previous studies have reported that these resources are not usually taken into account in CVD MRF trials. This fact was observed in a systematic review of economic evaluations, where the authors found that hospitalizations were assessed in six out of 11 economic evaluations, while emergency department visits in four [22]. The impact of these resources on economic outcomes has also been observed previously. This impact was reported in a cost–effectiveness analysis in Canada that evaluated MRF in outpatients with T2DM [62]. The authors found overall savings of 190 Canadian dollars which were driven by fewer costs in hospitalizations (407 Canadian dollars). In addition, the uncertainty analysis yielded 66% of iterations as dominant.
Subgroups analyses revealed that patients with more than nine prescribed medications had 41.0% of iterations as dominant. Similar results were observed in a study that included older adults with polypharmacy in the community pharmacy setting, showing that the MRF group was dominant in 96.8% of the iterations [63]. The magnitude of these findings might be explained due to the fact that there is a relationship between polypharmacy and adverse outcomes such as the augmented risk of falls, adverse drug events, hospitalizations and mortality, while decreasing function and cognition [64].
Our results suggest that the implementation of MRF should be considered by decision-makers as a plausible and efficient alternative to approach CVDs, which represents the leading mortality cause in Chile [9]. Integrating MRF would go in line with the primary objective of the Chilean CVD program, which is to improve quality of life, while preventing long-term consequences and mortality associated with CVDs. Furthermore, an intervention focusing in the prevention of CVDs is particularly relevant considering the high annual cost estimations for hypertension, T2DM and dyslipidemia. A report released by the Ministry of Health in Chile shows that they reach between 1.5 and 1.8% of the country’s GDP [9–11]. Moreover, implementing this service could allow an evidence-based, efficient utilization of pharmacists and integrating them in the already established inter-professional family medicine model [14]. It should be noted that although the family medicine model has shown improvements in CVD prevention, this issue still needs to be addressed entirely. Pharmacist-led MRF should be seen as a strategy that might aid in closing that gap using an already available resource.
As an economic evaluation alongside a trial, this study has its limitations. First, the time horizon is constrained to the duration of the trial. This fact is relevant in CVD research as events can occur over patients' lifetime and can cause long-term disability [4]. Second, Cid et al. reported that public price weights might be undervalued compared with the expenses derived from healthcare services [65]. They showed that only 56% of hospital expenses were covered by the actual billing. Third, hospitalization data was not available for the whole study population. However, its impact was assessed in a scenario analysis. Finally, cluster attrition may have increased the risk of bias; nonetheless, the number of lost clusters was similar between groups.
Conclusion
Pharmacist-led MRF in addition to usual care was deemed a cost-effective addition to primary care centers’ compared with usual care alone from the public healthcare sector perspective. This intervention improved health-related quality of life at higher costs, which resulted in an ICER below the cost–effectiveness threshold with a low sampling uncertainty. Efficiency might be maximized prioritizing high-risk groups such as patients with more than nine prescribed medicines. These results encourage the evaluation by policymakers to implement MRF in the public healthcare system as a policy to prevent CVDs. Further evaluations that extrapolate CVDs outcomes to longer time horizons should also be undertaken.
•
International studies have shown that pharmacist-led medication review might be a cost-effective alternative to prevent cardiovascular diseases intervening on its risk factors. Evidence in Latin America is lacking.
•
This study reports the cost–effectiveness analysis from a cluster randomized controlled trial. The trial’s objective was to evaluate the impact of the addition of medication review controlling cardiovascular risk factors of primary care patients compared with usual care alone.
•
Patients were included if they were independent adults, older than 60 years, with moderate or high cardiovascular risk, with five or more prescriptions and member of the cardiovascular prevention program.
•
Benefits were measured as quality-adjusted life years. Costs were estimated from the public healthcare system perspective. This information was used to compute the incremental cost–effectiveness ratio. Sampling uncertainty was handled with bootstrapping.
•
The base-case analysis showed an incremental cost–effectiveness ratio of US$(2019) 434.4/quality-adjusted life year (95% CI 64.2–996.0) with 98.8% of iterations deemed as cost-effective and 1.2% as dominant.
•
Subgroup analysis showed a higher proportion of dominant iterations in patients with more than nine prescriptions (41.0%).
•
Pharmacist-led medication review was deemed as a cost-effective addition to primary care from the public healthcare system perspective.
Author contributions
A Ahumada-Canale, C Vargas, F Martinez-Mardones, C Plaza-Plaza, S Benrimoj and V Garcia-Cardenas contributed to the conception or design of the work. A Ahumada-Canale, C Vargas, C Balmaceda, F Martinez-Mardones and S Benrimoj contributed to the acquisition, analysis or interpretation of data for the work. A Ahumada-Canale drafted the manuscript. Everyone critically revised the manuscript. Everyone gave final approval and agree to be accountable for all aspects of work ensuring integrity and accuracy.
Acknowledgments
We would like to acknowledge Dr Prado, Dr Cubillos and Dr Cofré for evaluating the hospitalizations.
Financial & competing interests disclosure
The authors have no relevant affiliations or financial involvement with any organization or entity with a financial interest in or financial conflict with the subject matter or materials discussed in the manuscript. This includes employment, consultancies, honoraria, stock ownership or options, expert testimony, grants or patents received or pending, or royalties.
No writing assistance was utilized in the production of this manuscript.
Ethical conduct of research
The authors state that ethics approval was obtained from the Human Research Ethics Committee of the University of Technology Sydney (ETH17-1346). All participants signed the informed consent form.
Data sharing statement
The authors certify that this manuscript reports original clinical trial data. The data will not be made publicly available.
Supplementary Material
File (suppl_file.docx)
- Download
- 1.06 MB
References
1.
Roth GA, Abate D, Abate KH et al. Global, regional, and national age-sex-specific mortality for 282 causes of death in 195 countries and territories, 1980–2017: a systematic analysis for the Global Burden of Disease Study 2017. Lancet 392(10159), 1736–1788 (2018).
2.
Kyu HH, Abate D, Abate KH et al. Global, regional, and national disability-adjusted life-years (DALYs) for 359 diseases and injuries and healthy life expectancy (HALE) for 195 countries and territories, 1990–2017: a systematic analysis for the Global Burden of Disease Study 2017. Lancet 392(10159), 1859–1922 (2018).
3.
Bloom DE, Cafiero ET, Jané-Llopis E et al. The Global Economic Burden of Non-Communicable Diseases. World Economic Forum, Switzerland, Geneva, (2011).
4.
Arnett DK, Blumenthal RS, Albert MA et al. 2019 ACC/AHA Guideline on the Primary Prevention of Cardiovascular Disease: a report of the American College of Cardiology/American Heart Association Task Force on Clinical Practice Guidelines. 140, e596–e646 (2019).
5.
ADA. Standards of Medical Care in Diabetes-2020. Diabetes Care 43(January), S205–S206 (2020).
6.
Grundy SM, Stone NJ, Bailey AL et al. 2018 AHA/ACC/AACVPR/AAPA/ABC/ACPM/ADA/AGS/APhA/ASPC/NLA/PCNA Guideline on the Management of Blood Cholesterol: a report of the American College of Cardiology/American Heart Association Task Force on Clinical Practice Guidelines. J. Am. Coll. Cardiol. 73(24), e285–e350 (2019).
7.
Whelton PK, Carey RM, Aronow WS et al. 2017 ACC/AHA/AAPA/ABC/ACPM/AGS/APhA/ASH/ASPC/NMA/PCNA Guideline for the Prevention, Detection, Evaluation, and Management of High Blood Pressure in Adults: a report of the American College of Cardiology/American Heart Association Task Force on Clinical Pr. J. Am. Coll. Cardiol. 71(19), e127–e248 (2018).
8.
Seron P, Irazola V, Rubinstein A et al. Ideal cardiovascular health in the southern cone of Latin America. Public Health 156(56), 132–139 (2018).
9.
Chile Ministry of Health. Guidelines for the pharmacy fund for non-communicable diseases in primary care. 1–47 (2019). https://farmaciassc.files.wordpress.com/2019/07/orientacion-tc389cnica-fofar-2019-final-v3-002.pdf
10.
Chile Ministry of Health. Chilean National Health Survey 2016–2017 V2. 1–59 (2018). www.minsal.cl/wp-content/uploads/2018/01/2-Resultados-ENS_MINSAL_31_01_2018.pdf
11.
Chile Ministry of Health. Chilean National Health Survey 2016–2017 V1. 1–61 (2017). http://web.minsal.cl/wp-content/uploads/2017/11/ENS-2016-17_PRIMEROS-RESULTADOS.pdf
12.
Chilean Health Superintendency. Private insured patients report 1990–2017 (2019). www.supersalud.gob.cl/documentacion/666/w3-propertyvalue-3724.html
13.
FONASA. ‘Statistics Bulletin’. https://www.fonasa.cl/sites/fonasa/documentos
14.
PAHO/WHO. Renewing primary health care in the Americas. 1–48 (2007). www.paho.org/hq/dmdocuments/2010/Renewing_Primary_Health_Care_Americas-PAHO.pdf
15.
Chile Ministry of Health. Implementation guidelines of the family medicine model. 1–143 (2012). http://web.minsal.cl/portal/url/item/e7b24eef3e5cb5d1e0400101650128e9.pdf
16.
Chile Ministry of Health. Cardiovascular health program Guidelines 2017. 1–85 (2017). www.redcronicas.cl/wrdprss_minsal/wp-content/uploads/2017/08/OT-PROGRAMA-DE-SALUD-CARDIOVASCULAR_03.pdf
17.
Ferrer-lues M, Daigre ML, Valdes I. Final report of Chilean Government programs: the pharmacy fund. 1–131 (2018). www.dipres.gob.cl/597/articles-177366_informe_final.pdf
18.
Bossert TJ, Leisewitz T. Innovation and change in the Chilean health system. N. Engl. J. Med. 374(1), 1–5 (2016).
19.
PAHO/WHO. Primary Care Based pharmacy services. Position Paper of the PAHO/WHO. 1–106 (2013). www.paho.org/hq/dmdocuments/2013/SerieRAPSANo6-2013.pdf
20.
Martínez-Mardones F, Fernandez-Llimos F, Benrimoj SI et al. Systematic review and meta-analysis of medication reviews conducted by pharmacists on cardiovascular diseases risk factors in ambulatory care. J. Am. Heart Assoc. 8(22), e013627 (2019).
21.
Drummond M, Sculpher M, Claxton K, Stoddart G, Torrance G. Principles of economic evaluation Oxford. Methods for the Economic Evaluation of Health Care Programmes (Chapter 4) (4th Edition). Oxford University Press, UK, (2015).
22.
Ahumada-Canale A, Quirland C, Martinez-Mardones F, Plaza-Plaza JC, Benrimoj S, Garcia-Cardenas V. Economic evaluations of pharmacist-led medication review in outpatients with hypertension, type 2 diabetes mellitus, and dyslipidaemia: a systematic review. Eur. J. Heal. Econ. 20(7), 1103–1116 (2019).
23.
Maher RL, Hanlon J, Hajjar ER. Clinical consequences of polypharmacy in elderly. Expert Opin. Drug Saf. 13(1), 57–65 (2014).
24.
Chile Ministry of Health. Preventive examination for older adults. 1–16 (2010). www.minsal.cl/portal/url/item/ab1f81f43ef0c2a6e04001011e011907.pdf
25.
Icaza G, Núñez L, Marrugat J et al. Estimation of coronary heart disease risk in Chilean subjects based on adapted Framingham equations. Rev. Med. Chil. 137(10), 1273–1282 (2009).
26.
Scottish Government Polypharmacy Model of Care Group. Polypharmacy Guidance, Realistic Prescribing. (3rd Edition). 1–85 (2018). http://dghstatistiques.ci/assets/documents/annuaire/Annuaire-DGH-2018-v3.pdf
27.
PCRG (Pharmaceutical Care Research Group). Pharmacotherapy follow-up: The Dader method (3rd revision). Pharm. Pract. (Granada) 4(1), 44–53 (2006).
28.
Hoffmann TC, Glasziou PP, Boutron I et al. Better reporting of interventions: template for intervention description and replication (TIDieR) checklist and guide. BMJ 348(March), 1–12 (2014).
29.
Ocampo CC, Garcia-Cardenas V, Martinez-Martinez F, Benrimoj SI, Amariles P, Gastelurrutia MA. Implementation of medication review with follow-up in a Spanish community pharmacy and its achieved outcomes. Int. J. Clin. Pharm. 37(5), 931–940 (2015).
30.
Vella J. Twelve Principles for Effective Adult Learning Jossey-Bass. Learning to Listen, Learning to Teach (Chapter 1). CA, USA, (2002).
31.
Vella J. ]Part Two: Lessons Learned from Practice, Jossey-Bass. Training through Dialogue. CA, USA, (1995).
32.
Garcia-Cardenas V, Perez-Escamilla B, Fernandez-Llimos F, Benrimoj SI. The complexity of implementation factors in professional pharmacy services. Res. Soc. Adm. Pharm. 14(5), 498–500 (2018).
33.
Castillo Riquelme M, Castillo Laborde C, Loayza Saldivia S, Aravena Pastén M. Methodological Guideline of economic evaluations of health technologies in Chile. 1–268 (2013). https://desal.minsal.cl/wp-content/uploads/2013/09/EE_FINAL_web.pdf
34.
Husereau D, Drummond M, Petrou S et al. Consolidated Health Economic Evaluation Reporting Standards (CHEERS)--explanation and elaboration: a report of the ISPOR Health Economic Evaluation Publication Guidelines Good Reporting Practices Task Force. Value Health 16(2), 231–250 (2013).
35.
Brooks R, De Charro F. EuroQol: the current state of play. Health Policy (New York) 37(1), 53–72 (1996).
36.
Zarate V, Kind P, Valenzuela P, Vignau A, Olivares-Tirado P, Munoz A. Social valuation of EQ-5D health states: the Chilean case. Value Heal. 14(8), 1135–1141 (2011).
37.
Manca A, Hawkins N, Sculpher MJ. Estimating mean QALYs in trial-based cost-effectiveness analysis: the importance of controlling for baseline utility. Health Econ. 14(5), 487–496 (2005).
38.
Chile congress library. ‘Municipal Primary Health Care Law’ (2016). www.leychile.cl/Navegar?idNorma=30745
39.
FONASA. ‘Institucional Care Modality’ (2019). www.fonasa.cl/sites/fonasa/mobile/prestadores/normativa/aranceles
40.
Chile Ministry of Health. ‘CENABAST updated prices’ (2019). www.cenabast.cl/precios-vigentes-en-contratos/
41.
Aguila A, Muñoz M, Sepúlveda V. Implementation of diagnosis related groups methodology in a university hospital. Rev Med Chil 147(12), 1518–1526 (2019).
42.
Malet-Larrea A, Goyenechea E, García-Cárdenas V et al. The impact of a medication review with follow-up service on hospital admissions in aged polypharmacy patients. Br. J. Clin. Pharmacol. 82(3), 831–838 (2016).
43.
Cohen J. A coefficient of agreement for nominal scales. Educ. Psychol. Meas. 20, 37–46 (1960).
44.
Fleiss J. The Measurement of Interrater Agreement. Statistical Methods for Rates and Proportions (Chapter 18). John Wiley & Sons, NY, USA (2003).
45.
Landis JR, Koch GG. The measurement of observer agreement for categorical data. Biometrics 33(1), 159–174 (1977).
46.
Shemilt I, Thomas J, Morciano M. A web-based tool for adjusting costs to a specific target currency and price year. Evid. Policy 6(1), 51–59 (2010).
47.
IMF. ‘World Economic Outlook Database’ (2018). www.imf.org/external/pubs/ft/weo/2019/01/weodata/index.aspx
48.
Faria R, Gomes M, Epstein D, White IR. A guide to handling missing data in cost-effectiveness analysis conducted within randomised controlled trials. Pharmacoeconomics 32(12), 1157–1170 (2014).
49.
Rubin D. Randomization-Based Evaluations. Multiple Imputation for Nonresponse in Surveys (Chapter 4). John Wiley & Sons, NY, USA (2004).
50.
Gomes M, Grieve R, Nixon R, Ng S-W E, Carpenter J, Thompson S. Methods for covariate adjustment in cost–effectiveness analysis that use cluster randomised trials. Health Econ. 21(9), 1101–1118 (2012).
51.
Chaurasia A, Harel O. Using AIC in multiple linear regression framework with multiply imputed data. Heal. Serv. Outcomes Res. Methodol. 12(2–3), 219–233 (2012).
52.
De Leeuw J, Meijer E. Resampling Multilevel Models. Handbook of Multilevel Analysis (Chapter 11). Springer Science+Business Media, NY, USA (2008).
53.
Desgagné A, Castilloux A-M, Angers J-F, LeLorier J. The use of the bootstrap statistical method for the pharmacoeconomic cost analysis of skewed data. Pharmacoeconomics 13(5), 487–497 (1998).
54.
Briggs A, Fenn P. Confidence intervals or surfaces? Uncertainty on the cost–effectiveness plane. Health Econ. 7(8), 723–740 (1998).
55.
Palmer S, Raftery J. Economic notes; opportunity costs. BMJ 318(7197), 1551–1552 (1999).
56.
WHO world health organization. Macroeconomics and health: investing in health for economic development: executive summary/report of the Commission on Macroeconomics and Health. 1–20 (2001). https://apps.who.int/iris/handle/10665/42463
57.
The World Bank. ‘GDP per capita’ (2018). https://data.worldbank.org/indicator/NY.GDP.PCAP.CD?locations=CL
58.
Fenwick E, O'Brien BJ, Briggs A. Cost–effectiveness acceptability curves – facts, fallacies and frequently asked questions. Health Econ. 13(5), 405–415 (2004).
59.
Adibe MO, Aguwa CN, Ukwe CV. Cost-utility analysis of pharmaceutical care intervention versus usual care in management of Nigerian patients with Type 2 diabetes. Value Heal. Reg. Issues 2(2), 189–198 (2013).
60.
Obreli-Neto PR, Marusic S, Guidoni CM et al. Economic evaluation of a pharmaceutical care program for elderly diabetic and hypertensive patients in primary health care: a 36-month randomized controlled clinical trial. J. Manag. Care Pharm. 21(1), 66–75 (2015).
61.
Kulchaitanaroaj P, Brooks JM, Chaiyakunapruk N, Goedken AM, Chrischilles EA, Carter BL. Cost-utility analysis of physician–pharmacist collaborative intervention for treating hypertension compared with usual care. J. Hypertens. 35(1), 178–187 (2017).
62.
Simpson SH, Lier DA, Majumdar SR et al. Cost-effectiveness analysis of adding pharmacists to primary care teams to reduce cardiovascular risk in patients with Type 2 diabetes: results from a randomized controlled trial. Diabet. Med. 32(7), 899–906 (2015).
63.
Jódar-Sánchez F, Malet-Larrea A, Martín JJ et al. Cost-utility analysis of a medication review with follow-up service for older adults with polypharmacy in community pharmacies in spain: the conSIGUE program. Pharmacoeconomics 33(6), 599–610 (2015).
64.
Fried TR, O'Leary J, Towle V, Goldstein MK, Trentalange M, Martin DK. Health outcomes associated with polypharmacy in community-dwelling older adults: a systematic review. J. Am. Geriatr. Soc. 62(12), 2261–2272 (2014).
65.
Cid Pedraza C, Bastías SG. Evaluation of financial status of public hospitals considering the updated costs of their services. Rev. Med. Chil. 142(2), 161–167 (2014).
Information & Authors
Information
Published In
Pages: 229 - 242
PubMed: 33543637
Copyright
© 2021 Future Medicine Ltd.
History
Received: 10 August 2020
Accepted: 27 November 2020
Published online: 5 February 2021
Keywords:
Topics
Authors
Metrics & Citations
Metrics
Article Usage
Article usage data only available from February 2023. Historical article usage data, showing the number of article downloads, is available upon request.
Citations
How to Cite
Medication review with follow-up for cardiovascular outcomes: a trial based cost–utility analysis. (2021) Journal of Comparative Effectiveness Research. DOI: 10.2217/cer-2020-0171
Export citation
Select the citation format you wish to export for this article or chapter.
Citing Literature
- Ying Zhang, Zhaoyan Chen, Xi Chen, Fangyuan Tian, Economic Evaluation of Deprescribing in Older Adults: A Systematic Review, Value in Health, 10.1016/j.jval.2025.10.001, 29, 3, (521-529), (2026).
- Miriam E. Craske, Wendy Hardeman, Nicholas Steel, Michael J Twigg, Components of pharmacist-led medication reviews and their relationship to outcomes: a systematic review and narrative synthesis, BMJ Quality & Safety, 10.1136/bmjqs-2024-017283, 33, 12, (808-822), (2024).
- Emilia Price, Andi Shirtcliffe, Thelma Fisher, Martin Chadwick, Carlo A Marra, A systematic review of economic evaluations of pharmacist services, International Journal of Pharmacy Practice, 10.1093/ijpp/riad052, 31, 5, (459-471), (2023).
- Sónia Romano, Débora Figueira, Inês Teixeira, Julian Perelman, Deprescribing Interventions among Community-Dwelling Older Adults: A Systematic Review of Economic Evaluations, PharmacoEconomics, 10.1007/s40273-021-01120-8, 40, 3, (269-295), (2021).