The prevalence, disease characteristics and treatment of chronic venous disease: an international web-based survey
Publication: Journal of Comparative Effectiveness Research
Abstract
Aim: This study assessed the characteristics of individuals with chronic venous disease (CVD) and their treatment pathways. Materials & methods: A web-based survey enrolled representative populations of adults from Brazil, Czech Republic, France, Hungary, Italy, Romania, Russia and Spain, and identified those self-reporting CVD. Results: A total of 22% of respondents had signs/symptoms of CVD. Individuals with CVD were generally older, female and obese, and had more comorbidities than the general population. Common initial symptoms were tiredness, heaviness, pain, swelling in legs and night cramps. Participants waited ∼1 year before seeking treatment but most did not initially consult a physician; those who did tended to have more severe disease. Conclusion: One in five adults had CVD, but most did not seek a physician's help.
Chronic venous disease (CVD) is a condition characterized by morphological and functional abnormalities of the venous system that persist over prolonged periods of time [1]. CVD primarily affects the legs and its signs and symptoms may include heaviness, tiredness, telangiectasia, varicose veins, edema, itching, pain, nocturnal cramps, venous eczema, ankle skin hyperpigmentation, atrophie blanche, lipodermatosclerosis and venous ulcers [2,3]. The differential diagnosis must exclude other potential causes of signs and symptoms, such as systemic diseases (e.g., heart failure), adverse drug reactions, lymphedema, musculoskeletal conditions, or arterial disease [4]. The pathophysiological changes that underlie CVD include persistent ambulatory venous hypertension and the resulting inflammation [2].
Risk factors for CVD include genetic predisposition, age, female sex, height, obesity, standing for prolonged periods of time and pregnancy [2]. According to the widely used CEAP (Clinical-Etiology-Anatomy-Pathophysiology) classification, the clinical picture of CVD can range from C0 (no visible or palpable signs) to C6 (active venous ulcer) [5]. CVD is associated with decreased quality of life and results in a substantial financial burden due to direct costs, including investigations and treatment, as well as indirect costs such working days lost [6–8].
The prevalence of CVD increases with age and it is more common in women than men [2]. However, estimates of CVD prevalence vary widely from study to study (15–80%) due to differences in study design and target population [9–14], and there is evidence that CVD is underdiagnosed and undertreated, especially at lower severity levels.
In order to improve treatment practices and outcomes, there is a need to assess the prevalence of CVD in a representative sample of the general population, and to examine the way it is managed. The objective of the present study was to estimate the prevalence of CVD, based on self-reported signs and symptoms, across a range of countries and to describe the profile of individuals with this condition and the treatment pathways they followed over time.
Materials & methods
Survey design
The study was conducted by Harris Interactive (Paris, France), a market research company, using a web-based, custom, adaptive survey (Supplementary Appendix). The survey was developed by Harris Interactive and consisted of two parts: the first part contained questions about participant profile and CVD characteristics, while the second part contained questions about the CVD treatment pathway. Participants' responses to the questionnaire were the only data collected during the survey and no other investigations were undertaken.
After recruitment of about 10% of the total sample in each country, Harris Interactive checked the logical flow of the questionnaire (no missing filters), and assessed the wording of the questions to ensure that the objectives were being met. Questions could be refined at that time, if needed, before deploying the questionnaire to the entire sample.
Study participants
Participants were recruited for this survey from December 2017 to February 2018 via the Toluna Global Panel (an online platform of panelists willing to participate in surveys created and managed by the company Toluna). Investigators were blinded to the recruitment process. Individuals aged ≥18 years who resided in Brazil, Czech Republic, France, Hungary, Italy, Romania, Russia or Spain, and who could speak and read the local language, were eligible for inclusion in the study. A quota sampling method was used to ensure that the sample populations were nationally representative in terms of sex, age and geographic region, based on sources for national statistics such as the National Institute of Statistics and Economic studies (INSEE) in France. The target sample size was a minimum of 2000 individuals from each country, for a total of at least 16,000 individuals. This sample size was estimated on the basis of the expected prevalence of CVD [9–14] and the percentage of responders to surveys of this kind. Within the cohort of individuals from the general population, participants were asked about the presence of varicose veins and/or heavy/tired/swollen leg problems or specific predefined signs or symptoms of CVD. The symptoms included pain, swollen or heavy legs, small dilated blood vessels (thread veins, spider veins or broken veins), varicose veins, swollen ankles due to varicose veins or hidden varicose veins, skin damage due to varicose veins or hidden varicose veins and venous leg ulcer. Because this survey relied on participant reports, we could not confirm the diagnosis of CVD or use CEAP to categorize disease severity. In order to analyze CVD treatment pathways in greater detail, additional sample populations were recruited from Brazil, France, Italy, Russia and Spain. These populations were recruited using the same eligibility criteria as the general population; however, they were not intended to be nationally representative.
Endpoints & outcome measurements
Prespecified endpoints of the study included the prevalence of CVD in the general population overall and in the individual countries surveyed, determination of the profile of individuals with CVD, as well as disease characteristics and treatment pathways.
The level of CVD severity was determined by the participants' self-report of their perceived signs and symptoms (Table 1). The frequency of CVD symptoms was categorized as rare, occasional, frequent, very frequent or constant (Table 1). Respondents were classified as having normal weight (body mass index [BMI] <25 kg/m2), being overweight (25–29 kg/m2) or being obese (>30 kg/m2).
| Classification | Definitions |
|---|---|
| CVD severity | |
| Low | Presence of leg pain, or swollen or heavy legs with no visible symptoms, or the presence of telangiectasia |
| Moderate | Presence of varicose veins, or swollen ankles (edema) due to varicose veins or hidden varicose veins |
| High | Presence of skin damage due to varicose veins or hidden varicose veins, or venous ulcer |
| Frequency of CVD symptoms | |
| Rare | Once per year |
| Occasional | 2–5-times per year |
| Frequent | 6–12-times per year |
| Very frequent | >12-times per year |
| Constant | Present all the time |
CVD: Chronic venous disease.
In order to gain an understanding of treatment pathways, information was collected regarding the steps respondents took to find information about CVD (online, or from friends/relatives, a pharmacist or healthcare professionals) and any resultant interventions (nonpharmacological remedies, lifestyle changes, medicines or other medical procedures [e.g., surgery or laser therapy]). A treatment step was defined as initiation of a new treatment, with the duration of each step measured from the start of the treatment until it was stopped or modified by the addition of a new therapy or switch to a different therapy. The number and duration of each step, as well as participant satisfaction with treatment received during that step, were evaluated. A sequence of treatment steps over time was defined as the treatment pathway. CVD therapies were classified into three categories: nonpharmacological therapies and lifestyle changes, medicinal products and drugs, and interventions. Nonpharmacological therapies and lifestyle changes included increased physical activity, massage, avoiding sitting or standing for prolonged periods of time, compression stockings/elastic socks, cold showers, dietary changes (food/hydration, avoiding spicy food), behavioral changes (improved posture and skin hygiene, avoiding carrying heavy objects), avoidance of restrictive clothing (tight girdles or belts) or the stopping of certain drugs (hormones). Medicinal products and drugs included creams, ointments and gels, oral venoactive drugs (VADs; in the form of tablets, oral solutions, capsules, ampoules), food supplements, phytotherapy or homeopathy. Interventions included surgery (vein ligation and stripping, microincision or ambulatory phlebectomy, bypass surgery), endovenous laser treatment or thermal ablation, and sclerotherapy.
Ethics
Before starting the survey, participants were asked to consent to sharing some medical and health information about themselves (see Supplementary Appendix for survey questions). If they did not consent, the survey was stopped. Participants' data were used in a general and anonymized manner for the purposes of this study only, and were not provided to any third party. As this was not an investigation of clinical outcomes with any particular intervention, neither Ethics Committee approval nor clinical trial registration was required.
Statistical methods
Harris Interactive analyzed the results of the survey. Descriptive statistics (i.e., totals, percentages, means and standard deviations [SD]) were calculated for demographic and disease data. The prevalence of CVD was calculated as the proportion of the overall population with symptoms of CVD as reported by survey participants.
Statistical comparisons were undertaken between a number of different groups of respondents, including between the CVD population and the general population, between the global CVD population and national CVD populations, and between the global CVD population and subgroups of the CVD population (e.g., those who consulted a physician, those who sought information by themselves, subgroups based on treatment steps). These comparisons were made using two-sided z-tests, with a significance threshold of p < 0.05, using the Daisie software (ADN SAS, Paris, France [15]). Missing values were excluded from the calculation. Analyses were not conducted on groups with a sample size of <30 individuals. Data are available on request from Harris interactive.
Results
Prevalence of CVD
A total of 16,015 individuals were recruited into the general population of the study (Table 1); of these, 3530 individuals (22.0%) had self-reported CVD. The prevalence of CVD ranged from 14% in France to 37% in Russia. In the remaining countries, the prevalence of CVD was approximately 18–25%: 25% in Romania, 24% in Italy, 21% in Czech Republic, 19% in Brazil, 19% in Spain and 18% in Hungary.
Profile of individuals with CVD
Compared with the general population, the cohort with CVD contained a significantly higher proportion of females (66 vs 52%) and obese individuals (26 vs 19%), had a higher mean age (46.9 vs 44.9 years), had more comorbidities on average (2.9 vs 1.3), and their jobs or other daily activities more often required standing (47 vs 43%) (Table 2). Comorbidities that occurred at a significantly higher prevalence in the CVD population than in the general population included psoriasis (8 vs 5%), asthma (10 vs 7%), hemorrhoids (28 vs 15%), hypertension (37 vs 25%), depression (26 vs 15%), allergy (37 vs 23%) and diabetes (12 vs 8%; all p < 0.05). In addition, the proportion of women who had been pregnant was significantly higher among individuals with CVD than in the general population (75 vs 68%; p < 0.05).
| General population (n = 16,015), n (%) | CVD population (n = 3530), n (%) | p-Value† | |
|---|---|---|---|
| Sex: | |||
| Male | 7714 (48) | 1200 (34) | <0.05 |
| Female | 8301 (52) | 2330 (66) | <0.05 |
| Age (years): | |||
| Mean ± SD | 44.9 ± 14.8 | 46.9 ± 13.4 | <0.05 |
| Median | 44.8 | 47.3 | |
| Age categories: | |||
| 18–40 years | 6562 (41) | 1199 (34) | <0.05 |
| 41–60 years | 6770 (42) | 1761 (50) | <0.05 |
| >60 years | 2683 (17) | 570 (16) | NS |
| BMI categories: | |||
| Normal (<25 kg/m2) | 7675 (48) | 1489 (42) | <0.05 |
| Overweight (25–29 kg/m2) | 5334 (33) | 1136 (32) | NS |
| Obese (>30 kg/m2) | 3006 (19) | 905 (26) | <0.05 |
| Comorbidities: | |||
| Hypertension | 3948 (25) | 1309 (37) | <0.05 |
| Allergy | 3762 (23) | 1299 (37) | <0.05 |
| Hemorrhoidal disease | 2407 (15) | 977 (28) | <0.05 |
| Depression | 2467 (15) | 935 (26) | <0.05 |
| Diabetes | 1357 (8) | 413 (12) | <0.05 |
| Asthma | 1114 (7) | 349 (10) | <0.05 |
| Psoriasis | 840 (5) | 287 (8) | <0.05 |
| Cancer (of whatever organ) | 278 (2) | 69 (2) | NS |
| Crohn's disease | 125 (1) | 48 (1) | NS |
| Hematologic disease/blood cancer | 122 (1) | 52 (1) | NS |
| None of the above | 5440 (34) | 0 | <0.05 |
| Number of comorbidities: | |||
| Mean ± SD | 1.3 ± 1.4 | 2.9 ± 1.6 | <0.05 |
| Median | 0.52 | 2.06 | |
| History of pregnancy†,‡: | 5660 (68) | 1742 (75) | <0.05 |
| Physical activity: | |||
| Not regular§ | 10,746 (67) | 2364 (67) | NS |
| Regular¶ | 5269 (33) | 1166 (33) | NS |
| Standing during the day: | |||
| Yes# | 6881 (43) | 1653 (47) | <0.05 |
| No† † | 9134 (57) | 1877 (53) | <0.05 |
| Income: | |||
| Low | 4118 (26) | 825 (23) | <0.05 |
| Medium | 6756 (42) | 1460 (41) | NS |
| High | 5141 (32) | 1245 (35) | <0.05 |
†
Z-test.
‡
Denominator is the number of women (8301 in the general population and 2330 in the CVD population).
§
Respondents indicated that they did not undertake regular physical exercise or exercised once or twice a week.
¶
Respondents indicated that they exercised three- or four-times per week or did daily physical exercise.
#
Respondents indicated that they had a job that required them to be constantly, almost constantly or frequently standing.
††
Respondents indicated that they had a job that required them to be standing occasionally or rarely.
CVD: Chronic venous disease; NS: Not significant; SD: Standard deviation.
CVD characteristics
In most individuals with CVD, the disease was of low (46%) or medium (42%) severity, the symptoms appeared rarely or occasionally (27%), frequently or very frequently (56%) or constantly (17%). Each episode commonly lasted <1 week in most participants (57%) (Table 3). The duration of CVD was <1 year in 14%, 1–<5 years in 50% and ≥5 years in 36% of individuals with CVD. Symptoms appeared regardless of the season in 57% of individuals with CVD. In the rest, summer was the most common season during which CVD symptoms appeared (29%). A family history of CVD was present in 73% of the CVD population.
| Total (n = 3530), n (%) | France (n = 271), n (%) | Italy (n = 479), n (%) | Spain (n = 380), n (%) | Brazil (n = 373), n (%) | Russia (n = 742), n (%) | Romania (n = 494), n (%) | Hungary (n = 363), n (%) | Czech Republic (n = 428), n (%) | |
|---|---|---|---|---|---|---|---|---|---|
| Family history of CVD: | |||||||||
| Yes | 2566 (73) | 187 (69) | 371 (77)† | 268 (71) | 281 (75) | 606 (82)† | 334 (68)† | 276 (76) | 243 (57)† |
| No | 488 (14) | 46 (17) | 59 (12) | 58 (15) | 44 (12) | 55 (7)† | 91 (18)† | 40 (11) | 95 (22)† |
| Do not know | 476 (13) | 38 (14) | 49 (10)† | 54 (14) | 48 (13) | 81 (11)† | 69 (14) | 47 (13) | 90 (21)† |
| Disease severity: | |||||||||
| Low | 1618 (46) | 126 (46) | 208 (43) | 173 (46) | 207 (55)† | 378 (51)† | 233 (47) | 120 (33)† | 173 (40)† |
| Medium | 1498 (42) | 109 (40) | 194 (41) | 167 (44) | 120 (32)† | 261 (35)† | 222 (45) | 216 (60)† | 209 (49)† |
| High | 414 (12) | 36 (13) | 77 (16)† | 40 (11) | 46 (12) | 103 (14) | 39 (8)† | 27 (7)† | 46 (11) |
| Mean number of pregnancies | 1.99 | 2.13 | 2.05 | 1.98 | 2.01 | 1.82† | 1.72† | 2.25† | 2.24† |
| Time to first CVD symptoms: | |||||||||
| <1 year | 474 (14) | 35 (13) | 60 (13) | 72 (19)† | 68 (18)† | 59 (8)† | 67 (14) | 50 (14) | 63 (15) |
| 1–<5 years | 1773 (50) | 120 (44)† | 251 (52) | 177 (47) | 202 (54) | 411 (55)† | 273 (55)† | 155 (43)† | 184 (43)† |
| ≥5 years | 1283 (36) | 116 (43)† | 168 (35) | 131 (34) | 103 (28)† | 272 (37) | 154 (31)† | 158 (43)† | 181 (42)† |
| Symptoms frequency: | |||||||||
| Rarely or occasionally | 956 (27) | 66 (24) | 126 (26) | 110 (29) | 76 (20)† | 197 (27) | 163 (33)† | 95 (26) | 123 (29) |
| Constantly | 585 (17) | 35 (13) | 50 (10)† | 38 (10)† | 104 (28)† | 128 (17) | 80 (16) | 95 (26)† | 55 (13)† |
| Frequently or very frequently | 1989 (56) | 170 (63)† | 303 (63)† | 232 (61)† | 193 (52) | 417 (56) | 251 (51)† | 173 (48)† | 250 (58) |
| Season when symptoms occur: | |||||||||
| Spring | 518 (15) | 57 (21)† | 109 (23)† | 82 (22)† | 36 (10)† | 109 (15) | 46 (9)† | 35 (10)† | 44 (10)† |
| Summer | 1017 (29) | 117 (43)† | 202 (42)† | 168 (44)† | 134 (36)† | 126 (17)† | 88 (18)† | 82 (23)† | 100 (23)† |
| Autumn | 480 (14) | 44 (16) | 61 (13) | 50 (13) | 29 (8)† | 132 (18)† | 59 (12) | 40 (11) | 65 (15) |
| Winter | 446 (13) | 44 (16) | 63 (13) | 42 (11) | 47 (13) | 88 (12) | 73 (15) | 27 (7)† | 62 (14) |
| Regardless of season | 2014 (57) | 120 (44)† | 210 (44)† | 172 (45)† | 208 (56) | 478 (64)† | 318 (64)† | 241 (66)† | 267 (62)† |
| Typical duration of episode: | |||||||||
| <1 week | 2006 (57) | 148 (55) | 294 (61)† | 195 (51)† | 212 (57) | 415 (56) | 312 (63)† | 176 (48)† | 254 (59) |
| 1–4 weeks | 618 (18) | 58 (21) | 91 (19) | 84 (22)† | 61 (16) | 135 (18) | 57 (12)† | 69 (19) | 63 (15) |
| >4 weeks | 906 (26) | 65 (24) | 94 (20)† | 101 (27) | 100 (27) | 192 (26) | 125 (25) | 118 (33)† | 111 (26) |
†
p < 0.05 vs total CVD population (all countries conglomerated).
CVD: Chronic venous disease.
Compared with the overall CVD population, low CVD severity was more common in Brazil and Russia, while high severity was more common in Italy. The proportion of respondents with CVD who reported mostly summertime symptoms was significantly higher in France (43%), Italy (42%), Spain (44%) and Brazil (36%) than in the overall CVD population, whereas the occurrence of symptoms irrespective of season was significantly more common in Russia (64%), Romania (64%), Hungary (66%) and Czech Republic (62%). A family history of CVD was significantly more common in Russia (82%) and Italy (77%).
Treatment pathways
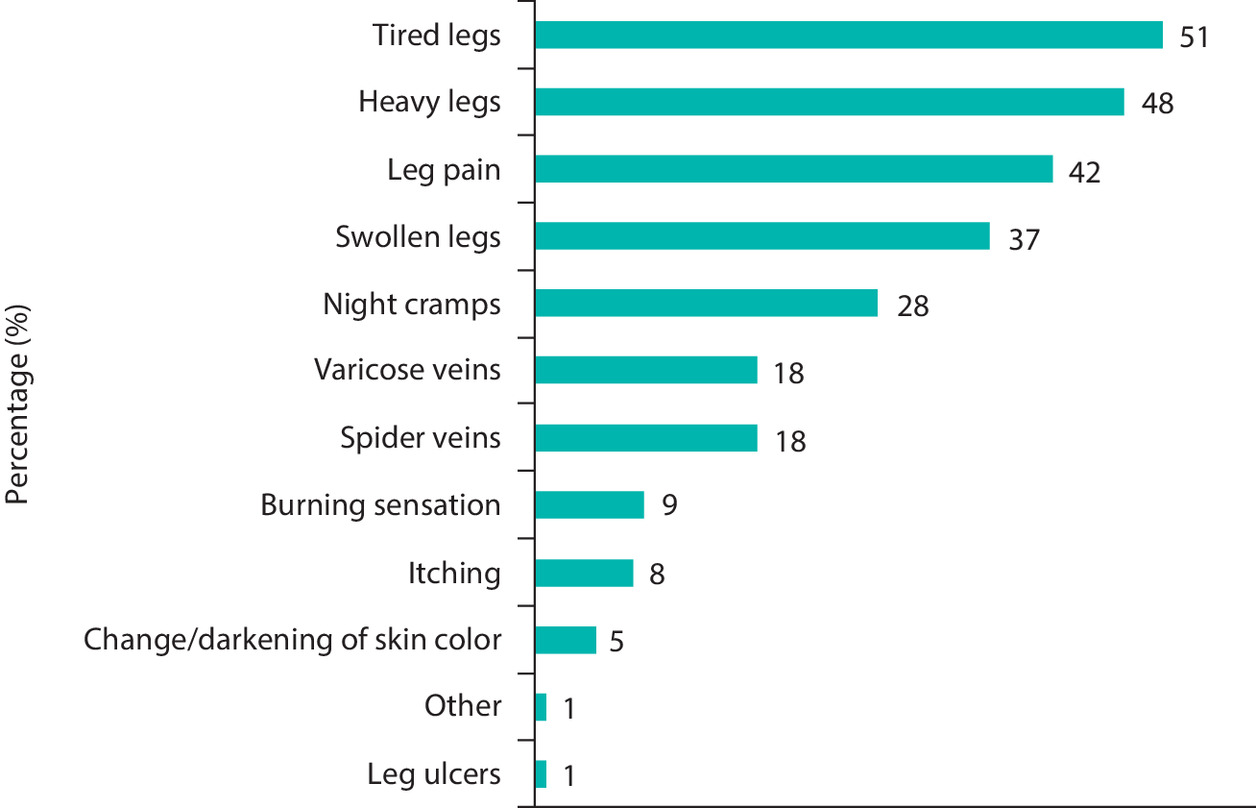
With enrichment of the CVD population, a total of 6152 individuals were included in the analysis of treatment pathways. Of these, 4429 (72%) stated that their CVD diagnosis was confirmed by a healthcare professional (general practitioner [GP]/family doctor [40%], vascular surgeon/angiologist [25%], another physician [7%], unknown [10%], retail pharmacist [9%], physiotherapist [4%], gynecologist [2%], nurse [1%] or another paramedical professional [1%]). At the time of CVD onset, the most common symptoms (Figure 1) were tiredness (51%), heaviness (48%) and pain in the legs (42%), swollen legs (37%) and night cramps (28%).
Individuals with CVD (n = 6152) reported an average of 2.1 treatment steps. Overall, 63% stopped their treatment after taking only one or two steps in the treatment pathway; 15% of participants took five steps (Figure 2). Compared with the overall CVD population, participants from Brazil were more likely to take five or more steps (15%), while those from France (7%) and Spain (10%) were less likely to do so.
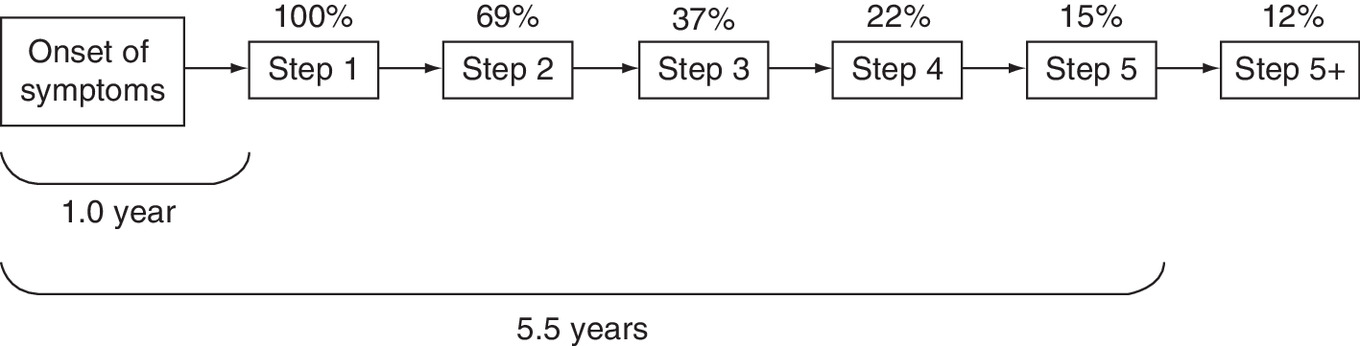
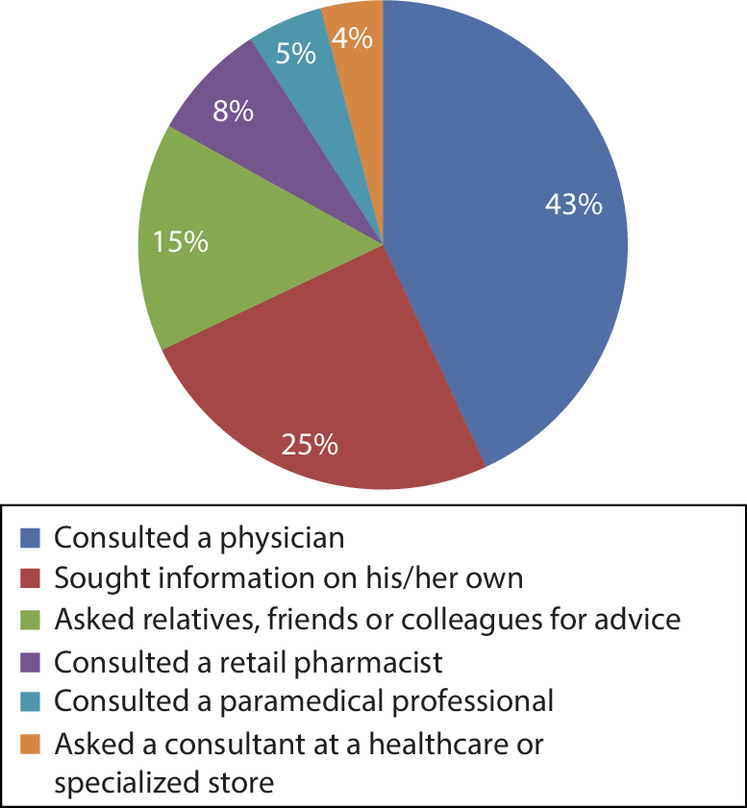
The average time from the onset of CVD symptoms to step 1 was 1.0 year and the average time to step 5 was 5.5 years. During the first treatment step, 43% of all participants consulted a physician, 25% sought information by themselves, 15% asked relatives, friends or colleagues, 8% consulted a retail pharmacist, 5% consulted a paramedical professional and 4% asked a consultant of a healthcare store or a seller in a specialized store for advice (Figure 3). Differences were noted between countries, with respondents from France and Italy being more likely to consult a physician (53 and 46%, respectively), and those from Brazil (28%), Russia (33%), Romania (33%) and Hungary (33%) preferring to seek information themselves without help from anyone else.
At least 80% of respondents with CVD were advised to make lifestyle changes or use nonpharmacological approaches at each step in the treatment pathway (Table 4). Among nonpharmacological therapies and lifestyle changes, increased physical activity (32%), massage (31%), avoiding standing for prolonged periods of time (30%) and compression stockings or elastic socks (28%) were the most frequently reported across all treatment steps (Table 4). Medicinal product use was reported by 60–78% of participants at each treatment step, but most commonly at step 1 (Table 4). Among medicinal products and drugs, creams, ointments and gels were used by 43% of respondents, oral VADs by 21% and food supplements by 15% of respondents. Treatment completion rates were higher with oral VADs and food supplements than with creams (53, 56 and 33%, respectively). Throughout steps 1–5, the median treatment durations were longer with oral VADs (5.08 weeks) than with food supplements (3.65 weeks) or creams (3.76 weeks). Similar proportions of participants used creams, oral VADs, or food supplements during the first (49, 48 and 51%, respectively) and second step (26, 27 and 28%, respectively). The proportions of participants who used these therapies decreased during subsequent therapeutic steps. While creams and oral VADs were frequently used together (43% and 44% of participants), users of creams or oral VADs rarely added food supplements (5% and 6%). On the other hand, initial users of food supplements often added creams or oral VADs (36% and 42%, respectively).
| CVD therapy | Step 1 (n = 4305), n (%) | Step 2 (n = 2904), n (%) | Step 3 (n = 1515), n (%) | Step 4 (n = 840), n (%) | Step 5 (n = 600), n (%) |
|---|---|---|---|---|---|
| Nonmedical treatments and lifestyle changes: | 3794 (88)‡ | 2406 (83)‡ | 1214 (80)‡ | 691 (82) | 491 (82) |
| Physical activity | 1402 (33) | 886 (31)‡ | 503 (33) | 296 (35) | 200 (33) |
| Massage | 1483 (34)‡ | 822 (28)‡ | 425 (28) | 238 (28) | 188 (31) |
| Avoid sitting or standing for prolonged periods of time | 1372 (32)‡ | 825 (28)‡ | 426 (28) | 244 (29) | 170 (28) |
| Compression stockings/elastic socks | 1291 (30)‡ | 780 (27) | 399 (26) | 202 (24)‡ | 131 (22)‡ |
| Cold shower | 1223 (28)‡ | 641 (22)‡ | 316 (21)‡ | 173 (21)‡ | 121 (20)‡ |
| Diet (food/hydration, no spicy food) | 962 (22) | 716 (25) | 379 (25) | 191 (23) | 145 (24) |
| Behavioral changes (posture, skin hygiene, avoid carrying heavy objects) | 735 (17) | 528 (18) | 266 (18) | 153 (18) | 109 (18) |
| Avoid wearing restrictive clothing (tight girdles or belts) | 761 (18)‡ | 428 (15) | 207 (14)‡ | 122 (15) | 91 (15) |
| Stop certain drugs (i.e., hormonal treatment) | 183 (4) | 143 (5) | 85 (6) | 75 (9)‡ | 49 (8)‡ |
| Medicinal products and drugs: | 3347 (78)‡ | 1931 (66)‡ | 974 (64)‡ | 507 (60)‡ | 365 (61)‡ |
| Cream/ointment/gel | 2106 (49)‡ | 1124 (39)‡ | 578 (38)‡ | 302 (36)‡ | 221 (37)‡ |
| Oral venoactive drugs (tablets, oral solution, capsules, ampoules) | 1050 (24)‡ | 579 (20)‡ | 291 (19)‡ | 144 (17)‡ | 101 (17)‡ |
| Food supplements | 698 (16)‡ | 384 (13)‡ | 207 (14) | 114 (14) | 80 (13) |
| Phytotherapy/homeopathy | 344 (8) | 233 (8) | 113 (7) | 60 (7) | 44 (7) |
| Interventions | 496 (12) | 378 (13) | 223 (15)‡ | 128 (15)‡ | 84 (14) |
†
A treatment step was defined as initiation of a new treatment and continued until the treatment was stopped or modified by the addition of a new therapy or switch to a different therapy.
‡
p < 0.05 vs total CVD population.
CVD: Chronic venous disease.
Of the 6152 individuals with CVD included in the treatment pathway analysis, 28% underwent Doppler ultrasonography, while 62% did not and 10% did not know. The proportion of respondents who underwent Doppler ultrasound was significantly higher in France (44%) and Italy (39%) than in the overall CVD population, and significantly lower in Spain (20%), Russia (11%), Romania (21%) and Hungary (16%).
Across all steps, healthcare professionals were the most common source of information about CVD (46%) (Figure 4). Four common treatment pathways were identified based on the person from whom respondents sought help for their condition (Table 5). The characteristics of respondents who followed these pathways differed. Compared with the overall CVD population, respondents who sought help from a physician were significantly older, were more often overweight or obese, had significantly more comorbidities on average and were significantly more likely to use medicinal products and drugs, and to undergo interventions (p < 0.05). On the other hand, respondents who asked friends, relatives or colleagues for help were the youngest category on average. Those who sought information on their own had the lowest mean number of comorbidities and were least likely to use medicinal products or drugs, or to undergo interventions.
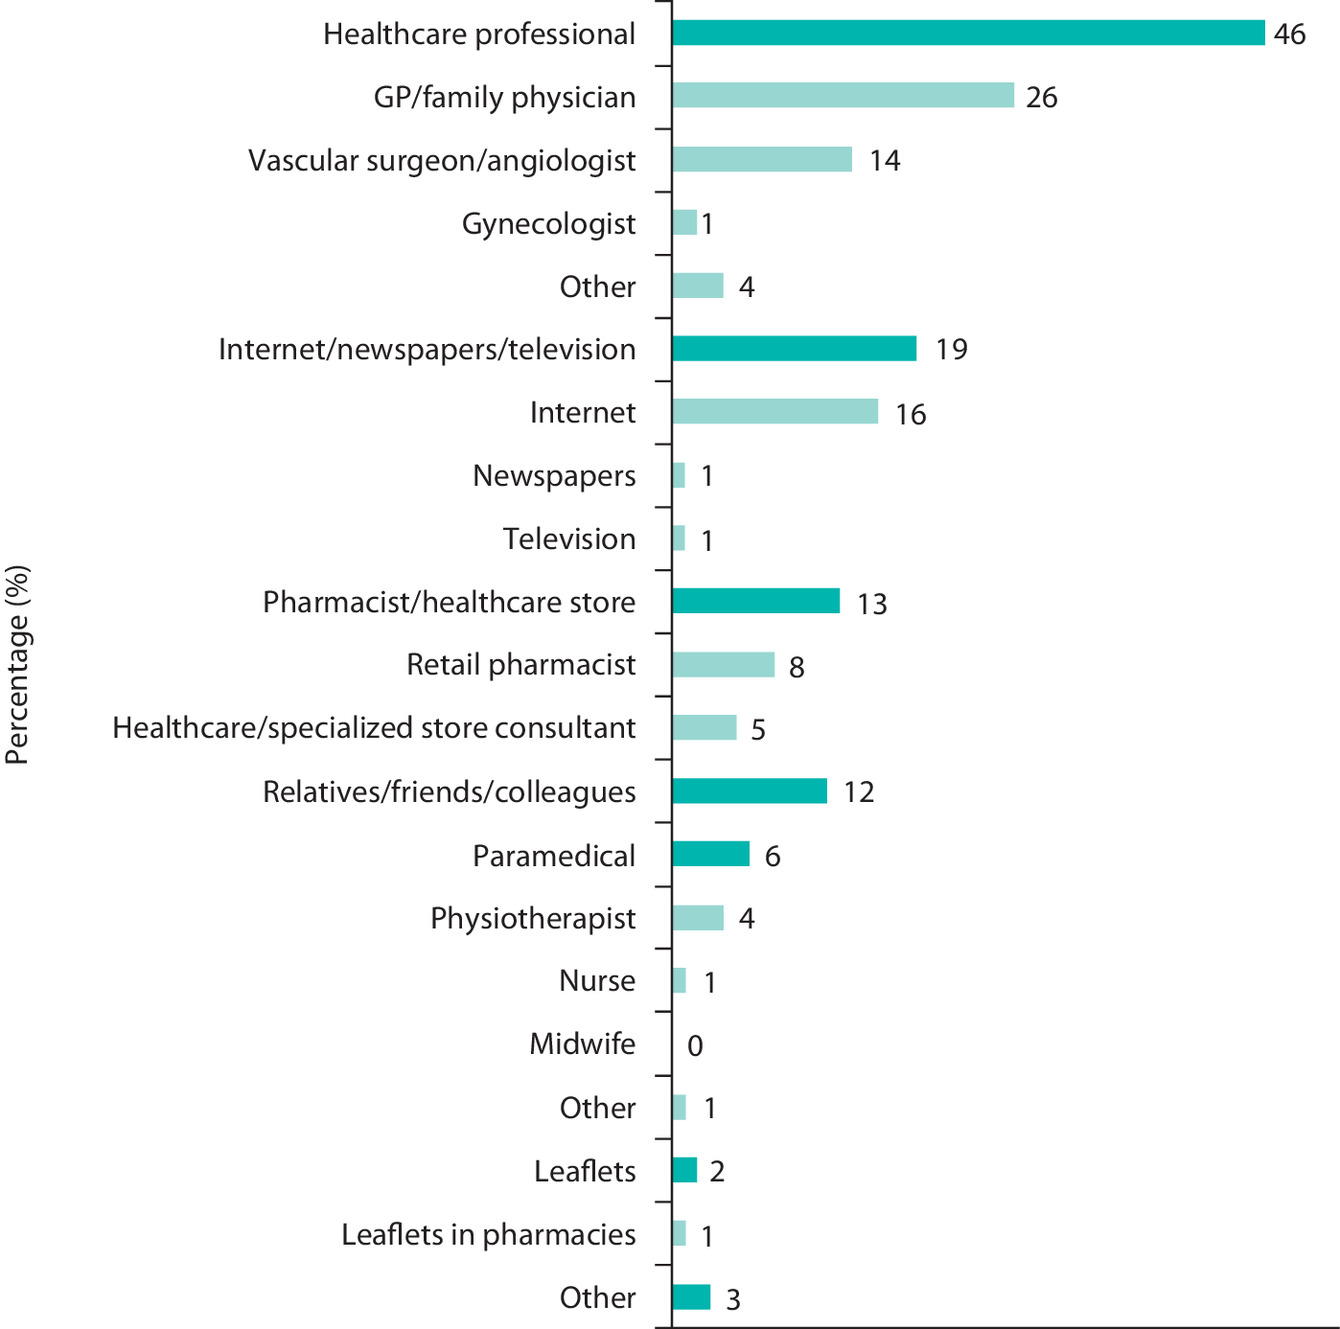
Figure 4. Sources of information used by respondents with chronic venous disease.
GP: General practitioner.
| Consulted a physician (n = 2673), n (%) | Sought information on his/her own (n = 1508), n (%) | Asked relatives/friends/ colleagues for advice (n = 923), n (%) | Consulted a retail pharmacist (n = 465), n (%) | Total (n = 6152), n (%) | |
|---|---|---|---|---|---|
| Country: | |||||
| France | 468 (18)† | 154 (10)† | 119 (13) | 74 (16) | 884 (14) |
| Italy | 604 (23)† | 257 (17)† | 141 (15)† | 154 (33)† | 1302 (21) |
| Spain | 402 (15) | 178 (12)† | 192 (21)† | 67 (14) | 959 (16) |
| Brazil | 477 (18) | 322 (21)† | 200 (22)† | 58 (12)† | 1139 (19) |
| Russia | 282 (11)† | 265 (18)† | 146 (16)† | 32 (7)† | 802 (13) |
| Romania | 162 (6)† | 140 (9)† | 43 (5)† | 50 (11)† | 429 (7) |
| Hungary | 127 (5) | 93 (6)† | 24 (3)† | 9 (2)† | 282 (5) |
| Czech Republic | 151 (6) | 99 (7) | 58 (6) | 21 (5) | 355 (6) |
| Age (years), mean | 47.3† | 41.6† | 38.0† | 42.0† | 43.5 |
| Age categories: | |||||
| 18–40 years | 903 (34)† | 741 (49)† | 565 (61)† | 222 (48) | 2758 (45) |
| 41–60 years | 1272 (48)† | 631 (42) | 317 (34)† | 211 (45) | 2647 (43) |
| >60 years | 498 (19)† | 136 (9)† | 41 (4)† | 32 (7)† | 747 (12) |
| BMI categories: | |||||
| Normal (<25 kg/m2) | 1097 (41)† | 759 (50)† | 498 (54)† | 254 (55)† | 2917 (47) |
| Overweight (25–29 kg/m2) | 871 (33)† | 415 (28)† | 250 (27)† | 131 (28) | 1836 (30) |
| Obese (>30 kg/m2) | 705 (26)† | 334 (22) | 175 (19)† | 80 (17)† | 1399 (23) |
| Comorbidities: | |||||
| Hypertension | 814 (30)† | 351 (23)† | 182 (20)† | 114 (25) | 1603 (26) |
| Depression | 578 (22)† | 353 (23) | 230 (25) | 93 (20) | 1426 (23) |
| Diabetes | 273 (10)† | 96 (6)† | 43 (5)† | 39 (8) | 505 (8) |
| Mean number of comorbidities | 2.4† | 2.2† | 2.3† | 2.3 | 2.4 |
| n=4904‡ | n=1951‡ | n=1240‡ | n=888‡ | n=10164‡ | |
| CVD therapy: | |||||
| Nonmedical treatments and lifestyle changes | 4121 (84) | 1621 (83)† | 1046 (84) | 762 (86) | 8596 (85) |
| Medicinal products and drugs | 3465 (71) | 1268 (65)† | 845 (68) | 679 (76)† | 7124 (70) |
| Interventions | 857 (17)† | 122 (6)† | 88 (7)† | 76 (9)† | 1309 (13) |
†
p < 0.05 vs total CVD population.
‡N-value refers to the number of individuals who reported this step at any time during their treatment pathway, e.g. all respondents who consulted a physician during first, second, third or later step in the treatment pathway.
CVD: Chronic venous disease.
Discussion
This international online survey study highlights how common the signs and symptoms of CVD are in the general population, as well as the variability of CVD management practices. Based on patient self-report, the estimated prevalence of CVD symptoms in the general population was 22.0%. Individuals with CVD were generally older, female and obese, and had more comorbidities than the general population. The proportion of women who had been pregnant was also higher among those with CVD than in the general population. Most respondents had CVD of mild or moderate severity and of more than 1 year's duration. Approximately three-quarters had a family history of CVD. Analysis of the CVD treatment pathway showed that tiredness, heaviness and pain in legs, swollen legs and night cramps were the most common first symptoms of CVD. On average, the symptoms of CVD persisted for 1.0 year before respondents sought advice or treatment. Although consulting a physician was the single most popular option, most respondents sought information elsewhere. Respondents who sought help from a physician were older, more often overweight or obese, had more comorbidities and were more likely to use medicinal products and drugs or undergo interventions. There were differences in the characteristics of respondents, CVD and treatment patterns across the geographic regions studied, with Eastern European countries and Western European countries generally clustering together.
In the past decade, several studies have been conducted to assess the prevalence of CVD [10–14]. These studies reported widely different estimates ranging from 14.9% to 82.6% [10,14], likely due to the use of varying diagnostic criteria, target populations and methodologies [9]. The lowest estimate was reported in a study conducted in a random sample of 1500 Greek citizens; however, this was the only study that did not use the CEAP classification [10]. Another outlier was a study conducted in 3000 primary care patients in Pakistan, which reported a CVD prevalence of 34.8% [11]. This study also reported a higher prevalence of CVD in men (36.4%) than in women (33.0%) and of C3 (36.7%) than symptomatic C0 (C0S) (14.6%), C1 (13.8%) and C2 (15.8%). Compared with other studies, the sample population of this study was younger (mean age 39 years) and consisted mostly of males (52.6%). Vein Consult and the study conducted by Vuylsteke and colleagues were most similar in terms of design [12,14]. Both used the CEAP classification and recruited adults who consulted a GP. Their sample populations consisted mostly of females (68.4 and 67.5%, respectively) and had a similar mean age (50.6 and 53.4 years, respectively). However, Vein Consult was an international study that recruited 91,545 patients from 20 countries in Europe, Latin America, Middle East and South East Asia, while the study conducted by Vuylsteke and colleagues included 6009 patients from Belgium and Luxembourg. Unsurprisingly, these two studies reported broadly similar estimates of CVD prevalence (82.6 and 75.6%, respectively). Although another study invited all residents of a rural Russian community to participate, its sample population was close to those in the two studies described above (mean age 53.5 years, 63.0% female), and it reported an estimate that was similar (69.3%) [13].
The present study was conducted in a representative sample of the general population of eight countries located in Europe and South America. As a result, the sample population had a similar number of males and females (48 and 52%, respectively) and was younger than the populations of most of the studies described above (mean age 44.9 years). It also did not use the CEAP classification. The estimate for the prevalence of CVD reported here most resembles that reported in the study by Dimakakos and colleagues [10], which was also closest to it in terms of design. Other studies described above enrolled populations that were older, had higher proportions of females and were more likely to have other health problems as they were recruited by GPs. Therefore, these studies were more likely to overestimate the prevalence of CVD in the general population.
There are several known risk factors for CVD, including genetic predisposition, age, female sex, obesity, pregnancy and standing for prolonged periods of time [2]. In the present study, individuals with CVD were older and greater proportions were female and obese than in the general population, confirming the importance of these risk factors for CVD. CVD is a progressive condition and, if left untreated, is likely to increase in severity [9]. Among individuals with up to C2 CVD included in the Bonn Vein Study, 32% of those who had saphenous reflux, and 20% of those who did not, progressed to higher stages of CVD after 6 years [16].
Later stage CVD is associated with decreased quality of life and productivity, and represents a substantial burden on healthcare systems [6–8]. Therefore, early intervention is likely to prevent or delay later stage complications in a significant proportion of individuals with CVD. Despite this, there is some evidence that CVD is underdiagnosed and undertreated, especially at lower severity levels. For example, only approximately one-quarter of C0S individuals are considered to have CVD by their GPs [17]. In addition, only 13% of C0S individuals receive lifestyle advice and 8% are prescribed VADs [17]. The present study shows that individuals with mild or moderate symptoms of CVD often do not consult a physician, but instead seek advice and help from other sources such as the internet or friends and family. In addition, respondents waited on average 1.0 year from the occurrence of the first symptoms before seeking help. These findings support the notion that early-stage CVD may be underdiagnosed and undertreated. Improving the awareness of the burden of CVD among the public and physicians may help address this problem, particularly among high-risk individuals such as older people, women and those with a high BMI.
The strengths of the present study include the fact that it was conducted in a large and representative sample of the general population and that it examined multiple demographic and clinical characteristics relevant to CVD. One of the limitations of the present study is that it relied on respondents to provide accurate information. In cases where respondents did not have an accurate recollection of past events, this could have affected the accuracy of the findings. This limitation is common to studies that rely on participant-reported information. Another limitation is the fact that the CVD diagnosis was based on signs and symptoms reported by the participants of the survey and not verified by a physician. Signs and symptoms do not always correlate with CVD [18], so it is possible that some of the signs and symptoms that the participants reported may have had a cause other than venous disease (e.g., diabetes or hypertensive drugs causing edema, other skin inflammation causing pigmentation). In addition, as a web-based survey, our research may be subject to selection bias, favoring individuals with the income and education to participate in internet research.
Conclusion
This survey study conducted using a representative sample of the general population of eight countries found that the prevalence of self-reported signs and symptoms of CVD is 22.0%. Individuals with these CVD symptoms tend to be older, female and obese, and have more comorbidities than the general population. Most individuals with CVD signs and symptoms do not seek help from a physician, and those who do, tend to have more severe disease. The results of this study reinforce the need for greater awareness of CVD and its consequences in order to ensure timely diagnosis and treatment.
•
Chronic venous disease (CVD) is a common and often painful condition, but little is known of how it is managed in routine clinical practice.
•
A large international web-based survey was undertaken of 16,015 adults in Brazil, Czech Republic, France, Hungary, Italy, Romania, Russia and Spain between December 2017 and February 2018.
•
Based on self-reported signs and symptoms, the estimated prevalence of CVD was 22%.
•
Compared with the general population, individuals with CVD were generally older, female and obese, had more comorbidities and more often had been pregnant.
•
CVD was mostly mild or moderate in severity and of >1 year's duration.
•
Most participants with CVD had a family history of this disease.
•
The most common initial symptoms were tiredness/heaviness/pain in legs, swollen legs and night cramps; participants waited a mean of 1 year before seeking advice or treatment.
•
Consulting a physician was the most common initial treatment option, but most respondents also sought information elsewhere.
•
Participants who consulted a physician were older, more often overweight/obese, had more comorbidities and were more likely to use pharmacological therapies.
•
Characteristics of participants with signs and symptoms of CVD and treatment patterns varied across countries.
Author contributions
G Salmat was involved in data processing, statistical calculations, checked the accuracy of the data and reviewed and approved drafts of the manuscript for statistical accuracy. F Goron was involved in the conception and design of the study, enrollment of participants, data analysis and reviewed and approved drafts of the manuscript, including checking the accuracy of the data. C Régnier was involved in the conception and design of the study, read and revised manuscript drafts and approved the final version. E Rabe and F Pannier reviewed the results of the study, read and revised manuscript drafts and approved the final version.
Acknowledgements
We would like to thank A Bothwell, who on behalf of Springer Healthcare communications wrote the first draft, and G Filatov and C Rees, both of Springer Healthcare Communications, who wrote the outline and assisted with revisions post submission, respectively.
Financial & competing interests disclosure
C Régnier is an employee of Servier International. F Goron and G Salmat are employees of Harris Interactive (France). The study was funded by Servier. The authors have no other relevant affiliations or financial involvement with any organization or entity with a financial interest in or financial conflict with the subject matter or materials discussed in the manuscript apart from those disclosed.
Medical writing assistance was funded by Servier.
Ethical conduct of research
Participants provided informed consent prior to completing the survey.
As this was not an investigation of clinical outcomes with any particular intervention, neither Ethics Committee approval nor clinical trial registration was required.
Harris Interactive Europe is a full service, consultative custom market research agency. We comply with the Quality and Professional Code of Ethics published by Syntec Etudes and the ICC/ESOMAR International Code on Market, Opinion and Social Research and Data Analytics and other applicable guidelines and codes of conduct on market research. Harris Interactive uses market research industry standards, techniques and methodologies to ensure that respondents to market research studies are kept anonymous and the results are provided on an aggregated basis. Harris Interactive, its hosting and backup services, and any third-party suppliers are fully compliant with the General Data Protection Regulation 2016/679 (GDPR). Harris Interactive only accepts personal data via secure encrypted transfer protocols such as sFTP sites. Data will only be processed for the purposes for which they were provided and for no other reason. Access to the data is restricted to pre-defined and tightly controlled groups of employees on a ‘need to know’ basis only. The healthcare department is also a member of ASOCS and follows the EPHMRA regulation (without being a member). All data are located on a single secure server (never transferred) and none of the data can be personally identifiable. This includes personal socio-demographic data (gender, age, geography defined in zones and not at a finer level) which the respondent gave his consent to their use in a conglomerate and anonymized manner. All people completing surveys on health-related matters are asked a health consent question to make sure that the person knows that health questions will be asked and that they accept this condition before completing the questionnaire. These data are always collected on an anonymized basis. No information that can precisely identify the person is possible. The data are available to the sponsor for a maximum of 2 to 3 years after the end of the study for possible additional research requests or realization of barometric monitoring. At the end of this time, the database undergoes automatic destruction.
Data sharing statement
Data are available on request from Harris interactive (Fabienne Goron and Ghislaine Salmat).
Open access
This work is licensed under the Attribution-NonCommercial-NoDerivatives 4.0 Unported License. To view a copy of this license, visit http://creativecommons.org/licenses/by-nc-nd/4.0/
Supplementary Material
File (supplementary appendix.pdf)
- Download
- 1.00 MB
References
Papers of special note have been highlighted as: • of interest; •• of considerable interest
1.
Eklof B, Perrin M, Delis KT et al. Updated terminology of chronic venous disorders: the VEIN-TERM transatlantic interdisciplinary consensus document. J. Vasc. Surg. 49(2), 498–501 (2009).
• The VEIN-TERM consensus document is intended to augment previous transatlantic/international interdisciplinary efforts in standardizing venous nomenclature.
2.
Bergan JJ, Schmid-Schonbein GW, Smith PD, Nicolaides AN, Boisseau MR, Eklof B. Chronic venous disease. N. Engl. J. Med. 355(5), 488–498 (2006).
3.
Nicolaides A, Kakkos S, Baekgaard N et al. Management of chronic venous disorders of the lower limbs. Guidelines According to Scientific Evidence. Part I. Int. Angiol. 37(3), 181–254 (2018).
•• Describes current concepts for chronic venous diseases (CVDs), updated guidelines for management and the strength of evidence supporting the recommendations.
4.
Eberhardt RT, Raffetto JD. Chronic venous insufficiency. Circulation 130(4), 333–346 (2014).
• Reviews clinical aspects of chronic venous insufficiency (CVI), with a focus on the diagnostic and therapeutic options.
5.
Eklof B, Rutherford RB, Bergan JJ et al. Revision of the CEAP classification for chronic venous disorders: consensus statement. J. Vasc. Surg. 40(6), 1248–1252 (2004).
6.
Kuet ML, Lane TR, Anwar MA, Davies AH. Comparison of disease-specific quality of life tools in patients with chronic venous disease. Phlebology 29(10), 648–653 (2014).
7.
Launois R. Health-related quality-of-life scales specific for chronic venous disorders of the lower limbs. J. Vasc. Surg. Venous Lymphat. Disord. 3(2), 219–227, e211–213 (2015).
•• This systematic review confirmed that CVDs have an important effect on QOL. The majority of the studies addressed the application rather than the validation of the ten identified scales.
8.
Rabe E, Pannier F. Societal costs of chronic venous disease in CEAP C4, C5, C6 disease. Phlebology 25(Suppl. 1), 64–67 (2010).
9.
Onida S, Davies AH. Predicted burden of venous disease. Phlebology 31(Suppl. 1), 74–79 (2016).
• Reviews the current and future burden of chronic venous disease from an epidemiological, quality of life and economic perspective.
10.
Dimakakos E, Syrigos K, Scliros E, Karaitianos I. Prevalence, risk and aggravating factors of chronic venous disease: an epidemiological survey of the general population of Greece. Phlebology 28(4), 184–190 (2013).
11.
Khan AF, Chaudhri R, Ashraf MA, Mazaffar MS, Zawar-Ul-Imam S, Tanveer M. Prevalence and presentation of chronic venous disease in Pakistan: a multicentre study. Phlebology 28(2), 74–79 (2013).
12.
Vuylsteke ME, Thomis S, Guillaume G, Modliszewski ML, Weides N, Staelens I. Epidemiological study on chronic venous disease in Belgium and Luxembourg: prevalence, risk factors, and symptomatology. Eur. J. Vasc. Endovasc. Surg. 49(4), 432–439 (2015).
13.
Zolotukhin IA, Seliverstov EI, Shevtsov YN et al. Prevalence and risk factors for chronic venous disease in the general Russian population. Eur. J. Vasc. Endovasc. Surg. 54(6), 752–758 (2017).
14.
Rabe E, Guex JJ, Puskas A, Scuderi A, Fernandez Quesada F, Coordinators VCP. Epidemiology of chronic venous disorders in geographically diverse populations: results from the Vein Consult Program. Int. Angiol. 31(2), 105–115 (2012).
•• The Vein Consult Program survey provides reliable results on CVD global epidemiology and shows that CVD affects a significant part of the populations worldwide, underlining the importance of adequate screening for CVD and training of both general practitioners (GPs) and specialist physicians.
15.
16.
Rabe E, Pannier F, Ko A, Berboth G, Hoffmann B, Hertel S. Incidence of varicose veins, chronic venous insufficiency, and progression of the disease in the Bonn Vein Study II. J. Vasc. Surg. 51(3), 791 (2010).
• Shows a high incidence of about 2% for varicose veins and for CVI per year. During the same time, the incidence of progression to higher C classes seems to be very high.
17.
Guex J-J, Rabe E, Escotto SI et al. The “C0s” patient: worldwide results from the Vein Consult Program. Phlebolymphology 19(4), 182–192 (2012).
18.
Bradbury A, Evans C, Allan P, Lee A, Ruckley CV, Fowkes FG. What are the symptoms of varicose veins? Edinburgh vein study cross sectional population survey. BMJ 318(7180), 353–356 (1999).

Information & Authors
Information
Published In
Pages: 1205 - 1218
PubMed: 33079592
Copyright
© 2020 Eberhard Rabe. This work is licensed under the Attribution-NonCommercial-NoDerivatives 4.0 Unported License
History
Received: 28 July 2020
Accepted: 15 September 2020
Published online: 20 October 2020
Keywords:
Topics
Authors
Funding Information
Metrics & Citations
Metrics
Article Usage
Article usage data only available from February 2023. Historical article usage data, showing the number of article downloads, is available upon request.
Citations
How to Cite
The prevalence, disease characteristics and treatment of chronic venous disease: an international web-based survey. (2020) Journal of Comparative Effectiveness Research. DOI: 10.2217/cer-2020-0158
Export citation
Select the citation format you wish to export for this article or chapter.
Citing Literature
- Fan Maitri Aldian, Yan Efrata Sembiring, Visuddho Visuddho, Bendix Samarta Witarto, Jason Oktavian Hartanto, Andro Pramana Witarto, Jeffrey Jeswant Dillon, Network meta-analysis of randomized controlled trials evaluating long-term outcomes of interventional approaches for great saphenous vein insufficiency, Journal of Vascular Surgery: Venous and Lymphatic Disorders, 10.1016/j.jvsv.2026.102553, 14, 5, (102553), (2026).
- Rosa Casado-Fernández, Llúcia Benito-Aracil, Esperanza Zuriguel-Pérez, Erica Homs-Romero, Isabel Zafra-Izquierdo, José María Escribano-Ferrer, Sergi Bellmunt-Montoya, Demographic and clinical profile of individuals diagnosed with chronic venous disease referred to a vascular specialist, Journal of Vascular Nursing, 10.1016/j.jvn.2026.06.006, (2026).
- Fabricio Rodrigues Santiago, Denisa Celovska, Sarah Thomis, Vanessa Blanc-Guillemaud, Marie-Blanche Onselaer, Soumeya Serifou, Hurrem-Pelin Yaltirik, Mamuka Bokuchava, Effectiveness of Micronized Purified Flavonoid Fraction on Quality of Life in Patients with Chronic Venous Disease: A Systematic Review and Meta-analysis, Clinical Drug Investigation, 10.1007/s40261-026-01563-x, 46, 8, (809-825), (2026).
- Efthymios D. Avgerinos, Spyros N. Vasdekis, Dimitrios G. Kardoulas, Garyfallia Stefanou, Georgia Kourlaba, Antonios Papageorgiou, Prevalence of Chronic Venous Disease and Quality of Life in the Adult Greek Population: Results from the VeinProtect Study, European Journal of Vascular and Endovascular Surgery, 10.1016/j.ejvs.2025.09.016, 71, 4, (661-670), (2026).
- Latha P. Palaniappan, Norrina B. Allen, Zaid I. Almarzooq, Cheryl A.M. Anderson, Pankaj Arora, Christy L. Avery, Carissa M. Baker-Smith, Nisha Bansal, Maria E. Currie, Rebecca S. Earlie, Wenjun Fan, Jessica L. Fetterman, Bethany Barone Gibbs, Debra G. Heard, Swapnil Hiremath, Haoyun Hong, Hyacinth I. Hyacinth, Chinwe Ibeh, Tian Jiang, Michelle C. Johansen, Dhruv S. Kazi, Darae Ko, Tak W. Kwan, Michelle H. Leppert, Yilun Li, Jared W. Magnani, Karlyn A. Martin, Seth S. Martin, Erin D. Michos, Michael E. Mussolino, Oluwabunmi Ogungbe, Nisha I. Parikh, Marco V. Perez, Sarah M. Perman, Ashish Sarraju, Nilay S. Shah, Mellanie V. Springer, Marie-Pierre St-Onge, Evan L. Thacker, Seda Tierney, Sarah M. Urbut, Harriette G.C. Van Spall, Jenifer H. Voeks, Seamus P. Whelton, Sally S. Wong, Juan Zhao, Sadiya S. Khan, 2026 Heart Disease and Stroke Statistics: A Report of US and Global Data From the American Heart Association, Circulation, 10.1161/CIR.0000000000001412, 153, 9, (2026).
- Larisa CHERNUKHA, Conservative treatment effectiveness in chronic venous disease in the VEIN STEP observational study: Ukraine subset, Acta Phlebologica, 10.23736/S1593-232X.25.00650-2, 27, 1, (2026).
- Khadija Hafidh, Melina Vega de Ceniga, Leonardo De Luca, Claudio Borghi, Reshaping the cardiovascular continuum in the management of arterial and venous cardiovascular disease: a narrative review, Journal of Comparative Effectiveness Research, 10.57264/cer-2025-0162, 15, 2, (2026).
- David O. Nauheim, Esika Savsani, Sean Maratto, David Moskal, Robert W. Ford, Ronald S. Winokur, Short term diameter change in iliofemoral venous stents, Phlebology: The Journal of Venous Disease, 10.1177/02683555261415590, (2026).
- Cláudia Carvalho Sathler de Melo, Felipe Puricelli Faccini, Safety and efficacy for the treatment of C1 and C2 patients with a new method hemodynamic hybrid Nd YAG 1064 LASER and cryosclerotherapy, Journal of Vascular Surgery: Venous and Lymphatic Disorders, 10.1016/j.jvsv.2025.102320, 14, 1, (102320), (2026).
- Maria Lourdes Del Río-Solá, Noelia Cenizo-Revuelta, Laura Saiz Viloria, Miguel Martin Pedrosa, Jose Antonio González-Fajardo, The cardiovascular impact of chronic venous disease: A systematic review and meta-analysis, Journal of Vascular Surgery: Venous and Lymphatic Disorders, 10.1016/j.jvsv.2025.102310, 14, 1, (102310), (2026).
- See more