Ability to pay for medication: a clustering analysis of 1404 patients with the Patient Financial Eligibility Tool
Publication: Journal of Comparative Effectiveness Research
Abstract
Aim: The study was conducted to understand how key determinants of the Patient Financial Eligibility Tool (PFET), a previously validated tool for assessing patients’ ability to contribute to their medication costs, vary across countries. Materials & methods: A clustering analysis was conducted on economic data from 1404 patients from Thailand (n = 947), the UAE (n = 347) and Mexico (n = 110). Results: The analysis identified seven patient clusters, including globally wealthy or poor patients (14%/48%) and those with only selectively increased PFET economic indicators (38%), and revealed country-specific differences in the correlation between PFET metrics and patients’ overall economic status. Conclusion: The PFET is a versatile tool that can be adapted to each country’s economic context to assess patients’ ability to contribute to their medication costs.
A key challenge to increasing access to patented drugs for patients in low- and middle-income countries is identifying and implementing sustainable payment models. Donation programs established by pharmaceutical companies may address one-time or short-term needs for vaccines and medications but may not be optimized for creating access to medications that require chronic use. In the absence of free medications, most patients in these countries pay for them out of pocket, which may also not be sustainable when the medications must be purchased for long-term treatment of chronic illnesses. An alternative and potentially more sustainable approach to making patented drugs available in low- and middle-income countries is a hybrid model in which patients with some financial resources pay a portion of their medication costs, with the remaining costs covered to ensure that patients take full course of treatment and maximize medical benefits.
Such a hybrid model could provide multiple benefits that would expand access to life-saving patented medications. First, it could allow a broader segment of patients across the economic spectrum to afford these medications. Second, a larger number of patients contributing more to the cost of their medications, to the extent they can afford, could allow resources provided through free medication and other subsidized programs to be more effectively deployed in helping those patients who lack the economic resources to purchase the full course of treatment that is necessary for optimal therapy.
Key to enabling hybrid models is determining the amount that patients can contribute to the cost of their medications without significant economic distress or deleterious financial burden, with additional costs covered through financial support programs. Although income has been used as an indicator of financial wealth and expenditures have been used as a proxy for income [1], these factors may not accurately reflect a patient’s real economic status, especially in countries with informal and/or cash economies. Income, in particular, has been found to be difficult to capture accurately, as it may tend to fluctuate substantially depending on seasonality or migration, it does not account for informal earnings, and it is a sensible information which may prove difficult to collect from individuals [1,2]. Wealth metrics may provide a more accurate assessment of a patient’s ability to pay for medication, but these data may rely on the collection of numerous questions which adds to survey length and are thus not commonly collected [2,3]. Additionally, the accuracy of any individual wealth index may vary based on the variables included and the weights and values assigned to questions and responses for specific indicators [3,4]. Asset-based methods to assess economic status are also limited due to their inability to account for the short-term or temporary economic changes, including the changes associated with addressing a significant healthcare expense [4,5].
In order to address the limitations associated with the independent use of income, expenditures or wealth to determine economic status, we previously developed and validated a novel multilateral index that combines income, asset and standard of living (SoL) data [6]. This index, the Patient Financial Eligibility Tool (PFET), is adapted on a country-by-country basis to address the cultural, behavioral and financial standards within individual countries. Although patients’ individual wealth level as measured by the tool was previously validated against their actual ability to pay for expensive treatments [6], it is yet unknown to what extent the instrument may operate differently across countries, for example, how income information may be the most important driver in some countries while SoL/assets may more strongly influence the final result in other countries characterized by greater informal economies. Similarly, the question arises as to whether there are distinct patterns of combinations of the three metrics that could be used to identify specific patients’ subgroups or profiles. Such information is crucial to documenting the adaptability of the PFET in varying settings and, ultimately, establishing its utility for routine wealth level assessment within the hybrid model previously described. To that end, use of unsupervised machine learning techniques (clustering) may provide important insights into existing patterns of wealth metrics by reducing complexity and facilitating the identification and interpretation of the combinations at play among income, assets and SoL.
In our ongoing effort to adapt the PFET to variation in local country context and to maintain its efficacy as a tool for assessing patients’ ability to contribute to the cost of patented medications, we conducted a cluster analysis using detailed data from patients enrolled in drug access programs using the PFET in Mexico, Thailand and the UAE. The goal of this analysis was to understand how the key determinants of PFET vary across countries. Here, we report the results of this cluster analysis, which was designed to identify and characterize subgroups of patients who have common economic status as determined by the different component metrics of the PFET.
Material & methods
Study population & data collection
Since its initial development, the PFET has been progressively deployed in a number of low- to middle-income countries (N = 20 as of 2019) for a wide variety of drugs prescribed in the field of chronic diseases or cancer (N = 57 as of 2019). A dedicated database platform has been developed in parallel with the use of the PFET to enable routine collection of patient economic data as well as to enable internal testing to adjust the tool and optimize its ability to quantify patients’ ability to pay. For the present analysis, data were extracted from three countries (Thailand, UAE and Mexico), which were chosen based on the availability of data within the database and because the size of the informal economy varies across them [7]. Consequently, these three countries provide an excellent sample population in which to evaluate interactions among the component metrics of the PFET in distinct economic environments. Anonymized data were extracted for patients enrolled in 12 different drug treatment programs between May 2013 and February 2017.
Information used for the present analysis included the following variables: normalized (0–100) PFET summary components for income, assets and SoL based on the linear weighted combination of all individual items relating to these topics, and detailed quantitative items expressed in purchasing power parity dollars to allow cross-country comparisons, including patients’ household and economic unit income, monthly household expenditures, financial assets and, when applicable, vehicle price, value/rental of primary dwelling, business turnover and education fees. Qualitative information collected within the PFET regarding household equipment, method of cooking, water source or dwelling floor material was not included because of the variability of the subcategories used across countries. Clustering analysis was conducted based on the normalized three PFET metrics (income, SoL, assets), whereas detailed quantitative information were used as illustrative features to describe the main characteristics of the clusters identified.
Statistical analysis
Clustering analysis relied on self-organizing maps (SOMs), a nonparametric neural network clustering technique that allows the visual identification of homogenous groups (clusters) in 2D maps. Patients sharing similar characteristics in terms of income, assets and SoL are displayed in close proximity on the SOMs, whereas patients with opposite features are mapped in areas distant from one another [8]. A circular implementation applying the ‘Numero’ statistical framework [9] was used to build the SOMs and to define clusters boundaries, by constructing the SOMs with statistical verification of the robustness of the contrasts observed through permutation tests and determining suitable groupings of patients based on the visual identification of key data patterns. All analyses were stratified by country.
For illustrative purpose, a Gabriel’s biplot [10] was created to project the patients from the three countries along the principal components (PCs) axes from a PC analysis based on the three PFET metrics. Cluster solutions were then mapped on the biplot by coloring patients according to their cluster membership. Descriptive quantitative results are presented as means (± standard deviation). Comparisons between groups identified from clustering analysis were conducted using one-way analysis of variance (ANOVA) or Kruskall–Wallis tests for continuous data, as appropriate. A p-value < 0.05 was considered significant.
Analyses were performed using Stata 15.1 (StataCorp, TX, USA) for descriptive analyses and between-groups comparisons, and R 3.4.2 statistical software (Vienna, Austria; Numero and pca3d packages) for clustering analyses and visualizations.
Results
Overall, anonymized economic data from 1404 patients were extracted for the present analysis, including 947 from Thailand, 347 from UAE and 110 from Mexico. Mean normalized (0–100) PFET summary component scores for income, assets and SoL were 10 ± 19, 16 ± 14, 19 ± 11 for Thailand, 13 ± 20, 3 ± 7, 22 ± 13 for UAE and 31 ± 21, 10 ± 12, 25 ± 13 for Mexico, respectively.
Figure 1 shows the results from the clustering analysis using the SOM methodology in Thailand (A), UAE (B) and Mexico (C). For each series of SOMs by country, patients identified as globally similar in terms of PFET income, assets and SoL component scores are grouped in ‘districts’ represented as numbered polygons placed at fixed positions on the maps. The more those specific patient subgroups resemble each other in terms of PFET values, the closer they are on the map and conversely, subgroups with fewer commonalities are further apart. Colors ranging from blue to red indicate average district value levels, from the lowest to highest. For illustrative purpose, a selection of average district values is shown for representative districts in each SOM.
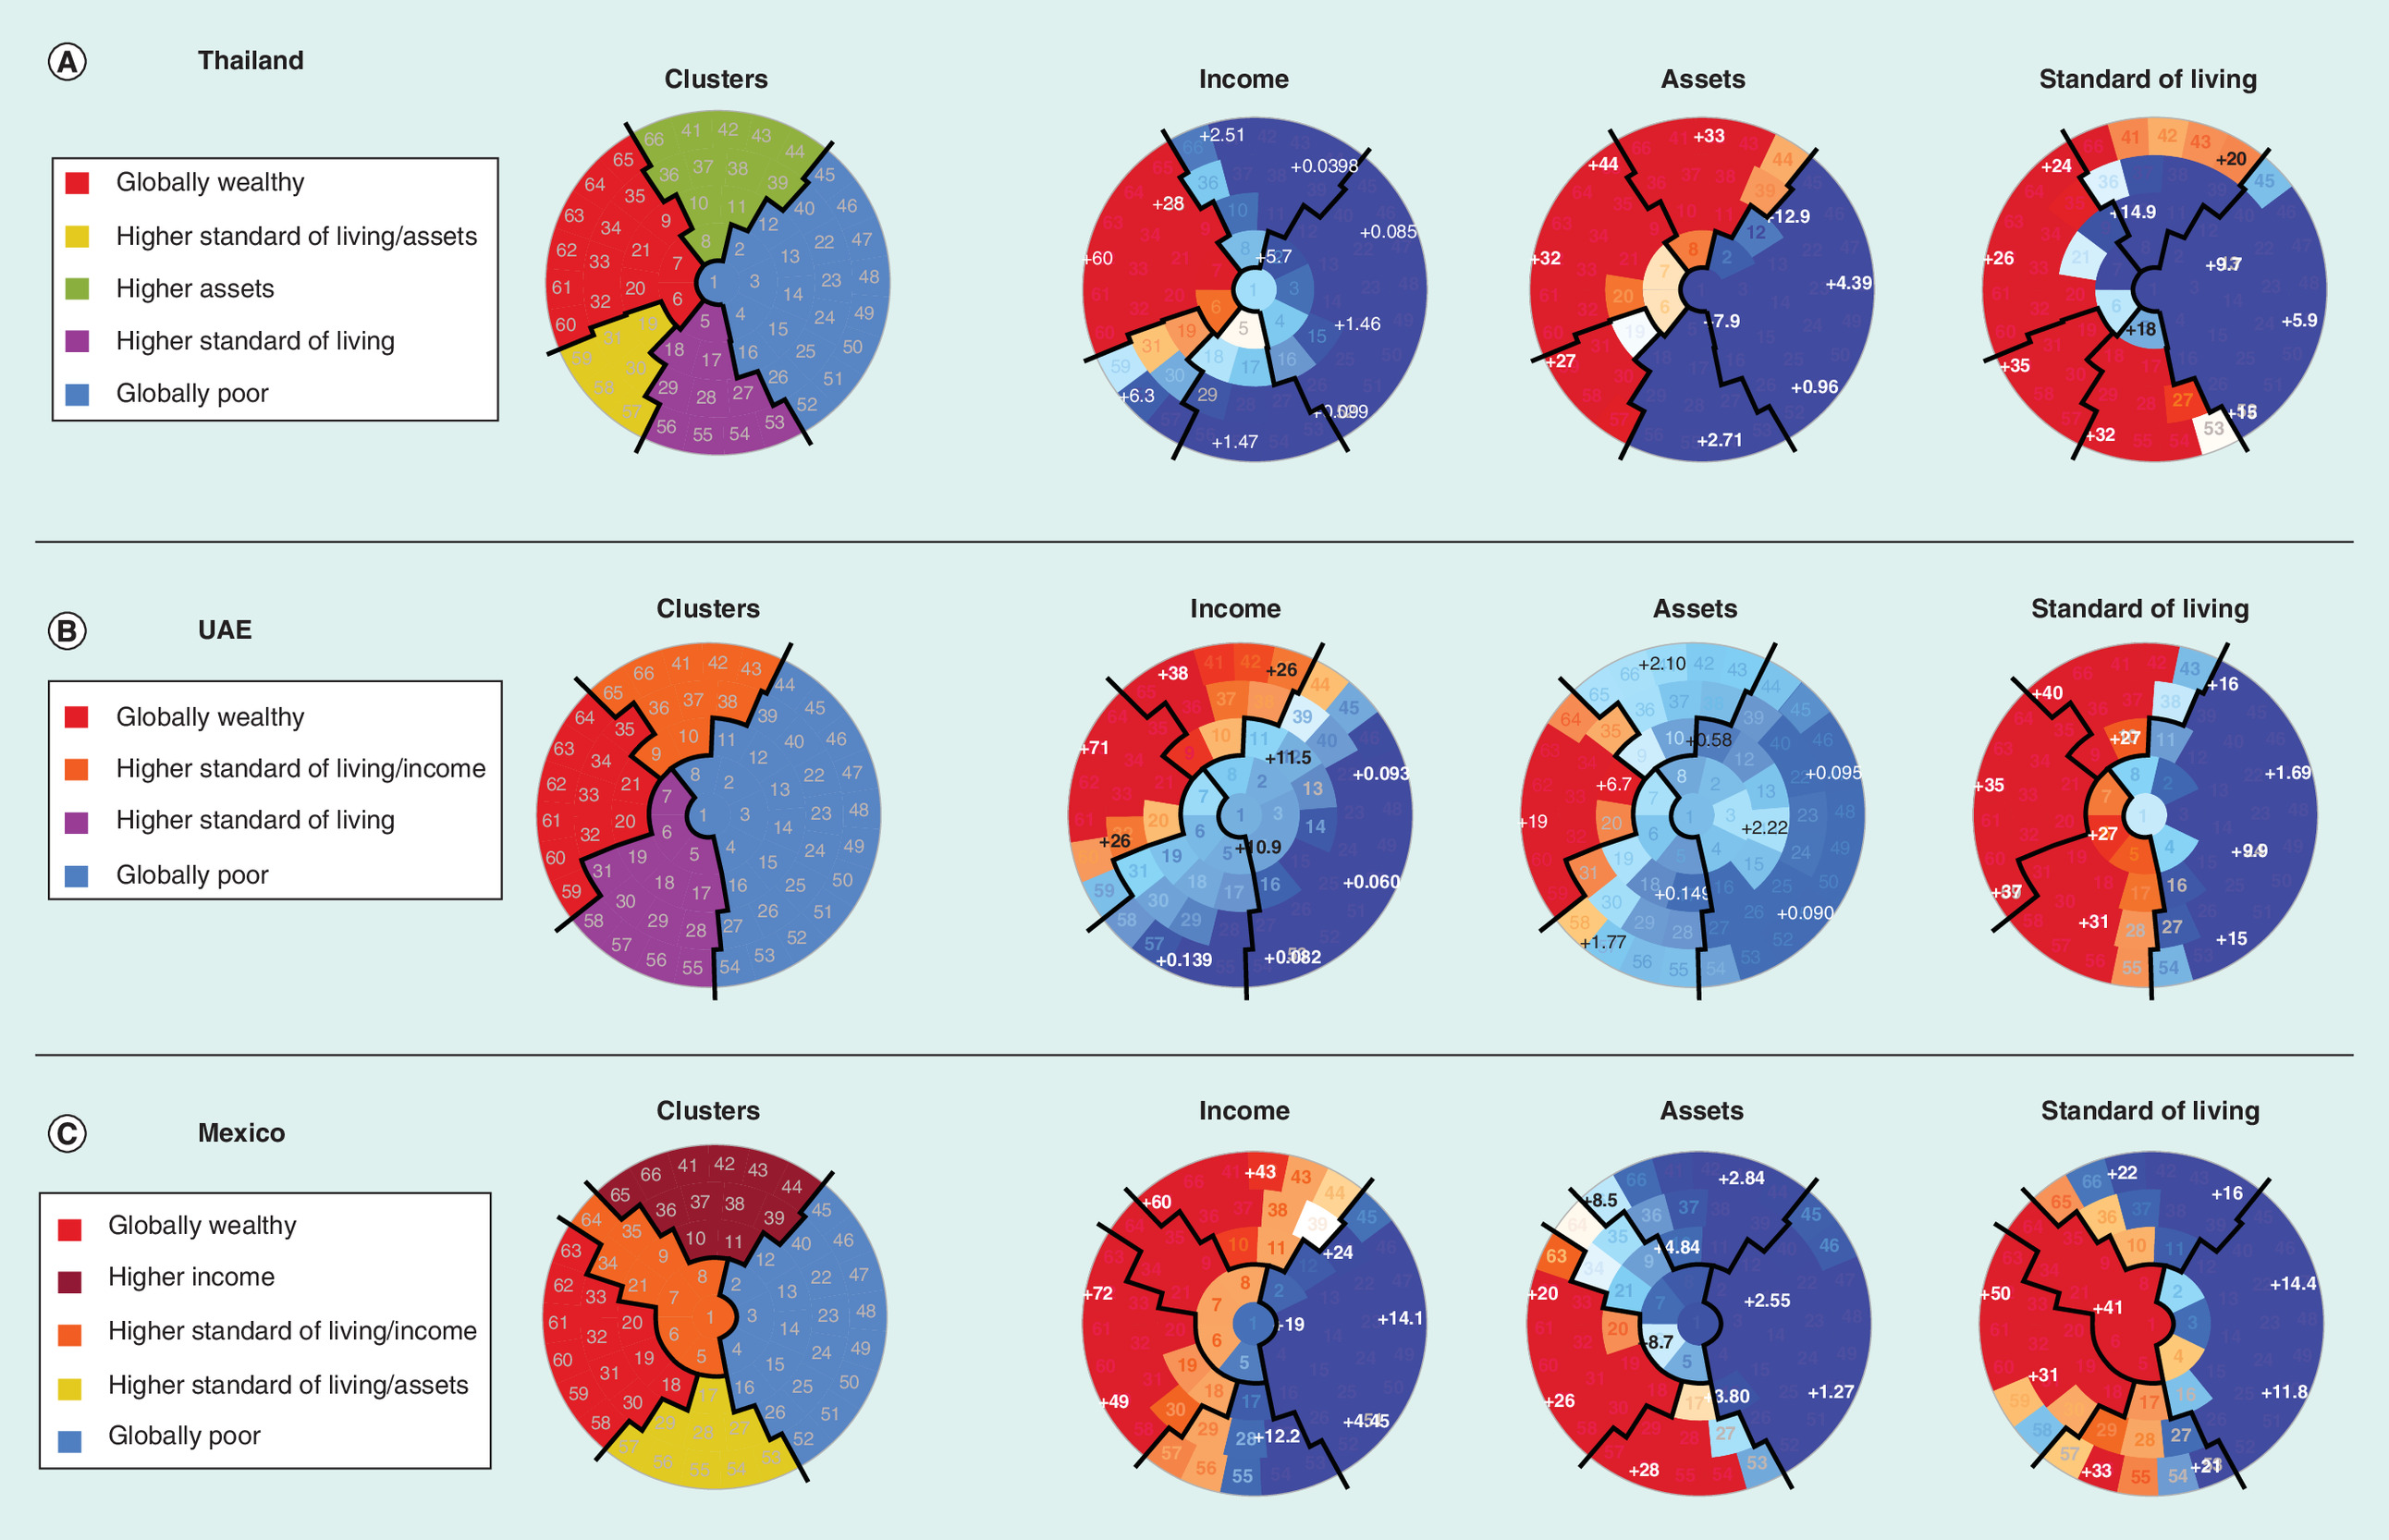
Figure 1. Results from the clustering analysis by self-organized maps according to country.
Self-organized map placed patients with similar economic status within small groupings (‘districts’) throughout the map. Each individual map shows the average values per district for each economic indicator, in other words, income, assets and standard of living, with blue colors indicating the lowest values and red colors the highest. Based on visual identification of key patterns in the self-organized maps, close districts were combined to provide suitable clusters of patients whose boundaries are indicated delimited by solid black lines.
After visual analysis of all the SOMs across countries, seven subtypes of patients were apparent, according to the following possible combinations between the three PFET metrics: globally wealthy patients (cluster 1), characterized by increased values in all three PFET metrics and represented in all three countries in the left part of the SOMs; patients with elevated SoL and income (cluster 2), characterized by increased values in those two metrics but not in assets, and found in UAE (upper area) and Mexico (left area); patients with elevated SoL and assets (cluster 3), found in Thailand (lower left area) and Mexico (lower area); patients with isolated elevated assets (cluster 4), only found in Thailand (upper area); patients with isolated elevated income (cluster 5), only found in Mexico (upper area); patients with isolated elevated SoL (cluster 6), found in Thailand (lower area) and UAE (lower area); and globally poor patients with low values in all three metrics (cluster 7), found in all three countries in the right part of the SOMs. Using this classification, a global map indicating the proposed clusters labels is shown for each country in the left area, whereas other maps on the right show the distribution of PFET summary component scores with the clusters boundaries superimposed using solid black lines. Detailed characteristics of the clusters with mean (standard deviation) of quantitative illustrative features are shown in Table 1, along with p-values from global comparison tests. Distribution of clusters across countries varied from 11 to 17% (unweighted average 14%) for Cluster 1 (globally wealthy), from 42 to 56% (unweighted average 48%) for cluster 7 (globally poor), and from 32 to 44% (unweighted average 38%) for the remaining in-between clusters 2–6. Systematically significant differences between clusters were found regarding the three PFET metrics, with higher standardized values (/100) found in Cluster 1 (i.e., from 48 to 55 for income, from 16 to 31 for assets and from 27 to 40 for SoL) and the lowest values in cluster 7 (i.e., from 2 to 14 for income, from 1 to 6 for assets and from 11 to 17 for SoL).
| Characteristics | Cluster 1 Globally wealthy; mean (±SD) | Cluster 2 Elevated Standard of living/income; mean (±SD) | Cluster 3 Elevated standard of living/assets; mean (±SD) | Cluster 4 Elevated assets; mean (±SD) | Cluster 5 Elevated income; mean (±SD) | Cluster 6 Elevated standard of living; mean (±SD) | Cluster 7 Globally poor; mean (±SD) | p-value |
|---|---|---|---|---|---|---|---|---|
 | ||||||||
| Thailand | N = 131 (14%) | N = 98 (10%) | N = 170 (18%) | N = 146 (15%) | N = 402 (42%) | |||
| Income (/100) | 48 (±28) | 8 (±6) | 3 (±5) | 5 (±6) | 2 (±4) | <0.001* | ||
| Assets (/100) | 31 (±15) | 25 (±6) | 31 (±10) | 6 (±6) | 6 (±5) | <0.001* | ||
| Standard of living (/100) | 27 (±11) | 34 (±6) | 19 (±7) | 26 (±7) | 11 (±6) | <0.001* | ||
| Median patient’s household and economic unit income ($PPP; IQR) | 8711 (7105; 12,544) | 4041 (2718; 5508) | 2885 (1443; 3607) | 2525 (1324; 4208) | 2164 (1082; 3511) | 0.015* | ||
| Vehicle ($PPP) | 28,378 (±24,929) | 60,713 (±208,260) | 42,140 (±110,178) | 49,390 (±198,054) | 22,664 (±98,504) | 0.040* | ||
| Ownership of primary dwelling ($PPP) | 287,370 (±276,403) | 447,628 (±1,129,678) | 361,425 (±1,308,345) | 435,252 (±3,130,555) | 146,931 (±590,921) | 0.142 | ||
| Business description ($PPP) | 13,391 (±68,289) | 2411 (±12,147) | 3684 (±19,254) | 2613 (±22,375) | 992 (±11,054) | 0.001* | ||
| Financial assets ($PPP) | 53,927 (±240,953) | 366,151 (±3,112,416) | 37,025 (±98,021) | 17,586 (±83,621) | 13,336 (±79,926) | 0.036* | ||
| Rental of the primary dwelling ($PPP) | 101 (±496) | 67 (±281) | 71 (±429) | 168 (±670) | 189 (±1546) | 0.687 | ||
| Education fees ($PPP) | 460 (±929) | 668 (±2558) | 233 (±594) | 544 (±2519) | 389 (±2494) | 0.509 | ||
| Monthly household expenditures ($PPP) | 1155 (±1117) | 1958 (±5261) | 1781 (±6649) | 1759 (±8392) | 1389 (±4739) | 0.737 | ||
| UAE | N = 39 (11%) | N = 42 (12%) | N = 70 (20%) | N = 196 (56%) | ||||
| Income (/100) | 52 (±31) | 32 (±7) | 7 (±6) | 3 (±5) | <0.001* | |||
| Assets (/100) | 16 (±13) | 2 (±3) | 1 (±2) | 1 (±3) | <0.001* | |||
| Standard of living (/100) | 37 (±10) | 33 (±10) | 31 (±5) | 13 (±8) | <0.001* | |||
| Median patient’s household and economic unit income ($PPP; IQR) | 9724 (7001; 14,780) | 6807 (5834; 7973) | 3112 (1556; 4278) | 1964 (895; 2937) | <0.001* | |||
| Vehicle ($PPP) | 8471 (±9089) | 2812 (±2754) | 2797 (±4952) | 831 (±1945) | <0.001* | |||
| Ownership of primary dwelling ($PPP) | 44,998 (±171,763) | 0 (±0) | 0 (±0) | 595 (±7076) | <0.001* | |||
| Business description ($PPP) | 4787 (±29,895) | 0 (±0) | 0 (±0) | 0 (±0) | 0.047* | |||
| Financial assets ($PPP) | 15,999 (±24,746) | 2249 (±2857) | 1298 (±2352) | 1455 (±8906) | <0.001* | |||
| Rental of the primary dwelling ($PPP) | 2928 (±5842) | 2009 (±1317) | 1370 (±760) | 515 (±536) | <0.001* | |||
| Education fees ($PPP) | 795 (±1169) | 693 (±1288) | 615 (±1142) | 105 (±214) | <0.001* | |||
| Monthly household expenditures ($PPP) | 607 (±356) | 557 (±292) | 494 (±353) | 202 (±179) | <0.001* | |||
| Mexico | N = 19 (17%) | N = 12 (11%) | N = 10 (9%) | N = 19 (17%) | N = 50 (45%) | |||
| Income (/100) | 55 (±17) | 47 (±16) | 24 (±13) | 44 (±10) | 14 (±8) | <0.001* | ||
| Assets (/100) | 23 (±8) | 7 (±5) | 28 (±22) | 6 (±5) | 3 (±3) | <0.001* | ||
| Standard of living (/100) | 40 (±15) | 42 (±6) | 30 (±8) | 22 (±6) | 17 (±7) | <0.001* | ||
| Median patient’s household and economic unit income ($PPP; IQR) | 958 (452; 1773) | 931 (188; 1773) | 616 (0; 887) | 709 (213; 1419) | 288 (67; 709) | 0.013* | ||
| Vehicle ($PPP) | 2333 (±4703) | 296 (±1024) | 1552 (±4753) | 1027 (±3201) | 319 (±1590) | 0.125 | ||
| Ownership of primary dwelling ($PPP) | 127,400 (±92,533) | 48,397 (±35,640) | 118,370 (±92,241) | 67,667 (±72,167) | 29,531 (±26,280) | <0.001* | ||
| Business description ($PPP) | 1027 (±4475) | 0 (±0) | 8867 (±19,154) | 0 (±0) | 62 (±380) | 0.001* | ||
| Financial assets ($PPP) | 5500 (±6660) | 924 (±1325) | 6588 (±15,083) | 1177 (±2099) | 490 (±1353) | 0.001* | ||
| Rental of the primary dwelling ($PPP) | 83 (±290) | 111 (±384) | 0 (±0) | 80 (±194) | 61 (±146) | 0.796 | ||
| Education fees ($PPP) | 133 (±246) | 219 (±506) | 8 (±25) | 118 (±227) | 37 (±95) | 0.068 | ||
| Monthly household expenditures ($PPP) | 532 (±212) | 612 (±212) | 350 (±120) | 472 (±225) | 319 (±160) | <0.001* | ||
*p < 0.05.
$PPP: Purchasing power parity dollar; IQR: Interquartile range; SD: Standard deviation.
Three-dimensional biplot visualization based on PC analysis is shown in Supplementary Video 1 for the three countries, further illustrating the differentiated characteristics of the patients across the clusters. Globally wealthy patients (cluster 1) projected on the same directions as the three PFET variables, whereas globally poor (cluster 7) projected on opposite ones. Intermediate profiles (clusters 2–6) projected according to the combinations previously described.
Discussion
The results presented here demonstrate that the PFET is a valuable tool for identifying and characterizing the economic status of specific patient subgroups in different countries. Importantly, these findings also underscore the country-specific differences in the correlation between the specific economic indicators of income, assets and SoL and patients’ overall economic status. For example, wealth in Mexico is more directly tied to income than it is to SoL, whereas assets capture some clusters of patients (shown in orange) (Figure 1C). This demonstrates that the combination of income and assets is an effective way to assess wealth status in Mexico. However, SoL seems to be the primary driver of wealth in the UAE, whereas SoL and assets play a larger role in wealth in Thailand (Figure 1A & B). These findings demonstrate the potential pitfalls of using any one economic indicator as a single metric across all countries, and supports the use of a multi-factorial approach, such as the PFET in determining patients’ financial eligibility to pay for patented drugs and, potentially, to be able to manage other types of financial expenditures.
Another key finding is that the specific types of clusters that can be identified using data collected by the PFET also vary among the three countries included in the analysis. For example, both the UAE and Thailand have a cluster of patients defined by a higher SoL (Figure 1A & B & Table 1), whereas this cluster is not found in Mexico (Figure 1C & Table 1). Similarly, Thailand has a cluster of patients defined by higher assets, whereas Mexico and the UAE do not. This again highlights the importance of both utilizing multiple indicators to determine economic status and tailoring the indicators used to reflect the economic factors within individual countries.
In fact, economic factors varied among the three countries included in this analysis, and the results provide several examples of the interplay between them and the ability to effectively assess patients’ wealth status. For example, the patient population assessed in Mexico resides in structured, urban economics settings in which the informal economy has a limited impact. In contrast, the informal economy is a very important factor in Thailand, which makes income an unreliable indicator for determining wealth status in this country. Instead, SoL and, to some extent, assets are the most reliable indicators for Thai patients. The UAE has yet other factors that must be considered in assessing patient wealth status and ability to pay for medication. This is due to the fact that most patients in the UAE who need financial assistance for purchasing medication are expatriates whose assets are primarily located outside of the country. Additionally, some patient clusters have high SoL without high income, which may be due to workers receiving weekly wages in cash. Again, these diverse economic environments further underscore the utility of examining multiple metrics of wealth assessment rather than relying on a single indicator that may not be relevant in all countries or communities.
It should be noted that the PFET utilizes indicators of wealth as its metrics, whereas the financial assessment tools typically used by charitable organizations evaluate indicators of poverty. This may account in part for the variation in income, assets and SoL among the countries included in this analysis compared with what might be expected based on poverty indicators within these countries.
The ‘Numero’ cluster analysis algorithm used in this study combines the self-organizing map algorithm, permutation analysis for statistical evidence and a final expert-driven subgrouping step and has previously been shown to enable the identification of subgroups with related features despite the lack of an obvious clustering structure [9]. The current study provides additional evidence that cluster analysis can be a powerful tool for evaluating a variety of patient characteristics and gaining insights into the clinical and economic factors that impact patients’ access to care, disease management strategies and overall health outcomes.
Finally, our study has limitations worth discussing, including the lack of comparison to other asset-based wealth indices such as the International Wealth Index [11] or the Comparative Wealth Index [12], as data collection was not initially designed to capture the same items as those required for calculation of these indices and we consequently lacked targeted or sufficiently detailed information in our database to draw comparisons. Second, we did not evaluate the correlation between PFET results and macroeconomic development measurements at the national level (e.g., Gross National Income per capita or poverty indicators from World Bank such as Poverty Headcount Ratios [11]) to provide additional validation of the predictive ability of PFET. Such analysis would have been limited by the number of countries analyzed in the present work (n = 3) and could have yielded potentially misleading results given the selection of our sample, which was not constituted based on a representative sampling methodology but based on the real-life enrollment of patients in drug access programs.
Conclusion
The continuing rise in the cost of prescription medications, coupled with growing and aging populations, places an increasing burden on governments around the world to meet the healthcare costs of their citizens. A growing proportion of patients in low- and middle-income countries face the challenge of purchasing expensive and life-saving medications while trying to balance other essential expenses and not descend down the economic ladder. Strategies utilizing modest price reduction and uniform free-of-charge treatment have been pursued, but their overall health impact has limited because they often do not allow patients to receive a full course of medication therapy that is needed for optimal outcomes. The PFET is a versatile tool that can be adapted to each country’s economic context to assess patients’ ability to contribute to their medication costs and determine the subsidy they need to complete their treatment course. By allowing subsidy funds to be used more effectively, the PFET may play an important role in ensuring continuity of treatment and improving access to prescription medicines for more patients.
Future perspective
Ongoing discovery and innovation in clinical medicine is a powerful driver for more specialized and increasingly individualized healthcare. Continued advance of this trend is likely to culminate in more widespread adoption of personalized therapies tailored to each patient’s genetics in the next 5–10 years. Such individualized approaches will require more individualized care, treatment and follow up and likely involve more care overall. Ensuring that patients in low- and middle-income countries have access to and benefit from newer, more personalized treatments will require effective use of these patients’ financial resources and the financial resources of patient support programs. The ability to accurately assess patients’ financial ability to contribute financially to the cost of their prescription medications will thus become even more critical in developing sustainable access models. Consequently, PFET will be an increasingly valuable tool in this evolving health system context.
•
Patient Financial Eligibility Tool (PFET) as a tool for assessing patients’ ability to pay for prescription medications.
•
Due to its use of multiple component metrics, the PFET is a sensitive tool for assessing patients' economic status and ability to pay for prescription medications.
•
Cluster analysis of PFET data gathered from patients in three countries identified distinct subpopulations that share or lack common characteristics.
•
The findings also underscore the country-specific differences in the correlation between the specific economic indicators of income, assets and standard of living and patients’ overall economic status.
•
Effectively determining patients’ ability to contribute to their prescription medication costs may allow subsidy funds to be used more effectively, thus providing more patients with access to a full course of medical therapy that can improve their healthcare outcomes.
Author contributions
E Audureau has contributed to the conception of the work, data analysis and interpretation, and to drafting the manuscript. MH Besson contributed to the conception of the work, data acquisition and interpretation of the results, and to revising critically the manuscript. A Nofal, R Jayasundera, J Saba and J Ladner contributed to the conception of the work, interpretation of the results and to revising critically the manuscript. All authors gave their final approval of the manuscript and agreed to be accountable for all aspects of the work.
Financial & competing interests disclosure
The authors have no relevant affiliations or financial involvement with any organization or entity with a financial interest in or financial conflict with the subject matter or materials discussed in the manuscript. This includes employment, consultancies, honoraria, stock ownership or options, expert testimony, grants or patents received or pending, or royalties.
Writing assistance has been used for the creation of the manuscript and funded by Axios International.
Ethical conduct of research
An informed and signed consent has been obtained from all participants for data collection and treatment. All analyses were performed based on anonymized information.
Open access
This work is licensed under the Attribution-NonCommercial-NoDerivatives 4.0 Unported License. To view a copy of this license, visit http://creativecommons.org/licenses/by-nc-nd/4.0/
Supplementary Material
File (supp_video_1_-_clusters_3d_biplot.pptx)
- Download
- 4.84 MB
References
Papers of special note have been highlighted as: • of interest
1.
Rutstein O, Johnson K. The DHS Health Index. DHS Comparative Reports 6 (2004). https://dhsprogram.com/pubs/pdf/CR6/CR6.pdf
2.
Chakraborty NM, Fry K, Behl R, Longfield K. Simplified asset indices to measure wealth and equity in health programs: a reliability and validity analysis using survey data from 16 countries. Global Health Sci. Pract. 4(1), 141–154 (2016).
3.
Davies JB. An overview of personal wealth. In: Personal Wealth From A Global Perspective, Davies BJ (Ed.). Oxford University Press, NY, USA, 1–23 (2008).
4.
Filmer D, Pritchett LH. Estimating wealth effects without expenditure data – or tears: an application to educational enrollments in states of India. Demography 38(1), 115–132 (2001).
• Provides key background information on wealth index development.
5.
Vyas S, Kumaranayake L. Constructing socio-economic status indices: how to use principal components analysis. Health Policy Plan 21(6), 459–468 (2006).
6.
Saba J, Audureau E, Bize M, Koloshuk B, Ladner J. Development and validation of a multilateral index to determine economic status in developing countries: the Patient Financial Eligibility Tool (PFET). Popul Health Manag. 16(2), 82–89 (2013).
• Provides information on the Patient Financial Eligibility Tool initial development and validation.
7.
Schneider F, Buehn A, Montenegro CE. Shadow economies all over the world: new estimates for 162 countries from 1999 to 2007. Policy Research Working Paper. The World Bank (2010). http://documents.worldbank.org/curated/en/311991468037132740/pdf/WPS5356.pdf
8.
Kohonen T, Self-organizing maps (3rd Ed.) In: Springer Series in Information Sciences. Huang ST, Kohonen T, Schroeder RM. (Eds.). Springer, NY, USA (2001).
9.
Gao S, Mutter S, Casey A, Makinen VP. Numero: a statistical framework to define multivariable subgroups in complex population-based datasets. Int. J. Epidemiol. (2018) (Epub ahead of print).
• Provides key information on the Self-Organized Maps methodology and its implementation within the Numero statistical framework.
10.
Gabriel KR. The biplot graphic display of matrices with application to principal component analysis. Biometrika 58, 453–467 (1971).
11.
Smits J, Steendijk R. The International Wealth Index (IWI). Soc. Indic. Res. 122(1), 65–85 (2015).
12.
Rutstein O, Staveteig S. Making the demographic and Health Surveys Wealth Index comparable. DHS Methodological Reports 9 (2014). www.dhsprogram.com/pubs/pdf/MR9/MR9.pdf
Information & Authors
Information
Published In
Pages: 969 - 977
PubMed: 31298554
Copyright
© 2019 Axios International. This work is licensed under the Attribution-NonCommercial-NoDerivatives 4.0 Unported License
History
Received: 22 May 2019
Accepted: 21 June 2019
Published online: 12 July 2019
Keywords:
Topics
Authors
Metrics & Citations
Metrics
Article Usage
Article usage data only available from February 2023. Historical article usage data, showing the number of article downloads, is available upon request.
Citations
How to Cite
Ability to pay for medication: a clustering analysis of 1404 patients with the Patient Financial Eligibility Tool. (2019) Journal of Comparative Effectiveness Research. DOI: 10.2217/cer-2019-0063
Export citation
Select the citation format you wish to export for this article or chapter.