Treatment patterns, glycemic control and bodyweight with canagliflozin 300 mg versus GLP1RAs in Type II diabetes patients
Publication: Journal of Comparative Effectiveness Research
Abstract
Aim: Real-world effectiveness of canagliflozin 300 mg versus glucagon-like peptide-1 receptor agonists (GLP1RAs) was examined in patients with Type II diabetes. Patients & methods: Patients were selected from the Optum integrated database of administrative claims and electronic health record data (1 January 2013 to 31 March 2015). Results: Patients were less likely to discontinue (p < 0.0001) or switch (p = 0.0048), more likely to add-on treatment (p = 0.0314), and achieve HbA1c <8.0% (p = 0.0364) or weight loss ≥5% (p < 0.0001) with canagliflozin versus GLP1RAs over 9 months. Mean HbA1c was similar at 3-month intervals over 9 months with canagliflozin and GLP1RAs. Conclusion: Patients were less likely to discontinue or switch with canagliflozin than GLP1RA, and were more likely to add-on. Canagliflozin patients were more likely to achieve HbA1c <8.0% and weight loss ≥5% than GLP1RA patients.
Type II diabetes mellitus (T2DM) is a progressive disease characterized by hyperglycemia, β-cell dysfunction and insulin resistance [1]. Patients with T2DM have an increased risk of serious health consequences including macro- and microvascular complications (e.g., nephropathy), with risks further increasing in individuals with worse glycemic control [2,3]. Achieving glycemic control reduces the risk of complications and is a therapeutic goal for the management of T2DM [4,5]. The American Association of Clinical Endocrinologists (AACE) and American College of Endocrinology (ACE) guidelines recommend a hemoglobin A1c (HbA1c) target of ≤6.5%, while the American Diabetes Association recommends an HbA1c target of <7.0% for many patients with diabetes [4,5]. The Healthcare Effectiveness Data and Information Set (HEDIS®) reports HbA1c <8.0% as a quality of care indicator [6]. Treatment guidelines for T2DM also emphasize the importance of comprehensive cardiovascular risk factor management including tobacco abstinence, weight loss and blood pressure and lipid control [4,5]. Despite the availability of a range of antihyperglycemic agents (AHAs), many patients do not reach recommended HbA1c targets [7,8]. Adherence and persistence to AHA therapy can be challenging for patients with T2DM and may impact the likelihood of achieving HbA1c targets [9,10].
Newer AHAs for T2DM, including sodium glucose co-transporter 2 (SGLT2) inhibitors and glucagon-like peptide-1 receptor agonists (GLP1RAs), have been shown to be effective for glycemic control and to promote weight loss, which may contribute to the cardiovascular benefits seen with some of these agents [11,12]. SGLT2 inhibitors lower the renal threshold for glucose, thereby increasing urinary glucose excretion and caloric loss [13]. GLP1RAs increase insulin secretion and satiety, decrease glucagon release and delay gastric emptying leading to decreased blood glucose and weight loss [14]. The efficacy of SGLT2 inhibitors versus GLP1RAs has not been evaluated in randomized controlled trials, but network meta-analyses of clinical trial data have suggested similar or greater reductions in HbA1c and bodyweight in patients with T2DM treated with canagliflozin versus GLP1RAs when used as a second- or third-line therapy [15–18].
Real-world studies can provide comparative effectiveness data in the absence of direct clinical evidence. This study evaluated the effectiveness of the SGLT2 inhibitor canagliflozin (300 mg dose) versus GLP1RAs in patients with T2DM. Given the time frame for this study and relative launch dates, selection of canagliflozin alone was based on need to ensure sufficient sample size while clearly delineating individual SGLT2 inhibitor effects, since canagliflozin has been suggested to be more effective at HbA1c reduction than other SGLT2 inhibitors in meta-analyses (notably the 300 mg dose) [19]. Individual GLP1RAs have not been differentiated in meta-analyses, so the comparison group included all GLP1RA use. Although the recommended starting dose of canagliflozin is 100 mg, clinical studies have shown that the higher dose of canagliflozin (300 mg) is associated with the greatest glycemic benefit [20]. Therefore, to avoid potential confounding due to the intermediate HbA1c-lowering effects of canagliflozin 100 mg, this analysis focused on canagliflozin 300 mg, which is widely used in clinical practice [21].
This real-world study compared the effectiveness of canagliflozin 300 mg versus GLP1RAs on treatment patterns (discontinuation, switch, add-on, adherence), glycemic control (achieving HbA1c quality targets), HbA1c (at 3-month intervals), bodyweight (at 3-month intervals) and weight loss target attainment (i.e., HEDIS and AACE/ACE targets) in patients with T2DM managed in routine practice.
Methods
Data source
This retrospective study utilized the Optum integrated database, which combines data from the administrative claims of more than 170 million individuals with clinical information from the Humedica de-identified electronic health records (EHRs) of more than 80 million individuals. The database included approximately 30.6 million commercial and 3.1 million Medicare Advantage enrollees as of 2014 [22]. Claims include International Classification of Disease, Ninth Revision, Clinical Modification (ICD-9-CM) and International Classification of Disease, Tenth Revision, Clinical Modification (ICD-10-CM) diagnosis and procedure codes, Current Procedural Terminology codes, Healthcare Common Procedure Coding System codes, site-of-service codes and costs including health plan and patient costs. Pharmacy data include National Drug Codes for dispensed medications, quantity dispensed, drug strength, days of supply and costs. The integrated EHR and claims data help to determine burden of illness by capturing the physician and patient-identified factors and allowing for the assessment of HbA1c over time [23].
Study cohorts
This retrospective observational study compared outcomes in patients initiating canagliflozin 300 mg versus GLP1RAs. The study period was from 1 April 2012 to 31 December 2015; the selection of this period was based on the Optum integrated data available at the time of initiation of this study relative to the approval and launch dates of canagliflozin. The analysis period spanned from 1 January 2013 to 31 March 2015, during which patients were required to have ≥1 prescription claim for canagliflozin 300 mg or any GLP1RA (i.e., liraglutide, exenatide, dulaglutide, albiglutide and lixisenatide). The index date was the date of the first prescription claim for canagliflozin 300 mg or a GLP1RA during the analysis period. Patients were assigned to the canagliflozin 300 mg or GLP1RA cohort based on the agent initiated on the index date. Eligible patients were required to have ≥1 diagnosis claim for T2DM (ICD-9-CM: 250.x0, 250.x2, 357.2; ICD-10-CM: E11.x) during the study period, be aged ≥18 years on the index date, have continuous health plan enrollment with medical and pharmacy benefits for 9 months before the index date (baseline period) and 9 months after the index date (follow-up period), and have ≥1 HbA1c measurement in the baseline and ≥30 days after the index date during the 9-month follow-up period. The 9-month follow-up period was chosen to allow for quarterly assessment of HbA1c levels after initiation of index medication while retaining sufficient sample size.
Patients were excluded if they had a medical claim with evidence of Type I diabetes (ICD-9-CM: 250.x1, 250.x3; ICD-10-CM: E10.xx), pregnancy (ICD-9-CM: 630.xx-679.xx, V22.x-V24.x; ICD-10-CM: O01.xx-O90.xx, Z33.x-Z39.x), gestational diabetes (ICD-9-CM: 648.8; ICD-10-CM: O99.810, O99.814, O99.815, O24.2), or chronic kidney disease stage IIIb or higher (ICD-9-CM: 585.4, 585.5, 585.6; ICD-10-CM: N18.4, N18.5, N18.6) during the study period. They were also excluded if they had ≥1 prescription claim for any SGLT2 inhibitor including their fixed-dose combinations or a GLP1RA during the baseline period; had a claim for both canagliflozin 300 mg and a GLP1RA on the index date; initiated >1 medication within the GLP1RA class on the index date; had no evidence of AHA therapy in the baseline period; or had baseline HbA1c <6.0%.
A separate subgroup analysis was conducted in patients with ≥1 bodyweight measurement during the baseline period and ≥30 days after the index date during the follow-up period.
Outcomes
Treatment patterns were evaluated in the main analysis population. Discontinuation was defined by a gap of >60 days between two consecutive claims during the follow-up period, with the end date of the first claim (determined from the start date and reported days of supply) defined as the discontinuation date. Each treatment gap between claims was calculated from the end date of the first claim and the start date of the next claim. Persistence was defined as the total number of days from the index date to the discontinuation date during the follow-up period. Switching was defined as evidence of a prescription claim for a new non-index AHA within 60 days after the discontinuation date of the index medication. Add-on therapy was defined as evidence of a prescription claim for a new non-index AHA within a 60-day gap from the end of days’ supply of the previous index prescription claim among patients continuing the index medication or a prescription claim for a new non-index AHA overlapping completely or partially with the index medication. The initiation of an index medication fixed-dose combination (canagliflozin/metformin) or down-titration of canagliflozin dose after index were not considered to be discontinuation, switch or add-on events. The time to discontinuation, switch or add-on in the 9-month follow-up period was evaluated individually, and also as a composite event of time to discontinuation or switch or add-on. Adherence to treatment was assessed over the 9-month follow-up period using the proportion of days covered (defined as the number of days covered by prescription claims for the index medication divided by the number of days in the 9-month follow-up period) and the medication possession ratio (defined as the sum of the days’ supply from all prescription claims for the index medication divided by the number of days in the 9-month follow-up period). As data for this study were only collected until December 2015, recently approved GLP1RA/insulin combinations (i.e., including insulin degludec/liraglutide and insulin glargine/lixisenatide) were not commercially available at the time of these analyses.
HbA1c levels and bodyweight were evaluated within 3-month intervals. The proportions of patients achieving HbA1c <6.0%, <6.5%, <7.0%, <8.0% or <9.0% were assessed among those not meeting the respective targets at baseline [4,6]. The proportions of patients achieving weight loss ≥5% or ≥10% were assessed [4]. Additionally, time to achieve above-mentioned HbA1c and bodyweight goals were assessed among eligible patients.
Statistical analysis
Descriptive statistics (means and standard deviations for continuous variables, numbers and percentages for categorical variables) were provided for baseline demographic and clinical characteristics in the canagliflozin 300 mg and GLP1RA cohorts. Statistical tests of significance (t-test for continuous variables and χ2 for categorical variables) were used to assess differences between the cohorts. Additionally, standardized differences (STDs), defined as the absolute difference in sample means divided by an estimate of the pooled standard deviation of the variable, were calculated for each variable. These differences are important in distinguishing practical from statistical significance.
The propensity score weighted regression model used the inverse probability of treatment weighting approach to create cohorts with balanced baseline characteristics. Given the lesser overlap in the propensity scores between the 2 cohorts, this was an optimal approach to minimize confounding while retaining a sufficiently large study population [24]. Propensity scores were estimated using a multivariate logistic regression conditional on baseline covariates – age, sex, race, US geographical region, Quan–Charlson comorbidity index score, Diabetes Complications Severity Index, baseline individual comorbidities (cardiovascular, hypertension, retinopathy, diabetic nephropathy, diabetic neuropathy, genital mycotic infections, urinary tract infections, volume depletion, renal disease, hyperlipidemia, peripheral vascular disease, mental illness), baseline AHA therapy, baseline antihypertensive medications and baseline HbA1c closest to the index date as continuous and categorical variables (6.0%–7.0%, 7.0%–8.0%, 8.0%–9.0% and ≥9.0%). BMI information was unavailable for approximately 40% of patients, so it was not included as a covariate in inverse probability of treatment weighting in order to retain the final sample size. Weights were calculated as the inverse of the patient’s estimated propensity score and normalized by dividing each individual weight by the overall mean weight. After weighting, the sum of weights attributed to each patient in a given cohort might not be equal to the sample size of this cohort; consequently, the sample size after weighting might be different from the original cohort sample size. However, the total number of patients in the analysis remained the same before and after weighting. STDs were assessed for each of the baseline characteristics to ensure well-balanced cohorts; a difference of <10% was considered well balanced [24,25].
Outcomes including treatment patterns, HbA1c levels and attainment of HbA1c targets were compared in this weighted sample. A weighted generalized linear model was used to model the HbA1c levels at each follow-up time interval, and weighted Kaplan–Meier curves and Cox proportional hazards models were used to calculate hazard ratios (HRs) and 95% CIs to compare the HbA1c target attainment and the risk of discontinuation, switching, add-on and the composite event of discontinuation or switch or add-on in the follow-up period by applying the normalized weights obtained from the above inverse probability of treatment weighting in the main sample. The assumption of the Cox model was tested by adding the time-dependent covariate in the model. Additionally, BMI was not adjusted in the weighted generalized linear model or Cox models due to the large proportion of patients with missing values.
For the bodyweight subset analysis, inverse probability of treatment weights was not recalculated and there remained differences in baseline characteristics. These were reviewed for clinical relevance and were not adjusted further, since they may have been driven by low event size. For the analyses of bodyweight levels at each follow-up interval and associated quality attainment targets, baseline bodyweight closest to the index date was adjusted in the generalized linear model and Cox models in addition to the normalized weights from the above inverse probability of treatment weighting in the main sample. Adjustment for baseline bodyweight accounted for a patient’s BMI, which is mainly driven by bodyweight in adults. All analyses were conducted using SAS® statistical software (Version 9.4, SAS Institute, NC, USA).
Results
Patient characteristics
A total of 13,612 patients had a claim for canagliflozin 300 mg or a GLP1RA during the identification period (2117 for canagliflozin 300 mg; 11,495 for a GLP1RA). Of these patients, 201 patients who initiated canagliflozin 300 mg and 630 patients who initiated GLP1RAs met all study criteria (Figure 1). Of the patients in the GLP1RA cohort, 420 patients (67%) received liraglutide (58% of whom received 1.2 mg and 34% received 1.8 mg on the index date), 201 (32%) received exenatide (63% of whom received extended-release: and 37% received twice-daily), 7 (1%) received albiglutide and 2 (0.3%) received dulaglutide.
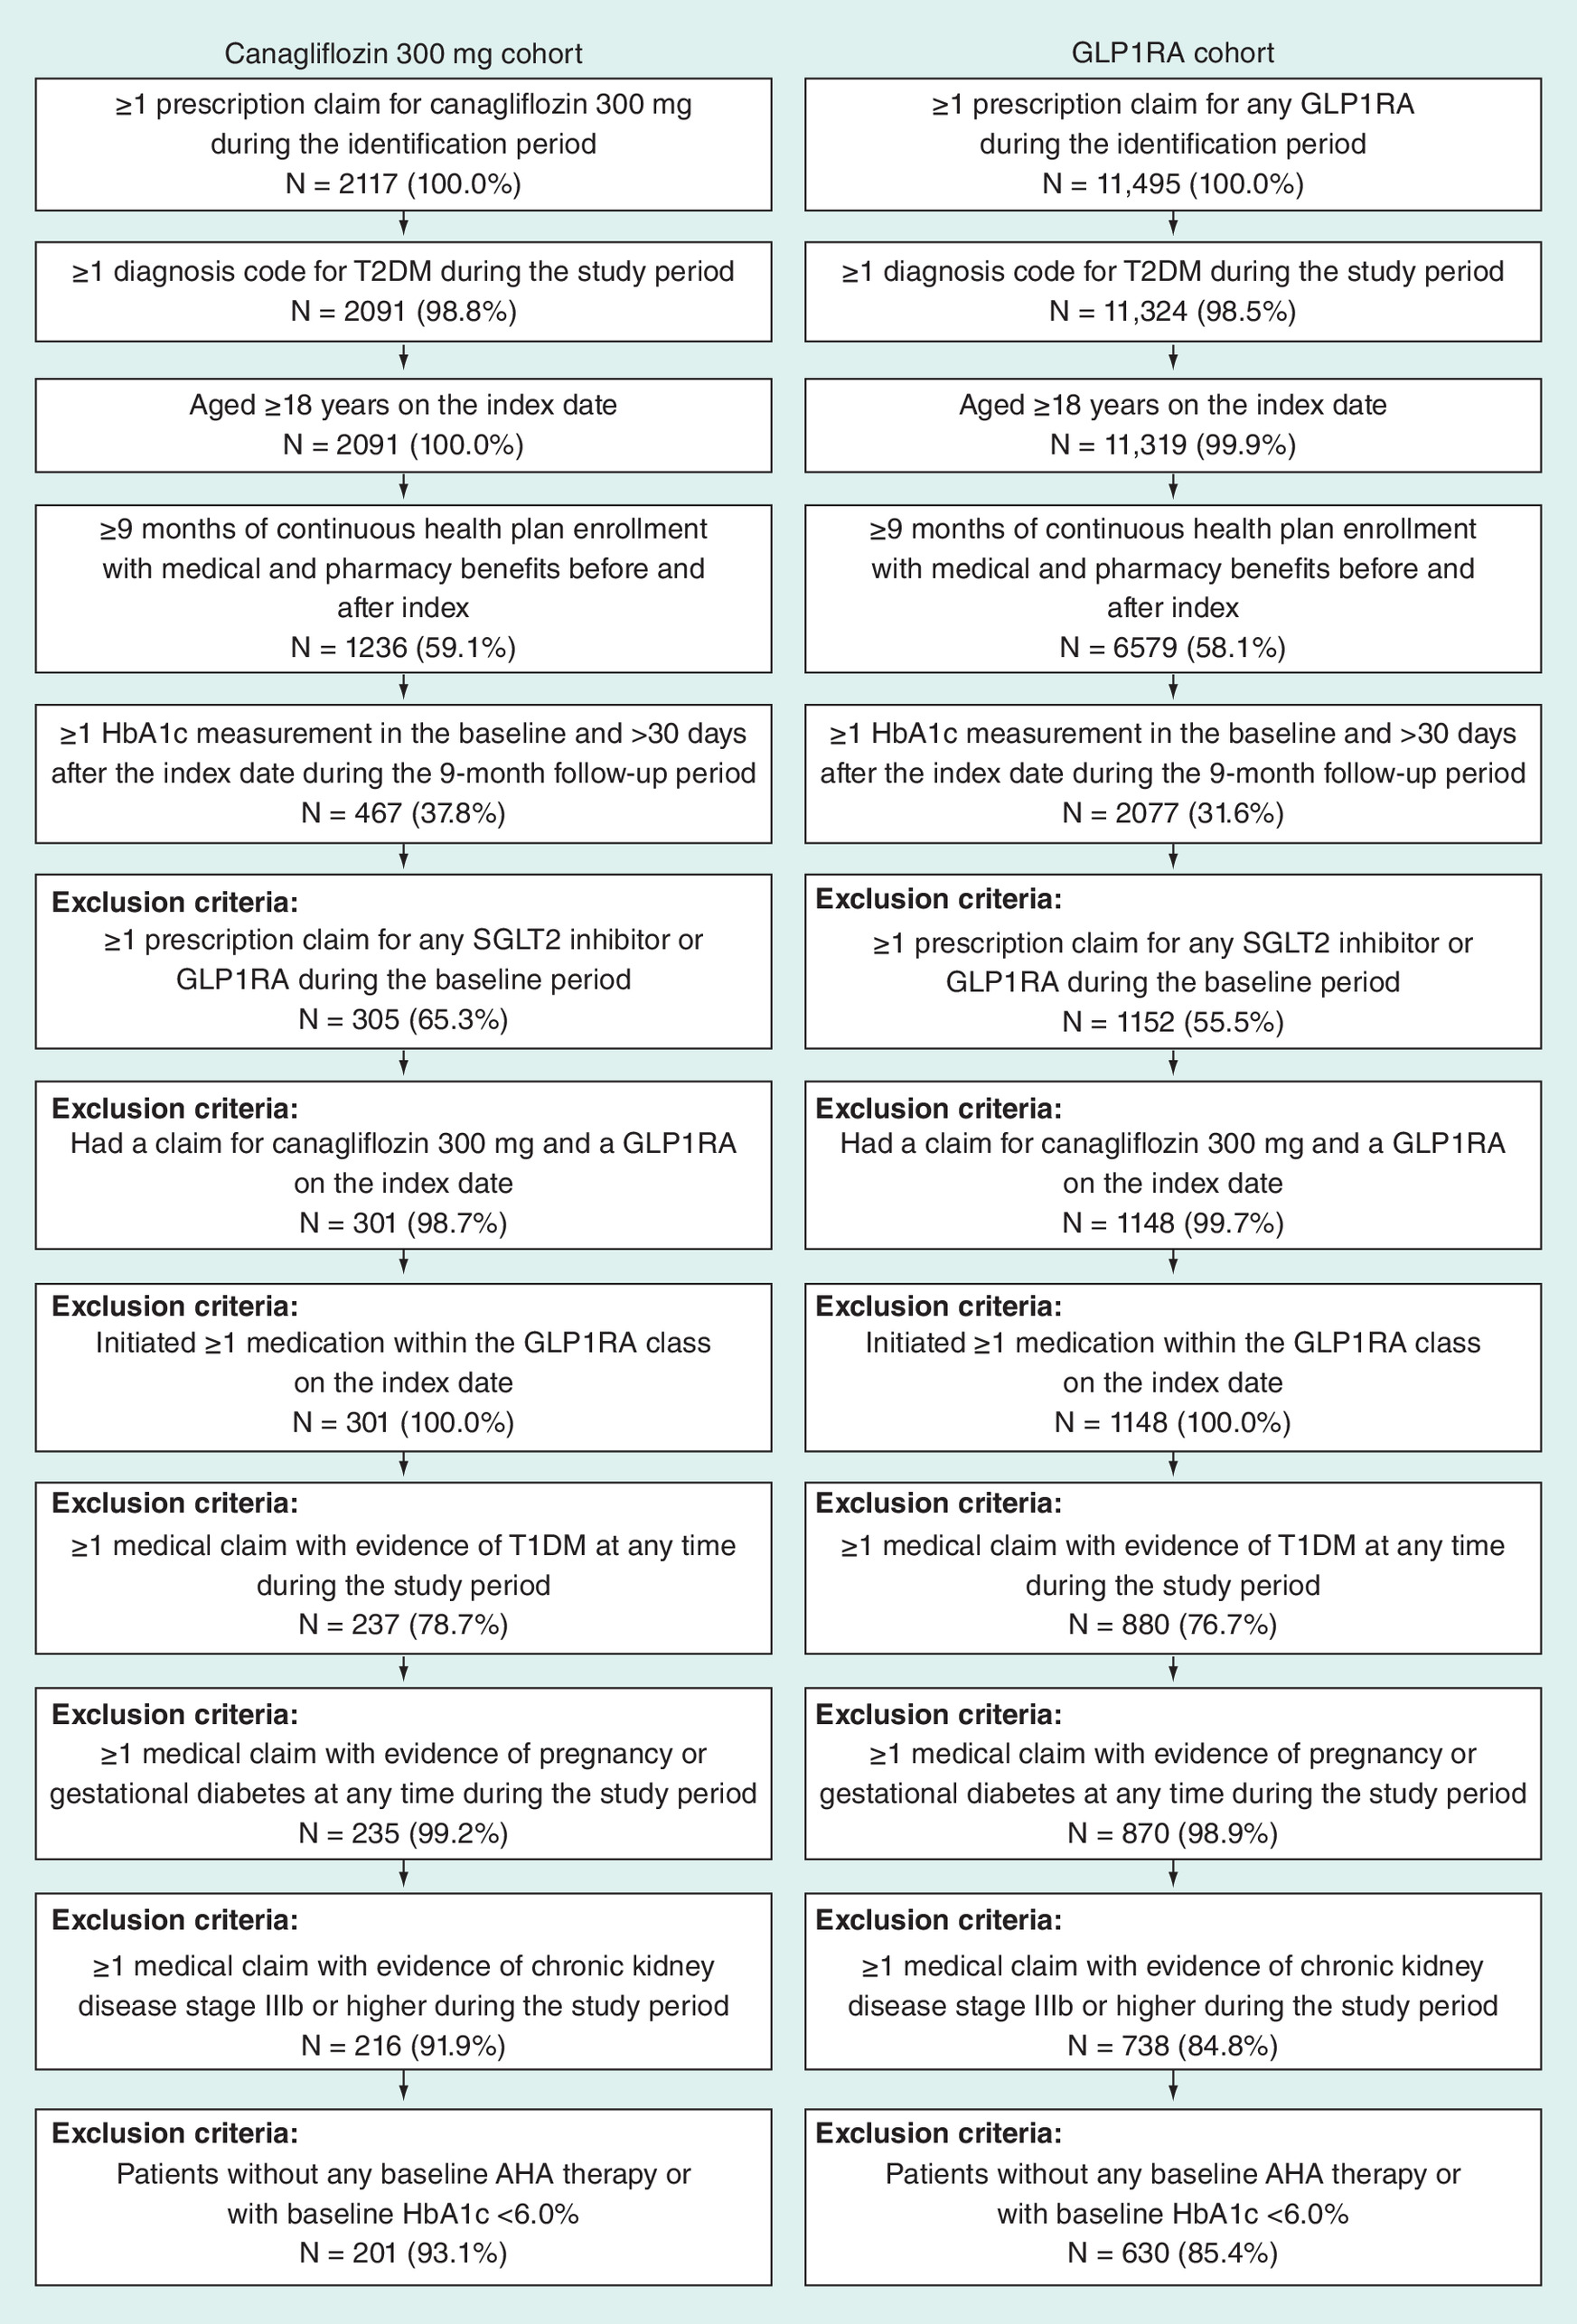
Figure 1. Attrition diagram.
AHA: Antihyperglycemic agent; GLP1RA: Glucagon-like peptide-1 receptor agonist; SGLT2: Sodium glucose co-transporter 2; T1DM: Type I diabetes mellitus; T2DM: Type II diabetes mellitus.
After inverse probability of treatment weighting, the weighted populations included 407 patients in the canagliflozin 300 mg cohort and 424 patients in the GLP1RA cohort. For both cohorts, the mean age was 55 years, 44% of patients were female, the mean Quan–Charlson comorbidity index score was 1.9 and the mean Diabetes Complications Severity Index was 0.7. The cohorts were generally well balanced except that patients in the GLP1RA cohort had higher BMI than patients in the canagliflozin 300 mg cohort (37.9 vs 35.7 kg/m2; p = 0.0062; STD: 25.5%; Table 1). However, BMI was not adjusted further in the multivariate analysis due to the large proportion of missing values (∼40% of patients).
| Demographic/clinical characteristics | Before inverse probability of treatment weighting | After inverse probability of treatment weighting | ||||||
|---|---|---|---|---|---|---|---|---|
| Canagliflozin 300 mg cohort (N = 201) | GLP1RA cohort (N = 630) | p-value† | STD | Canagliflozin 300 mg cohort (N = 407) | GLP1RA cohort (N = 424) | p-value† | STD | |
| Age, years, mean (SD) | 54.2 (8.9) | 55.4 (10.3) | 0.1128 | 12.4 | 54.6 (13.4) | 55.2 (8.2) | 0.4499 | 5.3 |
| Age categories, n (%): | ||||||||
| – 18–40 years | 11 (5.5) | 47 (7.5) | 0.3356 | 8.1 | 26 (6.4) | 29 (6.8) | 0.7818 | 1.7 |
| – 41–65 years | 170 (84.6) | 485 (77.0) | 0.0218 | 19.3 | 324 (79.6) | 335 (79.0) | 0.8281 | 1.3 |
| – 65+ years | 20 (10.0) | 98 (15.6) | 0.0474 | 16.8 | 57 (14.1) | 60 (14.2) | 0.9560 | 0.3 |
| Female, n (%) | 70 (34.8) | 293 (46.5) | 0.0036 | 23.9 | 178 (43.6) | 185 (43.7) | 0.9819 | 0.1 |
| Race, n (%): | ||||||||
| – Asian | 3 (1.5) | 14 (2.2) | 0.5246 | 5.4 | 3 (0.8) | 8 (1.9) | 0.1591 | 9.5 |
| – Caucasian | 145 (72.1) | 455 (72.2) | 0.9818 | 0.2 | 289 (70.9) | 305 (72.1) | 0.6976 | 2.3 |
| – African–American | 22 (10.9) | 59 (9.4) | 0.5108 | 5.2 | 47 (11.4) | 43 (10.1) | 0.5357 | 3.6 |
| – Other/unknown | 31 (15.4) | 102 (16.2) | 0.7961 | 2.1 | 69 (17.0) | 68 (15.9) | 0.6954 | 2.3 |
| Geographic region, n (%): | ||||||||
| – Midwest | 50 (24.9) | 163 (25.9) | 0.7779 | 2.3 | 102 (25.1) | 109 (25.6) | 0.8514 | 1.1 |
| – Northeast | 23 (11.4) | 52 (8.3) | 0.1695 | 10.7 | 37 (9.1) | 38 (8.9) | 0.9188 | 0.6 |
| – South | 112 (55.7) | 345 (54.8) | 0.8118 | 1.9 | 234 (57.5) | 235 (55.5) | 0.5537 | 3.5 |
| – West | 10 (5.0) | 49 (7.8) | 0.1779 | 11.5 | 19 (4.7) | 29 (6.9) | 0.1663 | 8.7 |
| – Other region | 6 (3.0) | 21 (3.3) | 0.8084 | 2.0 | 15 (3.7) | 13 (3.1) | 0.6465 | 2.7 |
| BMI, kg/m2, n (%) | 115 (57.2) | 368 (58.4) | 0.7642 | 2.4 | 231 (56.8) | 246 (58.1) | 0.6971 | 2.3 |
| BMI, kg/m2, mean (SD) | 35.2 (7.1) | 37.9 (7.8) | 0.0008 | 36.9 | 35.7 (10.4) | 37.9 (6.3) | 0.0062 | 25.5 |
| QCCI score, mean (SD) | 2.0 (1.4) | 1.9 (1.4) | 0.9243 | 0.8 | 1.9 (1.8) | 1.9 (1.1) | 0.8484 | 1.3 |
| QCCI score (without diabetes), mean (SD) | 0.5 (1.0) | 0.5 (1.0) | 0.5782 | 4.5 | 0.5 (1.3) | 0.5 (0.8) | 0.9707 | 0.3 |
| DCSI, mean (SD) | 0.8 (1.2) | 0.8 (1.2) | 0.7427 | 2.7 | 0.7 (1.5) | 0.7 (1.0) | 0.5590 | 4.1 |
| Baseline comorbidities, n (%): | ||||||||
| – Cardiovascular (any) | 27 (13.4) | 79 (12.5) | 0.7410 | 2.7 | 46 (11.4) | 52 (12.3) | 0.6874 | 2.4 |
| – Ischemic stroke | 4 (2.0) | 5 (0.8) | 0.1536 | 10.2 | 4 (0.9) | 4 (1.0) | 0.9418 | 0.4 |
| – Heart failure | 5 (2.5) | 15 (2.4) | 0.9316 | 0.7 | 5 (1.3) | 9 (2.2) | 0.3242 | 6.3 |
| – Myocardial infarction | 6 (3.0) | 9 (1.4) | 0.1490 | 10.6 | 6 (1.5) | 7 (1.7) | 0.8187 | 1.4 |
| – Arterial embolic events | 1 (0.5) | 1 (0.2) | 0.3934 | 5.9 | 1 (0.2) | 1 (0.2) | 0.9806 | 0.1 |
| – Unspecified heart disease | 1 (0.5) | 5 (0.8) | 0.6659 | 3.7 | 3 (0.8) | 3 (0.7) | 0.9053 | 0.7 |
| – Chronic ischemic heart disease | 22 (10.9) | 59 (9.4) | 0.5108 | 5.2 | 39 (9.7) | 40 (9.4) | 0.8919 | 0.8 |
| – Cardiomyopathy | 1 (0.5) | 10 (1.6) | 0.2392 | 10.7 | 2 (0.4) | 6 (1.3) | 0.1530 | 10.0 |
| – Hypertension | 111 (55.2) | 330 (52.4) | 0.4819 | 5.7 | 217 (53.3) | 224 (52.8) | 0.8877 | 0.8 |
| – Retinopathy | 12 (6.0) | 48 (7.6) | 0.4316 | 6.5 | 27 (6.6) | 31 (7.2) | 0.7284 | 2.1 |
| – Diabetic neuropathy | 21 (10.4) | 73 (11.6) | 0.6570 | 3.6 | 42 (10.3) | 48 (11.4) | 0.6070 | 3.1 |
| – Genital mycotic infections | 2 (1.0) | 6 (1.0) | 0.9570 | 0.4 | 6 (1.4) | 4 (1.0) | 0.6470 | 2.6 |
| – Urinary tract infections | 13 (6.5) | 44 (7.0) | 0.8009 | 2.1 | 27 (6.7) | 29 (6.8) | 0.9573 | 0.3 |
| – Volume depletions | 2 (1.0) | 11 (1.7) | 0.4550 | 6.5 | 4 (1.0) | 6 (1.5) | 0.5070 | 4.2 |
| – Renal diseases | 8 (4.0) | 24 (3.8) | 0.9129 | 0.9 | 11 (2.6) | 16 (3.7) | 0.3773 | 5.5 |
| – Hyperlipidemia | 162 (80.6) | 491 (77.9) | 0.4234 | 6.6 | 326 (80.0) | 334 (78.8) | 0.6732 | 2.5 |
| – Peripheral vascular disease | 7 (3.5) | 15 (2.4) | 0.3970 | 6.5 | 9 (2.3) | 10 (2.4) | 0.9154 | 0.6 |
| – Nephropathy | 12 (6.0) | 45 (7.1) | 0.5668 | 4.7 | 20 (5.0) | 29 (6.7) | 0.2853 | 6.6 |
| – Mental illness (any) | 23 (11.4) | 112 (17.8) | 0.0340 | 18.0 | 60 (14.8) | 68 (16.1) | 0.6191 | 3.0 |
| – Anxiety | 11 (5.5) | 49 (7.8) | 0.2716 | 9.3 | 29 (7.0) | 29 (6.9) | 0.9461 | 0.4 |
| – Depression disorder | 17 (8.5) | 83 (13.2) | 0.0735 | 15.2 | 45 (11.0) | 51 (12.0) | 0.6688 | 2.6 |
| – Parkinson’s disease | 0 (0.0) | 2 (0.3) | 0.4238 | 8.0 | 0 (0.0) | 1 (0.2) | 0.3216 | 8.5 |
| – Dementia | 1 (0.5) | 6 (1.0) | 0.5390 | 5.4 | 1 (0.3) | 3 (0.8) | 0.3339 | 6.6 |
| – Personality disorder | 1 (0.5) | 3 (0.5) | 0.9697 | 0.3 | 1 (0.3) | 2 (0.5) | 0.7887 | 1.7 |
| – Schizophrenia | 0 (0.0) | 0 (0.0) | 0 (0.0) | 0 (0.0) | ||||
| Baseline AHA therapy, n (%): | ||||||||
| – Injection (any) | 49 (24.4) | 185 (29.4) | 0.1711 | 11.2 | 118 (29.0) | 121 (28.6) | 0.8972 | 0.8 |
| – Basal insulin | 41 (20.4) | 159 (25.2) | 0.1622 | 11.5 | 99 (24.2) | 104 (24.5) | 0.9217 | 0.6 |
| – Bolus insulin | 22 (10.9) | 80 (12.7) | 0.5096 | 5.4 | 51 (12.5) | 52 (12.3) | 0.9404 | 0.4 |
| – Premixed insulin | 3 (1.5) | 10 (1.6) | 0.9249 | 0.8 | 11 (2.6) | 7 (1.6) | 0.3123 | 5.7 |
| – Oral (any) | 195 (97.0) | 599 (95.1) | 0.2467 | 9.9 | 391 (96.0) | 405 (95.6) | 0.7787 | 1.7 |
| – Biguanides | 170 (84.6) | 523 (83.0) | 0.6045 | 4.2 | 332 (81.6) | 353 (83.3) | 0.5215 | 3.8 |
| – DPP-4 inhibitors | 96 (47.8) | 210 (33.3) | 0.0002 | 29.7 | 147 (36.1) | 155 (36.7) | 0.8674 | 1.0 |
| – Meglitinide derivatives | 3 (1.5) | 12 (1.9) | 0.7023 | 3.2 | 9 (2.2) | 8 (1.9) | 0.7158 | 2.1 |
| – Sulfonylureas | 94 (46.8) | 274 (43.5) | 0.4158 | 6.6 | 192 (47.2) | 189 (44.5) | 0.4369 | 4.6 |
| – Thiazolidinediones | 29 (14.4) | 75 (11.9) | 0.3466 | 7.5 | 54 (13.2) | 52 (12.3) | 0.7022 | 2.3 |
| – α-glucosidase inhibitors | 3 (1.5) | 5 (0.8) | 0.3769 | 6.6 | 4 (1.1) | 5 (1.1) | 0.9902 | 0.1 |
| – Ergot derivatives | 3 (1.5) | 1 (0.2) | 0.0174 | 14.7 | 2 (0.4) | 1 (0.2) | 0.5735 | 3.1 |
| – Number of unique antidiabetic medications, mean (SD) | 2.1 (1.0) | 2.1 (1.0) | 0.8460 | 1.6 | 2.1 (1.5) | 2.1 (0.9) | 0.9398 | 0.5 |
| – Number of unique antidiabetic medication classes, mean (SD) | 2.3 (1.0) | 2.1 (1.0) | 0.0380 | 16.8 | 2.2 (1.4) | 2.2 (0.8) | 0.7283 | 2.4 |
| Antihypertensive medications, n (%): | ||||||||
| – Any antihypertensive medication | 22 (10.9) | 55 (8.7) | 0.3457 | 7.4 | 34 (8.4) | 40 (9.3) | 0.6448 | 2.8 |
| – β-blockers | 4 (2.0) | 7 (1.1) | 0.3424 | 7.1 | 6 (1.4) | 6 (1.4) | 0.9798 | 0.2 |
| – Angiotensin II receptor blockers | 15 (7.5) | 47 (7.5) | 0.9991 | 0.0 | 26 (6.4) | 31 (7.4) | 0.5661 | 3.5 |
| – Calcium channel blockers | 0 (0.0) | 1 (0.2) | 0.5719 | 5.6 | 0 (0.0) | 1 (0.1) | 0.4835 | 6.0 |
| – Renin inhibitors | 2 (1.0) | 1 (0.2) | 0.0852 | 11.0 | 1 (0.3) | 1 (0.2) | 0.7506 | 1.8 |
| – Antihypertensive combinations | 8 (4.0) | 22 (3.5) | 0.7467 | 2.6 | 12 (3.1) | 15 (3.7) | 0.6352 | 2.9 |
| Baseline HbA1c values: | ||||||||
| – HbA1c value, %, mean (SD) | 8.7 (1.6) | 8.7 (1.7) | 0.7768 | 2.3 | 8.8 (2.5) | 8.7 (1.3) | 0.7633 | 2.1 |
| -9 to -6 months: | ||||||||
| – Patients with ≥1 HbA1c, n (%) | 96 (47.8) | 339 (53.8) | 0.1349 | 12.1 | 204 (50.0) | 222 (52.4) | 0.4794 | 4.2 |
| – HbA1c value, mean (SD) | 8.2 (1.7) | 8.3 (1.7) | 0.7445 | 3.8 | 8.2 (2.4) | 8.3 (1.3) | 0.5701 | 5.6 |
| -6 to -3 months: | ||||||||
| – Patients with ≥1 HbA1c, n (%) | 100 (49.8) | 315 (50.0) | 0.9510 | 0.5 | 224 (54.9) | 215 (50.7) | 0.2271 | 7.2 |
| – HbA1c value, mean (SD) | 8.4 (1.7) | 8.5 (1.6) | 0.5856 | 6.2 | 8.6 (2.9) | 8.5 (1.3) | 0.6814 | 3.9 |
| –3 to 0 months: | ||||||||
| – Patients with ≥1 HbA1c, n (%) | 164 (81.6) | 488 (77.5) | 0.2147 | 10.2 | 324 (79.7) | 332 (78.4) | 0.6647 | 2.6 |
| – HbA1c value, mean (SD) | 8.7 (1.2) | 8.8 (1.6) | 0.6861 | 3.7 | 8.8 (2.2) | 8.8 (1.3) | 0.7762 | 2.2 |
| – Time from last HbA1c during the baseline period to the index date, days, mean (SD) | 51 (63.4) | 58 (62.8) | 0.1588 | 11.4 | 54 (89.1) | 57 (50.1) | 0.5632 | 4.0 |
†
t-test for continuous variables and χ2 test for categorical variables.
AHA: Antihyperglycemic agent; DCSI: Diabetes Comorbidity Severity Index; DPP4: Dipeptidyl peptidase-4; GLP1RA: Glucagon-like peptide-1 receptor agonist; QCCI: Quan–Charlson comorbidity index; SD: Standard deviation; STD: Standardized difference.
Treatment patterns
Patients in the canagliflozin 300 mg cohort were less likely to discontinue treatment versus patients in the GLP1RA cohort (28% vs 44%; HR: 0.57 [95% CI: 0.45–0.72]; p < 0.001; Figures 2, 3A & 4).
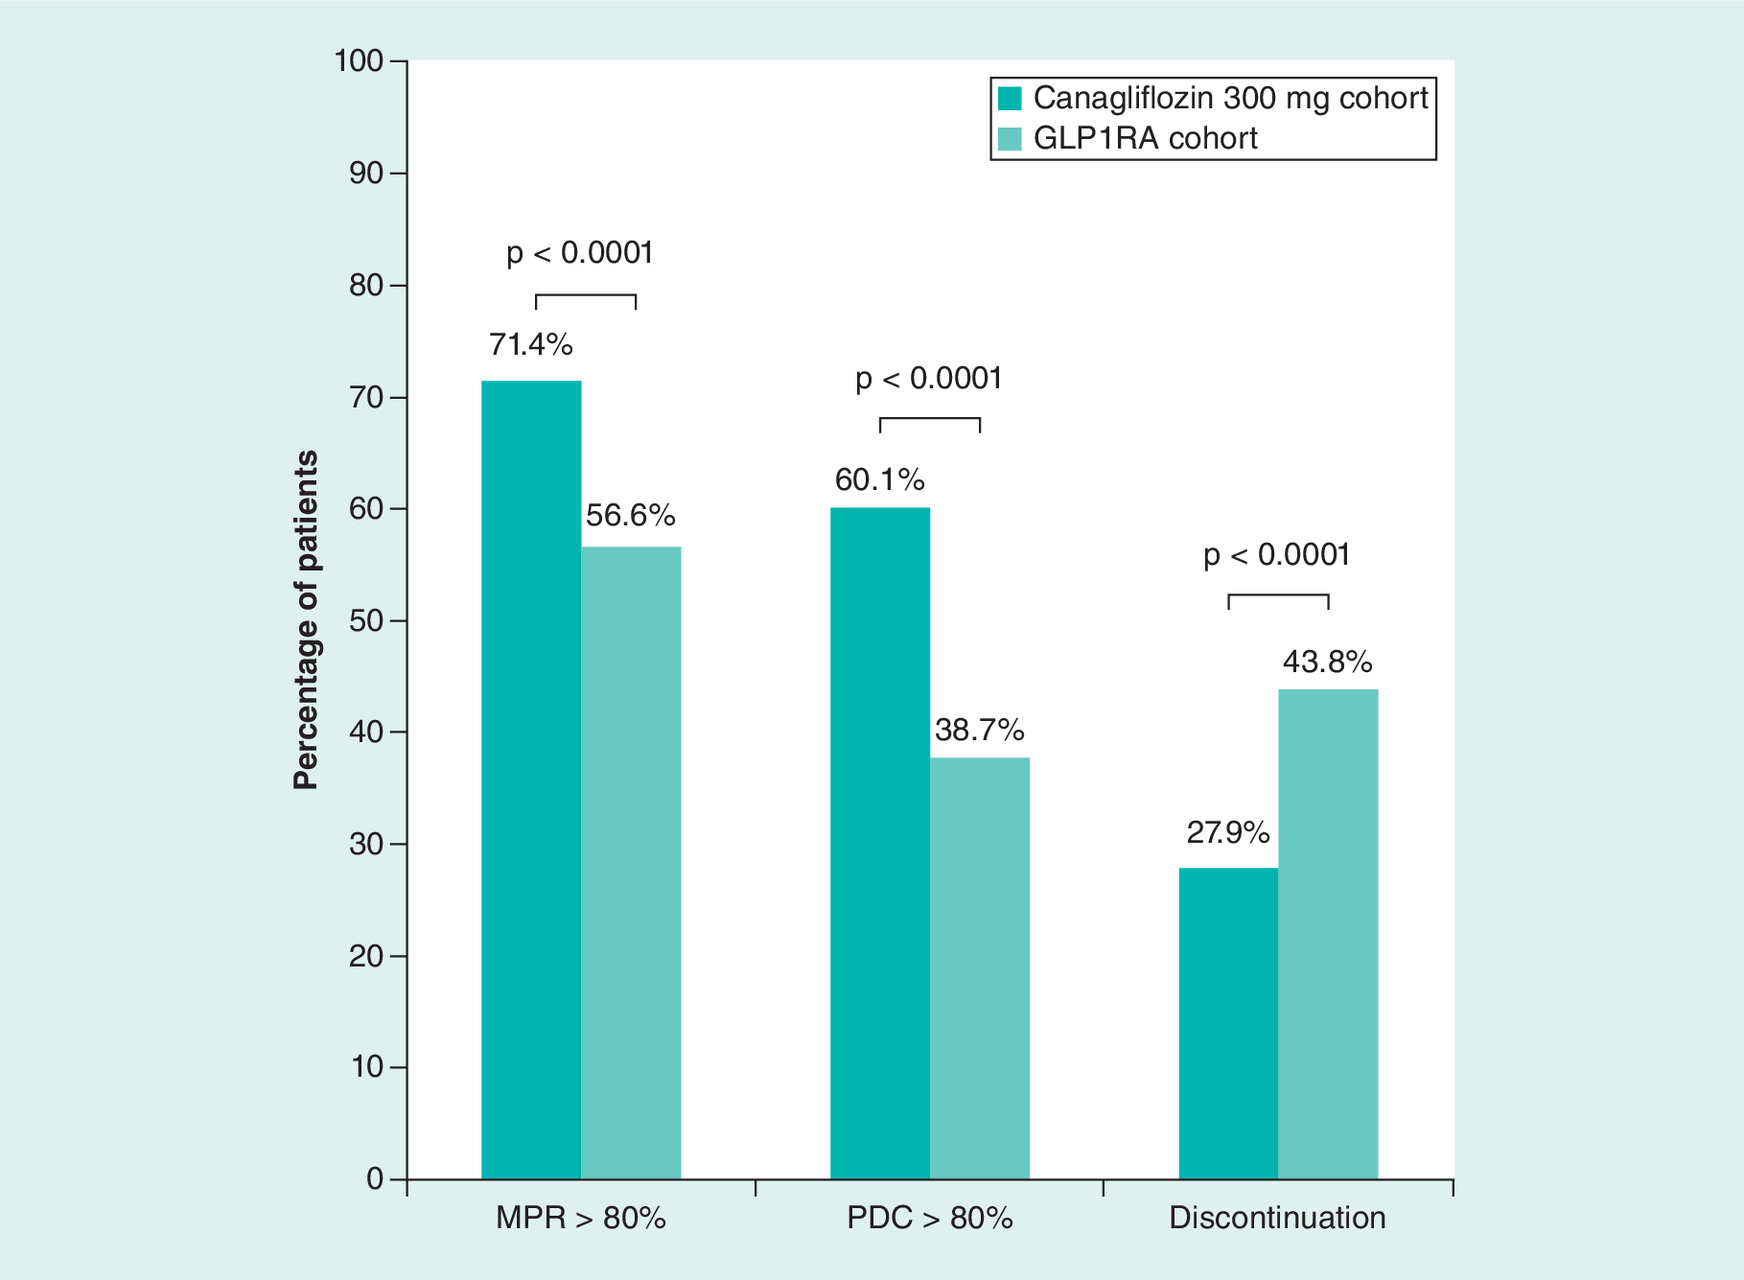
Figure 2. Medication adherence and discontinuation.
GLP1RA: Glucagon-like peptide-1 receptor agonist; MPR: Medication possession ratio; PDC: Proportion of days covered.
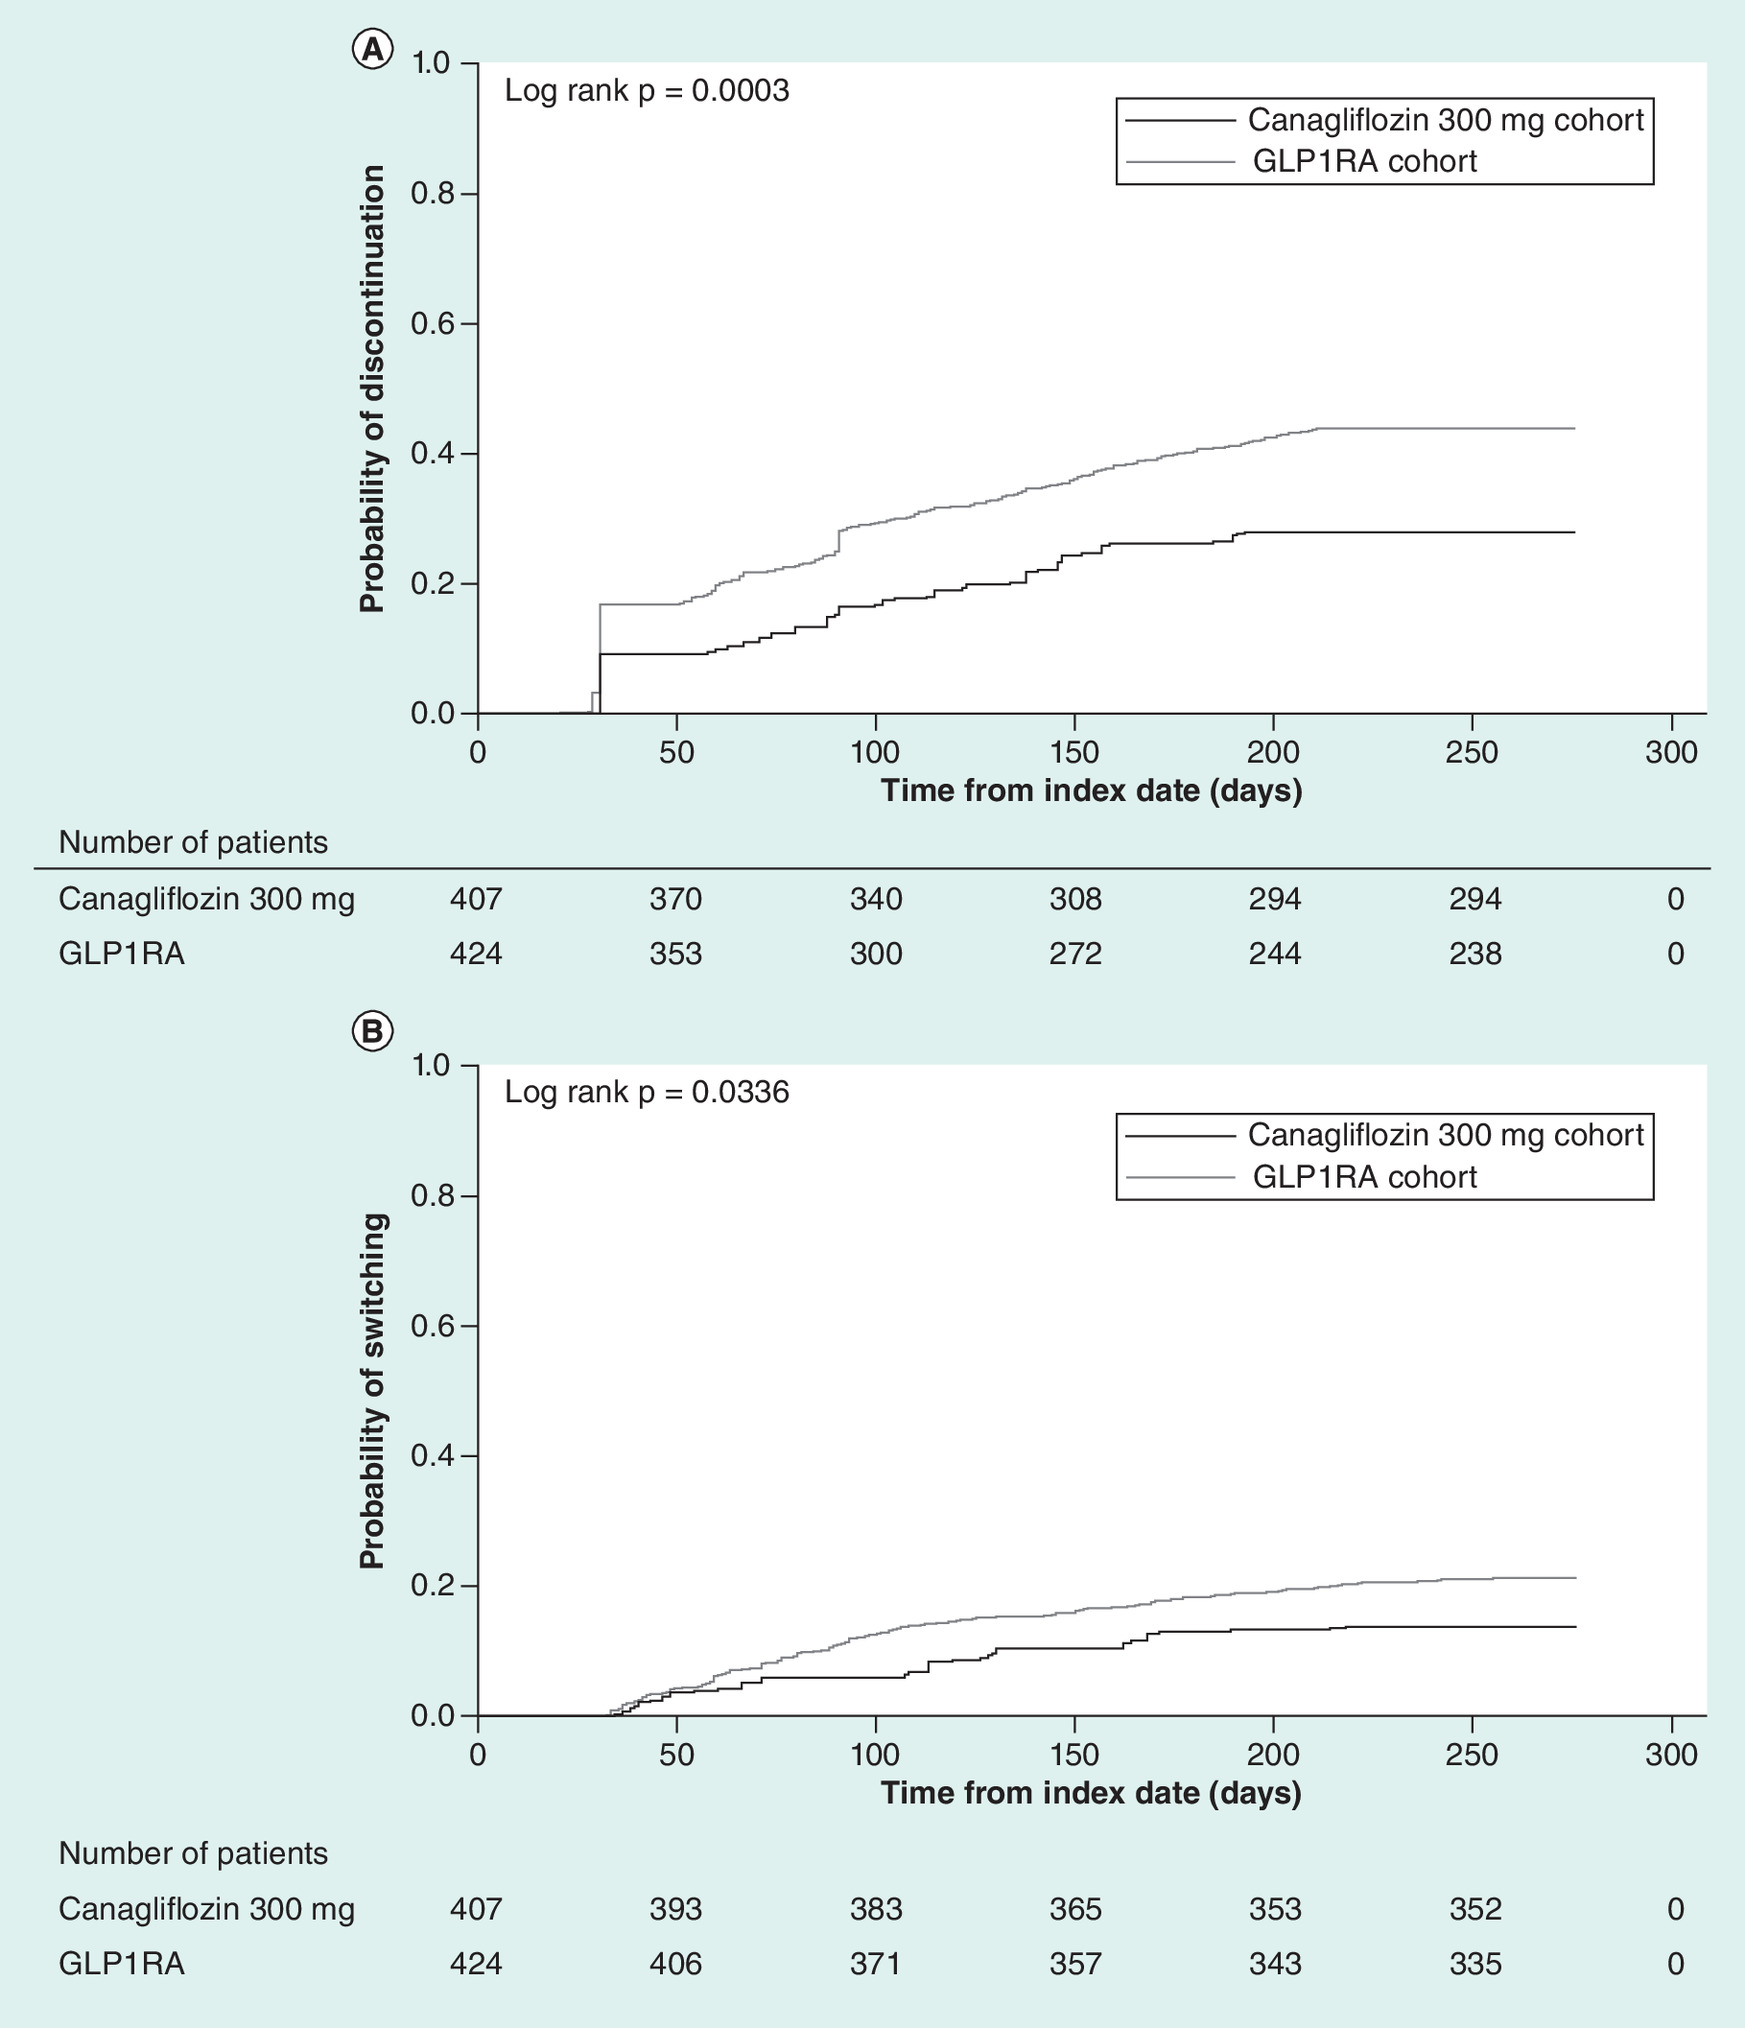
Figure 3. Treatment patterns (medication discontinuation and switching).
Kaplan–Meier curve for (A) time to discontinuation and (B) time to medication switching.
GLP1RA: Glucagon-like peptide-1 receptor agonist.
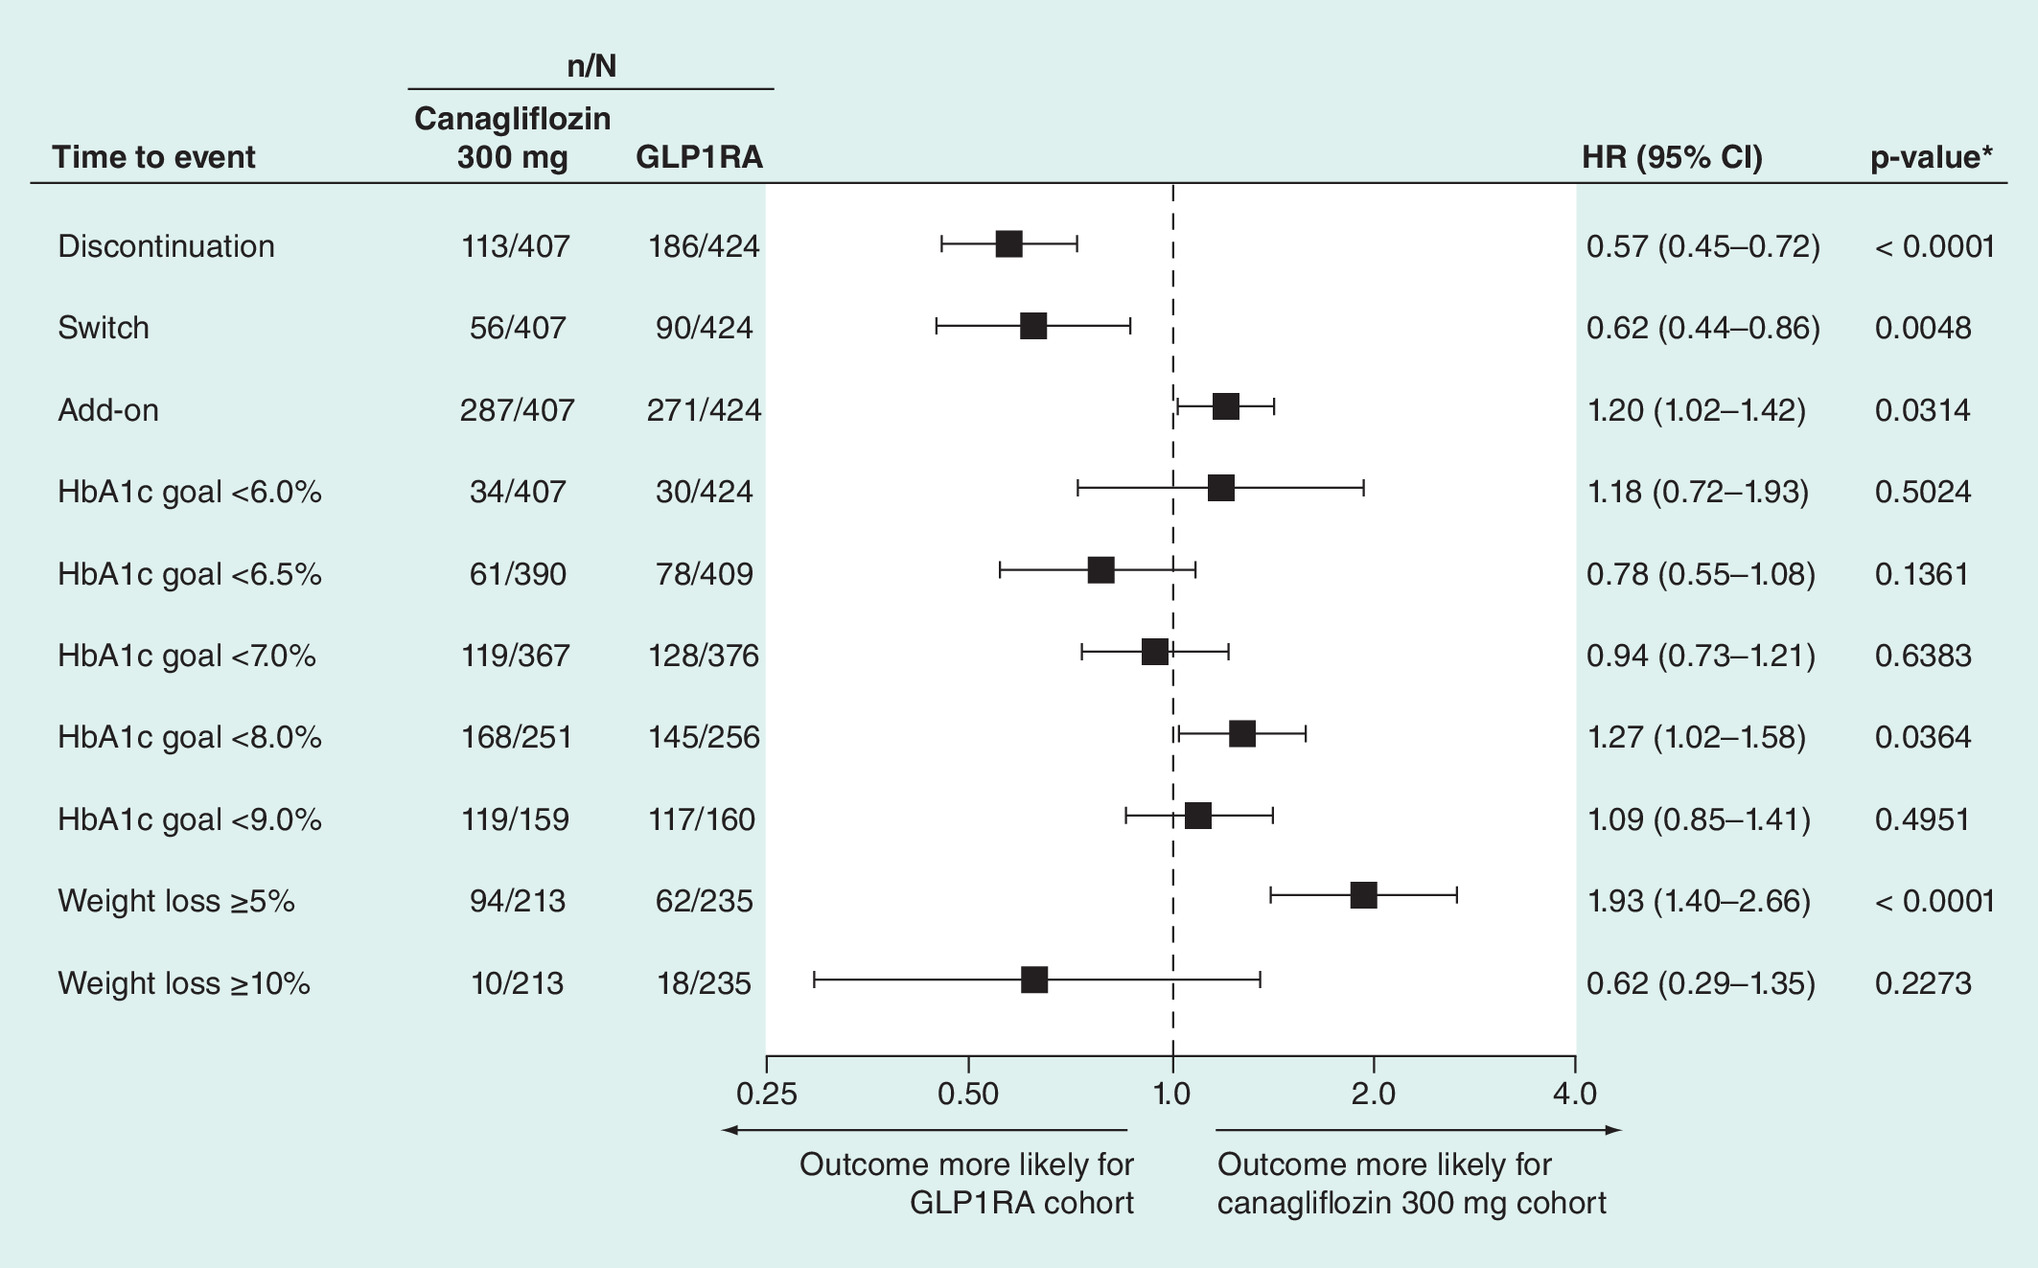
Figure 4. Cox model for time to event outcomes in the inverse probability of treatment weighting–adjusted cohorts.
*p < 0.05.
GLP1RA: Glucagon-like peptide-1 receptor agonist; HR: Hazard ratio.
The likelihood of switching to another AHA medication during the follow-up period was lower in the canagliflozin 300 mg versus GLP1RA cohort (14% vs 21%; HR: 0.62 [95% CI: 0.44–0.86]; p = 0.0048; Table 2, Figures 3B & 4). Compared with the canagliflozin 300 mg cohort, a higher proportion of patients in the GLP1RA cohort switched to any insulin (1.4% vs 4.8%; p = 0.006) and more specifically basal insulin (0.7% vs 4.9%; p = 0.0003; Table 2).
| Treatment in follow up period | Canagliflozin 300 mg cohort (N = 407) | GLP1RA cohort (N = 424) | p-value† |
|---|---|---|---|
| Switching | |||
| First switch, n (%) | 56 (13.7) | 90 (21.1) | 0.0046 |
| Time to first switch, days, mean (SD) | 103 (72.7) | 104 (48.5) | 0.9504 |
| First switch therapies, n (%): | |||
| Injectables (any) | 15 (3.8) | 33 (7.7) | 0.0169 |
| – Insulin (any) | 6 (1.4) | 20 (4.8) | 0.0060 |
| – Basal insulin | 3 (0.7) | 21 (4.9) | 0.0003 |
| – Bolus insulin | 3 (0.7) | 9 (2.2) | 0.0846 |
| – Premixed insulin | 7 (1.8) | 2 (0.6) | 0.1100 |
| – GLP1RA | 2 (0.6) | 0 (0.0) | 0.1153 |
| Oral medications (any) | 40 (9.8) | 57 (13.5) | 0.1057 |
| – Biguanide | 15 (3.6) | 19 (4.5) | 0.5463 |
| – DPP4 inhibitors | 9 (2.3) | 15 (3.4) | 0.3384 |
| – Sulfonylureas | 19 (4.7) | 27 (6.3) | 0.3095 |
| – Thiazolidinediones | 4 (0.9) | 3 (0.6) | 0.5939 |
| – SGLT2 inhibitors | 0 (0.0) | 3 (0.7) | 0.0854 |
| Add-on therapy | |||
| Add-on therapies, n (%) | 287 (70.5) | 271 (63.9) | 0.0405 |
| Time to add-on therapy, days, mean (SD) | 40 (64.2) | 39 (31.8) | 0.7624 |
| Add-on therapies, n (%): | |||
| Injectables (any) | 108 (26.4) | 89 (21.0) | 0.0660 |
| – Insulin (any) | 65 (16.1) | 89 (21.0) | 0.0672 |
| – Basal insulin | 74 (18.2) | 69 (16.2) | 0.4343 |
| – Bolus insulin | 26 (7.0) | 26 (6.1) | 0.6333 |
| – Premixed insulin | 12 (3.0) | 3 (0.8) | 0.0197 |
| – GLP1RA | 13 (3.1) | 0 (0.0) | 0.0002 |
| Oral medications | 237 (58.1) | 219 (51.6) | 0.0585 |
| – Biguanides | 136 (33.3) | 125 (29.5) | 0.2306 |
| – DPP4 inhibitors | 119 (29.2) | 38 (9.1) | <0.0001 |
| – Meglitinide derivatives | 0 (0.0) | 6 (1.5) | 0.0128 |
| – Sulfonylureas | 116 (28.4) | 109 (25.7) | 0.3679 |
| – Thiazolidinediones | 21 (5.2) | 24 (5.7) | 0.7514 |
| – α-glucosidase inhibitors | 1 (0.3) | 2 (0.4) | 0.7449 |
| – Other SGLT2 inhibitors | 0 (0.0) | 19 (4.5) | <0.0001 |
| Insulin use | |||
| Patients without insulin use during baseline, n (%) | 289 (71.0) | 303 (71.4) | 0.8972 |
| Patients with insulin use during the follow-up, n (%) | 68 (23.4) | 105 (34.6) | 0.0040 |
| Time to insulin initiation, days (SD) | 44 (78.8) | 61 (56.3) | 0.1226 |
| Up-/down-titration: | |||
| Up-titration, n (%) | 0 (0.0) | 22 (5.3) | <0.0001 |
| – Time to up-titration, days (SD) | 56 (41.2) | ||
| Down-titration, n (%) | 3 (0.7) | 7 (1.7) | 0.1854 |
| – Time to down-titration, days (SD) | 92‡ | 53 (30.2) | |
| Background AHA treatment, n (%) | |||
| 0 to 3 months: | |||
| – Number of unique antidiabetic medications | 2.5 (1.5) | 2.5 (0.8) | 0.9103 |
| – Number of unique antidiabetic medication classes | 2.6 (1.6) | 2.6 (0.8) | 0.6442 |
| 3 to 6 months: | |||
| – Number of unique antidiabetic medications | 2.4 (1.7) | 2.2 (0.9) | 0.1417 |
| – Number of unique antidiabetic medication classes | 2.5 (1.8) | 2.3 (0.9) | 0.0511 |
| 6 to 9 months: | |||
| – Number of unique antidiabetic medications | 2.2 (1.6) | 2.2 (0.9) | 0.8526 |
| – Number of unique antidiabetic medication classes | 2.3 (1.8) | 2.3 (0.9) | 0.4996 |
†
t-test for continuous variables and χ2 test for categorical variables.
‡
Standard deviation not calculated due to small sample size.
AHA: Antihyperglycemic agent; GLP1RA: Glucagon-like peptide-1 receptor agonist; SD: Standard deviation; SGLT2: Sodium glucose co-transporter 2.
Patients in the canagliflozin 300 mg versus GLP1RA cohort were more likely to have add-on AHA therapies during the follow-up period (71% vs 64%; HR: 1.20 [95% CI: 1.02–1.42]; p = 0.0314; Figure 4 & Table 2). Median time to add-on therapy was 37 and 58 days among all patients in the canagliflozin 300 mg and GLP1RA cohorts, respectively. Compared with GLP1RA, a higher proportion of patients in the canagliflozin 300 mg cohort added DPP4 inhibitors (29% vs 9%; p < 0.0001) and a lower proportion of patients added SGLT2 inhibitors (0% vs 4%; p < 0.0001). Additionally, the proportion of patients initiating insulin during the follow-up period was lower in the canagliflozin 300 mg versus GLP1RA cohort (23% vs 35%; p = 0.004). Among those who initiated insulin, the median time to insulin initiation was 26 days in the canagliflozin 300 mg cohort and 36 days in the GLP1RA cohort. There were no notable differences in the number of unique AHAs or unique AHA classes used between cohorts during the follow-up period at any time point. More patients in the canagliflozin 300 mg versus GLP1RA cohort used DPP4 inhibitors during each follow-up interval (Supplementary Figure 1). Additionally, the likelihood of having either a discontinuation or switch or add-on was not significantly different between the canagliflozin 300 mg and GLP1RA cohorts (HR: 1.04 [95% CI: 0.90–1.21]; p = 0.5781).
Treatment adherence, as measured by medication possession ratio and proportion of days covered, was significantly higher in the canagliflozin 300 mg cohort versus the GLP1RA cohort, with an average of 83% versus 72% (p < 0.0001) days covered as measured by medication possession ratio and 73% versus 61% (p < 0.0001) days covered as measured by proportion of days covered. A higher proportion of patients in the canagliflozin 300 mg versus GLP1RA cohort had medication possession ratio >80% (71% vs 57%; p < 0.0001) and proportion of days covered >80% (60% vs 39%; p < 0.0001; Figure 2).
Dose titration was examined in all patients in the canagliflozin 300 mg cohort and in patients initiated on liraglutide in the GLP1RA cohort. In the GLP1RA cohort, 5.3% of patients up-titrated their dose of liraglutide from 1.2 to 1.8 mg during the follow-up period (median time to titration of 34 days). The proportion of patients who down-titrated their dose of canagliflozin (300 to 100 mg) or liraglutide (1.8 to 1.2 mg) was similar between the canagliflozin 300 mg and GLP1RA cohorts (0.7% and 1.7%; p = 0.1854).
HbA1c levels & HbA1c target attainment
Among patients with available HbA1c data, when compared at 3-month intervals, mean HbA1c levels were similar between cohorts over 9 months of follow-up (Figure 5A). Among patients with baseline HbA1c ≥8.0%, the mean (standard deviation) baseline HbA1c was 9.71% (2.20) and 9.68% (1.12) in the canagliflozin 300 mg cohort and GLP1RA cohorts, respectively. This population was significantly more likely to achieve HbA1c <8.0% in the canagliflozin 300 mg versus GLP1RA cohort (66.8% vs 56.6%; HR: 1.27 [95% CI: 1.02–1.58]; p = 0.0364; Figures 4 & 5B), and the median time to achieve HbA1c <8.0% among all patients was 157 days in the canagliflozin 300 mg cohort and 210 days in the GLP1RA cohort.

Figure 5. Glycemic control.
(A) HbA1c trend during the baseline and follow-up periods and (B) HbA1c target attainment among patients with baseline HbA1c ≥8.0%. (A) Data are from the weighted generalized linear model, which included normalized weights from the main inverse probability of treatment weighting.
GLP1RA: Glucagon-like peptide-1 receptor agonist.
Among patients with HbA1c levels above each threshold (during the baseline period) mentioned below, patients in the canagliflozin 300 mg and GLP1RA cohorts had no significant differences in the likelihood of achieving HbA1c <6.0% (8.4% vs 7.0%; HR: 1.18 [95% CI: 0.72–1.93]; p = 0.5024), <6.5% (15.5% vs 19.2%; HR 0.78 [95% CI: 0.55–1.08]; p = 0.1361), <7.0% (32.4% vs 34.0%; HR: 0.94 [95% CI: 0.73–1.21]; p = 0.6383) or <9.0% (74.8% vs 73.4%; HR: 1.09 [95% CI: 0.85–1.41]; p = 0.4952; Figure 4). However, while evaluating the likelihood of achieving HbA1c <6.0% and <6.5%, the time-dependent covariate demonstrated statistical significance, indicating that the treatment effect changed over time, resulting in a potential deviation from the proportional hazards model.
Bodyweight levels & bodyweight target attainment
Bodyweight data in the pre-index and follow-up periods were available for a subset of patients in the canagliflozin 300 mg cohort (n = 106) and GLP1RA cohort (n = 351). After performing inverse probability of treatment weighting in the main sample, the bodyweight subset included 213 patients in the canagliflozin cohort and 235 patients in the GLP1RA cohort. For both cohorts, the mean age was 55 years; 41% and 43% of patients were female, the mean Quan–Charlson comorbidity index scores were 1.7 and 1.9 (STD: 11.5%), and the mean Diabetes Complications Severity Index was 0.7 and 0.7 in the canagliflozin 300 mg and GLP1RA cohorts, respectively (Supplementary Table 1). Based on the full analytic sample, inverse probability of treatment weighting balanced many of the demographic and clinical characteristics in the bodyweight subcohorts, with the notable exception that BMI was higher in the GLP1RA versus canagliflozin 300 mg cohort (37.9 vs 35.8 kg/m2; p = 0.01; STD: 24.5%), which was later adjusted in the multivariate model. The remaining differences in age, race, region and some comorbidities in this subset were reviewed for clinical relevance and were largely driven by low numbers of events or small sample size. Baseline weight measurements for these patients are shown in Supplementary Table 1. Among patients in the bodyweight subcohorts, bodyweight decreased to similar levels in the canagliflozin 300 mg and GLP1RA cohorts over 3 months of follow-up, but, at 6 and 9 months of follow-up, bodyweight was significantly lower in the canagliflozin 300 mg cohort versus the GLP1RA cohort based on results from the weighted generalized linear model (Figure 6A).
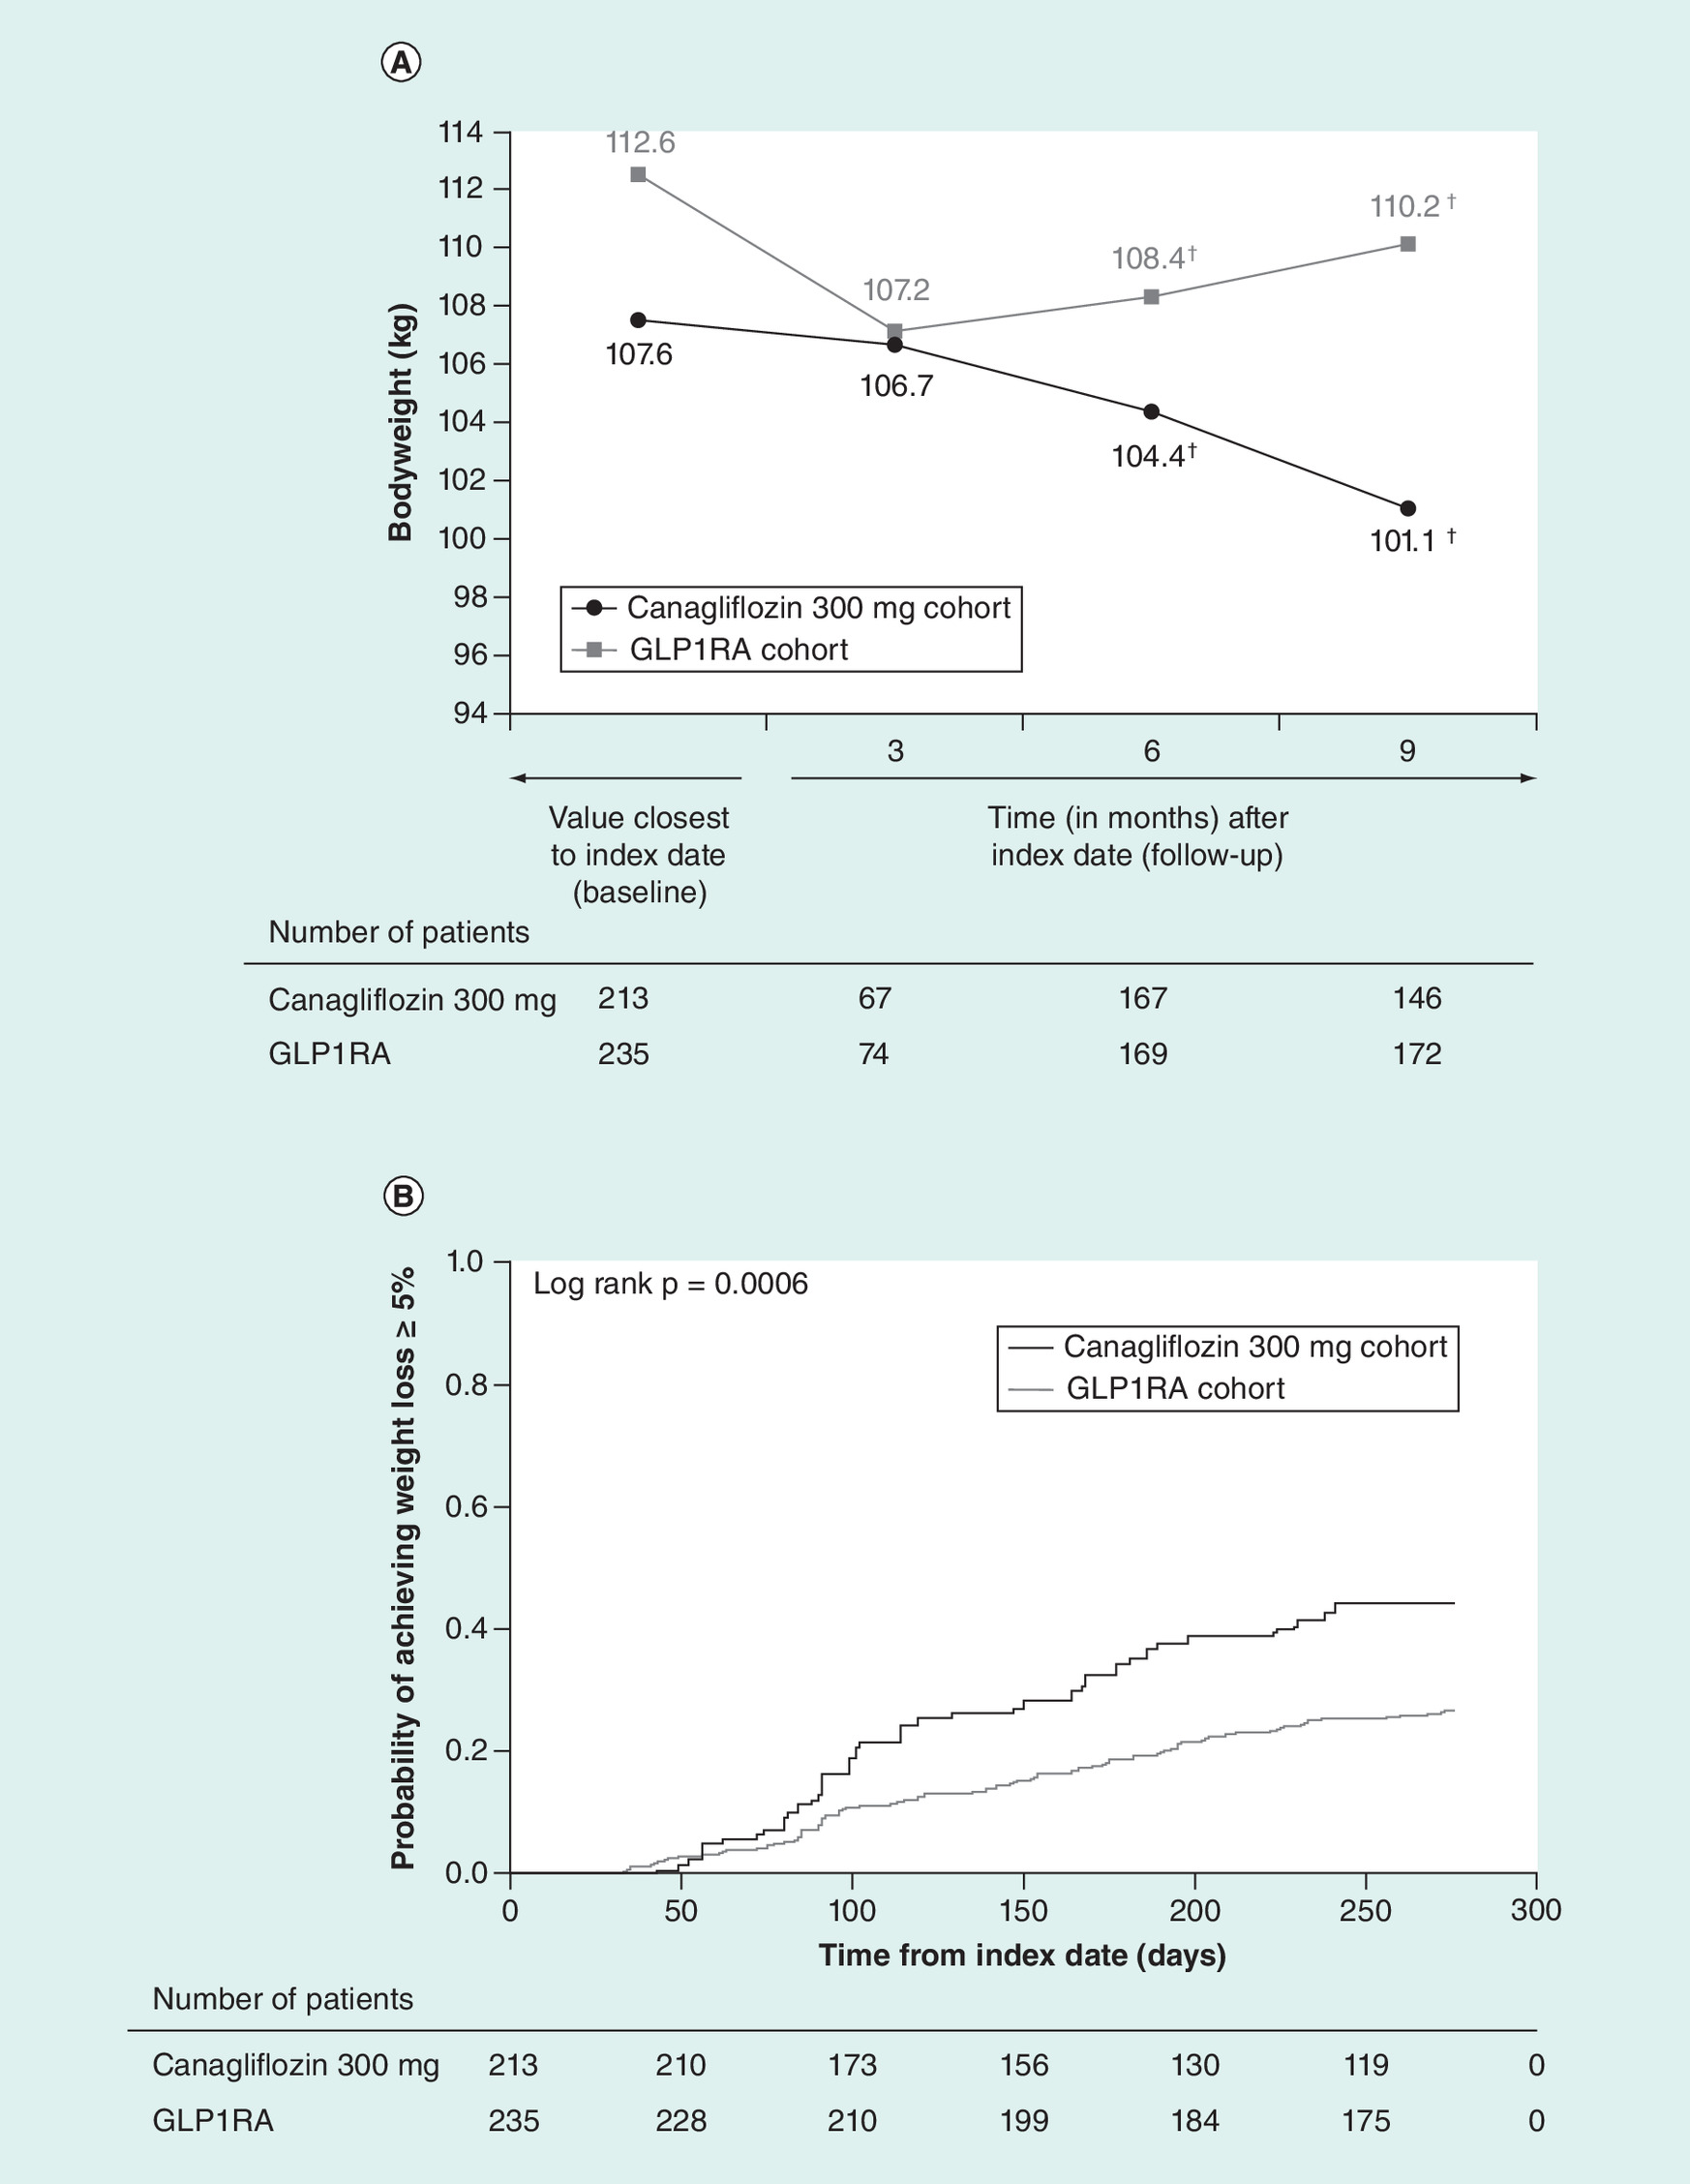
Figure 6. Bodyweight outcomes.
(A) Bodyweight trend during the baseline and follow-up periods and (B) Kaplan–Meier curve for time to achieve weight loss ≥5% in the inverse probability of treatment weighting–adjusted cohorts. (A) Data are from the weighted generalized linear model, which included normalized weights from the main inverse probability of treatment weighting, and are adjusted for pre-index bodyweight.
†Significant at p < 0.05.
GLP1RA: Glucagon-like peptide-1 receptor agonist.
Patients in the canagliflozin 300 mg cohort were more likely to achieve weight loss ≥5% (44.2% vs 26.6%; HR: 1.93 [95% CI: 1.40–2.66]; p < 0.0001; Figures 4 & 6B), with a significantly longer mean duration of maintaining weight loss ≥5% (133 vs 103 days; p = 0.01) than those in the GLP1RA cohort. There was no difference between the canagliflozin 300 mg and GLP1RA cohorts in achievement of weight loss ≥10% (4.7% vs 7.7%; HR: 0.62 [95% CI: 0.29–1.35]; p = 0.2273; Figure 4); however, the number of patients achieving this target was small in both cohorts.
Discussion
In this real-world study, EHRs and claims data from the USA were used to examine the effectiveness of canagliflozin 300 mg compared with GLP1RAs on treatment patterns, glycemic control and target attainment, as well as bodyweight among patients with T2DM. Patients initiated on canagliflozin 300 mg had greater adherence and less discontinuation and were less likely to initiate insulin compared with patients in the GLP1RA cohort, but were more likely overall to add-on treatment. In addition, they had similar HbA1c levels to those initiated on a GLP1RA, and were more likely to achieve HbA1c <8.0% and weight loss ≥5%.
Recent real-world studies based on EHRs have shown that compared with GLP1RAs, canagliflozin has similar effects on glycemic control and bodyweight in patients with T2DM but lower rates of treatment discontinuation and less need for medication changes (i.e., switching, add-on) [25–30].
Study findings showed that patients with T2DM who initiated canagliflozin 300 mg and GLP1RAs had similar reductions in HbA1c over 9 months of follow-up. This is consistent with results from other US database studies showing similar mean HbA1c-lowering effects with canagliflozin 300 mg and GLP1RAs [28–30]. HbA1c target attainment with canagliflozin 300 mg versus GLP1RAs has also been previously assessed, with some differences observed across studies. An analysis of the IQVIA™ Real-World Data EMR–US database found that patients initiated on canagliflozin 300 mg or a GLP1RA were equally likely to achieve HbA1c <8.0% but that patients initiated on a GLP1RA were more likely to achieve HbA1c <7.0% [25]. In contrast, the current analysis found that patients initiated on canagliflozin 300 mg versus a GLP1RA were more likely to achieve HbA1c <8.0% and were equally likely to achieve HbA1c <7.0%. While the reasons for these discrepancies have not been examined, they may be related, in part, to differences in patient populations, baseline HbA1c levels and follow-up times between studies.
With regard to weight loss, patients in both cohorts had reductions in bodyweight from baseline that were significantly greater with canagliflozin 300 mg versus GLP1RA after 6 and 9 months of follow-up. This difference in bodyweight patterns could be attributed to the higher use of insulins in the GLP1RA cohort during follow-up, as insulins are known to cause weight gain [31]. In addition, patients in the canagliflozin 300 mg cohort were more likely to achieve weight loss ≥5% than patients in the GLP1RA cohort. There are some potentially important clinical implications of this finding since weight loss is associated with improved glycemic and blood pressure control, as well as reduction of other cardiovascular risk factors [32,33]. Losing even a modest amount of weight (≥5 pounds) has been associated with improved quality-of-life and health satisfaction for patients with T2DM [34]. Additionally, patients who experience continuous weight loss are also more likely to perform diabetes self-care behaviors [35].
Compared with other real-world studies that use only EHR data, the use of data from patients with both claims and EHRs may have enhanced the accuracy of adherence and persistence data collected in this study. Mean medication possession ratio and proportion of days covered were significantly higher in the canagliflozin 300 mg versus GLP1RA cohort, with more patients initiated on canagliflozin 300 mg having medication possession ratio >80% or proportion of days covered >80%. The use of both proportion of days covered and medication possession ratio to measure adherence and persistence is a strength, as the proportion of days covered is a conservative measure of adherence that does not double-count days due to early refills, whereas the medication possession ratio counts all available medication, even when a prescription is refilled early. For example, if a patient was covered by >1 pharmacy claim for the index medication on a given day, it would be counted as only 1 day of coverage for the proportion of days covered calculation, whereas the days of supply for all the pharmacy claims of the index medication available on that day would be included in the calculation of medication possession ratio. Patients initiated on canagliflozin 300 mg versus a GLP1RA were also less likely to discontinue treatment, switch medications or initiate insulin use. The reason for higher rates of discontinuation in the GLP1RA cohort is unclear but may be due, in part, to known side effects associated with treatment (e.g., nausea, vomiting and diarrhea) or mode of administration (e.g., injection), since reductions in HbA1c appeared to be similar. Overall, these results are consistent with previous findings of better adherence and persistence with canagliflozin compared with GLP1RAs in a variety of practice settings [25–28]. However, unlike previous studies, patients in the current study were more likely to add-on new AHAs with canagliflozin versus GLP1RAs, which could be attributable to differences in the criteria used to define add-on therapy in each of these studies [25].
There are several limitations associated with claims data that should be noted. For example, a claim for a prescription does not necessarily indicate that the medication was taken as prescribed, and claims data do not capture medications provided to patients through physician samples. In addition, medical codes used in claims data do not definitively indicate the presence of a disease, as codes may be subject to coding errors (i.e., misclassification bias). Additionally, observational studies may underestimate study findings if, for instance, a symptomatic diabetic patient was not coded as having diabetes in the database. Another limitation is that inverse probability of treatment weighting adjustment cannot resolve problems from imbalances in unmeasured confounders, so it is possible that this approach did not correct for unobserved variables in the risk-adjusted tables. For instance, in this study, BMI was not available for all patients, so it was not included as a covariate in inverse probability of treatment weighting. Therefore, a significant difference in BMI remained between cohorts after inverse probability of treatment weighing. Additionally, some significant differences in baseline characteristics (STD >10%) remained in the bodyweight subcohort, as inverse probability of treatment weighting was only performed for the full cohort. The remaining differences including age, race, region, BMI and some comorbidities in this subset of patients were reviewed for clinical significance and were largely driven either by lower numbers of events or low sample size. Additionally, in observational studies with small sample size, moderate imbalances can occur even if the propensity score model has been correctly specified [36]. As this study followed patients until the end of the study period regardless of any treatment changes, outcomes such as HbA1c and weight loss may have been impacted by switch to or add-on of other AHAs. While this is a potential limitation, it should be noted that patients in the canagliflozin cohort were more likely to add-on a DPP4 inhibitor, whereas those in the GLP1RA cohort were more likely to add-on an SGLT2 inhibitor or initiate insulin. Both SGLT2 inhibitors and insulin would be likely to have a greater impact on HbA1c than DPP4 inhibitors, which may, in fact, bias against canagliflozin 300 mg. Additionally, given the differential rates of individual treatment patterns, the composite event of time to discontinuation or switch or add-on was evaluated rather than censoring patients with these events; no significant difference between the two cohorts was observed for this composite endpoint. In this study, up-titration of a GLP1RA was counted as a discontinuation event, which may have led to an overestimate. Additionally, as there was a potential deviation from the proportional hazards model when calculating achievement of HbA1c <6.0% and <6.5%, these results should be interpreted with caution. Lastly, this analysis was based on combined claims and EHR data, which represent only a subset of the overall Optum database (of patients with T2DM and claims data, only 80% have any EHR data and 55% have any HbA1c data); thus, these results may not be generalizable to the broader population of T2DM patients.
Conclusion
In the real world, patients treated with canagliflozin 300 mg were significantly less likely to discontinue or switch from initial treatment than patients in GLP1RA cohort, and more likely to add-on an AHA. There were no significant differences in HbA1c outcomes at 3-month intervals over 9 months, and patients treated with canagliflozin 300 mg were significantly more likely to achieve HbA1c <8.0% and weight loss ≥5% than patients treated with GLP1RAs.
•
In this real-world study based on electronic health records and claims data, mean HbA1c levels were similar over 9 months of follow-up in the canagliflozin 300 mg and glucagon-like peptide-1 receptor agonist (GLP1RA) cohorts.
•
Among patients with baseline HbA1c ≥8.0%, patients in the canagliflozin 300 mg cohort were more likely to achieve HbA1c <8.0% (HEDIS target) than those in the GLP1RA cohort.
•
Among the subset of patients with bodyweight data, a greater proportion of patients achieved weight loss of ≥5% (AACE/ACE target) in the canagliflozin 300 mg versus GLP1RA cohort.
•
Patients in the canagliflozin 300 mg versus GLP1RA cohort were more likely to be adherent to treatment and less likely to discontinue or switch treatment.
•
Significantly fewer patients in the canagliflozin 300 mg versus GLP1RA cohort initiated insulin during the follow-up period.
Financial & competing interests disclosure
This study was funded by Janssen Scientific Affairs, LLC. Canagliflozin has been developed by Janssen Research & Development, LLC, in collaboration with Mitsubishi Tanabe Pharma Corporation. CI Coleman has received research support from Janssen Pharmaceuticals, Inc. and Boeheinger Ingelheim, Inc. S Pandya and L Wang are employees of STATinMED Research, which has a business relationship with Janssen. O Baser was an employee of STATinMED Research, which has a business relationship with Janssen, at the time of the study. M Ingham and B Bookhart are employees of Janssen Scientific Affairs, LLC, which funded this study, and are stockholders of Johnson and Johnson. J Cai was an employee of Janssen Scientific Affairs, LLC, at the time of the study. The study sponsor supported the conduct of the study and its publication. The authors have no other relevant affiliations or financial involvement with any organization or entity with a financial interest in or financial conflict with the subject matter or materials discussed in the manuscript apart from those disclosed.
Medical writing support was provided by Dana Tabor, PhD, of MedErgy, and was funded by Janssen Scientific Affairs, LLC.
Open access
This work is licensed under the Attribution-NonCommercial-NoDerivatives 4.0 Unported License. To view a copy of this license, visit http://creativecommons.org/licenses/by-nc-nd/4.0/
Supplementary Material
File (supplementary_materials.docx)
- Download
- 146.58 KB
References
1.
International Diabetes Federation. IDF Diabetes Atlas (8th Edition). International Diabetes Federation, Brussels, Belgium (2017).
2.
Fowler MJ. Microvascular and macrovascular complications of diabetes. Clin. Diabetes 26(2), 77–82 (2008).
3.
Stratton IM, Adler AI, Neil HA et al. Association of glycaemia with macrovascular and microvascular complications of Type 2 diabetes (UKPDS 35): prospective observational study. BMJ 321(7258), 405–412 (2000).
4.
American Diabetes Association. Standards of medical care in diabetes – 2018. Diabetes Care 41(Suppl. 1), S1–S159 (2018).
5.
Garber AJ, Abrahamson MJ, Barzilay JI et al. Consensus statement by the American Association of Clinical Endocrinologists and American College of Endocrinology on the comprehensive Type 2 diabetes management algorithm – 2018 executive summary. Endocr. Pract. 24(1), 91–120 (2018).
6.
Fallon Health. 2018 Healthcare Effectiveness Data and Information Set (HEDIS®) measures (2018). www.fchp.org/providers/resources/hedis-measures.aspx
7.
Ali MK, Bullard KM, Saaddine JB, Cowie CC, Imperatore G, Gregg EW. Achievement of goals in U.S. diabetes care, 1999–2010. N. Engl. J. Med. 368(17), 1613–1624 (2013).
8.
Carls G, Huynh J, Tuttle E, Yee J, Edelman SV. Achievement of glycated hemoglobin goals in the US remains unchanged through 2014. Diabetes Ther. 8(4), 863–873 (2017).
9.
Pladevall M, Williams LK, Potts LA, Divine G, Xi H, Lafata JE. Clinical outcomes and adherence to medications measured by claims data in patients with diabetes. Diabetes Care 27(12), 2800–2805 (2004).
10.
Nagrebetsky A, Griffin S, Kinmonth AL, Sutton S, Craven A, Farmer A. Predictors of suboptimal glycaemic control in Type 2 diabetes patients: the role of medication adherence and body mass index in the relationship between glycaemia and age. Diabetes Res. Clin. Pract. 96(2), 119–128 (2012).
11.
Heerspink HJ, Perkins BA, Fitchett DH, Husain M, Cherney DZ. Sodium glucose cotransporter 2 inhibitors in the treatment of diabetes mellitus: cardiovascular and kidney effects, potential mechanisms, and clinical applications. Circulation 134(10), 752–772 (2016).
12.
Drucker DJ. The cardiovascular biology of glucagon-like peptide-1. Cell Metab. 24(1), 15–30 (2016).
13.
Vallon V. The mechanisms and therapeutic potential of SGLT2 inhibitors in diabetes mellitus. Ann. Rev. Med. 66, 255–270 (2015).
14.
Lee S, Lee DY. Glucagon-like peptide-1 and glucagon-like peptide-1 receptor agonists in the treatment of Type 2 diabetes. Ann. Pediatr. Endocrinol. Metab. 22(1), 15–26 (2017).
15.
Mearns ES, Sobieraj DM, White CM et al. Comparative efficacy and safety of antidiabetic drug regimens added to metformin monotherapy in patients with Type 2 diabetes: a network meta-analysis. PLoS ONE 10(4), e0125879 (2015).
16.
Taieb V, Pacou M, Schroeder M, Nielsen AT, Schubert A, Neslusan C. A network meta-analysis (NMA) to assess the longer-term relative efficacy of canagliflozin in patients with Type 2 diabetes inadequately controlled on metformin. Value Health 18(7), A598 (2015).
17.
Taieb V, Pacou M, Schroeder M, Nielsen AT, Neslusan C, Schubert A. Bayesian network meta-analysis (NMA) to assess the relative efficacy of canagliflozin in patients with Type 2 diabetes mellitus (T2DM) inadequately controlled with insulin. Value Health 18(7), A598 (2015).
18.
Van Sanden S, Diels J, Guillon P, Nielsen AT. Bayesian network meta-analysis to assess relative efficacy of canagliflozin versus glucagon-like peptide-1 receptor agonists in dual and triple therapy in patients with Type 2 diabetes mellitus. Value Health 18(3), A54 (2015).
19.
Zaccardi F, Webb DR, Htike ZZ, Youssef D, Khunti K, Davies MJ. Efficacy and safety of sodium-glucose cotransporter 2 inhibitors in Type 2 diabetes mellitus: systematic review and network meta-analysis. Diabetes Obes. Metab. 18(8), 783–794 (2016).
20.
INVOKANA® (canagliflozin) tablets, for oral use [package insert]. Janssen Pharmaceuticals, NJ, USA (2018).
21.
Buysman EK, Chow W, Henk HJ, Rupnow MF. Characteristics and outcomes of patients with Type 2 diabetes mellitus treated with canagliflozin: a real-world analysis. BMC Endocr. Disord. 15(1), 67 (2015).
22.
Optum. Real world health care experiences form over 150 million unique individuals since 1993 (2015). www.optum.com/content/dam/optum/resources/productSheets/5302_Data_Assets_Chart_Sheet_ISPOR.pdf
23.
Optum. Optum integrated data: bring precision to your investment decisions (2014). www.optum.com/content/dam/optum3/optum/en/resources/fact-sheets/Integrated-Data-product-sheet.pdf
24.
Wysham CH, Lefebvre P, Pilon D et al. Quality measure and weight loss assessment in patients with Type 2 diabetes mellitus treated with canagliflozin or dipeptidyl peptidase-4 inhibitors. BMC Endocr. Disord. 17(1), 32 (2017).
25.
Wysham CH, Pilon D, Ingham M et al. Quality goal attainment and maintenance in patients with Type II diabetes mellitus initiated on canagliflozin or a glucagon-like peptide-1 receptor agonist in an actual practice setting. Curr. Med. Res. Opin. 34(6), 1125–1133 (2018).
26.
Cai J, Wang Y, Baser O, Xie L, Chow W. Comparative persistence and adherence with newer anti-hyperglycemic agents to treat patients with Type 2 diabetes in the United States. J. Med. Econ. 19(12), 1175–1186 (2016).
27.
Cai J, Divino V, Burudpakdee C. Adherence and persistence in patients with Type 2 diabetes mellitus newly initiating canagliflozin, dapagliflozin, DPP-4 s, or GLP-1 s in the United States. Curr. Med. Res. Opin. 33(7), 1317–1328 (2017).
28.
Lefebvre P, Pilon D, Ingham M et al. Real-world persistence and HbA1c goal attainment in patients with Type II diabetes mellitus initiated on canagliflozin or a glucagon-like peptide-1 receptor agonist. Poster presented at: American Association of Clinical Endocrinologists 26th Annual Scientific & Clinical Congress. TX, USA, 3–7 May 2017.
29.
Wysham C, Pilon D, Ingham M et al. Glycemic control and treatment costs in patients with Type 2 diabetes mellitus initiated on canagliflozin 300 mg or a glucagon-like peptide-1 receptor agonist in a real-world setting. Poster presented at: 77th Scientific Sessions of the American Diabetes Association (ADA). CA, USA, 9–13 June 2017.
30.
Wysham C, Pilon D, Ingham M et al. Real-world HbA1c levels in the context of persistence, treatment progression, and durability of HbA1c control in patients with Type 2 diabetes mellitus initiated on canagliflozin or a glucagon-like peptide-1 receptor agonist. Poster presented at: 26th Annual Scientific and Clinical Congress of the American Association of Clinical Endocrinologists (AACE). TX, USA, 3–7 May 2017.
31.
Russell-Jones D, Khan R. Insulin-associated weight gain in diabetes – causes, effects and coping strategies. Diabetes Obes. Metab. 9(6), 799–812 (2007).
32.
Feldstein AC, Nichols GA, Smith DH et al. Weight change in diabetes and glycemic and blood pressure control. Diabetes Care 31(10), 1960–1965 (2008).
33.
Wing RR, Lang W, Wadden TA et al. Benefits of modest weight loss in improving cardiovascular risk factors in overweight and obese individuals with Type 2 diabetes. Diabetes Care 34(7), 1481–1486 (2011).
34.
Traina S, Guthrie R, Slee A. The impact of weight loss on weight-related quality of life and health satisfaction: results from a trial comparing canagliflozin with sitagliptin in triple therapy among people with Type 2 diabetes. Postgrad. Med. 126(3), 7–15 (2014).
35.
Traina SB, Slee A, Woo S, Canovatchel W. The importance of weight change experiences for performance of diabetes self-care: a patient-centered approach to evaluating clinical outcomes in Type 2 diabetes. Diabetes Ther. 6(4), 611–625 (2015).
36.
Austin PC. Using the standardized difference to compare the prevalence of a binary variable between two groups in observational research. Commun. Stat. Simul. Comput. 38(6), 1228–1234 (2009).
Information & Authors
Information
Published In
Pages: 889 - 905
PubMed: 31167554
Copyright
© 2019 Janssen Scientific Affairs, LLC. This work is licensed under the Attribution-NonCommercial-NoDerivatives 4.0 Unported License
History
Received: 3 January 2019
Accepted: 30 April 2019
Published online: 6 June 2019
Keywords:
Topics
Authors
Metrics & Citations
Metrics
Article Usage
Article usage data only available from February 2023. Historical article usage data, showing the number of article downloads, is available upon request.
Citations
How to Cite
Treatment patterns, glycemic control and bodyweight with canagliflozin 300 mg versus GLP1RAs in Type II diabetes patients. (2019) Journal of Comparative Effectiveness Research. DOI: 10.2217/cer-2019-0002
Export citation
Select the citation format you wish to export for this article or chapter.
Citing Literature
- Ali Talyshinskii, Vineet Gauhar, Steffi Kar Kei Yuen, Selcuk Güven, Theodoros Tokas, Arman Tsaturyan, Dmitry Enikeev, Bhaskar Somani, From molecules to the clinic—pathophysiology of sodium-glucose cotransporter 2 inhibitors and their emerging role in urology: A comprehensive review from the European Association of Urology Section of Endourology, Asian Journal of Urology, 10.1016/j.ajur.2025.11.004, (2026).
- Man Xu, Quanzhi Li, Ning Chen, Xi Zhang, Wei Zhang, Prescription Patterns and Associated Factors of Sodium-Glucose Cotransporter 2 (SGLT2) Inhibitors Use Among Patients Worldwide: A Systematic Review and Meta-Analysis of Real-World Studies, Journal of the American Medical Directors Association, 10.1016/j.jamda.2025.106036, 27, 2, (106036), (2026).
- Saira Naeem, Cyprian O Ogah, Huda Mohammed, Ingie M Gabra, Nouran Halawa, Iana Malasevskaia, Effects of Sodium-Glucose Cotransporter 2 Inhibitors on Body Weight, BMI, and Body Composition in Adults With Type 2 Diabetes Mellitus: A Systematic Review, Cureus, 10.7759/cureus.72771, (2024).
- Muhammad Aaqib Shamim, Amol N. Patil, Ulfat Amin, Tuli Roy, Krishna Tiwari, Noor Husain, Jogender Kumar, Santenna Chenchula, Priyanka Rao, Venkata Ganesh, Shoban Babu Varthya, Surjit Singh, Ravindra Shukla, Ashu Rastogi, Aravind P. Gandhi, Prakisini Satapathy, Ranjit Sah, Bijaya Kumar Padhi, Pradeep Dwivedi, Kamlesh Khunti, Glucagon‐like peptide ‐1 receptor agonists in adolescents with overweight or obesity with or without type 2 diabetes multimorbidity—a systematic review and network meta‐analysis , Diabetes, Obesity and Metabolism, 10.1111/dom.15777, 26, 10, (4302-4317), (2024).
- Wajd Alkabbani, Baiju R. Shah, Arsène Zongo, Dean T. Eurich, Mhd Wasem Alsabbagh, John‐Michael Gamble, Post‐initiation predictors of discontinuation of the sodium‐glucose cotransporter‐2 inhibitors: A comparative cohort study from the United Kingdom, Diabetes, Obesity and Metabolism, 10.1111/dom.15241, 25, 12, (3490-3500), (2023).
- Tracey Weiss, Lingfeng Yang, Richard D Carr, Sampriti Pal, Baanie Sawhney, Robert Boggs, Swapnil Rajpathak, Kristy Iglay, Real-world weight change, adherence, and discontinuation among patients with type 2 diabetes initiating glucagon-like peptide-1 receptor agonists in the UK, BMJ Open Diabetes Research & Care, 10.1136/bmjdrc-2021-002517, 10, 1, (e002517), (2022).
- Tracey Weiss, Richard D Carr, Sampriti Pal, Lingfeng Yang, Baanie Sawhney, Robert Boggs, Swapnil Rajpathak, Kristy Iglay,
Real-World Adherence and Discontinuation of Glucagon-Like Peptide-1 Receptor Agonists Therapy in Type 2 Diabetes Mellitus Patients in the United States
, Patient Preference and Adherence, 10.2147/PPA.S277676, Volume 14, (2337-2345), (2020). - Mario Luca Morieri, Angelo Avogaro, Gian Paolo Fadini,
Long-Acting Injectable GLP-1 Receptor Agonists for the Treatment of Adults with Type 2 Diabetes: Perspectives from Clinical Practice
, Diabetes, Metabolic Syndrome and Obesity: Targets and Therapy, 10.2147/DMSO.S216054, Volume 13, (4221-4234), (2020). - Richard Ofori‐Asenso, Berhe W. Sahle, Ken Lee Chin, Mohsen Mazidi, Zanfina Ademi, Marie Louise De Bruin, Danny Liew, Poor adherence and persistence to sodium glucose co‐transporter 2 inhibitors in real‐world settings: Evidence from a systematic review and meta‐analysis, Diabetes/Metabolism Research and Reviews, 10.1002/dmrr.3350, 37, 1, (2020).
- Melissa H. Roberts, Gary T. Ferguson, Real-World Evidence: Bridging Gaps in Evidence to Guide Payer Decisions, PharmacoEconomics - Open, 10.1007/s41669-020-00221-y, 5, 1, (3-11), (2020).