Complications in type III open tibial shaft fractures treated with open reduction and internal fixation
Publication: Journal of Comparative Effectiveness Research
Abstract
Aim: To estimate rates of fracture-related infection (FRI) and nonunion and assess the healthcare burden associated with FRI among patients with open reduction and internal fixation (ORIF) for Type III open tibial shaft fractures (TSFs). Methods: Patients with type III TSF requiring ORIF were identified using MarketScan® Database. Healthcare utilization and total costs were compared using generalized linear models. Results: The rates of FRI and nonunion were 35.99 and 36.94%, respectively, at 365 days. Patients with FRI had a significantly higher rate of readmission, emergency room visit and total healthcare costs compared with patients without FRI. Conclusion: Patients with an ORIF procedure for Type III TSF have a high risk of FRI and nonunion and; FRI significantly increased the healthcare burden.
Annually, injuries resulting in open fractures of the long bones affect approximately 11.5 of 100,000 people in the USA. These fractures occur mostly in the lower limbs with the majority (40%) occurring in the tibia bones [1].
Open fractures are classified by Gustilo Anderson (GA) Type (I–III), [2,3] which categorizes the fractures into three groups based on the neurovascular status and severity level, in other words, the size of the open wound, the contamination and soft-tissue injury. Contemporary treatment of fractures consists of open reduction and internal fixation (ORIF) procedures including intramedullary nailing. Risk of complications, including fracture-related infection (FRI) [4] and nonunion, increase with GA classification type with highest risks in GA Type III (IIIA, IIIB and IIIC) fractures, [5] which include neurovascular injury, bone loss and lacerations typically sustained by high-impact/high-energy injuries [3]. The reported rates of FRI for open Type III tibial shaft fractures (TSFs) range from 6 to 39% [3] and nonunion has been reported between 14 and 48% of open TSF [6–9]. Presence of FRI may delay bone union [3,5]. FRI and nonunions are also associated with high healthcare expenditure, prescription utilization (e.g., opioids, anti-inflammatory drugs) and delayed patient healing. In some instances, reoperations may be required to reach functional recovery, thus resulting in substantial economic burden [10]. Patients developing non-unions have also been shown to incur more than twice the medical cost versus patients without nonunion [11]. Currently, there is a lack of nationally-representative data on the immediate and long-term risks of complications in patients with open TSFs. Additionally, limited data is available on the economic impact of FRI for patients with GA III open TSF that are treated with ORIF.
Objectives
The primary objective of this study was to estimate the short- and mid-term rate of FRI and nonunions, in a commercially insured population of patients treated with ORIF for all GA Type III open TSF. The secondary objectives of this study were to identify risk factors associated with FRI, and to describe the economic burden on the healthcare system from the perspective of a payer.
Methods
Data source
This retrospective observational cohort study of patients with GA Type III open TSF was conducted using IBM MarketScan® Commercial Claims Data. This database contains administrative claims and eligibility records for approximately 40 million enrollees per year with commercial insurance (i.e., working-age adults and their dependents). This database is suitable for this analysis as all diagnoses, procedures, inpatient, outpatient and emergency room services, and paid prescriptions are longitudinally captured for all patients. MarketScan database is in compliance with the Health Information Portability and Accountability Act of 1996 (HIPAA). All covered lives have a unique identifier and complete demographic characterization (age, gender, US geographical region, health insurance payer type, employment status, monthly enrollment status and an annual indication, etc). Only de-identified patient records were used in this study; hence Institutional Review Board approval was unnecessary.
Patient selection parameters & study measures
Adult patients (18–64 years of age) with ORIF procedures including intramedullary nailing during an out- or inpatient admission between 1 January 2007 and 30 June 2017, with at least one diagnosis indicative of any GA Type III open TSF within ±30 days of ORIF procedure were selected. Type III open TSF were identified using International Classification of Diseases (ICD) ten diagnosis codes or a combination of ICD-9 codes for TSF and ORIF with Current Procedural Terminology (CPT) or Health Care Common Procedures Coding System (HCPCS) codes for use of vacuum-assisted closure, skin graft, or skin flaps (Supplementary Table 1). The date of the ORIF procedure for outpatient cases or the date of admission for ORIF procedure (for inpatient admissions) was defined as the index date. Patients were required to have a minimum of 180 days pre-index and at least 30 days of follow-up continuous enrollment to ensure availability of information on comorbidities and risk factors during pre-index and outcomes during follow-up periods.
Patient age, gender, region, payer type and site of service were recorded at index date. Comorbidities were assessed using the Charlson Comorbidity Index (CCI) during the 180 days prior to the index date. Other risk factors such as obesity, diabetes, alcohol and drug abuse were identified during the pre-index period. The primary outcome measures included FRI or nonunion, each classified as binary measures based on ICD-9-CM, ICD-10 or CPT codes (Supplementary Table 1). The aim was to identify diagnosis codes that indicate a FRI or nonunion. FRI was identified at least 2 days post index for outpatient cases or from any time from date of discharge onward for inpatient cases. FRI was measured at days 30, 60, 90, 180 (short-term) and 365 days, 18 and 24 months (mid-term) while nonunion was measured at 365 days, 18 and 24 months (mid-term). There is minimal evidence of healing at 6 months and hence nonunion was not reported at earlier time periods. The diagnostic and procedural FRI codes were reviewed by the senior medical investigator to help ensure accurate code selection. Healthcare utilization in terms of readmission and emergency room visits and total cost to payers for inpatient, outpatient, emergency room services and prescriptions were calculated at days 30, 60, 90, 180 and 365 days, and 18 and 24 months follow-up. All reimbursed costs were adjusted to 2017 dollars using the Consumer Price Index (CPI) from the US Bureau of Labor Statistics (BLS) [12].
Data analysis
Descriptive statistics were used to summarize proportions of patients with FRI and those with nonunions for the different follow-up time periods. Median number of days from index to FRI was calculated. Proportions of patients with readmission and emergency room admissions in the post-index period were compared between groups with and without FRI. Similarly, the total medical and prescription cost was calculated overall at 30, 60, 90, 180 and 365 days and 18 and 24 months and were also compared between those who developed FRI and those who did not. At 365 days follow-up, generalized linear models (GLM) with logit function were used to evaluate the adjusted rates of readmission and emergency room visits among patients with and without FRI. Also, a GLM with log-link function and gamma distribution was used to evaluate the mean adjusted total costs between patients with and without FRI. The models were adjusted for age, gender, plan type, year of index ORIF, place of service, region, obesity, diabetes, alcohol abuse, drug abuse and CCI score.
Risk factors were assessed at 365 days follow-up using GLM with logit function and FRI (yes/no) as the dependent variable. Independent variables included in the model were patient gender, age, region, obesity, diabetes, alcohol abuse, place of service and CCI score.
As sensitivity analysis, intention to treat approach was used to determine the rates of infection and nonunion at 365 days and 24 months follow-up. This approach provided us conservative estimates that could reduce the potential selection bias due to inclusion of only those patients with continuous enrollment in the health plan.
Results
There were 580 patients included in the study (Figure 1) of which 21.03% (n = 122) were female. The majority of patients (63%) were covered under preferred provider organization (PPO) plans. On average patients were enrolled for 638 days (SD: 677; median 419). Eighty seven percent of patients had their index ORIF procedure during an inpatient admission and 8.45% patients had index ORIF procedure in the emergency care, which would most often lead to an inpatient admission (Table 1). The median number of days to first FRI recorded after index was 58 days among patients with FRI. In the first 30 days of follow-up, 16.55 % of patients had a FRI diagnosis (Table 2). Over longer follow-up durations, the rates of FRI steadily increased up to 44.44% at month 24. For nonunion, there was an increase in the rate from 36.94% at day 365 to 41.98% at month 24 (Table 2).

Figure 1. The sample selection process.
ORIF: Open reduction and internal fixation.
| N | % | |
|---|---|---|
| 580 | 100% | |
| Gender | ||
| Female | 122 | 21.03% |
| Male | 458 | 78.97% |
| Age (years) | ||
| 18–24 | 127 | 21.90% |
| 25–45 | 243 | 41.90% |
| 46–64 | 210 | 36.21% |
| Payer | ||
| NA | 19 | 3.28% |
| CDHP | 42 | 7.24% |
| Comprehensive | 20 | 3.45% |
| EPO | 5 | 0.86% |
| HDHP | 20 | 3.45% |
| HMO | 63 | 10.86% |
| POS | 41 | 7.07% |
| POS with capitation | 5 | 0.86% |
| PPO | 365 | 62.93% |
| Place of service | ||
| Emergency care | 49 | 8.45% |
| Inpatient | 502 | 86.55% |
| Other | 14 | 2.41% |
| Outpatient | 15 | 2.59% |
| Region | ||
| North Central | 118 | 20.34% |
| North East | 95 | 16.38% |
| South | 261 | 45.00% |
| West | 95 | 16.38% |
| Unknown | 11 | 1.90% |
| Charlson Comorbidity Index Score | ||
| 0 | 490 | 84.48% |
| 1 | 59 | 10.17% |
| 2–3 | 25 | 4.31% |
| 4–5 | 3 | 0.52% |
| Above 5 | 3 | 0.52% |
| Comorbidities | ||
| Obesity | 21 | 3.62% |
| Alcohol abuse | 16 | 2.76% |
| Drug abuse | 12 | 2.07% |
| Diabetes | 38 | 6.55% |
CDHP: Consumer-driven health plan; EPO: Exclusive provider organization; HDHP: High-deductible health plan; HMO: Health maintenance organization; NA: Not available; POS: Point of service; PPO: Preferred provider organization.
| Patients with fracture-related infection/nonunion (n) | Patients with enrollment (n) | Rate | |
|---|---|---|---|
| Fracture-related infection | |||
| 30-day follow-up | 96 | 580 | 16.55% |
| 60-day follow-up | 125 | 554 | 22.56% |
| 90-day follow-up | 141 | 528 | 26.70% |
| 180-day follow-up | 140 | 443 | 31.60% |
| 12-month follow-up | 113 | 314 | 35.99% |
| 18-month follow-up | 94 | 228 | 41.23% |
| 24-month follow-up | 72 | 162 | 44.44% |
| Nonunion | |||
| 12-month follow-up | 116 | 314 | 36.94% |
| 18-month follow-up | 94 | 228 | 41.23% |
| 24-month follow-up | 68 | 162 | 41.98% |
| Fracture-related infection or nonunion | |||
| 12-month follow-up | 166 | 314 | 52.87% |
| 18-month follow-up | 132 | 228 | 57.89% |
| 24-month follow-up | 97 | 162 | 59.88% |
The readmission rate for the group of patients with FRI was significantly higher throughout the different follow-up time periods. At the 30-day period, the rate of readmissions was more than three-times higher for the FRI group as compared the no FRI group (44.79 vs 13.22%; p < 0.0001). The rate of readmission consistently stayed higher for the group with FRI as the follow-up duration increased (Table 3). The rates for emergency room visits were also higher for patients with FRI throughout the different follow-up time periods, however they were not always statistically significant. Consistently, throughout the different follow-up time periods the group of patients with FRI had greater mean total healthcare costs compared with those without (at day 30: $37,597 vs $9886; p < 0.0001; at 24 months: $140,227 vs 50,259; p < 0.0001; Table 4).
| Fracture-related infection | No fracture-related infection | p-value | |||||
|---|---|---|---|---|---|---|---|
| n | Patients with enrollment (n) | % | n | Patients with enrollment (n) | % | ||
| Emergency room visit | |||||||
| 30-day follow-up | 16 | 96 | 16.67% | 52 | 484 | 10.74% | 0.0994 |
| 60-day follow-up | 32 | 125 | 25.60% | 65 | 429 | 15.15% | 0.0068 |
| 90-day follow-up | 41 | 141 | 29.08% | 66 | 387 | 17.05% | 0.0024 |
| 180-day follow-up | 45 | 140 | 32.14% | 71 | 303 | 23.43% | 0.0525 |
| 12-month follow-up | 47 | 113 | 41.59% | 60 | 201 | 29.85% | 0.0351 |
| 18-month follow-up | 48 | 94 | 51.06% | 49 | 134 | 36.57% | 0.0293 |
| 24-month follow-up | 37 | 72 | 51.39% | 37 | 90 | 41.11% | 0.1919 |
| Readmission | |||||||
| 30-day follow-up | 43 | 96 | 44.79% | 64 | 484 | 13.22% | <.00001 |
| 60-day follow-up | 73 | 125 | 58.40% | 78 | 429 | 18.18% | <0.0001 |
| 90-day follow-up | 95 | 141 | 67.38% | 75 | 387 | 19.38% | <0.0001 |
| 180-day follow-up | 100 | 140 | 71.43% | 78 | 303 | 25.74% | <0.0001 |
| 12-month follow-up | 86 | 113 | 76.11% | 66 | 201 | 32.84% | <0.0001 |
| 18-month follow-up | 69 | 94 | 73.40% | 47 | 134 | 35.07% | <0.0001 |
| 24-month follow-up | 56 | 72 | 77.78% | 33 | 90 | 36.67% | <0.0001 |
| All | Fracture-related infection | No fracture-related infection | p-value | |||||||
|---|---|---|---|---|---|---|---|---|---|---|
| n | Mean | SD | n | Mean | SD | n | Mean | SD | ||
| 30-day follow-up | 580 | $14,473 | 33,956 | 96 | $37,597 | 59,689 | 484 | $9886 | 23,539 | <0.0001 |
| 60-day follow-up | 554 | $24,026 | 47,958 | 125 | $54,596 | 78,301 | 429 | $14,119 | 29,034 | <0.0001 |
| 90-day follow-up | 528 | $30,567 | 54,400 | 141 | $62,285 | 77,052 | 387 | $19,011 | 37,225 | <0.0001 |
| 180-day follow-up | 443 | $43,158 | 61,693 | 140 | $76,480 | 79,.369 | 303 | $27,761 | 43,799 | <0.0001 |
| 12-month follow-up | 314 | $62,061 | 78,803 | 113 | $103,450 | 93,931 | 201 | $38,792 | 57,144 | <0.0001 |
| 18-month follow-up | 228 | $76,840 | 95,943 | 94 | $116,565 | 107,296 | 134 | $48,973 | 75,916 | <0.0001 |
| 24-month follow-up | 162 | $90,244 | 100,620 | 72 | $140,227 | 117,317 | 90 | $50,259 | 60,807 | <0.0001 |
SD: Standard deviation.
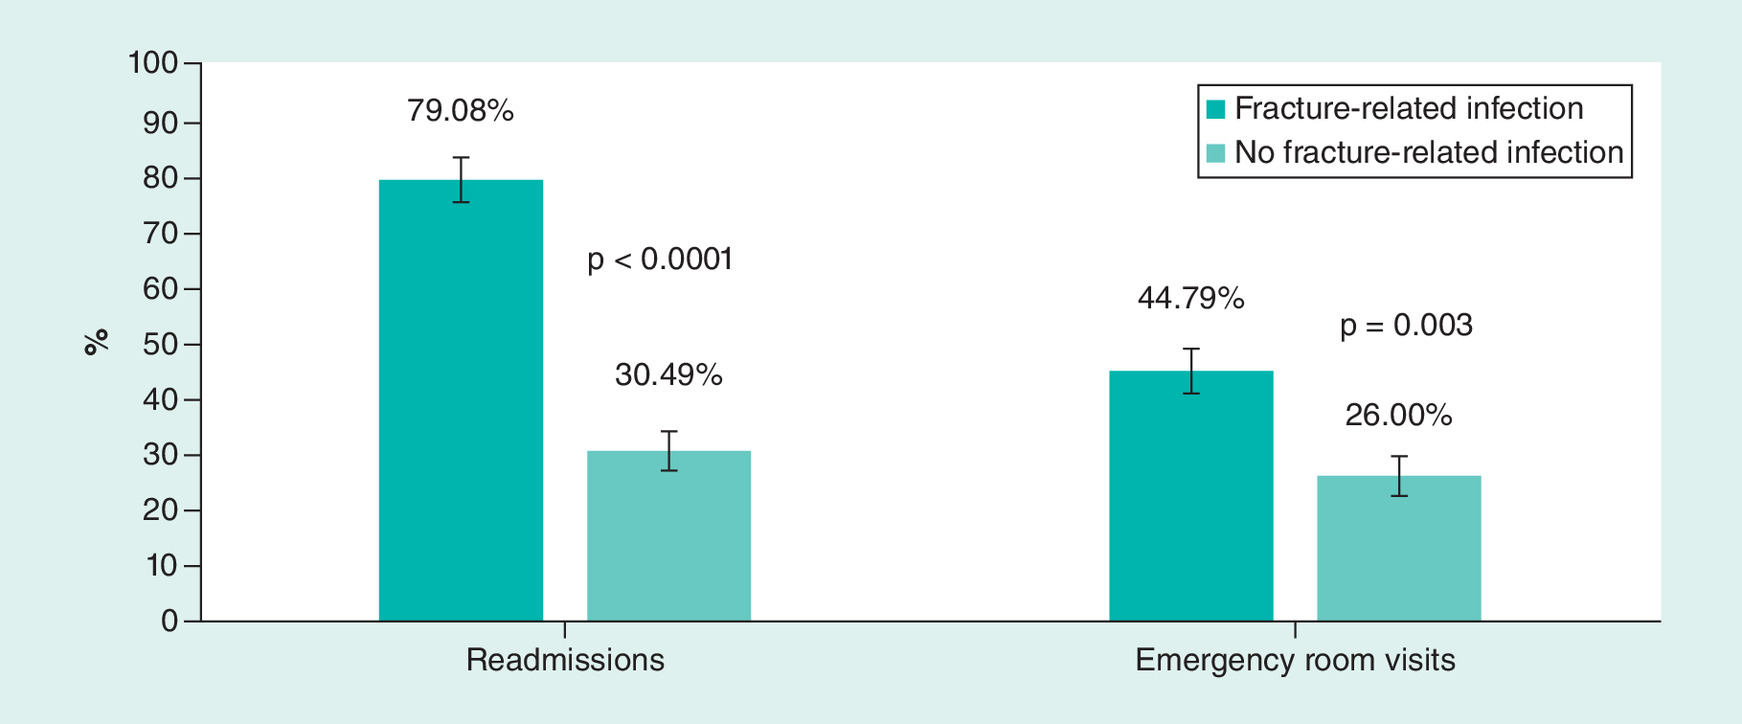
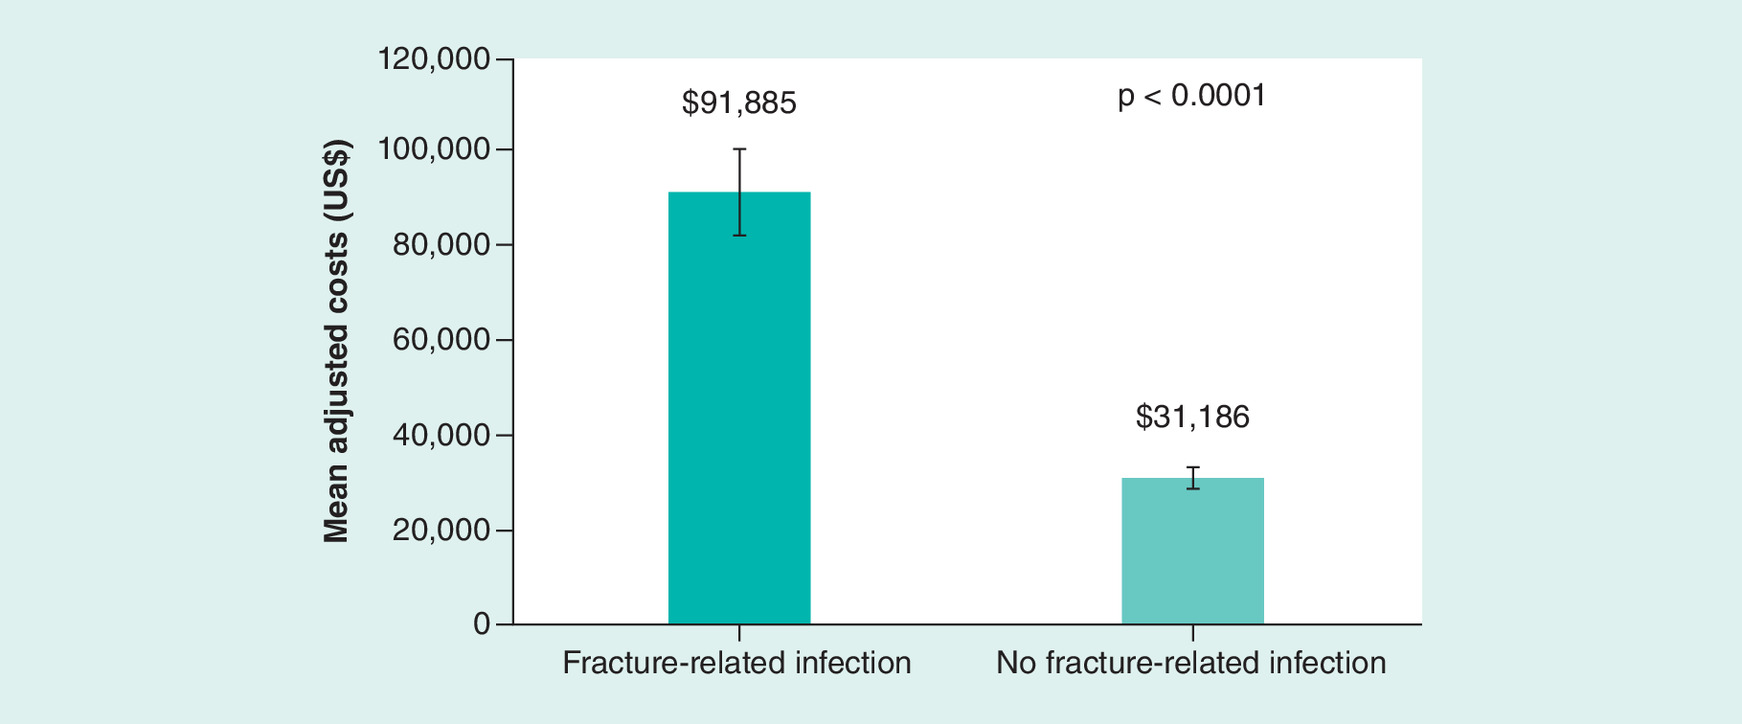
At 365 days follow-up, the adjusted results showed that the rates of readmission (79.08 vs 30.49%; p < 0.0001) and emergency room visits (44.79 vs 26.00%; p = 0.003) were statistically significantly higher for patients with FRI as compared with patients without FRI (Figure 2). Similarly, patients with FRI had higher mean adjusted total costs compared with patients without FRI ($ 91,885 vs $31,186; p < 0.0001) (Figure 3). Logistic regression of risk factors showed that region and year for index ORIF were significantly associated with the risk of FRI for 365 days follow-up (Supplementary Table 2). North central region had 57% lower odds of FRI as compared with the West region. As compared with the year 2016, all prior years for index ORIF surgery had statistically significantly higher odds of FRI.
Based on intention to treat approach (n = 580), we found that rates of FRI and nonunion were high as well. For FRI, the rates were 34.48 and 35.69% at 365 days and 24 months follow-up, respectively. For nonunion, the rates were 24.48% and 25.86% at 365 days and 24 months follow-up, respectively.
Discussion
To our knowledge, this is the first US-based study utilizing a national database of insured patients to estimate risk of both FRI and nonunions specific to high-risk TSF patients. The results of our study show a persistent risk of FRI and nonunion, especially in this high-risk fracture population, substantially complicates patient recovery and escalates healthcare cost. The literature reports rates of FRIs following ORIF procedures on the tibia ranging from 2 to 11% [13,14] without specifically considering open/high-risk fractures. Previous studies have reported ranges from 16 to 36% of patients developing FRI after Type III open TSFs [3,15]. In line with published literature, our nationally representative study of patients with GA Type III open TSF, found that 17% and 36% of patients developed FRI within 30 days and 365 days, respectively, post surgery. Our study also found that nonunions developed in 41.98% of cases at 24 months similar to the rates reported in open fractures (17–48%) [6–9]. Study by Salem reported that the mean time to union for Type III open tibial fractures was 44 weeks and 40% patients had nonunion, this study showed a similar nonunion rate of 41% at 52 weeks [16].
All-cause readmissions and total healthcare cost were consistently greater in the FRI group at all follow-up durations. In the first month after ORIF procedures, patients with FRI recorded average healthcare cost of $37,597 (SD: 59,689), and patients without FRI had an average cost of $9886 (SD: 23,539). At the end of 24 months, the average cost of the group with FRI rose to $140,227 (SD: 117,317) which was still almost three-times greater than the average cost for the group without FRI ($50,259 [SD: 60,807]). More effective clinical management during surgical intervention may reduce the risk of FRI and minimize the ongoing complication risk and costs. The focus must be on strategies that not only mitigate the immediate risk of FRI, but also reduce the risk during postoperative follow-up. Beaver et al. calculated the costs among patients with and without FRI and found that in case of absence of FRI, the total costs were very close to the amounts that we have found, $9407 per patient in Beaver et al. study and $9886 in our study [17]. However, the costs calculated in case of FRI were very different $13,739 as shown in Beaver et al. study and $37,597 in our study. The possible reasons for difference can be different periods for which the costs were measured and small sample size in case of the study of Beaver et al. but there could be other contributing factors. Unadjusted analysis by Hoekstra et al. reported a fivefold increase in the total healthcare costs among patients with a deep infection versus those without infection in open tibial fractures [18]. Study by Hoekstra et al. was conducted in Belgium with maximum follow-up time of 2 years for all patients [18]. Our US-based study, at 1 years follow-up showed about a threefold increase in costs among patients with FRI as compared with patients without FRI. The main difference in the results may be because Hoekstra et al. compared patients with deep infections, which may be severe cases than the cohort in our study that included patients with any FRI.
Underlying reasons for the statistical significance of procedure year as a predictor of FRI risk in our study cannot be ascertained without further investigation. Lower rates of FRI in 2016 may have resulted from undetected temporal trends in patient characteristics, surgical techniques, technologies and/or provider characteristics. Unknown or unmeasured procedural characteristics may also have influenced FRI rates over time (e.g., nature of fractures type IIIA, IIIB and IIIC, quality of reduction, infection control practices, etc.)
These results should be viewed in light of several limitations. Our study looked only at the direct costs. Other studies, like the one by Hak et al. looked also on the indirect costs, caused by the loss of productivity [10]. This can be a subject for further studies. Another limitation is that all measures and factors included were only those available in the claims, from recorded diagnoses for those who have insurance coverage. Therefore, other factors not captured by administrative claims data which contribute to complication-related costs may have been under reported. Most serious complications, however, are reliably documented in the claim file. Our findings may not generalize to high-risk patients without insurance coverage. However, this database consists of healthcare information of over 40 million enrollees. Additionally, since it includes major US health plans across private insurances, it is representative of the vast majority of patients aged 18–64 years. Another challenge with claims data is underestimation of outcome variables when patients do not seek care (or are denied access). To that end, these data reflect estimated complication risk, resource use and costs of those who sought care and were covered by one of the many plans in the database. Also, the FRIs were identified based on ICD-9, ICD-10 and CPT codes and may be subject to coding errors associated with any claims database. Similarly, identification of nonunion was solely based on the ICD diagnosis codes without information about the union of bone through radiographs. Future large database studies utilizing electronic medical records with information on radiograph to report nonunion are warranted to confirm the study findings. Finally, we were not able to differentiate between GA Type IIIA, IIIB and IIIC fractures due lack of specificity of the codes.
Conclusion
This study found that the short and mid-term rates of FRI and nonunion are high, reaching about 44 and 42%, respectively, over the 2-year period in patients with an ORIF procedure for GA Type III open TSFs. Within this high-risk population, FRI significantly increased need for hospital readmission and total healthcare costs.
•
Potential complications of Gustilo Anderson (GA) Type III (IIIA, IIIB and IIIC) open tibial shaft fractures (TSF) treated with open reduction and internal fixation (ORIF) include fracture-related infection (FRI) and nonunion.
•
The objectives of this study were to estimate rates of FRI and nonunion, as well as assess the healthcare burden associated with FRI among patients with an ORIF procedure including intramedullary nailing for all GA Type III open TSFs.
•
IBM MarketScan® Commercial Claims Database was used to identify patients with any GA type III TSF requiring ORIF.
•
Generalized linear models were used to adjust for patient demographic and clinical characteristics to compare healthcare utilization (readmission, emergency room visits) and total costs among patients with and without FRI.
•
The rates of FRI ranged from 16.55% at 30 days to 44.44% at 24 months, while the rates of nonunion ranged from 36.94% at 365 days to 41.98% at 24 months.
•
At 365 days follow-up, patients with FRI had a statistically significantly higher adjusted rate of readmission (79.08 vs 30.49%), emergency room visit (44.79 vs 26.00%) and mean total healthcare costs ($91,885 vs $31,186) compared with the patients without FRI (all p < 0.05).
•
This is the first US-based study utilizing a national database of insured patients to estimate risk of both FRIs and nonunions specific to high-risk tibia fracture patients.
•
This study found that the short and mid-term rates of FRI and nonunion are high and; FRI significantly increased the healthcare burden within this high-risk population.
Supplementary data
To view the supplementary data that accompany this paper please visit the journal website at: Supplementary Material
Financial & competing interests disclosure
This study was funded by Johnson and Johnson. AS Chitnis, M Vanderkarr, C Sparks, J McGlohorn and CE Holy are employees and stock holders of Johnson & Johnson. The authors have no other relevant affiliations or financial involvement with any organization or entity with a financial interest in or financial conflict with the subject matter or materials discussed in the manuscript apart from those disclosed.
Writing assistance for the initial draft was provided by eMAX Health, White Plains, NY, which received funding from Johnson and Johnson.
Ethical conduct of research
IBM MarketScan database is in compliance with the Health Information Portability and Accountability Act of 1996 (HIPAA). Only de-identified patient records from IBM MarketScan database were used in this study; hence Institutional Review Board approval was not required.
Supplementary Material
File (supplementary appendix.docx)
- Download
- 29.11 KB
References
Papers of special note have been highlighted as: • of interest; •• of considerable interest
1.
Giannoudis PV, Papakostidis C, Roberts C. A review of the management of open fractures of the tibia and femur. J. Bone Joint Surg. Br. 88(3), 281–289 (2006).
•• Provides summary of outcomes for fixation in open fractures of tibia.
2.
Gustilo RB, Anderson JT. Prevention of infection in the treatment of one thousand and twenty-five open fractures of long bones: retrospective and prospective analyses. J. Bone Joint Surg. Am. 58(4), 453–458 (1976).
3.
Johnson EN, Burns TC, Hayda RA, Hospenthal DR, Murray CK. Infectious complications of open type III tibial fractures among combat casualties. Clin. Infect. Dis. 45(4), 409–415 (2007).
• Characterizes the infections in type III tibial fractures.
4.
Metsemakers WJ, Morgenstern M, Mcnally MA et al. Fracture-related infection: a consensus on definition from an international expert group. Injury 49(3), 505–510 (2018).
5.
Lua J, Tan VH, Sivasubramanian H, Kwek E. Complications of open tibial fracture management: risk factors and treatment. Malays. Orthop. J. 11(1), 18–22 (2017).
•• Reviews the risk factors causing infective complications in open tibial fractures.
6.
Calori GM, Albisetti W, Agus A, Iori S, Tagliabue L. Risk factors contributing to fracture non-unions. Injury 38(Suppl. 2), S11–S18 (2007).
7.
Dahabreh Z, Calori GM, Kanakaris NK, Nikolaou VS, Giannoudis PV. A cost analysis of treatment of tibial fracture nonunion by bone grafting or bone morphogenetic protein-7. Int. Orthop. 33(5), 1407–1414 (2009).
8.
Bhandari M, Guyatt GH, Swiontkowski MF, Schemitsch EH. Treatment of open fractures of the shaft of the tibia. J. Bone Joint Surg. Br. 83(1), 62–68 (2001).
• Compares different treatments in open tibial fractures and associated risks of infection and nonunion.
9.
Fong K, Truong V, Foote CJ et al. Predictors of nonunion and reoperation in patients with fractures of the tibia: an observational study. BMC Musculoskelet. Disord. 14, 103–103 (2013).
10.
Hak D, Saleh K, Nierengarten M. Socioeconomic burden of traumatic tibial fractures: nonunion or delayed union. MedScape Orthop. Clin. Updates 1–22 (2001).
11.
Antonova E, Le TK, Burge R, Mershon J. Tibia shaft fractures: costly burden of nonunions. BMC Musculoskelet. Disord. 14, 42 (2013).
• Compares healthcare use and costs with tibial shaft fractures in patients with and without nonunion.
12.
Consumer Price Index (CPI) 2017.
13.
Lin S, Mauffrey C, Hammerberg EM, Stahel PF, Hak DJ. Surgical site infection after open reduction and internal fixation of tibial plateau fractures. Eur. J. Orthop. Surg. Traumatol. 24(5), 797–803 (2014).
14.
Papagelopoulos PJ, Partsinevelos AA, Themistocleous GS, Mavrogenis AF, Korres DS, Soucacos PN. Complications after tibia plateau fracture surgery. Injury 37(6), 475–484 (2006).
15.
Papakostidis C, Kanakaris NK, Pretel J, Faour O, Morell DJ, Giannoudis PV. Prevalence of complications of open tibial shaft fractures stratified as per the Gustilo-Anderson classification. Injury 42(12), 1408–1415 (2011).
16.
Salem KH. Critical analysis of tibial fracture healing following unreamed nailing. Int. Orthop. 36(7), 1471–1477 (2012).
17.
Beaver R, Brinker MR, Barrack RL. An analysis of the actual cost of tibial nonunions. J. LA State Med. Soc. 149(6), 200–206 (1997).
18.
Hoekstra H, Smeets B, Metsemakers W-J, Spitz A-C, Nijs S. Economics of open tibial fractures: the pivotal role of length-of-stay and infection. Health Econ. Rev. 7(1), 32–32 (2017).
•• Compares total healthcare costs of open tibial fractures in patients with deep infection versus patients without infection.
Information & Authors
Information
Published In
Pages: 907 - 915
PubMed: 31172791
Copyright
© 2019 Future Medicine Ltd.
History
Received: 28 March 2019
Accepted: 16 May 2019
Published online: 7 June 2019
Keywords:
Topics
Authors
Metrics & Citations
Metrics
Article Usage
Article usage data only available from February 2023. Historical article usage data, showing the number of article downloads, is available upon request.
Citations
How to Cite
Complications in type III open tibial shaft fractures treated with open reduction and internal fixation. (2019) Journal of Comparative Effectiveness Research. DOI: 10.2217/cer-2019-0040
Export citation
Select the citation format you wish to export for this article or chapter.
Citing Literature
- Andrew D. Marten, Elizabeth Cho, Patrick Mazza, Carlo Eikani, Ashley E. Levack, Trends in open tibia fracture antibiotic prophylaxis, Archives of Orthopaedic and Trauma Surgery, 10.1007/s00402-025-05921-w, 145, 1, (2025).
- Xinling Zhang, Xin Yang, Yujie Chen, Guanhuier Wang, Pengbing Ding, Zhenmin Zhao, Hongsen Bi, Clinical study on orthopaedic treatment of chronic osteomyelitis with soft tissue defect in adults, International Wound Journal, 10.1111/iwj.13729, 19, 6, (1349-1356), (2021).
- Alexander T. Schade, Chetan Khatri, Henry Nwankwo, William Carlos, William J. Harrison, Andrew J. Metcalfe, The economic burden of open tibia fractures: A systematic review, Injury, 10.1016/j.injury.2021.02.022, 52, 6, (1251-1259), (2021).
- Hui Ye, Shufeng Lin, Junfeng Zhu, Lifeng Jiang, Clinical experience of biliary T tube of immobilization of peri-pin membrane in tibial Gustilo III fracture treated with vacuum sealant drainage combined with an external fixator, Medicine, 10.1097/MD.0000000000022846, 99, 43, (e22846), (2020).