Matching-adjusted indirect comparison: secukinumab versus infliximab in biologic-naive patients with psoriatic arthritis
Abstract
Aim: To compare secukinumab with infliximab in biologic-naive patients with psoriatic arthritis using matching-adjusted indirect comparison. Patients & methods: Individual patient baseline data for secukinumab were matched to published aggregate data for infliximab by key baseline characteristics, with matching weights determined by logistic regression, and used to recalculate American College of Rheumatology (ACR) responses for secukinumab, for comparison with infliximab. Results: There were no differences in outcomes between secukinumab and infliximab at weeks 6/8 and 14/16. At weeks 24 and 54/52, ACR 20 responses were higher with secukinumab 150 mg than infliximab. At week 54/52, ACR 20/50 responses were higher for secukinumab 300 mg than infliximab. Conclusion: In the mid to long term, patients receiving secukinumab were more likely to achieve ACR 20/50 responses than those receiving infliximab.
For patients with active psoriatic arthritis (PsA), the European League Against Rheumatism [1] and the Group for Research and Assessment of Psoriasis and Psoriatic Arthritis (GRAPPA) [2] recommend the use of biologic disease-modifying anti-rheumatic drugs (bDMARDs) when response to conventional synthetic disease-modifying antirheumatic drugs is inadequate. Until 2016, the approved biologic disease-modifying anti-rheumatic drugs of choice were the TNF inhibitors (TNFis) infliximab, adalimumab, golimumab, etanercept and certolizumab pegol, as well as ustekinumab, a monoclonal antibody (mAb) targeted against IL-12/23. More recently, secukinumab and ixekizumab, which are mAbs targeting IL-17A, as well as the IgG1-CTLA-4 fusion protein abatacept, have been approved for the treatment of patients with PsA [3–8]. Studies to date have shown that secukinumab has a good safety profile, and is associated with rapid and sustained improvement of the signs and symptoms of PsA, higher response rates, in terms of at least 20% improvement in American College of Rheumatology response criteria (ACR 20), and less radiographic progression when compared with placebo [9–11].
In the absence of data from direct, head-to-head (H2H) randomized controlled trials (RCTs), adjusted indirect treatment comparisons can aid clinicians and health technology assessment bodies when making treatment and reimbursement decisions. The number of placebo-controlled trials in rheumatology is increasing, but few H2H studies have been conducted; consequently, indirect treatment comparisons are becoming more common in the field [12]. Network meta-analysis can be used when a common comparator arm between RCTs (typically placebo) is available; however, this method relies on analyzing aggregate data and therefore must assume that the trial populations are similar. This can lead to potential bias in the presence of uneven treatment effect modifiers [12]. Furthermore, owing to the requirement for a common comparator arm, network meta-analyses are usually limited to placebo-adjusted comparisons, and therefore cannot be used to assess long-term efficacy using trials in PsA, in which patients typically receive placebo for 24 weeks or less [12,13]. By incorporating individual patient data (IPD), matching-adjusted indirect comparison (MAIC) avoids some of the limitations imposed by cross-trial differences, such as disparities between populations, lack of common comparators, sensitivity to modeling assumptions and different definitions or reporting methods for outcome measures [13]. By using MAIC, a direct comparison of two therapies can be simulated and extended beyond the placebo-controlled time points of the trials [14].
Health technology assessment agencies have acknowledged MAIC as a valid and robust method when differences between trial populations are present, and methodological guidelines for the technique have been published [12,14,15]. Previously, MAIC has provided evidence for the comparative effectiveness of secukinumab, etanercept and infliximab versus adalimumab in patients with psoriasis and PsA [16–18].
In this study, we aimed to assess the comparative effectiveness of biologic therapy in biologic-naive patients with PsA, examining outcomes at time points up to 1 year. This paper is one of a series of studies using MAIC to indirectly compare secukinumab to a range of TNFis. In this instance, MAIC was used to compare intravenous infliximab, a chimeric mAb against TNF, with subcutaneously administered secukinumab, a fully human mAb against IL-17A, using aggregate data from the IMPACT 2 trial [19] and pooled IPD from the FUTURE 2 [9] and FUTURE 3 [10] trials. Using MAIC methodology, the trial from which aggregate data are taken provides the target population for the study; in our analysis, this meant that patients naive to TNFi treatment were the population of interest. TNFi exposure is likely to be an effect modifier [20]; differences in treatment effects between TNFi-naive and TNFi-experienced patients have been reported. Therefore, it is valuable to compare secukinumab and infliximab specifically in a TNFi-naive population.
Patients & methods
Matching-adjusted indirect comparison
The MAIC process comprises the following steps: identification of source data by systematic literature review (SLR); selection of baseline characteristics for matching; matching and adjusting IPD to published aggregate data; and comparing outcomes from IPD with aggregate data. The datasets analyzed in the current study are available from the corresponding author on reasonable request.
Identification of source data by SLR
An SLR with a cut-off in November 2015 was used to identify relevant clinical evidence for secukinumab and infliximab in the treatment of adult patients with PsA, as described previously [20]. Following full-text screening, 29 trials were considered to be suitable for inclusion according to the eligibility criteria (Supplementary Table 11 and Supplementary Figure 1). Of these trials, 18 included neither secukinumab nor infliximab and hence were excluded. The remaining 11 RCTs are shown in Supplementary Table 2. Of these, nine were excluded because patients did not receive the approved doses of secukinumab (subcutaneous 150 and 300 mg) or infliximab (5 mg/kg) [1]. The RCTs identified for inclusion were FUTURE 2 (NCT01752634) [9] and IMPACT 2 (NCT00051623) [19].
More recently, data from the FUTURE 3 trial (NCT01989468), with 1-year follow-up, have been published [10], and were considered potentially suitable for inclusion in our analysis. To confirm whether any new data for infliximab had been published in the same time period, a targeted literature search in PubMed covering the time period from the last SLR update to April 2018 using the keywords ‘infliximab’ and ‘psoriatic arthritis’ revealed no new placebo-controlled infliximab trials or H2H studies directly comparing secukinumab with infliximab in PsA. Additionally, no ongoing studies matching our inclusion criteria were detected in a search of the ClinicalTrials.gov website in April 2018 using the keywords ‘infliximab’ and ‘psoriatic arthritis’.
FUTURE 3 had a similar design to that of FUTURE 2 (and importantly used the approved dosages of secukinumab 150 and 300 mg). Secukinumab was administered subcutaneously using an autoinjector in FUTURE 3, whereas in FUTURE 2 a prefilled syringe was used. The potential for a small effective sample size (ESS) following matching is a known limitation of MAIC [12]; therefore, to maximize the ESS in our study, we decided to use pooled IPD from the FUTURE 2 and FUTURE 3 studies. Pooling IPD to match to aggregate data is a valid methodology to increase the potential ESS in a MAIC [13,21].
Studies included
FUTURE 2 [9] and FUTURE 3 [10] were both Phase III RCTs (Figure 1). In FUTURE 2, patients were randomized 1:1:1:1 to receive subcutaneous secukinumab 75, 150 or 300 mg, or placebo [9]. In FUTURE 3, patients were randomized 1:1:1 to receive subcutaneous secukinumab 150 or 300 mg, or placebo. Patients who had previously experienced TNFi incomplete response (TNFi-IR) were included, with up to three treatment failures being admissible. IMPACT 2 was also a Phase III RCT (Figure 1) [19]. Patients were randomized 1:1 to receive intravenous infusions of either infliximab 5 mg/kg or placebo. The primary end point was achievement of an ACR 20 response at week 14 [19].

Figure 1. FUTURE 2, FUTURE 3 and IMPACT 2 trial designs.
†Patients who had ≥20% improvement from baseline in TJC and SJC.
‡Patients who had <20% improvement from baseline in TJC and SJC.
§Patients randomized to infliximab 5 mg/kg who had <20% improvement from baseline in the combined number of SJC and TJC had their infliximab dose increased to 10 mg/kg at weeks 38 and 46; 15 patients received an uptitration in their dose of infliximab from 5 mg/kg to 10 mg/kg.
¶Patients who had <10% improvement from baseline in both SJC and TJC received infliximab 5 mg/kg. The placebo-adjusted comparison was only possible until week 16 (shown by yellow rectangle) because patients in all trials could receive active treatment from this point onward. Numbers at the heads of the grey arrows on the left denote the ITT populations.
ACR: American College of Rheumatology; ACR 20: At least a 20% improvement according to the ACR response criteria; AI: Auto-injector; ITT: Intent-to-treat; MAIC: Matching-adjusted indirect comparison; PFS: Prefilled syringe; R: Randomization; SJC: Swollen joint count; TJC: Tender joint count; TNFi: TNF inhibitor.
Selection of baseline characteristics for matching
The selection of baseline characteristics for matching (including prognostic variables and effect modifiers) has been described previously [20]. Two scenarios were developed that differed in the combination of included matching variables. First, a principal analysis (Table 1) included established prognostic variables reported in previous MAICs in PsA [18,20], but incorporated one additional parameter (TNFi-IR), identified by logistic regression analysis as a key effect modifier, as detailed in our previous study [20]. Previous TNFi exposure is also likely to be an effect modifier for infliximab: it has been established that patients with PsA who switch between TNFi therapies have lower ACR responses with subsequent TNFis than TNFi-naive patients [22–25].
| Baseline characteristics | IMPACT 2 trial | FUTURE 2/3 (before matching) | FUTURE 2/3 (after matching) | |||||
|---|---|---|---|---|---|---|---|---|
| INF 5 mg/kg (n = 100) | PBO (n = 100) | SEC 150 mg (n = 238) | SEC 300 mg (n = 239) | PBO (n = 235) | SEC 150 mg (ESS = 84) | SEC 300 mg (ESS = 70) | PBO (ESS = 41) | |
| Demographics | ||||||||
| Mean age, years (SD) | 47.1 (12.8) | 46.5 (11.3) | 48.6 (11.8) p = 0.2991 | 48.3 (12.8) p = 0.4317 | 50.0 (12.5) | 47.1 (8.0) p = 1.0000 | 47.1 (7.6) p = 1.0000 | 46.5 (6.2) |
| Mean weight, kg (SD) | 87.9 (16.5) | 84.5 (20.3) | 88.8 (20.0) p = 0.6918 | 86.4 (19.0) p = 0.4918 | 84.1 (19.1) | 87.9 (14.9) p = 1.0000 | 87.9 (10.8) p = 1.0000 | 84.5 (9.4) |
| Female, n (%) | 29 (29.0) | 49 (49.0) | 122 (51.3) p = 0.0002 | 121 (50.6) p = 0.0003 | 137 (58.3) | 29.0%† p = 1.0000 | 29.0%† p = 1.0000 | 49.0%† |
| White, n (%) | 95 (95.0) | 94 (94.0) | 219 (92.0) p = 0.3297 | 226 (94.6) p = 0.8693 | 227 (96.6) | 95.0%† p = 1.0000 | 95.0%† p = 1.0000 | 94.0%† |
| Disease characteristics | ||||||||
| MTX use, n (%) | 47 (47.0) | 45 (45.0) | 105 (44.1) p = 0.6268 | 115 (48.1) p = 0.8510 | 120 (51.1) | 47.0%† p = 1.0000 | 47.0%† p = 1.0000 | 45.0%† |
| Psoriasis (≥3% BSA), n (%) | 83 (83.0) | 87 (87.0) | 126 (52.9) p < 0.0001 | 103 (43.1) p < 0.0001 | 102 (43.4) | 83.0%† p = 1.0000 | 83.0%† p = 1.0000 | 87.0%† |
| Mean PASI score (SD) ‡ | 11.4 (12.7) | 10.2 (9.0) | 12.2 (11.3) p = 0.6342 | 10.8 (8.5) p = 0.7011 | 10.9 (8.7) | 11.4 (8.8) p = 1.0000 | 11.4 (8.0) p = 1.0000 | 10.2 (6.2) |
| Mean HAQ-DI score (SD) | 1.1 (0.6) | 1.1(0.6) | 1.2 (0.6) p = 0.1629 | 1.2 (0.7) p = 0.2125 | 1.2 (0.7) | 1.1 (0.4) p = 1.0000 | 1.1 (0.4) p = 1.0000 | 1.1 (0.4) |
| Presence of dactylitis, n (%) | 40 (40.0) | 41 (41.0) | 68 (28.6) p = 0.0397 | 92 (38.5) p = 0.7953 | 63 (26.8) | 40.0%† p = 1.0000 | 40.0%† p = 1.0000 | 41.0%† |
| Presence of enthesitis, n (%) | 42 (42.0) | 35 (35.0) | 159 (66.8) p < 0.0001 | 144 (60.3) p = 0.0021 | 163 (69.4) | 42.0%† p = 1.0000 | 42.0%† p = 1.0000 | 35.0%† |
| TNFi-naive, n (%) | 100 (100.0) | 100 (100.0) | 157 (66.0) p < 0.0001 | 162 (67.8) p < 0.0001 | 156 (66.4) | 100.0% p = 1.0000 | 100.0% p = 1.0000 | 100.0% |
| Variables not used for matching | ||||||||
| Mean SF-36 PCS (SD) | 33.0 (9.4) | 31.0 (9.0) | 37.1 (7.9) p < 0.0001 | 38.3 (8.3) p < 0.0001 | 37.4 (8.6) | 38.7 (5.0) p < 0.0001 | 39.9 (5.2) p < 0.0001 | 39.4 (4.8) |
| Mean SF-36 MCS (SD) | 45.5 (11.9) | 47.0 (11.9) | 42.0 (11.0) p = 0.0096 | 43.1 (11.5) p = 0.0838 | 43.3 (10.9) | 42.0 (8.2) p = 0.0238 | 44.5 (7.2) p = 0.5315 | 44.0 (5.8) |
†Integer population (n) values are not available owing to calculation of pooled SEC ESS using the  equation.
equation.‡PASI data were collected only for patients with psoriasis affecting ≥3% BSA.
BSA: Body surface area; ESS: Effective sample size; HAQ-DI: Health assessment questionnaire disability index; INF: Infliximab; MCS: Mental component summary; MTX: Methotrexate; PASI: Psoriasis area and severity index; PBO: Placebo; PCS: Physical component summary; SD: Standard deviation; SEC: Secukinumab; SF-36: 36-item Short-Form health survey; TNFi: TNF inhibitor.
Baseline characteristics in FUTURE 2/3 after matching are shown in bold text.
A sensitivity analysis (Supplementary Table 3) was performed, and included all matching variables used in the principal analysis plus three additional important clinical characteristics to increase the matching stringency: PsA disease duration (time since diagnosis), swollen joint count (SJC) and baseline CRP levels.
Matching & adjusting individual patient data to published aggregate data & comparing outcomes
The MAIC matching process is shown in Figure 2. IPD from the pooled secukinumab 150 and 300 mg arms of the FUTURE 2/3 RCTs were weighted to match the selected patient baseline characteristics for the infliximab arm of IMPACT 2, for which aggregate data were taken from the trial publication [19]. Placebo arms were also matched. The methodology was based on Signorovitch et al. [26] and subsequent publications [16,27,28], and methodological guidelines were followed [14]. After this matching process, the weighted mean baseline characteristics of the pooled FUTURE 2/3 populations were identical to those reported for IMPACT 2. Consequently, the matching resulted in a lower ESS for the FUTURE 2/3 arms. SAS version 9.4 and R version 3.2.1 were used for the analysis. After matching, outcomes in the reweighted FUTURE 2/3 population were compared with outcomes reported in IMPACT 2. Given that the comparison was conducted in a population matched to IMPACT 2, the target population or clinical context, of our comparison was restricted to TNFi-naive patients with characteristics similar to those in the IMPACT 2 trial.

Figure 2. Matching-adjusted indirect comparison methodology infographic.
†Weights were derived by logistic regression. The choice of matching parameters was made by consensus of all authors (who include both clinical and methodological experts). Patients were matched for key characteristics known or expected to influence clinical outcomes in individuals with psoriatic arthritis.
‡Pooled placebo arms of FUTURE 2 and FUTURE 3 were also matched to the placebo arm of IMPACT 2.
ESS: Effective sample size; SEC: Secukinumab.
Analyses
Reporting of missing data
In IMPACT 2, all published outcomes included in this MAIC were from the intention-to-treat population, as were those from FUTURE 2/3. All missing ACR data were handled using nonresponder imputation [19], except at week 54/52 when missing data were based on observed data. Scores from the 36-item Short-Form health survey (SF-36) were derived from the secukinumab arms using last observation carried forward for missing data at all time points to match the available data from IMPACT 2. To ensure the robustness of these analyses, ACR 20 responses and odds ratios (ORs) at week 54/52 were also estimated by alternative imputation methods. Given that IMPACT 2 outcome data at week 6 were reported in graphs only, specific software (DigitizeIt, Braunschweig, Germany) was used for data extraction.
Outcomes
ACR 20/50/70 responses and SF-36 scores were selected for comparison in line with the Outcomes Measures in Rheumatology (OMERACT) [29] and GRAPPA [30] guidelines on outcome measures that should be included in RCT datasets in PsA [29]. Comparisons were made between outcomes at the closest available time points in the two trials. ACR response criteria encompass a number of disease domains, including tender joint count and SJC, patient global assessment, pain and physical function, and acute phase response, and therefore represent a stringent outcome measure.
Health-related quality of life was measured using SF-36, which comprises eight domains that can be aggregated into two summary measures: the physical (PCS) and mental component summary (MCS) scores. The PCS is calculated by weighting the four physical and vitality domains positively and the remaining three mental domains negatively. To calculate the MCS, the four mental domains are positively weighted and the physical domains are negatively weighted. These are presented as mean changes from baseline (CFBs).
Placebo-adjusted & non-placebo-adjusted outcome comparisons
Placebo-adjusted comparisons (anchored) were only possible until week 16, as all patients randomized to placebo could potentially receive active rescue treatment from week 16 onward in all three trials. Owing to the lack of placebo as common comparator after week 16, non-placebo-adjusted (unanchored) outcomes from the infliximab arm of IMPACT 2 were directly compared with recalculated outcomes from the secukinumab 150 and 300 mg pooled arms of FUTURE 2/3.
Pairwise comparisons
ACR responses – For the analysis at weeks 6/8 and 14/16 (placebo-adjusted), ORs for the secukinumab arm versus the placebo arm in the reweighted FUTURE 2/3 population were derived from a logistic regression model by using generalized estimating equations with robust standard errors, as recommended by Signorovitch et al. and the National Institute for Health and Care Excellence (NICE) guidance on MAIC methodology [14,26]. Generalized estimating equations were fitted using PROC GENMOD in SAS. These placebo-adjusted OR values were used to estimate the comparative effectiveness of secukinumab and infliximab using the method of Bucher et al. [31]. By using linear predictor scales such as ORs instead of comparing natural outcome scales such as ACR 20 responses, we complied with a mandatory requirement of NICE [14,15].
For non-placebo-adjusted comparisons, standard errors for OR values were estimated based on the information provided by a 2 × 2 contingency table that showed outcomes in the infliximab arm of the IMPACT 2 trial and outcomes in the recalculated pooled secukinumab arm of FUTURE 2/3.
Psoriasis area and severity index (PASI) outcomes – We did not report PASI data because baseline characteristic data for the IMPACT 2 trial psoriasis subgroup were not available. This meant that uncontrolled imbalances could persist postmatching. It is also worth noting that PASI data were collected only in a subgroup of patients in both RCT populations (patients with psoriasis affecting ≥3% body surface area); consequently, missing data in the non-PASI-matched population could further compound this study bias.
SF-36 summary scores – A 95% CI around mean changes in scores for patients in the infliximab arm of the IMPACT 2 trial was estimated using the normal approximation. The p-values for the differences in mean change scores between secukinumab and infliximab were calculated using a Z-statistic, which divides the difference in mean changes in scores by the combined standard error.
Results
Principal analysis
Matching baseline characteristics
Table 1 shows the baseline characteristics of patients in the pooled FUTURE 2/3 population before matching (secukinumab 150 mg, n = 238; secukinumab 300 mg, n = 239; placebo, n = 235) and after matching to the IMPACT 2 infliximab (n = 100) and placebo (n = 100) arms. Before matching, a key difference between patient populations was the proportion who were TNFi-naive (secukinumab 150 mg, 66.0%; secukinumab 300 mg, 67.8%; placebo [FUTURE 2/3], 66.4%; infliximab, 100.0%; placebo [IMPACT 2], 100.0% [p < 0.0001]). After matching, all patients were TNFi-naive. Similar observations were made for all matching variables in the principal (Table 1) and sensitivity analyses (Supplementary Table 3). Therefore, although there was heterogeneity in the patient populations between FUTURE 2/3 and IMPACT 2 before matching, parameters were more similar after matching, with a reduced ESS for FUTURE 2/3 (secukinumab 150 mg, 84; secukinumab 300 mg, 70; placebo, 41).
ACR responses
Figures 3 and 4 and Table 2 show ACR 20/50/70 responses for secukinumab 150 mg and infliximab 5 mg/kg, for both placebo-adjusted (weeks 6/8 and 14/16) and non-placebo-adjusted (weeks 24 and 54/52) time points. There were no differences in ACR responses between secukinumab 150 mg and infliximab at weeks 6/8 and 14/16 (both placebo-adjusted). At week 24, secukinumab 150 mg was associated with higher ACR 20 responses than infliximab (OR [95% CI]: 2.31 [1.24–4.29]; p = 0.008). Week 54/52 non-placebo-adjusted ACR 20 responses were also higher with secukinumab 150 mg than infliximab (OR [95% CI]: 3.03 [1.52–6.04]; p = 0.002).
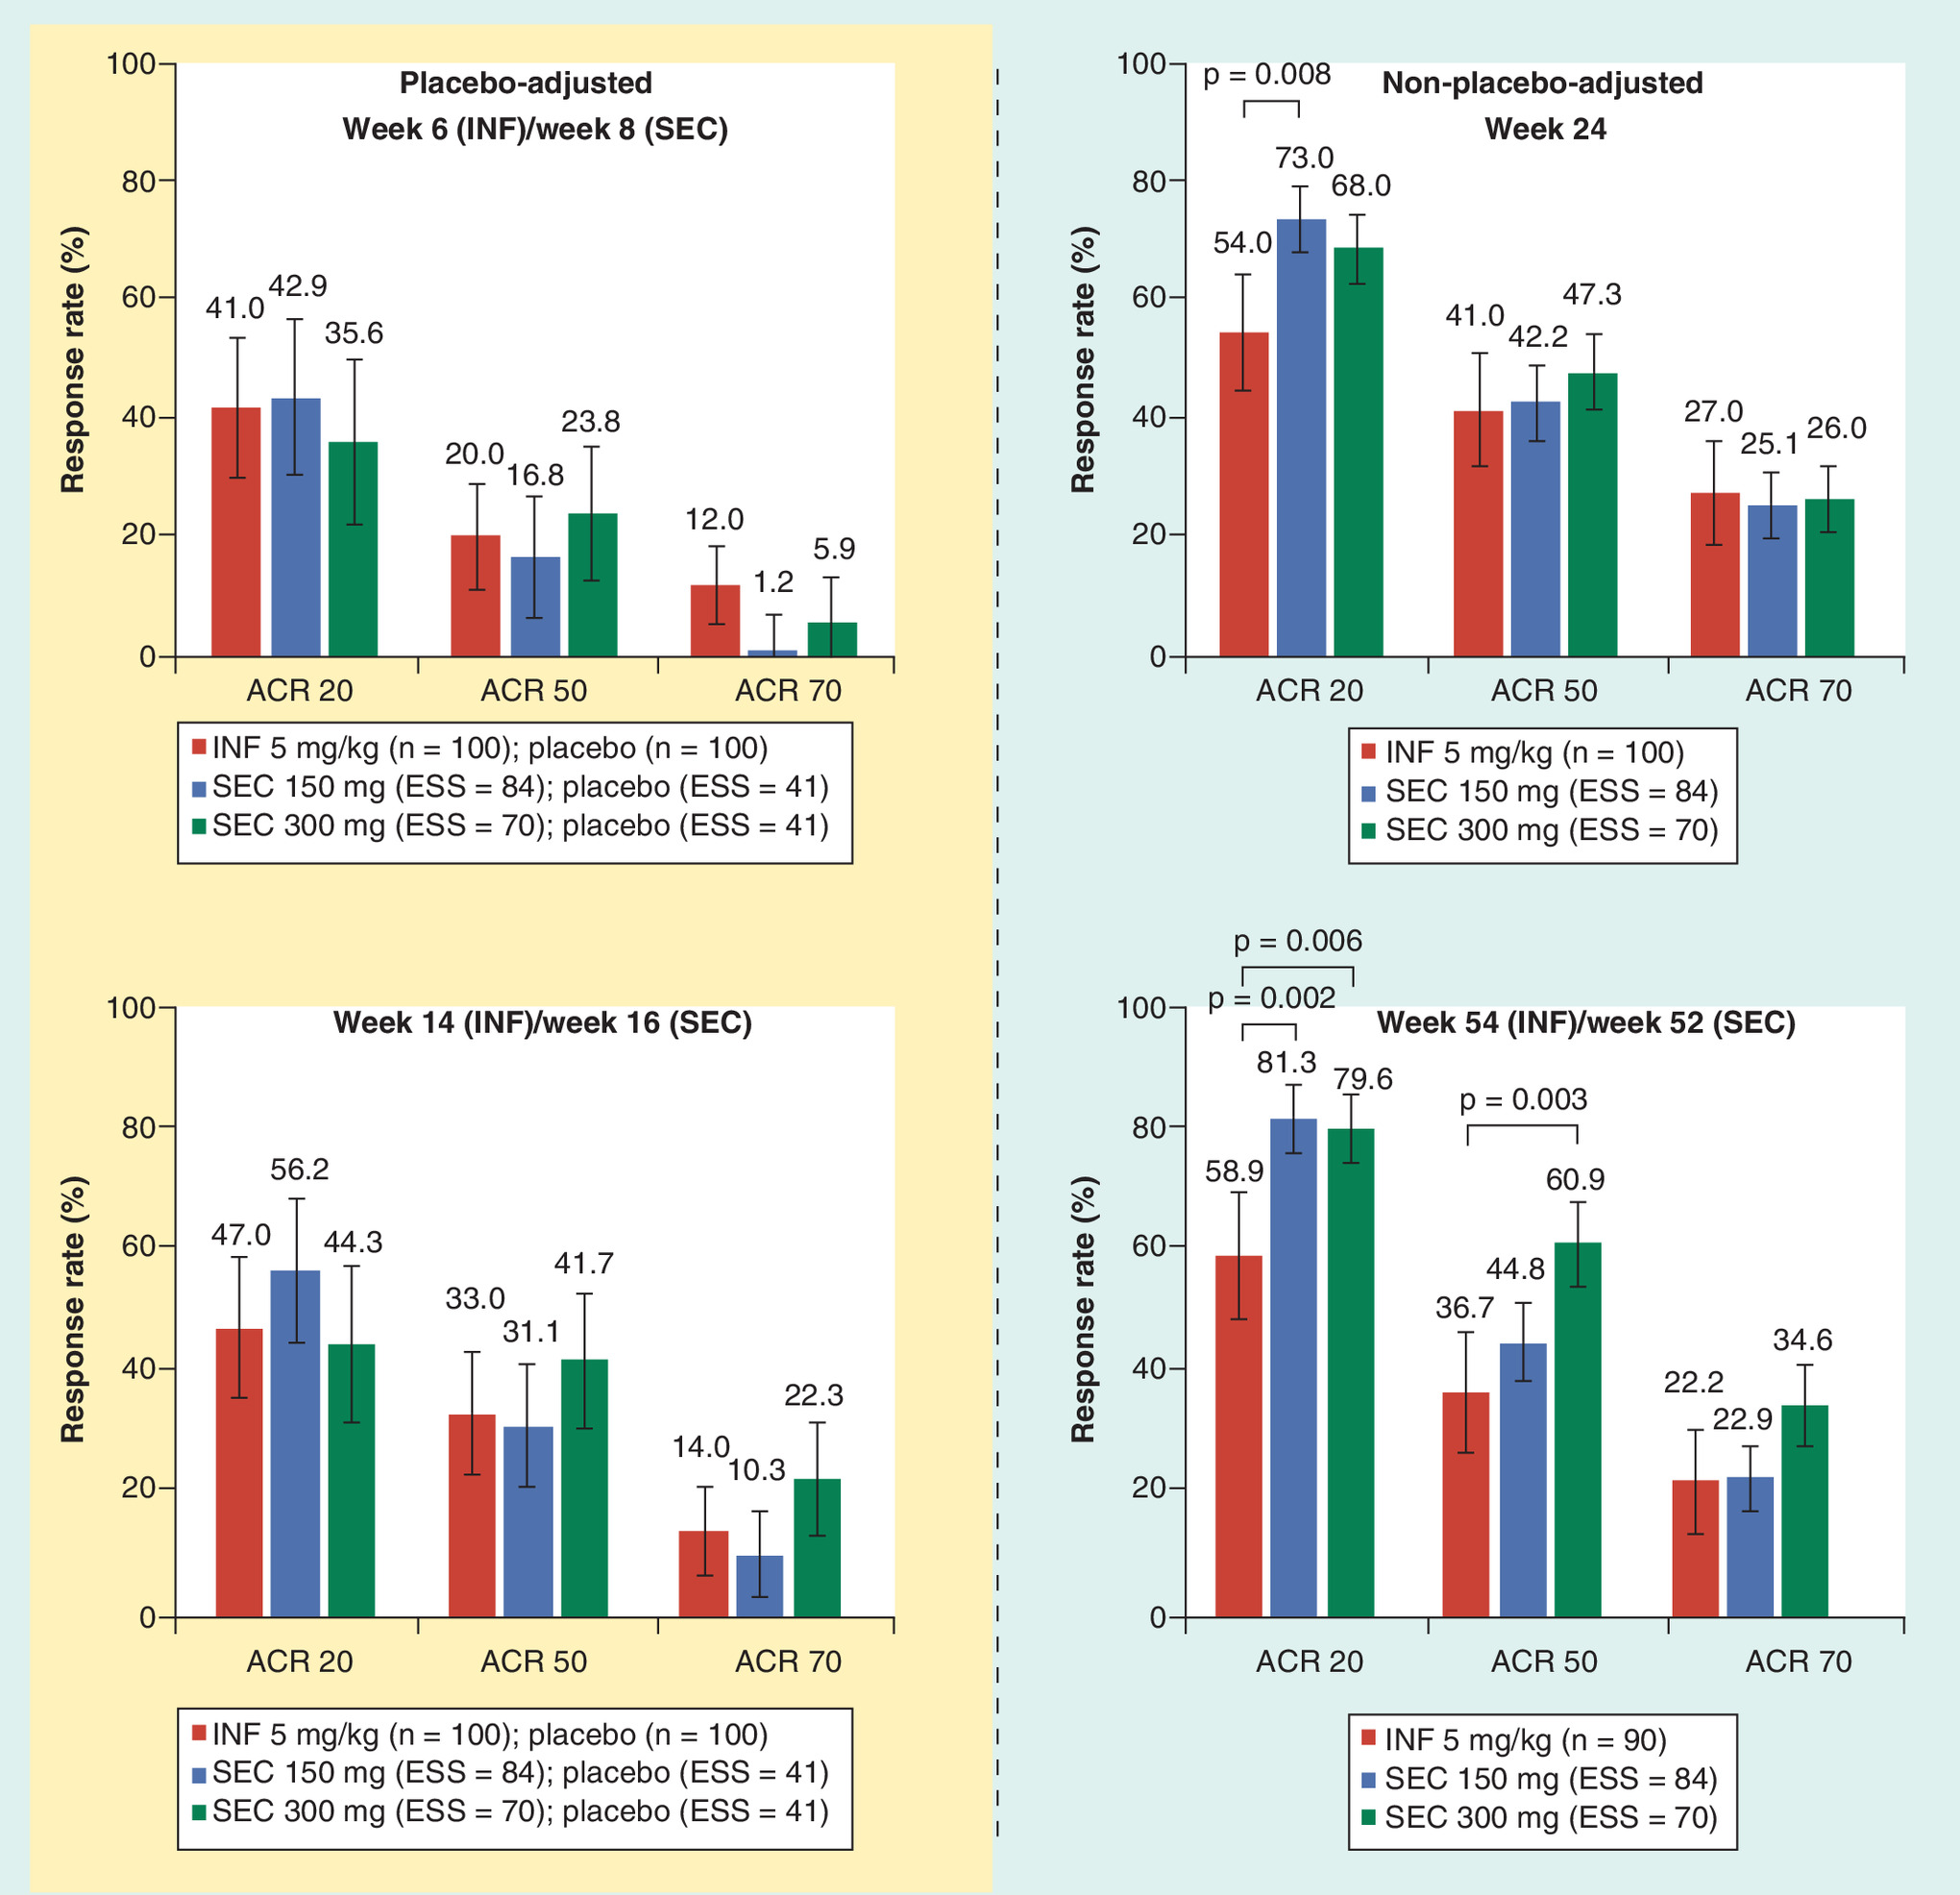
Figure 3. ACR 20, ACR 50 and ACR 70 response rates for secukinumab 150 mg, secukinumab 300 mg and infliximab 5 mg/kg (principal analysis).
For non-placebo-adjusted comparisons, ACR 20, ACR 50 and ACR 70 responses are the absolute mean response rate (IMPACT 2) and the predicted mean response rate (FUTURE 2/3). For placebo-adjusted comparisons, the numbers represent differences in response rates between active treatment and placebo. Error bars show 95% CI. Week 52 FUTURE 2/3 secukinumab intent-to-treat population (observed values) was compared with week 54 IMPACT 2 infliximab intent-to-treat population (missing equals failure/missing values excluded). p-values are presented at the 5% significance threshold, and are derived from odds ratio values.
ACR: American College of Rheumatology; ACR 20/50/70: At least a 20, 50 or 70% improvement according to the ACR response criteria; ESS: Effective sample size; INF: Infliximab; SEC: Secukinumab.
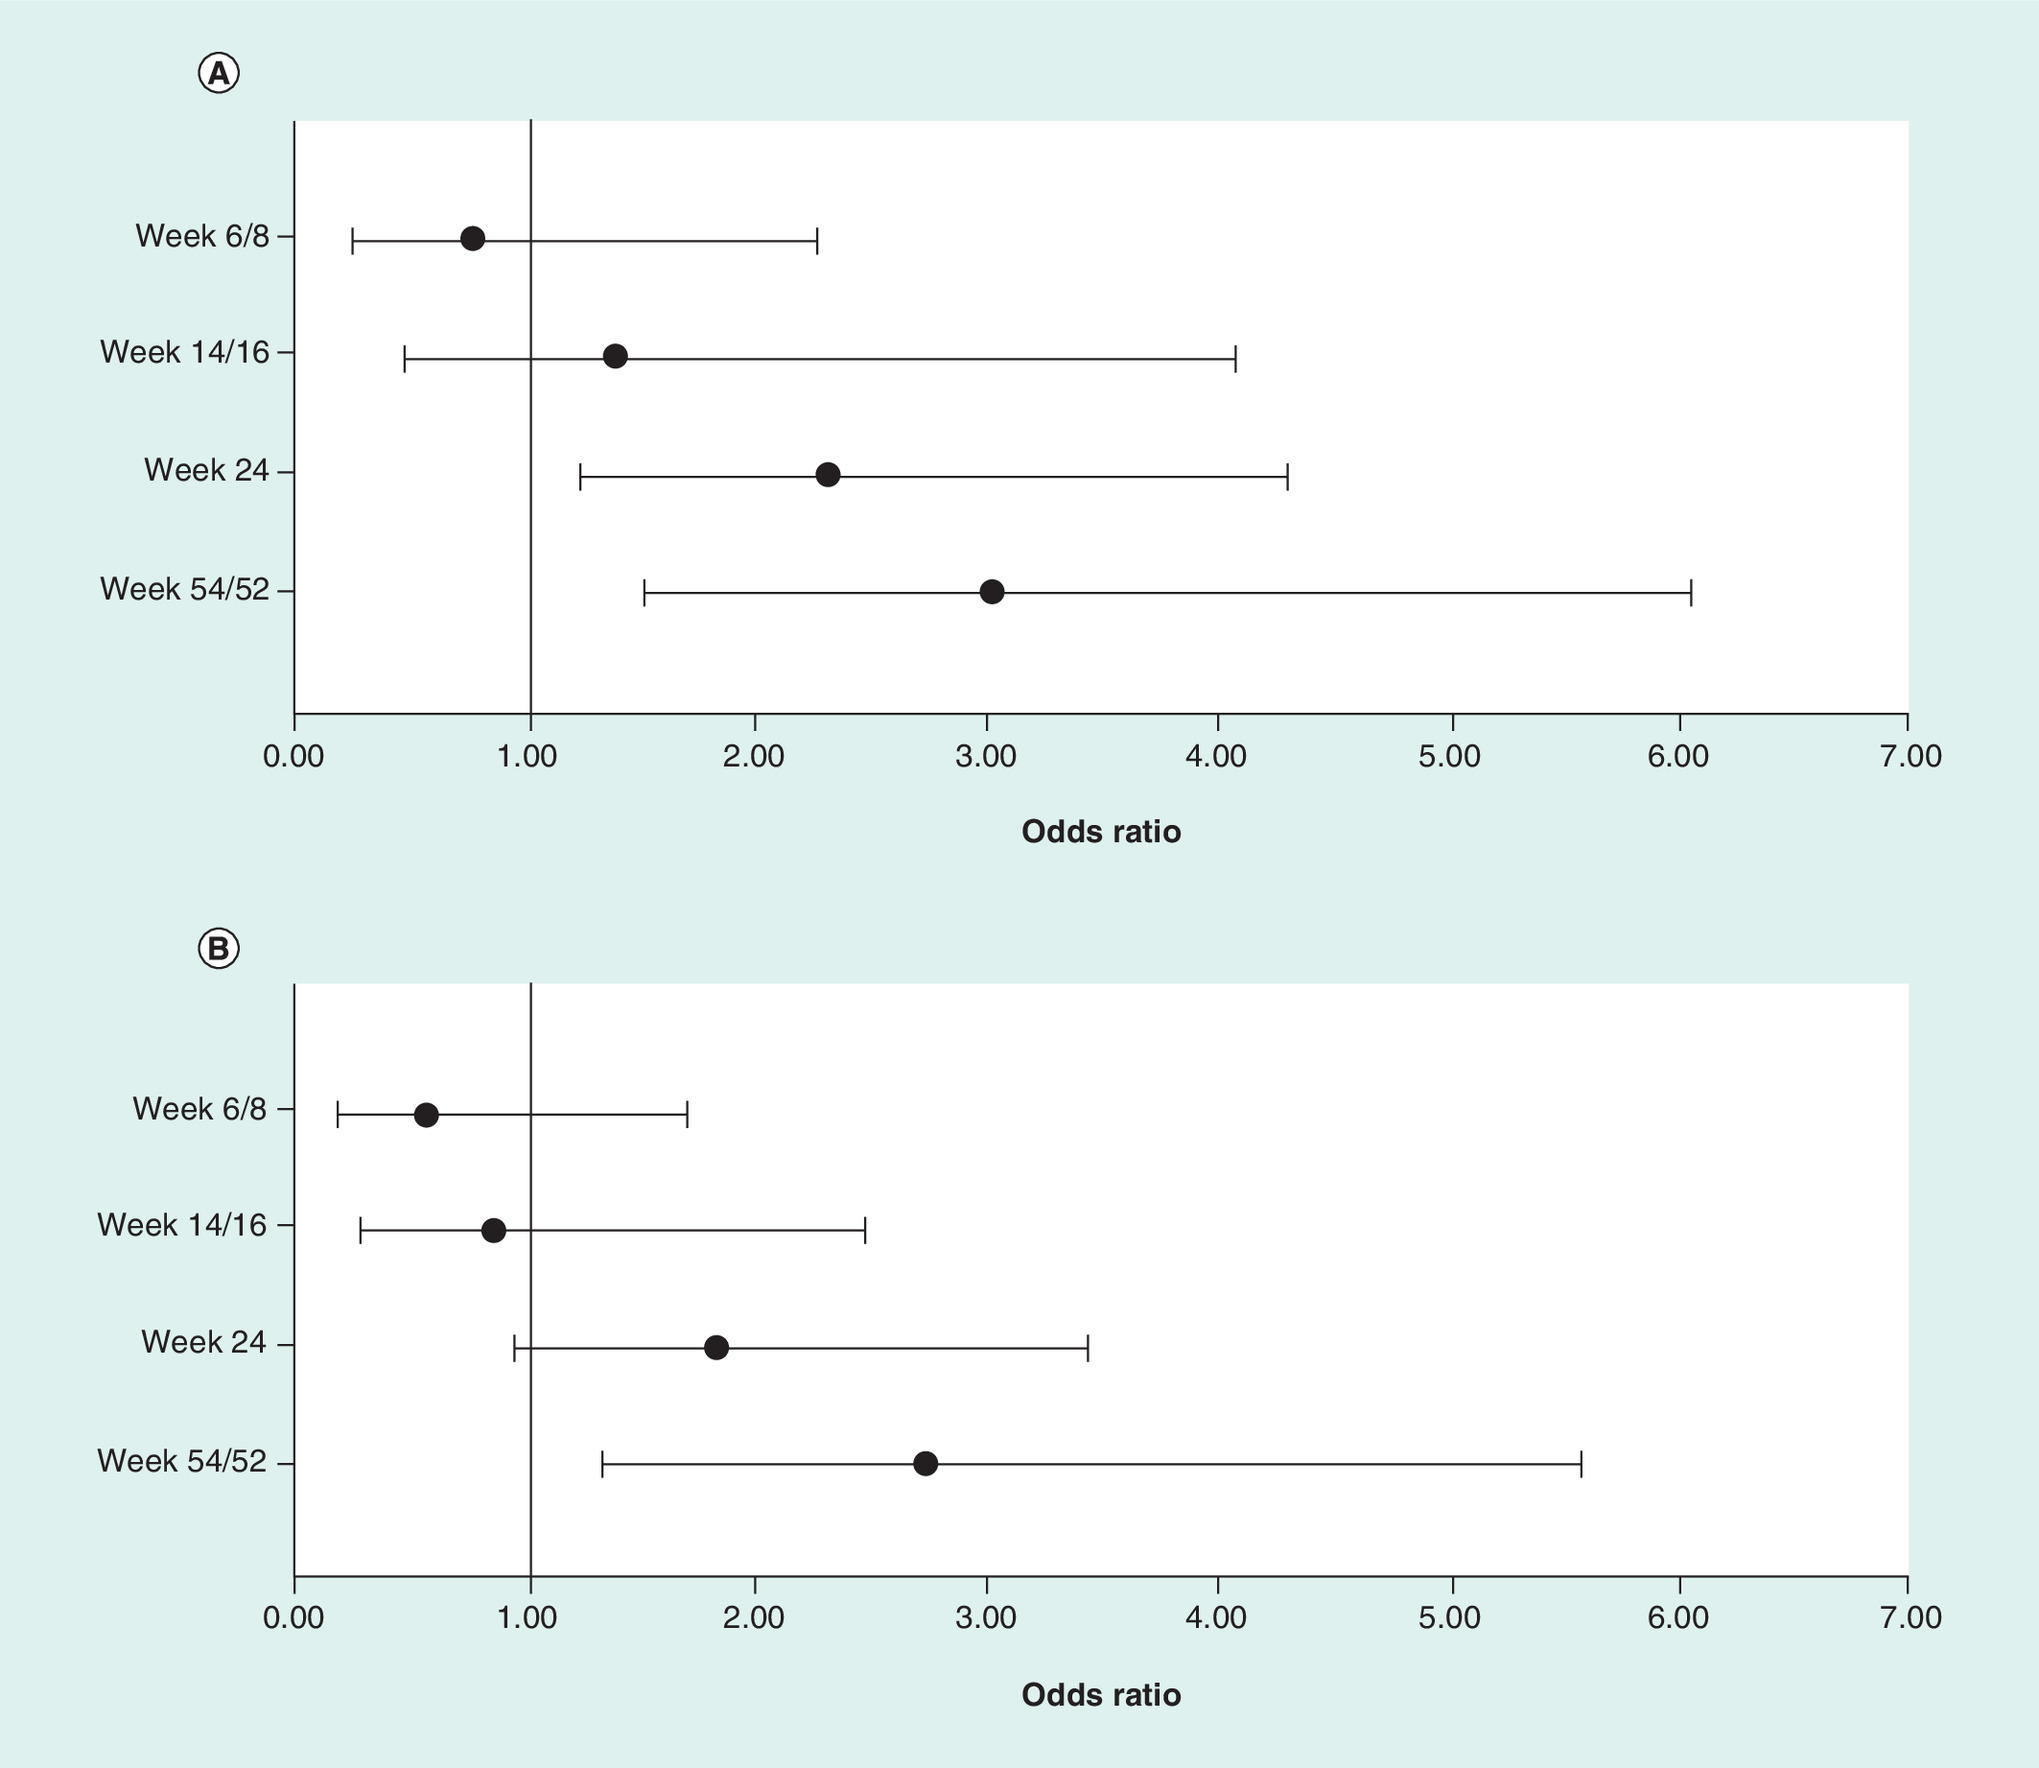
Figure 4. American College of Rheumatology 20 odds ratios for secukinumab 150 mg and secukinumab 300 mg versus infliximab (principal analysis) for all time points.
(A) Secukinumab 150 mg versus infliximab; (B) secukinumab 300 mg versus infliximab.
Error bars show 95% CI. Week 52 FUTURE 2/3 secukinumab intent-to-treat population (observed values) was compared with week 54 IMPACT 2 infliximab intent-to-treat population (missing equals failure/missing values excluded). In FUTURE 2/3, patients receiving placebo who did not achieve ≥20% improvement compared with baseline in TJC or SJC by week 16 were rerandomized 1:1 to secukinumab 150 or 300 mg; those who did achieve this response were rerandomized 1:1 at week 24. In IMPACT 2, patients receiving placebo who had <10% improvement from baseline in both SJC and TJC at week 16 received infliximab 5 mg/kg. Patients randomized to infliximab 5 mg/kg who had <20% improvement from baseline in the combined number of SJC and TJC had their infliximab dose increased to 10 mg/kg at weeks 38 and 46; 15 patients received an uptitration in their dose of infliximab from 5 to 10 mg/kg.
ACR: American College of Rheumatology; ACR 20: At least a 20% improvement according to the ACR response criteria; SJC: Swollen joint count; TJC: Tender joint count.
| SEC 150 mg vs INF | SEC 300 mg vs INF | ||||
|---|---|---|---|---|---|
| ACR 20 | ACR 50 | ACR 70 | ACR 20 | ACR 50 | ACR 70 |
| Week 6 (IMPACT 2)/week 8 (FUTURE 2/3), placebo-adjusted data | |||||
| 0.77 (0.26–2.27) p = 0.630 | 0.30 (0.05–1.72) p = 0.177 | NE‡ | 0.56 (0.19–1.70) p = 0.310 | 0.43 (0.07–2.45) p = 0.340 | NE‡ |
| Week 14 (IMPACT 2)/week 16 (FUTURE 2/3), placebo-adjusted data | |||||
| 1.40 (0.48–4.07) p = 0.539 | 0.77 (0.16–3.83) p = 0.754 | 0.37 (0.03–4.67) p = 0.441 | 0.84 (0.29–2.47) p = 0.749 | 1.21 (0.24–6.03) p = 0.816 | 0.83 (0.07–10.45) p = 0.888 |
| Week 24, non-placebo-adjusted data | |||||
| 2.31 (1.24–4.29) p = 0.008 § | 1.05 (0.58–1.90) p = 0.865 | 0.91 (0.47–1.76) p = 0.769 | 1.81 (0.96–3.43) p = 0.068 | 1.29 (0.70–2.39) p = 0.412 | 0.95 (0.48–1.90) p = 0.888 |
| Week 54 (IMPACT 2)/week 52 (FUTURE 2/3)†, non-placebo-adjusted data | |||||
| 3.03 (1.52–6.04) p = 0.002 § | 1.40 (0.77–2.58) p = 0.273 | 1.04 (0.51–2.12) p = 0.914 | 2.72 (1.33–5.57) p = 0.006 § | 2.69 (1.41–5.11) p = 0.003 § | 1.86 (0.92–3.73) p = 0.083 |
Data are shown as odds ratio (95% CI). Two-sided p-values (bold text when p < 0.05) were derived from odds ratios values using the Z-statistic. Italic text indicates increasing evidence (0.1 > p > 0.001) using an updated statistical interpretation. Note that no p-values indicating strong evidence (p ≤ 0.001) were observed.
†Observed data at week 54/week 52.
‡Odds ratios cannot be calculated because the proportion of ACR 70 responders in the IMPACT 2 placebo arm is 0.
§Evidence of higher outcomes for SEC than for INF.
ACR: American College of Rheumatology; ACR 20/50/70: At least a 20, 50 or 70% improvement according to the ACR response criteria; INF: Infliximab; NE: Not estimable; SEC: Secukinumab.
As shown in Figures 3 and 4 and Table 2, there was no evidence of differences in ACR 20/50/70 responses between secukinumab 300 mg and infliximab at weeks 6/8 and 14/16 (both placebo-adjusted) and at week 24 (non-placebo-adjusted). At week 54/52, non-placebo-adjusted ACR 20/50 responses were higher with secukinumab 300 mg than infliximab (OR [95% CI]: 2.72 [1.33–5.57]; p = 0.006, and 2.69 [1.41–5.11]; p = 0.003, respectively). These observations were unchanged when alternative imputation methods were applied (Supplementary Table 4).
Table 2 shows ORs and p-values for all ACR comparisons, including interpretations using the p-value range between 0.1 and 0.001.
Changes in SF-36 PCS & MCS scores
Table 3 shows mean CFBs in SF-36 PCS and MCS scores with secukinumab 150 and 300 mg compared with infliximab. There was evidence of greater improvement with infliximab (mean CFB [95% CI]: 8.0 [5.5–10.5]) than secukinumab 150 mg (mean CFB [95% CI]: 4.7 [3.3–6.0]; p = 0.019) and secukinumab 300 mg (mean CFB [95% CI]: 4.3 [3.0–5.6]; p = 0.009) at week 14/16 in terms of placebo-controlled changes in SF-36 PCS scores, although these were not maintained at weeks 24 and 54/52. These results were not supported by sensitivity analysis (below) and should therefore be considered with caution. There were no differences in MCS scores at any time points in the principal analysis. These observations were consistent when data were interpreted using the p-value range between 0.1 and 0.001 (Table 3).
| SF-36 score | IMPACT 2 INF 5 mg/kg | FUTURE 2/3 SEC 150 mg | FUTURE 2/3 SEC 300 mg | ||||||
|---|---|---|---|---|---|---|---|---|---|
| Placebo-adjusted | Non-placebo-adjusted | Placebo-adjusted | Non-placebo-adjusted | Placebo-adjusted | Non-placebo-adjusted | ||||
| Week 14/16 (INF, n = 100; PBO, n = 100) | Week 24 (n = 100) | Week 54/52† (n = 84) | Week 14/16 (SEC, ESS = 84; PBO, ESS = 41) | Week 24 (SEC, ESS = 84) | Week 54/52† (SEC, ESS = 84) | Week 14/16 (SEC, ESS = 70; PBO, ESS = 41) | Week 24 (SEC, ESS = 70) | Week 54/52† (SEC, ESS = 70) | |
| SF-36 PCS score, mean change from baseline (95% CI) | 8.0 (5.5–10.5) | 7.7 (5.8–9.6) | 8.8 (6.5–11.1) | 4.7 (3.3–6.0) p = 0.019 ‡ | 7.3 (6.4–8.2) p = 0.724 | 7.8 (6.7–8.8) p = 0.413 | 4.3 (3.0–5.6) p = 0.009 ‡ | 6.7 (5.7–7.7) p = 0.380 | 7.8 (6.8–8.8) p = 0.419 |
| SF-36 MCS score, mean change from baseline (95% CI) | 5.0 (2.2–7.8) | 3.9 (1.6–6.2) | 3.7 (1.7–5.7) | 5.7 (4.0–7.4) p = 0.691 | 6.4 (5.1–7.7) p = 0.066 | 5.7 (4.4–6.9) p = 0.103 | 3.2 (1.3–5.2) p = 0.315 | 4.0 (2.5–5.5) p = 0.965 | 4.8 (3.4–6.3) p = 0.375 |
Bold text indicates statistically significant differences (p < 0.05) in mean changes from baseline between SEC and INF. Italic text indicates increasing evidence (0.1 > p > 0.001) using an updated statistical interpretation. Note that no p-values indicating strong evidence (p ≤ 0.001) were observed.
†LOCF imputation used.
‡Evidence of higher outcomes for INF than for SEC.
ESS: Effective sample size; INF: Infliximab; LOCF: Last observation carried forward; MCS: Mental component summary; PBO: Placebo; PCS: Physical component summary; SEC: Secukinumab; SF-36: 36-item Short-Form health survey.
Sensitivity analysis
Matching baseline characteristics
The sensitivity analysis matched data using the same parameters as the principal analysis, with addition of PsA disease duration and baseline SJC and CRP levels, as shown in Supplementary Table 3. The ESSs for FUTURE 2/3 after matching were 49 for secukinumab 150 mg, 32 for secukinumab 300 mg and 27 for placebo.
ACR responses
The results of the sensitivity analysis were consistent with those of the principal analysis (Supplementary Figure 2 and Supplementary Table 5). ACR 20 responses were higher with secukinumab 150 mg than infliximab at weeks 24 and 54/52 during the non-placebo-adjusted period (OR [95% CI]: 3.03 [1.39–6.63]; p = 0.005, and 3.87 [1.60–9.36]; p = 0.003, respectively). ACR 20 and ACR 50 responses were higher with secukinumab 300 mg than infliximab at week 54/52 (OR [95% CI]: 2.74 [1.05–7.15]; p = 0.039, and 3.04 [1.32–7.04]; p = 0.009, respectively). These observations were consistent when data were interpreted using the p-value range between 0.1 and 0.001 (Supplementary Table 5).
Changes in SF-36 PCS & MCS scores
The results of this analysis are shown in Supplementary Table 6. In the sensitivity analysis, there was no difference in SF-36 PCS scores between infliximab and secukinumab at week 14/16 (placebo-adjusted) and subsequent time points during the non-placebo-adjusted period.
At week 24 (non-placebo-adjusted), there was evidence of improvements in non-placebo-controlled SF-36 MCS scores with secukinumab 150 mg compared with infliximab (mean CFB [95% CI]: 6.8 [1.6–6.2] vs 3.9 [5.6–8.0]; p = 0.032). No differences between treatments were evident at weeks 14/16 (placebo-adjusted) and 54/52 (non-placebo-adjusted). These observations were consistent when data were interpreted using the p-value range between 0.1 and 0.001 (Supplementary Table 6).
Discussion
This study uses MAIC to assess the comparative effectiveness of the IL-17A inhibitor secukinumab (at two clinically relevant subcutaneously administered dosages: 150 mg and 300 mg) and the TNFi infliximab, intravenously administered, in TNFi-naive patients with active PsA [14,32]. Although the RCTs from which the data were taken were conducted at different times, the key features of the study designs were very similar. By allowing matching of populations according to baseline characteristics, the MAIC methodology was able to adjust for the differences in patient populations between the earlier study on infliximab and the later studies on secukinumab.
In our MAIC, no differences in ACR responses were observed between secukinumab and infliximab during the first 14 weeks. Advantages in favor of secukinumab were seen after 24 weeks of treatment, in terms of ACR 20/50 responses, when compared with infliximab. This is in agreement with a recent MAIC analysis suggesting that patients with PsA receiving secukinumab are more likely to achieve higher mid- to long-term ACR responses than those treated with the TNFi adalimumab [17].
The results of our principal analysis are largely supported by the sensitivity analyses, which used three additional matching variables (duration of PsA, SJC and CRP levels) for increased matching stringency. However, we acknowledge that findings not replicated in both analyses, such as SF-36 PCS, should be treated with caution when drawing conclusions, because it is possible these do not reflect true differences in treatment effects.
In this study, we include binary (ACR) and continuous (SF-36 scores) outcomes, in line with OMERACT [29] and GRAPPA guidance [30]. Our analyses comply with recent recommendations on the application of MAIC methodology [14,15], employing linear predictor scales such as ORs instead of comparing natural outcomes such as ACR 20 responses.
Health-related quality of life data are crucial for understanding how the clinical success of any therapy impacts patients’ well-being and their ability to function in daily life. Evidence of a greater improvement in SF-36 PCS scores with infliximab than secukinumab 150 and 300 mg at week 14/16 was not observed at later time points, or replicated in the sensitivity analysis. It is worth noting that patients in the IMPACT 2 study had substantially lower SF-36 PCS scores at baseline than patients in FUTURE 2 or FUTURE 3, which may increase the chances that larger post-baseline changes would be reported.
The MAIC methodology has limitations. Although observed patient variables at baseline can be matched, it is not possible to control for unobserved variables or variables reported in only one study. Results are also most relevant to patients similar to the matched IMPACT 2 trial population, namely TNFi-naive. Furthermore placebo adjustment was feasible only until week 16 owing to differences in study designs, and week 24 was the only common time point at which outcomes were reported in both RCTs. Although non-placebo-adjusted comparisons are a legitimate means of comparing treatments using long-term data, adjustments cannot be made for unobserved differences in trial populations or study design. A key difference in study design that could not be matched for both placebo and active treatment arms is route of administration, which may have led to differences in placebo responses. The reduced ESS for secukinumab must be acknowledged when interpreting our findings, although we have made an effort to counteract this by using pooled IPD from FUTURE 2 and FUTURE 3, which resulted in an acceptable sample size.
Conclusion
Our findings indicate that TNFi-naive patients with PsA have a similar probability of achieving ACR responses with subcutaneous secukinumab or intravenous infliximab in the short term. In the same target population, our findings indicate that there is a slightly higher probability of mid- to long-term ACR responses in those receiving secukinumab rather than infliximab. This study should be treated as an interim comparison in the absence of a confirmatory H2H RCT, and does not replace RCTs powered for a direct comparison between treatments. In future, such discussions can inform the design of potential H2H RCTs between PsA treatments.
In the absence of a head-to-head randomized controlled trial, matching-adjusted indirect comparison was used to compare subcutaneous secukinumab with intravenous infliximab in biologic-naive patients with psoriatic arthritis (PsA).
Individual patient data from the FUTURE 2 and FUTURE 3 trials were matched to data from the IMPACT 2 trial using key patient demographic and clinical characteristics. Logistic regression determined matching weights for these variables.
The relevant population in this comparison was TNFi-naive patients with characteristics similar to patients in the IMPACT 2 trial.
Recalculated secukinumab outcomes were compared with infliximab outcomes at weeks 6/8 and 14/16 (both placebo-adjusted) and at weeks 24 and 54/52 (both non-placebo-adjusted).
In terms of American College of Rheumatology (ACR) responses, there were no differences between secukinumab and infliximab in the short term (weeks 6/8 and 14/16).
At weeks 24 and 54/52, ACR 20 responses were higher with secukinumab 150 mg than infliximab.
At weeks 54/52, ACR 20/50 responses were higher with secukinumab 300 mg than infliximab.
TNFi-naive patients with PsA have a similar probability of achieving ACR responses with subcutaneous secukinumab or intravenous infliximab in the short term.
In the mid to long term, patients receiving secukinumab were more likely to achieve ACR 20/50 responses than those receiving infliximab.
Future perspective
Head-to-head trials in PsA are being conducted to provide direct comparisons of treatments. Before these RCT data are available, indirect treatment comparisons can provide interim data and inform trial design.
Supplementary data
To view the supplementary data that accompany this paper please visit the journal website at: www.futuremedicine.com/doi/full/10.2217/cer-2018-0141
Author contributions
All named authors contributed to the writing of the manuscript, approved this version for publication and meet the International Committee of Medical Journal Editors (ICMJE) criteria for authorship for this article. V Strand, IB McInnes, P Mease, P Nash, H Thom, KK Gandhi, SM Jugl and E Choy designed the study, analyzed and interpreted the data, and decided on manuscript content and structure. H Thom advised on and reviewed the statistical methodology. L Pricop and KK Gandhi advised on the design, data content and interpretation. C Kalyvas and M Hunger performed the MAIC analysis and advised on methodology. SM Jugl wrote the manuscript with editorial support from Christian Eichinger, Alistair Ray and Martin Dalziel from Oxford PharmaGenesis, Oxford, UK.
Financial & competing interests disclosure
V Strand has received consultancy fees from AbbVie, Amgen, AstraZeneca, Biogen Idec, Boehringer Ingelheim, Celltrion, Crescendo, Genentech/Roche, GSK, Janssen, Eli Lilly, Merck, Novartis, Pfizer, Regeneron, Samsung, Sandoz, Sanofi and UCB. IB McInnes has received consultancy fees from AbbVie, BMS, Celgene, Janssen, Novartis, Pfizer and UCB. P Mease has received research grants from AbbVie, Amgen, BMS, Lilly, Novartis, Pfizer and UCB; has received consultancy fees from AbbVie, Amgen, BMS, Corrona, Eli Lilly, Galapagos, Janssen, Merck, Novartis, Pfizer, Sun and UCB; and has been a speaker for AbbVie, Amgen, Celgene, Genentech, Janssen, Novartis, Pfizer and UCB. P Nash has received funding for research and clinical trials, and honoraria for lectures and advice from for AbbVie, BMS, Celgene, Janssen, Lilly, Novartis, Pfizer, Roche, Sanofi and UCB. H Thom has received consultancy fees from Eli Lilly, F Hoffman-La Roche, Novartis Pharma AG and Pfizer. M Hunger is a full-time employee of Mapi, an ICON, plc company. C Kalyvas was a full-time employee of Mapi, an ICON plc company, at the time of this study. The Mapi Group received funding from Novartis Pharma AG for this study. KK Gandhi, L Pricop and SM Jugl are full-time Novartis employees and own stock. E Choy has received research grants from Bio-Cancer, Novartis, NovImmune, Pfizer, Roche and UCB; and has received consultancy fees from AbbVie, BMS, Celgene, Chugai Pharma, Eli Lilly, Janssen, Novartis, NovImmune, ObsEva, Pfizer, Regeneron, Roche, R-Pharm, Sanofi, SynAct Pharma and Tonix.
The MAIC and associated report were completed by Mapi, an ICON, plc company, and were funded by Novartis Pharma AG. The FUTURE 2 and FUTURE 3 trials were funded by Novartis Pharma AG and the IMPACT trial was funded by Centocor, Inc., in Malvern, PA, USA, and Schering-Plough in Kenilworth, NJ, USA.
The authors have no other relevant affiliations or financial involvement with any organization or entity with a financial interest in or financial conflict with the subject matter or materials discussed in the manuscript apart from those disclosed.
Editorial support was provided by Oxford PharmaGenesis, Oxford, UK, and was funded by Novartis Pharma AG.
Ethical conduct of research
This study was of noninterventional nature and did not include primary data collection (i.e., was based on published secondary data only). Therefore, ethic committee or institutional review board approval was not required. Data used were taken from published randomized controlled trials, which were conducted according to the principles of the Declaration of Helsinki and with informed consent from participants.
The datasets analyzed in the current study are available from the corresponding author on reasonable request.
Open access
This work is licensed under the Attribution-NonCommercial-NoDerivatives 4.0 Unported License. To view a copy of this license, visit http://creativecommons.org/licenses/by-nc-nd/4.0/
Supplementary Material
File (suppl_file.docx)
- Download
- 926.73 KB
References
Papers of special note have been highlighted as: • of interest; •• of considerable interest
1.
Gossec L, Smolen JS, Ramiro S et al. European League Against Rheumatism (EULAR) recommendations for the management of psoriatic arthritis with pharmacological therapies: 2015 update. Ann. Rheum. Dis. 75(3), 499–510 (2016).
2.
Coates LC, Kavanaugh A, Mease PJ et al. Group for research and assessment of psoriasis and psoriatic arthritis 2015 treatment recommendations for psoriatic arthritis. Arthritis Rheumatol. 68(5), 1060–1071 (2016).
3.
Food and Drug Administration (FDA). TALTZ (ixekizumab) injection, for subcutaneous use. Highlights of prescribing information (2016). www.accessdata.fda.gov/drugsatfda_docs/label/2017/125521s004lbl.pdf.
4.
European Medicines Agency (EMA). Taltz. EPAR Product Information (2017). www.ema.europa.eu/ema/index.jsp?curl=pages/medicines/human/medicines/003943/smops/Positive/human_smop_001239.jsp&mid=WC0b01ac058001d127.
5.
Food and Drug Administration (FDA). COSENTYX® (secukinumab) injection, for subcutaneous use. Highlights of prescribing information (2015). www.accessdata.fda.gov/drugsatfda_docs/label/2016/125504s001s002lbl.pdf.
6.
European Medicines Agency (EMA). Cosentyx. EPAR summary of product characteristics. (2018). www.ema.europa.eu/docs/en_GB/document_library/EPAR_-_Product_Information/human/003729/WC500183129.pdf.
7.
Bristol-Myers Squibb. Bristol-Myers Squibb's Orencia (abatacept) receives FDA approval for treatment of active psoriatic arthritis (PsA) in adults (2017). www.news.bms.com/press-release/rd-news/bristol-myers-squibbs-orencia-abatacept-receives-fda-approval-treatment-active.
8.
European Medicines Agency (EMA). Orencia. EPAR Summary for the public (2017). www.ema.europa.eu/docs/en_GB/document_library/EPAR_-_Summary_for_the_public/human/000701/WC500048936.pdf.
9.
McInnes IB, Mease PJ, Kirkham B et al. Secukinumab, a human anti-interleukin-17A monoclonal antibody, in patients with psoriatic arthritis (FUTURE 2): a randomised, double-blind, placebo-controlled, phase 3 trial. Lancet 386(9999), 1137–1146 (2015).
•• Provides primary data for this matching-adjusted indirect comparison (MAIC).
10.
Nash P, Mease PJ, McInnes IB et al. Efficacy and safety of secukinumab administration by autoinjector in patients with psoriatic arthritis: results from a randomized, placebo-controlled trial (FUTURE 3). Arthritis Res. Ther. 20(1), 47 (2018).
•• Provides primary data for this MAIC.
11.
Mease P, van der Heijde D, Landewe R et al. Secukinumab improves active psoriatic arthritis symptoms and inhibits radiographic progression: primary results from the randomized, double-blind, phase III FUTURE 5 study. Ann. Rheum. Dis. 77(6), 890–897 (2018).
12.
Deodhar A. Mirror, mirror, on the wall, which is the most effective biologic of all? J. Rheumatol. 45(4), 449–450 (2018).
13.
Dias S, Sutton AJ, Ades AE, Welton NJ. Evidence synthesis for decision making 2: a generalized linear modeling framework for pairwise and network meta-analysis of randomized controlled trials. Med. Decis. Making 33(5), 607–617 (2013).
14.
Phillippo DM, Ades AE, Dias S, Palmer S, Abrams KR, Welton NJ. NICE DSU Technical Support Document 18: Methods for population-adjusted indirect comparisons in submission to NICE (2016). www.nicedsu.org.uk.
• Best practice guidance for MAIC.
15.
Phillippo DM, Ades AE, Dias S, Palmer S, Abrams KR, Welton NJ. Methods for population-adjusted indirect comparisons in health technology appraisal. Med. Decis. Making 38(2), 200–211 (2017).
• Best practice guidance for MAIC.
16.
Kirson NY, Rao S, Birnbaum HG, Kantor E, Wei RS, Cifaldi M. Matching-adjusted indirect comparison of adalimumab vs etanercept and infliximab for the treatment of psoriatic arthritis. J. Med. Econ. 16(4), 479–489 (2013).
17.
Nash P, McInnes IB, Mease PJ et al. Secukinumab for the treatment of psoriatic arthritis: comparative effectiveness versus adalimumab using a matching-adjusted indirect comparison. Arthritis Rheumatol. 68(Suppl. 10), 1738 (2016).
18.
Strand V, Betts KA, Mittal M, Song J, Skup M, Joshi A. Comparative effectiveness of adalimumab versus secukinumab for the treatment of psoriatic arthritis: a matching-adjusted indirect comparison. Rheumatol. Ther. 4(2), 349–362 (2017).
19.
Antoni C, Krueger GG, de Vlam K et al. Infliximab improves signs and symptoms of psoriatic arthritis: results of the IMPACT 2 trial. Ann. Rheum. Dis. 64(8), 1150–1157 (2005).
•• Provides primary data for this MAIC.
20.
Nash P, McInnes IB, Mease PJ et al. Secukinumab versus adalimumab for psoriatic arthritis: comparative effectiveness up to 48 weeks using a Matching-adjusted indirect comparison. Rheumatol. Ther. 5(1), 99–122 (2018).
21.
Belger M, Brnabic A, Kadziola Z, Petto H, Faries D. Alternative weighting approaches for matching adjusted indirect comparisons (MAIC). Value Health 18(3), A31–A32 (2015).
22.
Costa L, Perricone C, Chimenti MS et al. Switching between biological treatments in psoriatic arthritis: a review of the evidence. Drugs R D 17(4), 509–522 (2017).
23.
Fagerli KM, Lie E, van der Heijde D et al. Switching between TNF inhibitors in psoriatic arthritis: data from the NOR-DMARD study. Ann. Rheum. Dis. 72(11), 1840–1844 (2013).
24.
Reddy SM, Crean S, Martin AL, Burns MD, Palmer JB. Real-world effectiveness of anti-TNF switching in psoriatic arthritis: a systematic review of the literature. Clin. Rheumatol. 35(12), 2955–2966 (2016).
25.
Kristensen LE, Lie E, Jacobsson LT et al. Effectiveness and feasibility associated with switching to a second or third TNF inhibitor in patients with psoriatic arthritis: a cohort study from southern Sweden. J. Rheumatol. 43(1), 81–87 (2016).
26.
Signorovitch JE, Wu EQ, Yu AP et al. Comparative effectiveness without head-to-head trials: a method for matching-adjusted indirect comparisons applied to psoriasis treatment with adalimumab or etanercept. Pharmacoeconomics 28(10), 935–945 (2010).
27.
Signorovitch JE, Sikirica V, Erder MH et al. Matching-adjusted indirect comparisons: a new tool for timely comparative effectiveness research. Value Health 15(6), 940–947 (2012).
• Discusses methodology and rationale for MAIC.
28.
Signorovitch J, Swallow E, Kantor E et al. Everolimus and sunitinib for advanced pancreatic neuroendocrine tumors: a matching-adjusted indirect comparison. Exp. Hematol. Oncol. 2(1), 32 (2013).
29.
Tillett W, Eder L, Goel N et al. Enhanced patient involvement and the need to revise the core set – report from the psoriatic arthritis working group at OMERACT 2014. J. Rheumatol. 42(11), 2198–2203 (2015).
30.
Orbai AM, Mease PJ, de Wit M et al. Report of the GRAPPA-OMERACT psoriatic arthritis working group from the GRAPPA 2015 annual meeting. J. Rheumatol. 43(5), 965–969 (2016).
31.
Bucher HC, Guyatt GH, Griffith LE, Walter SD. The results of direct and indirect treatment comparisons in meta-analysis of randomized controlled trials. J. Clin. Epidemiol. 50(6), 683–691 (1997).
32.
Veroniki AA, Straus SE, Soobiah C, Elliott MJ, Tricco AC. A scoping review of indirect comparison methods and applications using individual patient data. BMC Med. Res. Methodol. 16(1), 47 (2016).
Information & Authors
Information
Published In
Copyright
© 2019 Vibeke Strand.
History
Received: 7 December 2018
Accepted: 7 February 2019
Published online: 26 February 2019
Keywords:
Topics
Authors
Metrics & Citations
Metrics
Article Usage
Article usage data only available from February 2023. Historical article usage data, showing the number of article downloads, is available upon request.
Citations
How to Cite
Matching-adjusted indirect comparison: secukinumab versus infliximab in biologic-naive patients with psoriatic arthritis. (2019) Journal of Comparative Effectiveness Research. DOI: 10.2217/cer-2018-0141
Export citation
Select the citation format you wish to export for this article or chapter.
Citing Literature
- Philip J. Mease, Richard B. Warren, Peter Nash, Jean-Marie Grouin, Nikos Lyris, Damon Willems, Vanessa Taieb, Jason Eells, Iain B. McInnes, Comparative Effectiveness of Bimekizumab and Risankizumab in Patients with Psoriatic Arthritis at 52 Weeks Assessed Using a Matching-Adjusted Indirect Comparison, Rheumatology and Therapy, 10.1007/s40744-024-00706-w, 11, 5, (1403-1412), (2024).
- Philip J. Mease, Richard B. Warren, Peter Nash, Jean-Marie Grouin, Nikos Lyris, Vanessa Taieb, Jason Eells, Iain B. McInnes, Comparative Effectiveness of Bimekizumab and Ustekinumab in Patients with Psoriatic Arthritis at 52 Weeks Assessed Using a Matching-Adjusted Indirect Comparison, Rheumatology and Therapy, 10.1007/s40744-024-00705-x, 11, 5, (1413-1423), (2024).
- Richard B. Warren, Iain B. McInnes, Peter Nash, Jean-Marie Grouin, Nikos Lyris, Damon Willems, Vanessa Taieb, Jason Eells, Philip J. Mease, Comparative Effectiveness of Bimekizumab and Guselkumab in Patients with Psoriatic Arthritis at 52 Weeks Assessed Using a Matching-Adjusted Indirect Comparison, Rheumatology and Therapy, 10.1007/s40744-024-00659-0, (2024).
- Jixia Lin, Yougang Ren, Different biologics for biological-naïve patients with psoriatic arthritis: a systematic review and network meta-analysis, Frontiers in Pharmacology, 10.3389/fphar.2024.1279525, 15, (2024).
- Philip J. Mease, Richard B. Warren, Peter Nash, Jean-Marie Grouin, Nikos Lyris, Damon Willems, Vanessa Taieb, Jason Eells, Iain B. McInnes, Comparative Effectiveness of Bimekizumab and Secukinumab in Patients with Psoriatic Arthritis at 52 Weeks Using a Matching-Adjusted Indirect Comparison, Rheumatology and Therapy, 10.1007/s40744-024-00652-7, (2024).
- Flavia Sunzini, Arianna D’Antonio, Mauro Fatica, Paola Triggianese, Paola Conigliaro, Elisabetta Greco, Alberto Bergamini, Maria Sole Chimenti, What’s new and what’s next for biological and targeted synthetic treatments in psoriatic arthritis?, Expert Opinion on Biological Therapy, 10.1080/14712598.2022.2152321, 22, 12, (1545-1559), (2022).
- Marjolein S. de Bruin-Weller, Esther Serra-Baldrich, Sebastien Barbarot, Susanne Grond, Christopher Schuster, Helmut Petto, Jean-Philippe Capron, Afaf Raibouaa, Thomas Werfel, Indirect Treatment Comparison of Baricitinib versus Dupilumab in Adults with Moderate-to-Severe Atopic Dermatitis, Dermatology and Therapy, 10.1007/s13555-022-00734-w, 12, 6, (1481-1491), (2022).
- Philip Hampton, Emma Borg, Jes B Hansen, Matthias Augustin, Efficacy of Brodalumab and Guselkumab in Patients with Moderate-to-Severe Plaque Psoriasis Who are Inadequate Responders to Ustekinumab: A Matching Adjusted Indirect Comparison, Psoriasis: Targets and Therapy, 10.2147/PTT.S326121, Volume 11, (123-131), (2021).
- Takuya Izumiyama, Yu Mori, Itsuki Oizumi, Soshi Hamada, Hiroaki Kurishima, Hitoshi Terui, Ryoko Omori-Shimada, Kenshi Yamasaki, Eiji Itoi, Effect of interleukin-17A inhibitor in Japanese patients with psoriatic arthritis compared with tumor necrosis factor-alpha inhibitor, Journal of Orthopaedic Surgery, 10.1177/23094990211012286, 29, 2, (2021).
- Hannah A. Blair, Secukinumab: A Review in Psoriatic Arthritis, Drugs, 10.1007/s40265-021-01476-3, 81, 4, (483-494), (2021).