Development and validation of a Health Policy Model of Type 2 diabetes in Chinese setting
Publication: Journal of Comparative Effectiveness Research
Abstract
Aim: Due to the difference in epidemiology and outcomes between eastern and western populations with Type 2 diabetes mellitus (T2DM), an important challenge is determining how useful the outcomes from diabetes models based on western populations are for eastern patients. Consequently, the principal aim of this study was to develop and validate a Health Policy Model (Chinese Outcomes Model for T2DM [COMT]) for supporting Chinese medical and health economic studies. Methods: The model is created to simulate a series of important complications of T2DM diabetes based on the latest Risk Equations for Complications of Type 2 Diabetes, which was adjusted by adding the adjustment regulator to the linear predictor within the risk equation. The validity of the model was conducted by using a total of 171 validation outcomes from seven studies in eastern populations and ten studies in western populations. The simulation cohorts in the COMT model were generated by copying each validation study’s baseline characteristics. Concordance was tested by assessing the difference between the identity (45°) line and the best-fitting regression of the scatterplots for the predicted versus observed outcomes. Results: The slope coefficients of the best-fitting regression line between the predicted and corresponding observed actual outcomes was 0.9631 and the R2 was 0.8701. There were major differences between western and eastern populations. The slope and R2 of predictions were 0.9473 and 0.9272 in the eastern population and 1.0566 and 0.8863 in the western population, which showed more perfect agreement with the observed values in the eastern population than the western populations. The subset of macro-vascular and micro-vascular outcomes in the eastern population showed an identical tendency (the slope coefficient was close to 1), and mortality outcomes showed a slight tendency toward overestimation (the slope coefficient was close to 0.9208). Some degree of underprediction of macro-vascular and micro-vascular end points and overprediction of mortality end point was found in the western population. Conclusion: The COMT diabetes model simulated the long-term patient outcomes observed in eastern Asian T2DM patients with prediction accuracy. This study supports the COMT as a credible tool for Chinese healthcare decision makers. Further work is necessary to incorporate new local data to improve model validity and credibility.
Due to population growth and aging, the Global Burden of Disease Study showed that all-age disability-adjusted life-years (DALYs) of diabetics in 2016 were 57,233.7 (95% CI: 47,967.9–68,279.3), which increased by 24.4% (95% CI: 22.7–26.2) from 1990 to 2016 [1]. A recent study also showed that PR China has a large burden of diabetics, because one in four people with diabetes worldwide live in PR China, where 11.6% of adults have diabetes and 50.1% have prediabetes [2–4]. The whole Chinese economic burden of diabetes has increased from ¥2.216 billion (CNY) in 1993 to ¥200 billion (CNY) in 2007 [5,6].
To decrease the high disease burden [2–4], efficient prevention and treatment of diabetes and its complications are major tasks for health policy. Mathematical modeling plays a vital role in supporting decision-making for evaluating the long-term health and economic outcome of interventions in the public and private health sectors [7]. The CDC model, the Archimedes model and the Center for Outcomes Research (CORE) diabetes model have been widely used to evaluate the cost–effectiveness of health policy related to diabetes [8,9]. However, these models were all developed based on western populations, whereas subphenotypes and clinical consequences of diabetes are modified in many Asian populations [10]. Due to the high disease burden of Type 2 diabetes in PR China, it is becoming necessary to construct a diabetes Health Policy Model in Chinese population to evaluate the alternative interventions related to diabetes.
We designed a long-term mathematical model for the prevention and treatment of Type 2 diabetes mellitus (T2DM), named the Chinese Outcomes Model for T2DM (COMT), to project health and economic outcomes of the alternative diabetes interventions in the Chinese population. The COMT borrowed some key ideas and features from other well-known models, such as the CDC model [11], the Michigan model [12], the CORE diabetes model [13] and the ECHO-T2DM [14], including the development and progression of main micro- and macro-vascular complications and mortality. The main advantage of COMT is its risks and probabilities of diabetic complications, which were derived from Chinese and east Asian populations.
Model transparency (people can see how the model is built) and validation (how well the model reproduces reality) are critical to success in the development of a diabetes model. Consequently, the objective of this study was to present the architecture, assumptions, features and validations of the COMT model according to the guidelines published by the task forces recommended by the International Society for Pharmacoeconomics and Outcomes Research and the Society for Medical Decision Making [15].
Methods
Overview of the model
COMT is a mathematical model with key micro- and macro-vascular complications and mortality related to T2DM (Figure 1). In this model, the patient will incur the following 13 clinical complications during the simulation: stroke, myocardial infarction (MI), congestive heart failure (CHF), cardiovascular disease (CVD), CVD death, blindness, end-stage renal disease (ESRD), clinical neuropathy, uncomplicated and complicated diabetic foot ulcer (DFU) and minor and major amputation. Transitions will occur on an annual basis, except for the complications associated with clinical neuropathy, which will occur on a monthly basis. At the start of the simulation, patients have assigned characteristics, such as age, gender, tobacco status, history of cardiovascular disease, blood pressure-lowering drugs, glycosylated hemoglobin (HbA1c), systolic blood pressure, statin, anticoagulants, oral diabetes drugs, total and HDL cholesterol, serum creatinine and urine albumin:creatinine ratio. The baseline characteristics of Chinese patients with T2DM is shown in Table 1. Thereafter, the patients were copied to generate identical cohorts for comparisons. During the modeling process, the patients faced all of the potential risks. Once the event occurred, the counterpart in patient characteristics would then be updated, which would lead to revising the risks of complications.
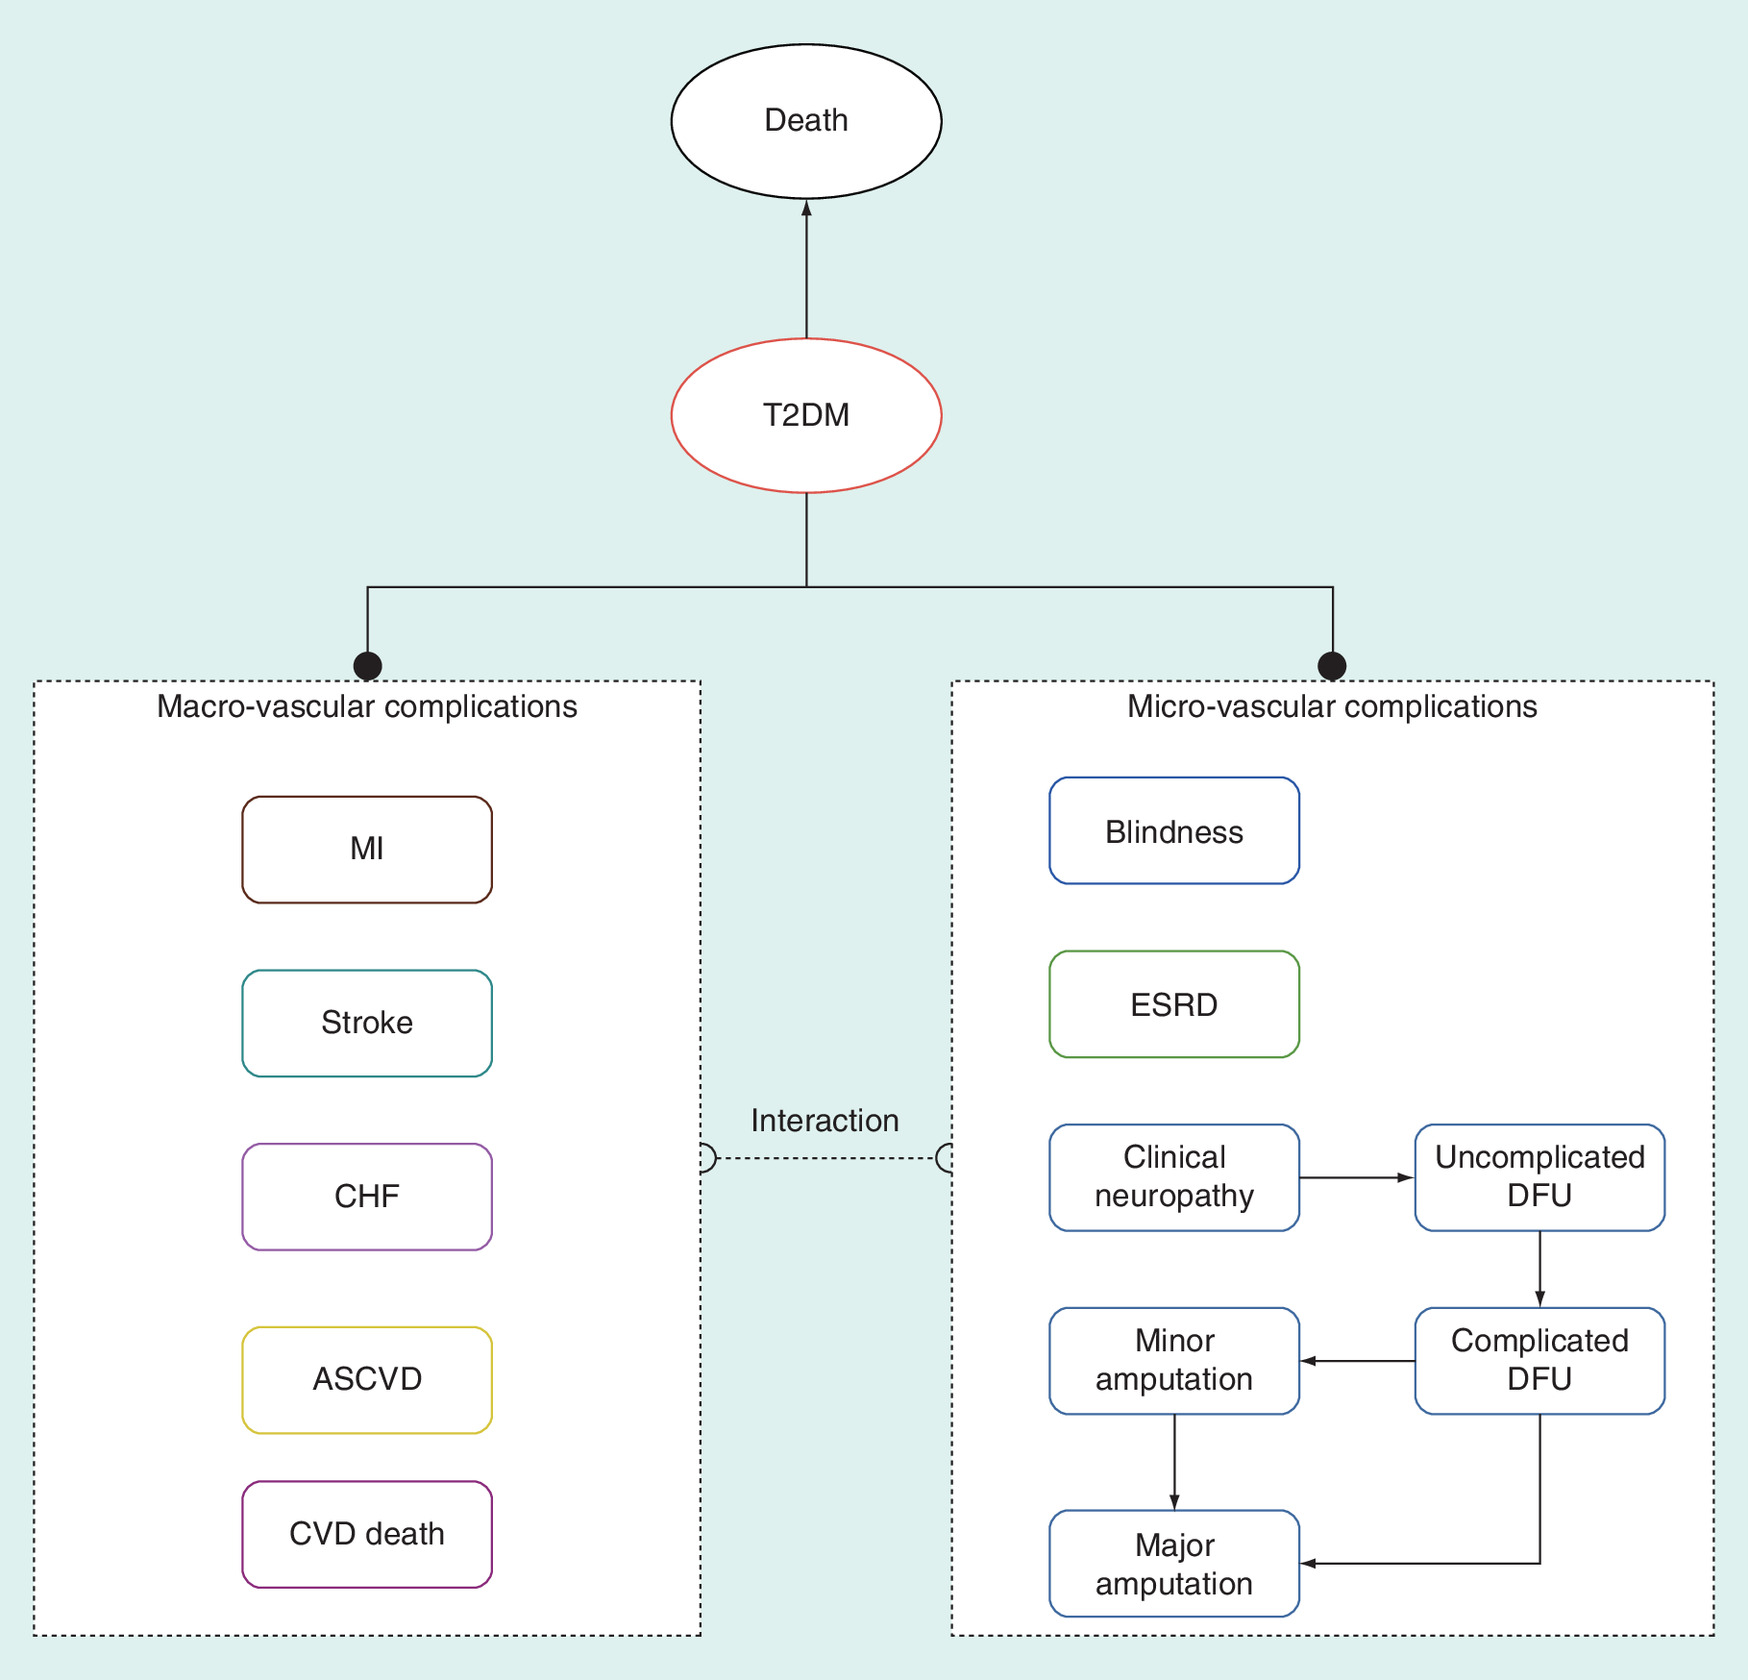
Figure 1. A schematic diagram of the Chinese Outcomes Model for Type 2 diabetes mellitus.
ASCVD: Arteriosclerotic cardiovascular disease; CHF: Congestive heart failure; CVD: Cardiovascular disease; DFU: Diabetic foot ulcer; ESRD: End-stage renal disease; MI: Myocardial infarction; T2DM: Type 2 diabetes mellitus.
| Covariates | Coefficient [16] | Men | Women | Ref. |
|---|---|---|---|---|
| Age | 0.04363 | 55.8 | 59.3 | [17] |
| Women | -0.2066 | 1 | 0 | [17] |
| Ethnicity (Black) | -0.1163 | 0 | 0 | NA |
| Tobacco smoking, current | 0.2358 | 0.505 | 0.042 | [17] |
| Systolic blood pressure (mmHg) | 0.00514 | 132 | 136.1 | [17] |
| History of cardiovascular disease | 0.9618 | 0.145 | 0.145 | [18] |
| Blood pressure-lowering drugs | -0.1248 | 0.127 | 0.127 | [18] |
| Statins | 0.04699 | 0.011 | 0.011 | [18] |
| Anticoagulants | 0.544 | 0.003252 | 0.003252 | [19,20] |
| HbA1c (%) | 0.2135 | 7.1 | 7.2 | [21] |
| Total cholesterol (mg/dl) | 0.00019 | 173.6 | 178.6 | [21–23] |
| HDL cholesterol (mg/dl) | -0.01358 | 44.5 | 51.4 | [21,22] |
| Serum creatinine (mg/dl) | 0.08027 | 0.69 | 0.69 | [24] |
| Urine albumin:creatinine ratio (mg/g) | 0.00042 | 60.12 | 61.89 | [25] |
HbA1c: Glycosylated hemoglobin; HDL: High-density lipoprotein; NA: Not applicable.
The hypothetical patients will receive the following potential therapies: antidiabetic therapy, which would be switched to next-line treatment according to the defined treatment pathway when hyperglycemia was inadequately controlled. In the treatment pathway, the insulin-based therapy would be set as the final-line line; hypertension and dyslipidemia would be treated when patients met the Chinese guideline-defined thresholds. The primary lipid-lowering target for patients with high-risk and very high-risk arteriosclerotic cardiovascular disease (ASCVD) was LDL-C <2.6 and 1.8 mmol/l and statins, such as simvastatin, would be administered [26,27]. Health and economic outcomes related to hypoglycemia during antidiabetic therapy would be taken into account in the model. Patients would be traced over the course of the model with their clinical characteristics updated over time.
The COMT models projected the lifetime results for the Chinese patients with T2DM life expectancy (life-years [LYs], quality-adjusted life years [QALYs], DALYs, cumulative incidences of complications and the relevant direct medical costs). Incremental cost–effectiveness ratios were calculated and expressed as cost per additional QALY gained or per DALY averted. Costs, QALY and DALY were annually discounted at 5% in line with Chinese guidelines for pharmacoeconomic evaluations [28].
The running flow diagram of the COMT model is shown in Figure 2.
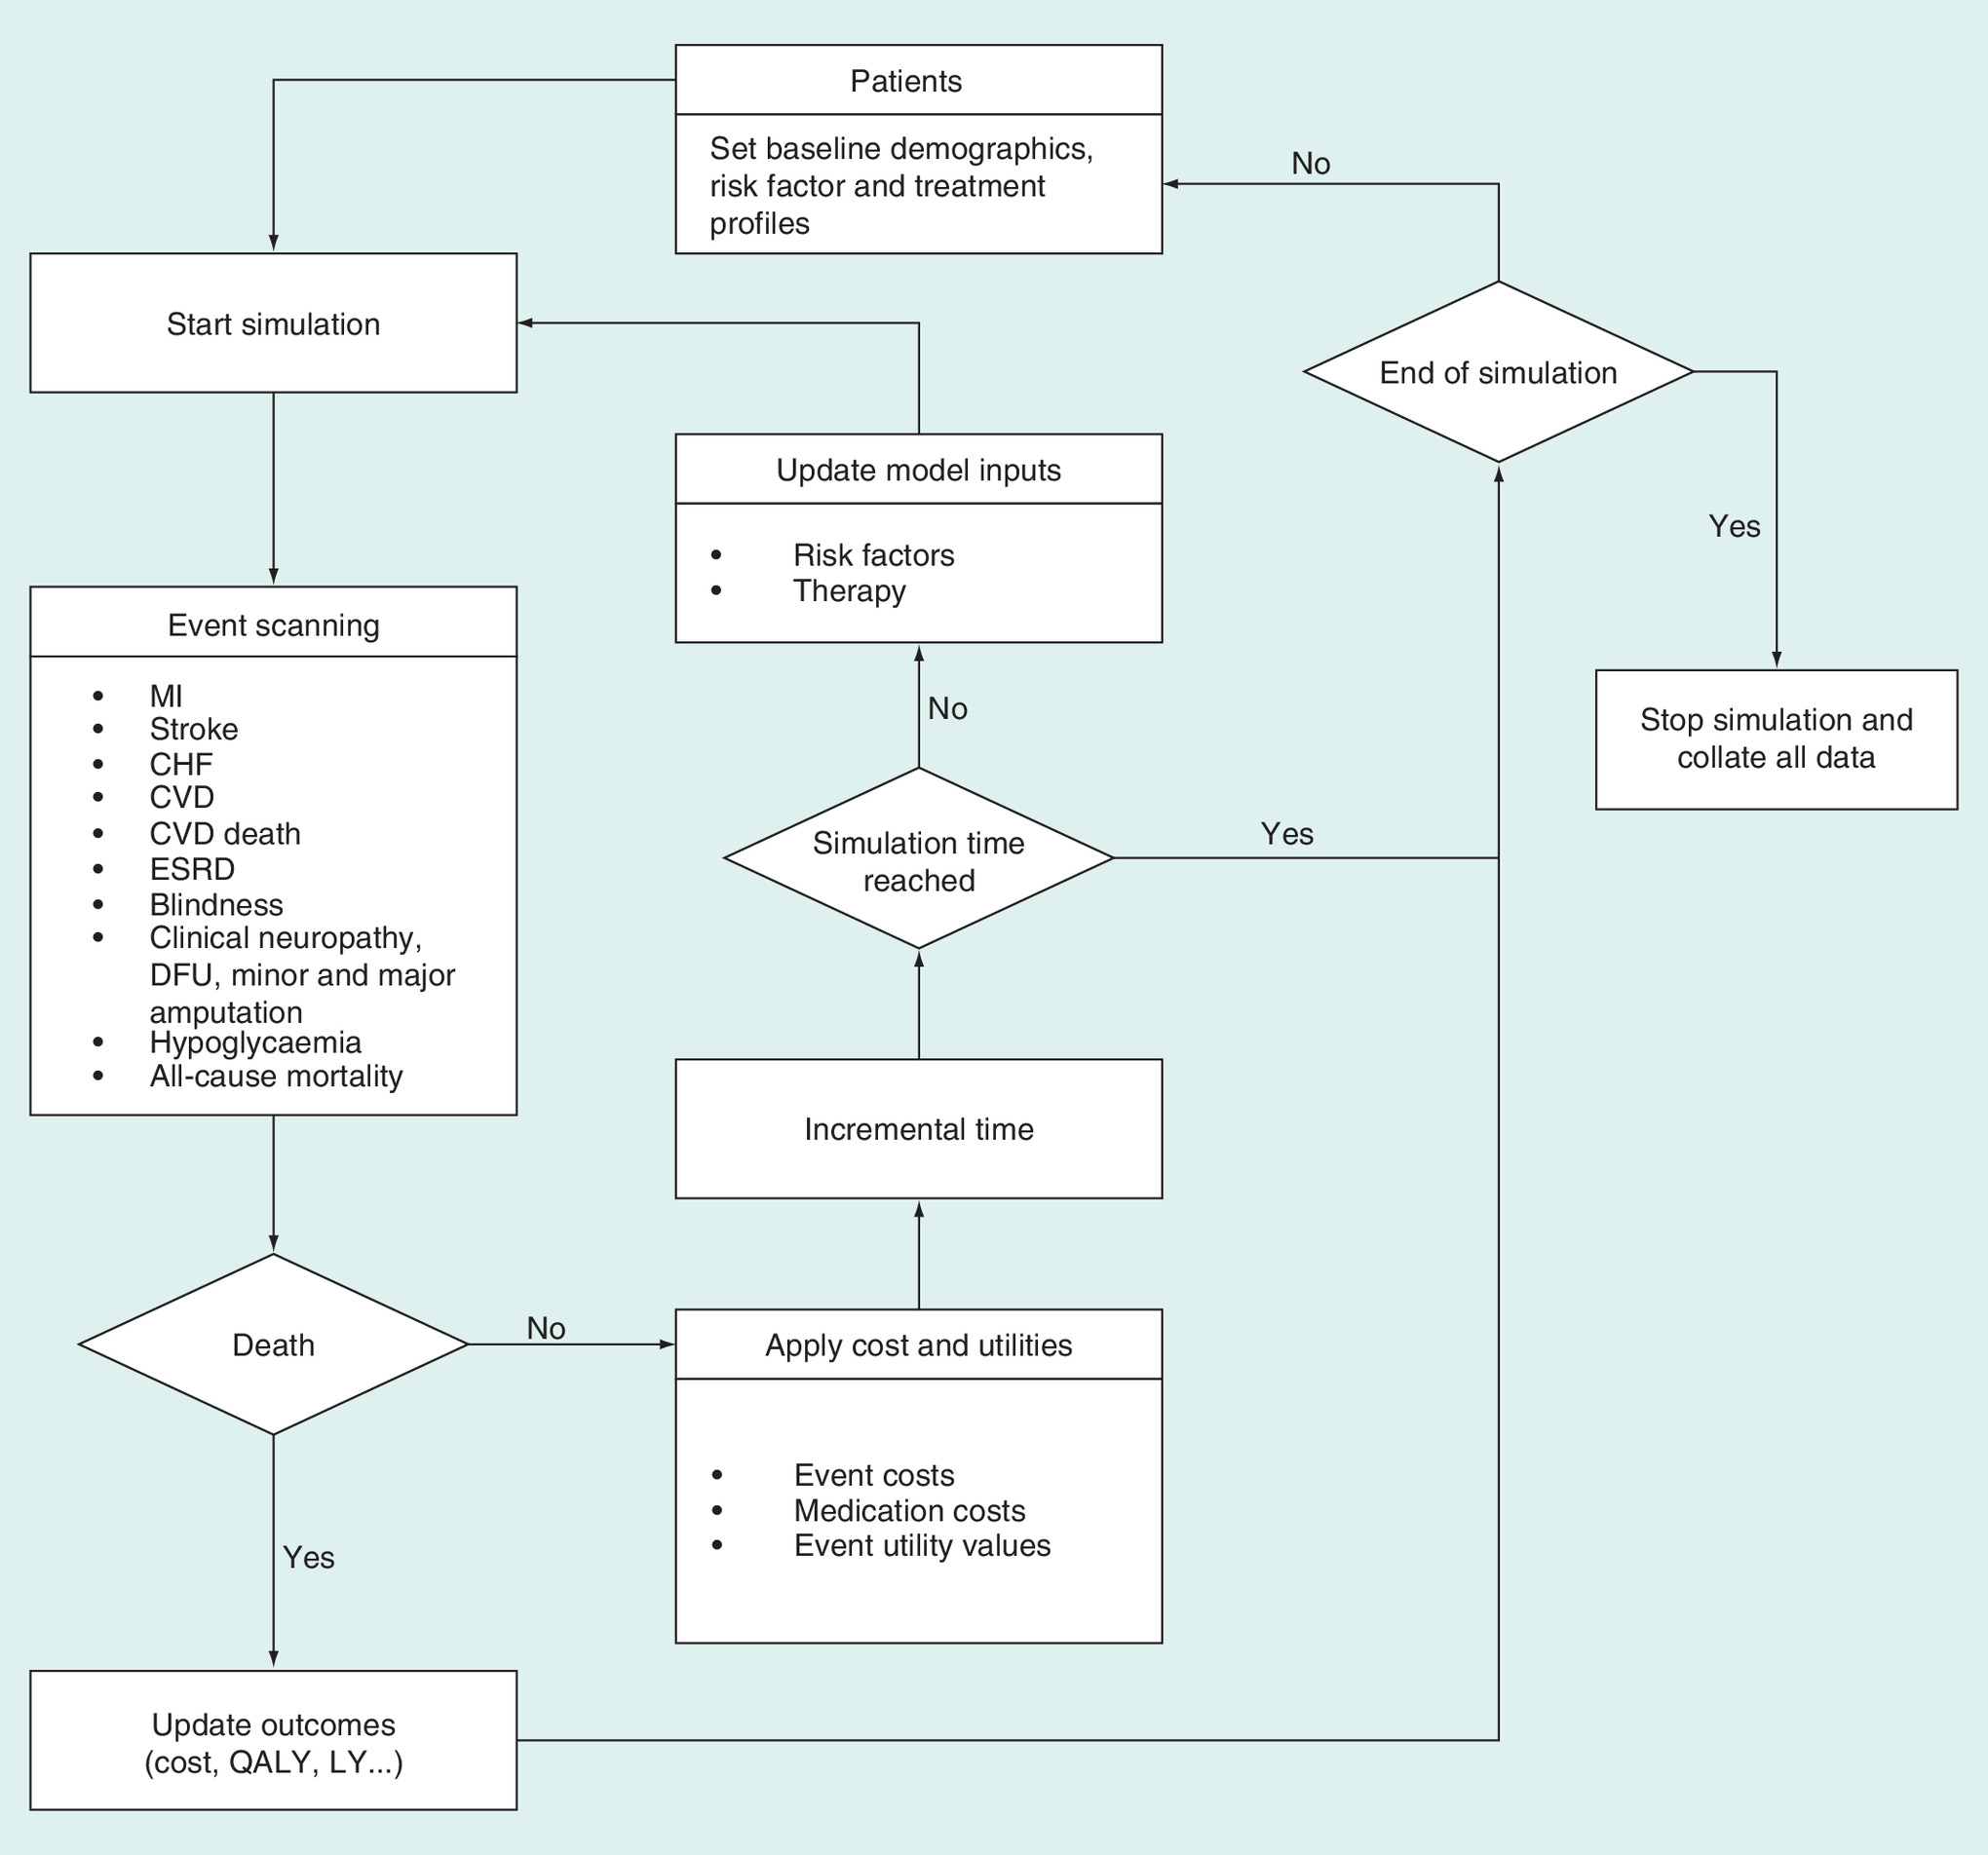
Figure 2. Flow simulation diagram of the Chinese Outcomes Model for Type 2 diabetes mellitus.
CHF: Congestive heart failure; CVD: Cardiovascular disease; DFU: Diabetic foot ulcer; ESRD: End-stage renal disease; LY: Life year; MI: Myocardial infarction; QUALY: Quality-adjusted life year.
Risk equation & re-calibration
The current analysis used the latest Risk Equations for Complications of T2DM (RECODe) published by Basu and colleagues [16], which could predict 10-year absolute risk of micro-vascular complications (retinopathy, nephropathy and neuropathy), CVD (MI, stroke, CHF and cardiovascular death) and all-cause mortality by using the equations based on the data derived from three trials Action to Control Cardiovascular Risk in Diabetes, Action for Health in Diabetes and the Diabetes Prevention Program Outcomes Study to derive and validate equations for prediction [29–31]. The included predictor variables were age, sex, ethnicity, smoking status, systolic blood pressure, history of cardiovascular disease, use of antihypertensive and anticoagulant medications, HbA1c, total and HDL cholesterol levels, serum creatinine, urine albumin:creatinine ratio and use of statin and oral diabetes medication. These variables could accurately reflect the importance of a predictive marker of adverse outcomes. They also showed that micro- and macro-vascular complications in T2DM often occur together. The new RECODe equations were much more accurate than the older equations for predicting micro- and macro-vascular complications, which tended to considerably overestimate risk [32]. To consider differing background risks of the western and Chinese populations, we recalibrated the original RECODe risk equations. Using the reported incidence data set of the complications related to T2DM in Chinese patients with T2DM [33–37], which was published in an English peer-reviewed journal, we applied the recalibration method described in Janssen et al., which corrects the risk score to comply with ‘calibration in the large’ [38], such that the mean predicted probability is equal to the observed outcome frequency. This technique recalibrates the estimated risk values by adding the adjustment regulator to the linear predictor within the risk equation. The adjustment regulator is gained by fitting a logistic regression model with the linear predictor (as offset) as the only covariate in the new data set or by measuring an adjustment regulator that is according to the mean predicted risk and observed outcome frequency in the new data set. The primary and recalibrated risk equations are summarized in Table 1. Because there is not a black male equivalent in PR China, ethnicity will not be included in the final equations.
HbA1c progression in T2DM was simulated based on the mathematical model, which was developed by pooling data from 68 eligible studies and could adequately reflect the heterogeneity of HbA1c profiles observed in clinical studies [39]. Blood pressure trajectories were derived from a 20-year prospective study, which included 1084 people (41.3% women) who participated in the PR China Health and Nutrition Survey (1991–2011) [40]; the change range was derived from the Rancho–Bernardo study [41]. Trajectories of total and high-density lipoprotein cholesterol were derived from eastern Asian populations [42,43].
Validation
The model was constructed by an experienced team specializing in health policy modeling, in cooperation with Chinese clinical experts. Face validity depicts the extent to which a model mirrors the present best clinical evidence, as judged by experts [15]. The overall architecture of the model was checked and validated by diabetologists, cardiologists, neurologists, nephrologists, ophthalmologists, pharmacists and health economics experts during development and there is only a paucity of concern that the figures used are not correct. Verification depicts the extent to which model estimations are properly implemented. The model has been wholly tested and de-bugged, including the ‘stress tests' that were designed to uncover potential mistakes in both logic and programming, and all results met the expectations.
Internal and external validations are used to measure whether the output of the model is both internally consistent with the actual observed outcomes deriving from clinical studies and data sources employed to construct the risk equations algorithm used by the model, and externally consistent with the observed outcomes not specifically employed to develop the disease risk equations. Because the COMT model is designed to estimate long-term clinical outcomes in Chinese patients with T2DM, the validation results were further stratified by the western (seven studies) and eastern (five studies) sets. The specific validation studies included in this analysis were the Atorvastatin Study for Prevention of Coronary Heart Disease End points in noninsulin-dependent diabetes mellitus [44]; the Veterans Affairs Diabetes Trial [45]; the Action in Diabetes and Vascular Disease;: Preterax and Diamicron Modified Release Controlled Evaluation (ADVANCE) [46]; the Action to Control Cardiovascular Risk in Diabetes [29]; the A Diabetes Outcome Progression trial [47]; Look Action for Health in Diabetes [48]; the Collaborative Atorvastatin Diabetes Study [49]; the UKPDS 33 and UKPDS 80 studies [50,51]; the ADVANCE Asian Study [52]; the Hong Kong Diabetes Registry [53]; the Multidisciplinary Risk Assessment and Management Program for Patients with Diabetes Mellitus Studies in Hong Kong [54,55]; the Observational Mortality Study from Japan [56]; the Japanese Intensive Statin Therapy for Hypercholesterolemic Patients with Diabetic Retinopathy Study [57]; the Japan Diabetes Complications Study [58]; and the Japanese Elderly Diabetes Intervention Trial [59]. The studies are summarized in Table 2.
| Study name | Population | Treatment groups | Sample size | Follow-up time (year) | Ref. |
|---|---|---|---|---|---|
| ACCORD | T2DM patients with HbA1c < 7.5%, significant atherosclerosis, albuminuria, left ventricular hypertrophy or at least two additional risk factors for cardiovascular disease across the USA and Canada | Intensive blood-glucose control/standard therapy | 10,251 | 4 | [29] |
| UKPDS 33 | Newly diagnosed Type 2 diabetes in UK | Intensive blood-glucose control/standard therapy | 3867 | 11 | [50] |
| UKPDS 80 | Newly diagnosed Type 2 diabetes in UK (long-term follow-up of UKPDS) | Intensive blood-glucose control/standard therapy | 3867 | 5–25 | [51] |
| ADVANCE | T2DM patients with a history of major micro-vascular or macro-vascular disease or C1 other risk factor for vascular disease in 20 countries | Intensive blood-glucose control/standard therapy | 11,140 | 5 | [49] |
| ACCORD-BP | T2DM patients with HbA1c > 7.5%, significant atherosclerosis, albuminuria, left ventricular hypertrophy or at least two additional risk factors for cardiovascular disease across the USA and Canada | Intensive blood pressure control/standard therapy | 4734 | 4 | [60] |
| CARDS | T2DM patients with one CVD risk factor but no history of CVD in the UK and Ireland | Atorvastatin/placebo | 2838 | 4 | [49] |
| ASPEN | T2DM patients (only primary prevention population is included in the validation) | Atorvastatin/placebo | 1905 | 4 | [44] |
| ADOPT | T2DM patients with recently diagnosed (i.e., within 3 years) and without pharmacologic treatment in the USA, Canada and 15 European countries | Metformin /glyburide | 4360 | 4 | [47] |
| Look AHEAD | Obese (BMI > 25 kg/m2) with T2DM and HbA1c < 11% in the USA | Normal care /Intensive lifestyle intervention for weight loss | 5145 | 10 | [48] |
| VDAT | T2DM patients with an inadequate response to maximal doses of an oral agent or insulin therapy in the USA | Intensive blood-glucose control/standard therapy | 1791 | 6 | [45] |
| RAMP-DM | Prospective cohort study in Chinese primary care setting | RAMP-DM/usual care | 121,584 | 3–5 | [54,55] |
| ADVANCE Asia | T2DM patients with a history of major micro-vascular or macro-vascular disease or C1 other risk factor for vascular disease in Asia | Intensive blood-glucose control/standard therapy | 4136 | 4 | [52] |
| EMPATHY | T2DM patients who had elevated LDL-C and diabetic retinopathy without a history of coronary artery disease in Japan | Standard/intensive statin therapy | 5995 | 5 | [57] |
| Osaka | Observational study of residents with T2DM in Osaka, Japan | Usual care | 1939 | 5–20 | [56] |
| JDCS | T2DM patients with HbA1c levels were ≥6.5% | Normal care /intensive lifestyle intervention | 2033 | 8 | [58] |
| J-EDIT | T2DM patients with age ≥ 65 and HbA1c ≥ 7.9% or HbA1c ≥7.4% with at least one of CVD risk factors in Japan | Intensive multiple risk factor control/standard therapy | 1173 | 6 | [59] |
| HKDR | Observational study of residents with T2DM in Hong Kong, PR China | Usual care | 7209 | 5.5 | [53] |
ACCORD: Action to Control Cardiovascular Risk in Diabetes; ACCORD-BP: Action to Control Cardiovascular Risk in Diabetes Blood Pressure; ADOPT: A Diabetes Outcome Progression Trial; ADVANCE: Action in Diabetes and Vascular Disease; AHEAD: Action for Health in Diabetes; ASPEN: Atorvastatin Study for Prevention of Coronary Heart Disease End Points in noninsulin-dependent diabetes mellitus; BMI: Body mass index; CARDS: Collaborative Atorvastatin Diabetes Study; CHF: Congestive heart failure; CVD: Cardiovascular disease; EMPATHY: Japanese intensive statin therapy for hypercholesterolemic patients with diabetic retinopathy; HbA1c: Glycosylated hemoglobin; HKDR: Hong Kong Diabetes Registry; JDCS: Japan Diabetes Complications Study; J-EDIT: Japanese Elderly Diabetes Intervention Diabetes Complications Study; LDL-C: Low-density lipoprotein cholesterol; Look AHEAD: Action for Health in Diabetes; RAMP-DM: Multidisciplinary Risk Assessment and Management Program for Patients with Diabetes Mellitus; T2DM: Type 2 diabetes mellitus; UKPDS: UK Prospective Diabetes Study; VDAT: Veterans Affairs Diabetes Trial.
End points
For each validation, the COMT model was initialized with a cohort profile keeping with each published report in terms of baseline characteristics of patients. The modeled time horizon was consistent with the mean or the median duration of follow-up as reported by the studies. By comparing with a corresponding outcome output from the model, the end points presented as cumulative incidences in each study were included in the validation, except the composite end points, such as ‘major micro-vascular events’, in ADVANCE, because no match existed in the model outcome [46]. Due to the multiple complications of T2DM, the end points were categorized by major vascular events (including MI, stroke, CHF, CVD, and CVD mortality), minor vascular events (including ESRD, blindness, amputation, and clinical neuropathy) and all-cause mortality events, as other previous reports have done [14,61–63].
Statistical analysis
Based on the established validation methods reported by other diabetes health policy models [8], the suitability of fit between the COMT model outputs and the observed data were evaluated. First, the visual inspection was performed by using the predicted cumulative incidences against the observed data. The validation points fall along, above and below the identity (45°) line when the prediction end points match, overpredict or underpredict the observed end points, respectively. Second, to examine where model fit was poor, the mean absolute percentage error (MAPE) was used to assess goodness of fit between simulated and observed values, which were calculated by the following equation:where Xi is the predicted value from the COMT Model, Yi is the observed value reported in the literature and n is the number of validation values. The residual Z was defined as the paired difference between the predicted and observed data sets: Z = Y − X, i = 1, 2,…, n.
Image (equation1.eps) is missing or otherwise invalid.
Finally, the best-fitting line through the scatterplot was plotted by using linear regression analysis with determination (R2), intercept and slope coefficients by the following equation:where Yi is the predicted value from the COMT Model, Xi is the observed value reported in the literature, i is the ith validation data sets, β0 is the intercept, β1 is the slope and ϵi is the disturbance term. A fully satisfied match will have an intercept of 0, a slope coefficient of 1 and an R2 of 1.00. All analysis were performed with R version 3.4.1 for Windows (R Foundation for Statistical Computing, Vienna, Austria).
Image (equation2.eps) is missing or otherwise invalid.
Results
Overall validation
All 171 validation end points were predicted across 17 T2DM outcomes studies, which are presented as scatterplots in Figure 3. We illustrated that the majority of paired observed and predicted values are on or close to the identity line (y = x) that is indicative of a perfect fit. Assessment of the correlation between observed and predicted values generated an R2 score of 0.8701, suggesting a close correlation (perfect fit = 1). The linear regression line in Figure 2 has a slope of 0.9631, close to the identity line (slope = 1). The overall MAPE was 32.93%. The MI, ESRD and CHF end points had considerable impact on the goodness of fit results (appendix Table 1).
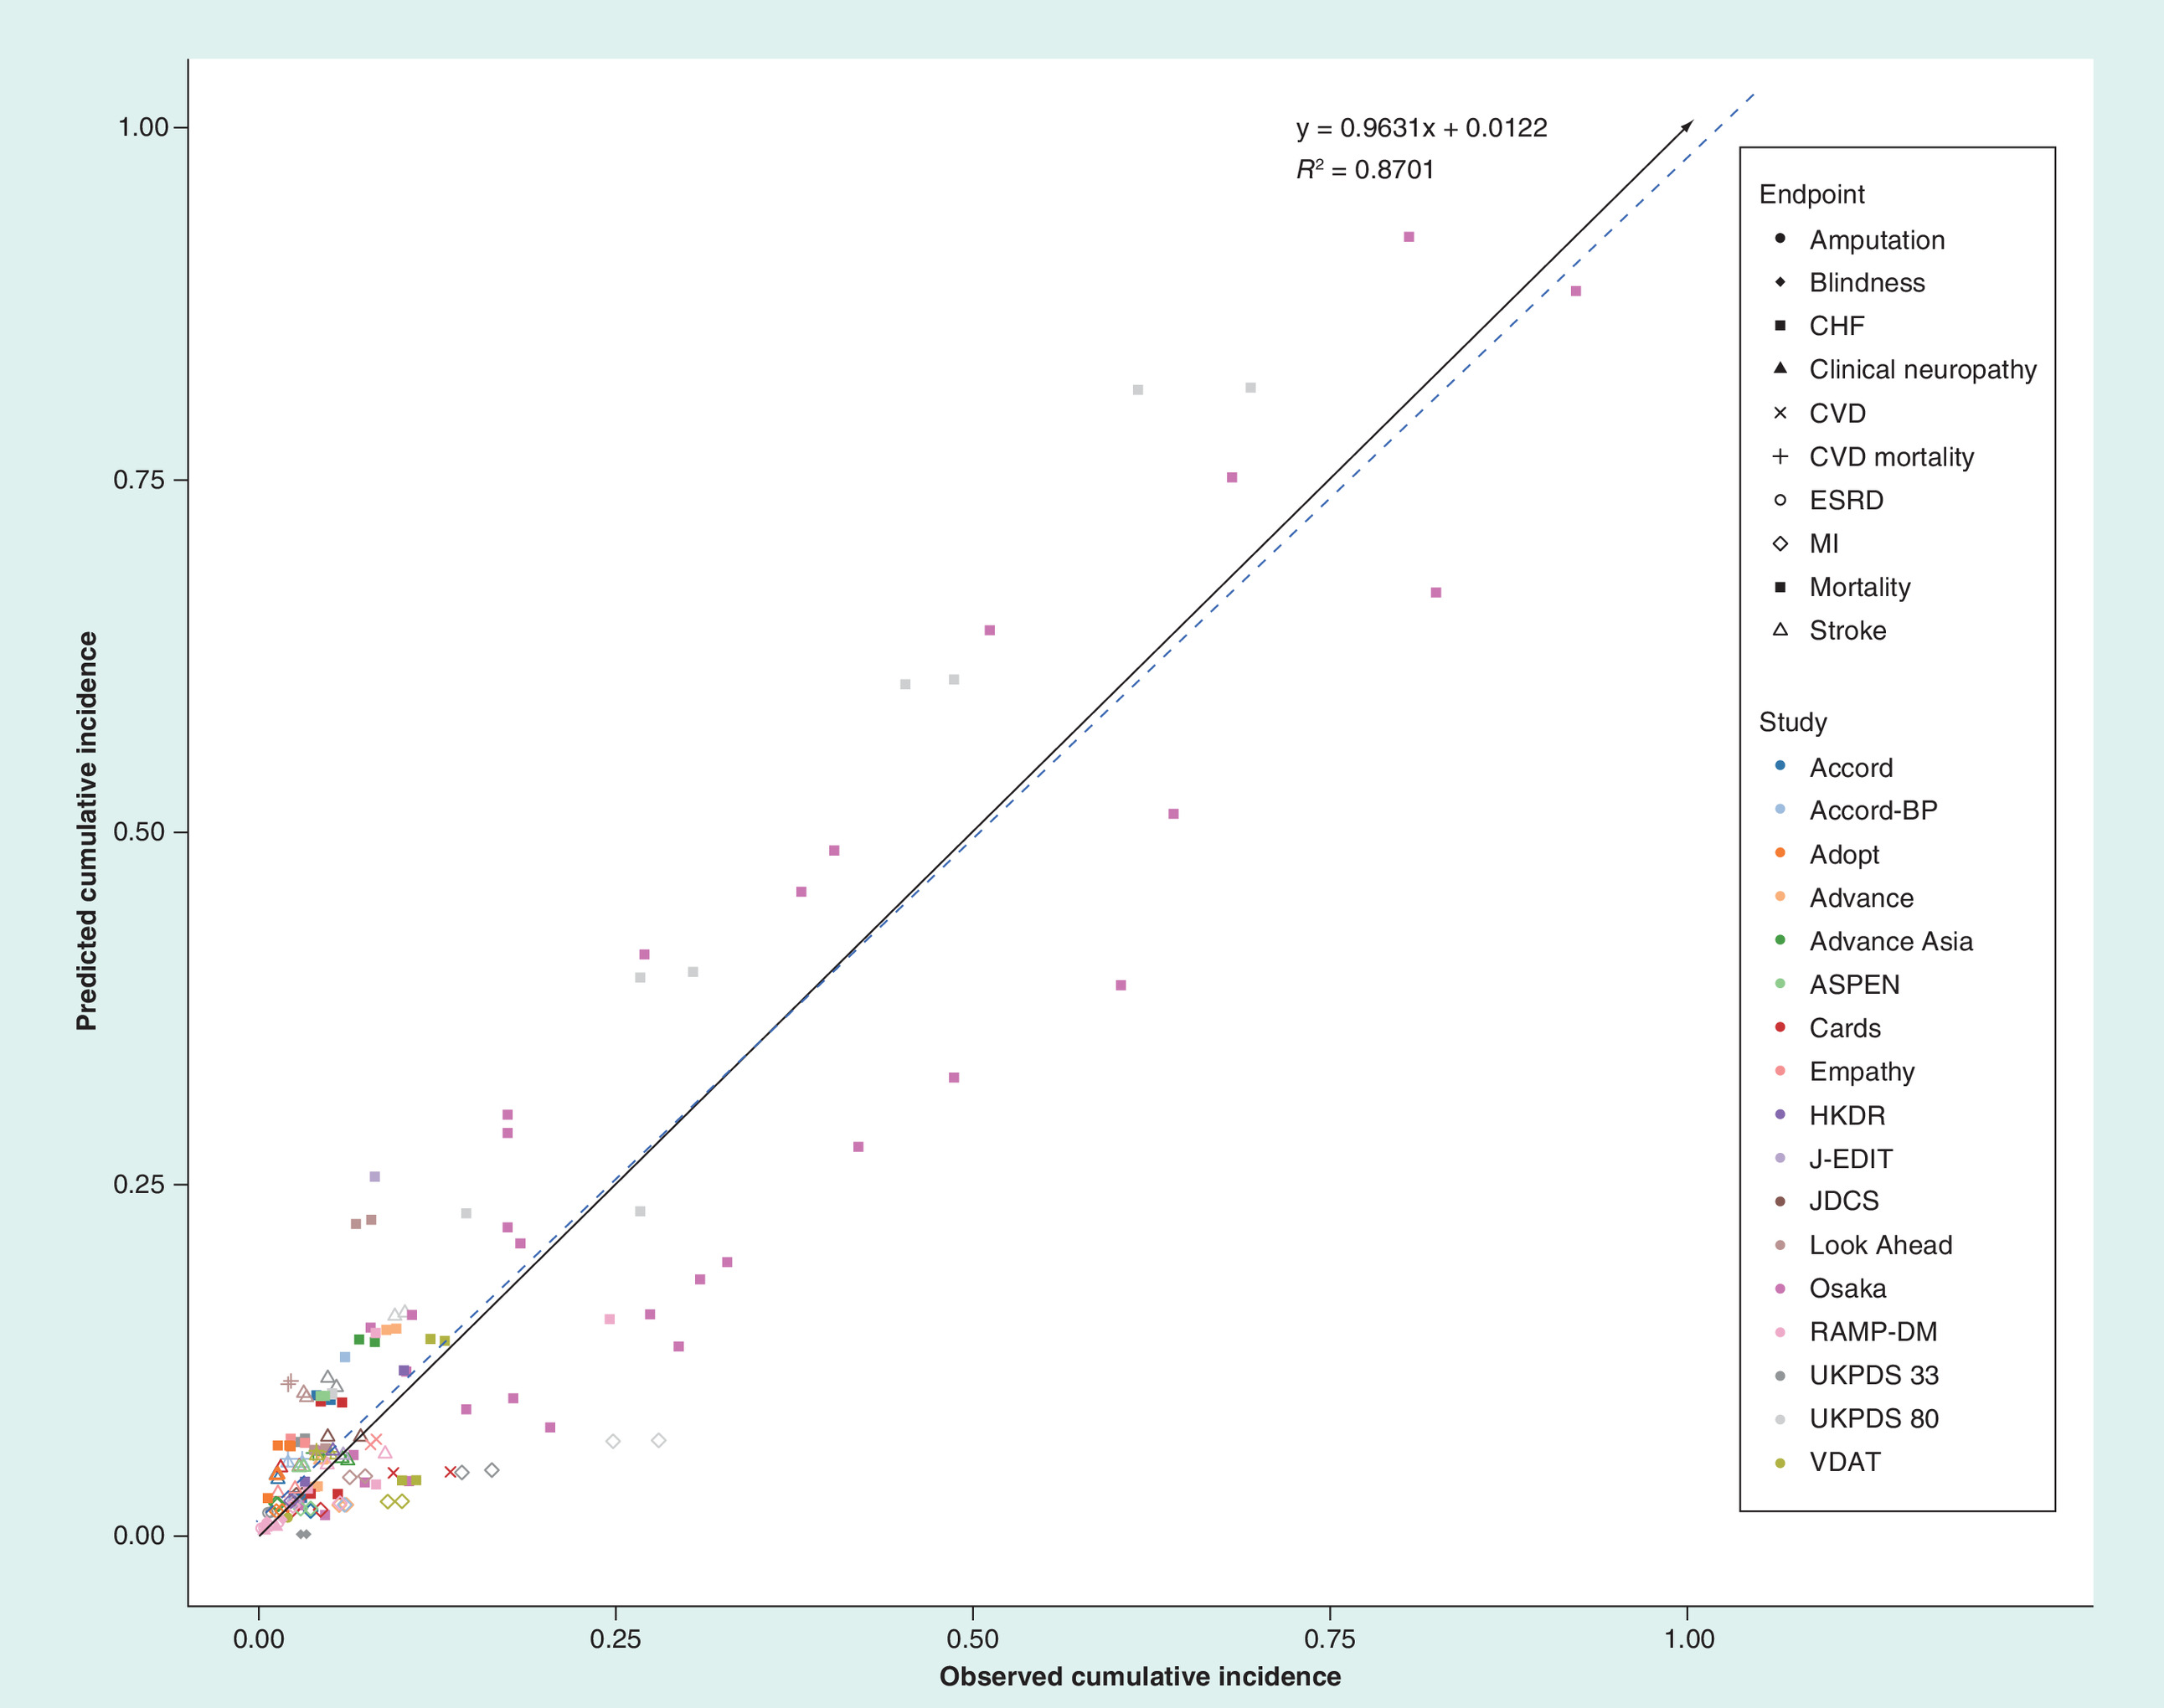
Figure 3. All end points including all studies: predicted versus observed cumulative incidence.
The solid black arrow line indicates the identity line and the blue dashed line indicates the linear regression.
ACCORD: Action to Control Cardiovascular Risk in Diabetes; ADOPT: A Diabetes Outcome Progression Trial; ADVANCE: Action in Diabetes and Vascular Disease; ASPEN: Atorvastatin Study for Prevention of Coronary Heart Disease End Points in noninsulin-dependent diabetes mellitus; CARDS: Collaborative Atorvastatin Diabetes Study; CHF: Congestive heart failure; CVD: Cardiovascular disease; EMPATHY: Japanese intensive statin therapy for hypercholesterolemic patients with diabetic retinopathy; ESRD: End-stage renal disease; HKDR: Hong Kong Diabetes Registry; JDCS: Japan Diabetes Complications Study; J-EDIT: Japanese Elderly Diabetes Intervention Trial; Look AHEAD: Action for Health in Diabetes; MI: Myocardial infarction; RAMP-DM: Multidisciplinary Risk Assessment and Management Program for Patients with Diabetes Mellitus; UKPDS: UK Prospective Diabetes Study; VDAT: Veterans Affairs Diabetes Trial.
Validation in different populations & outcomes
Separate evaluation of different parts of the population can provide useful insight into the reasonable utilization of the policy model. The results for the 77 end points in eastern and 94 end points in western populations are illustrated as scatterplots in Figure 4, respectively. There was a slight tendency for the simulations to underestimate the actual observed values in eastern populations (slope of 0.473) and overestimate the actual observed values in western populations (slope of 1.0566). The R2 scores in Eastern and western populations were 0.9272 and 0.8863 and MAPEs were 7.93 and 53.28%, respectively.
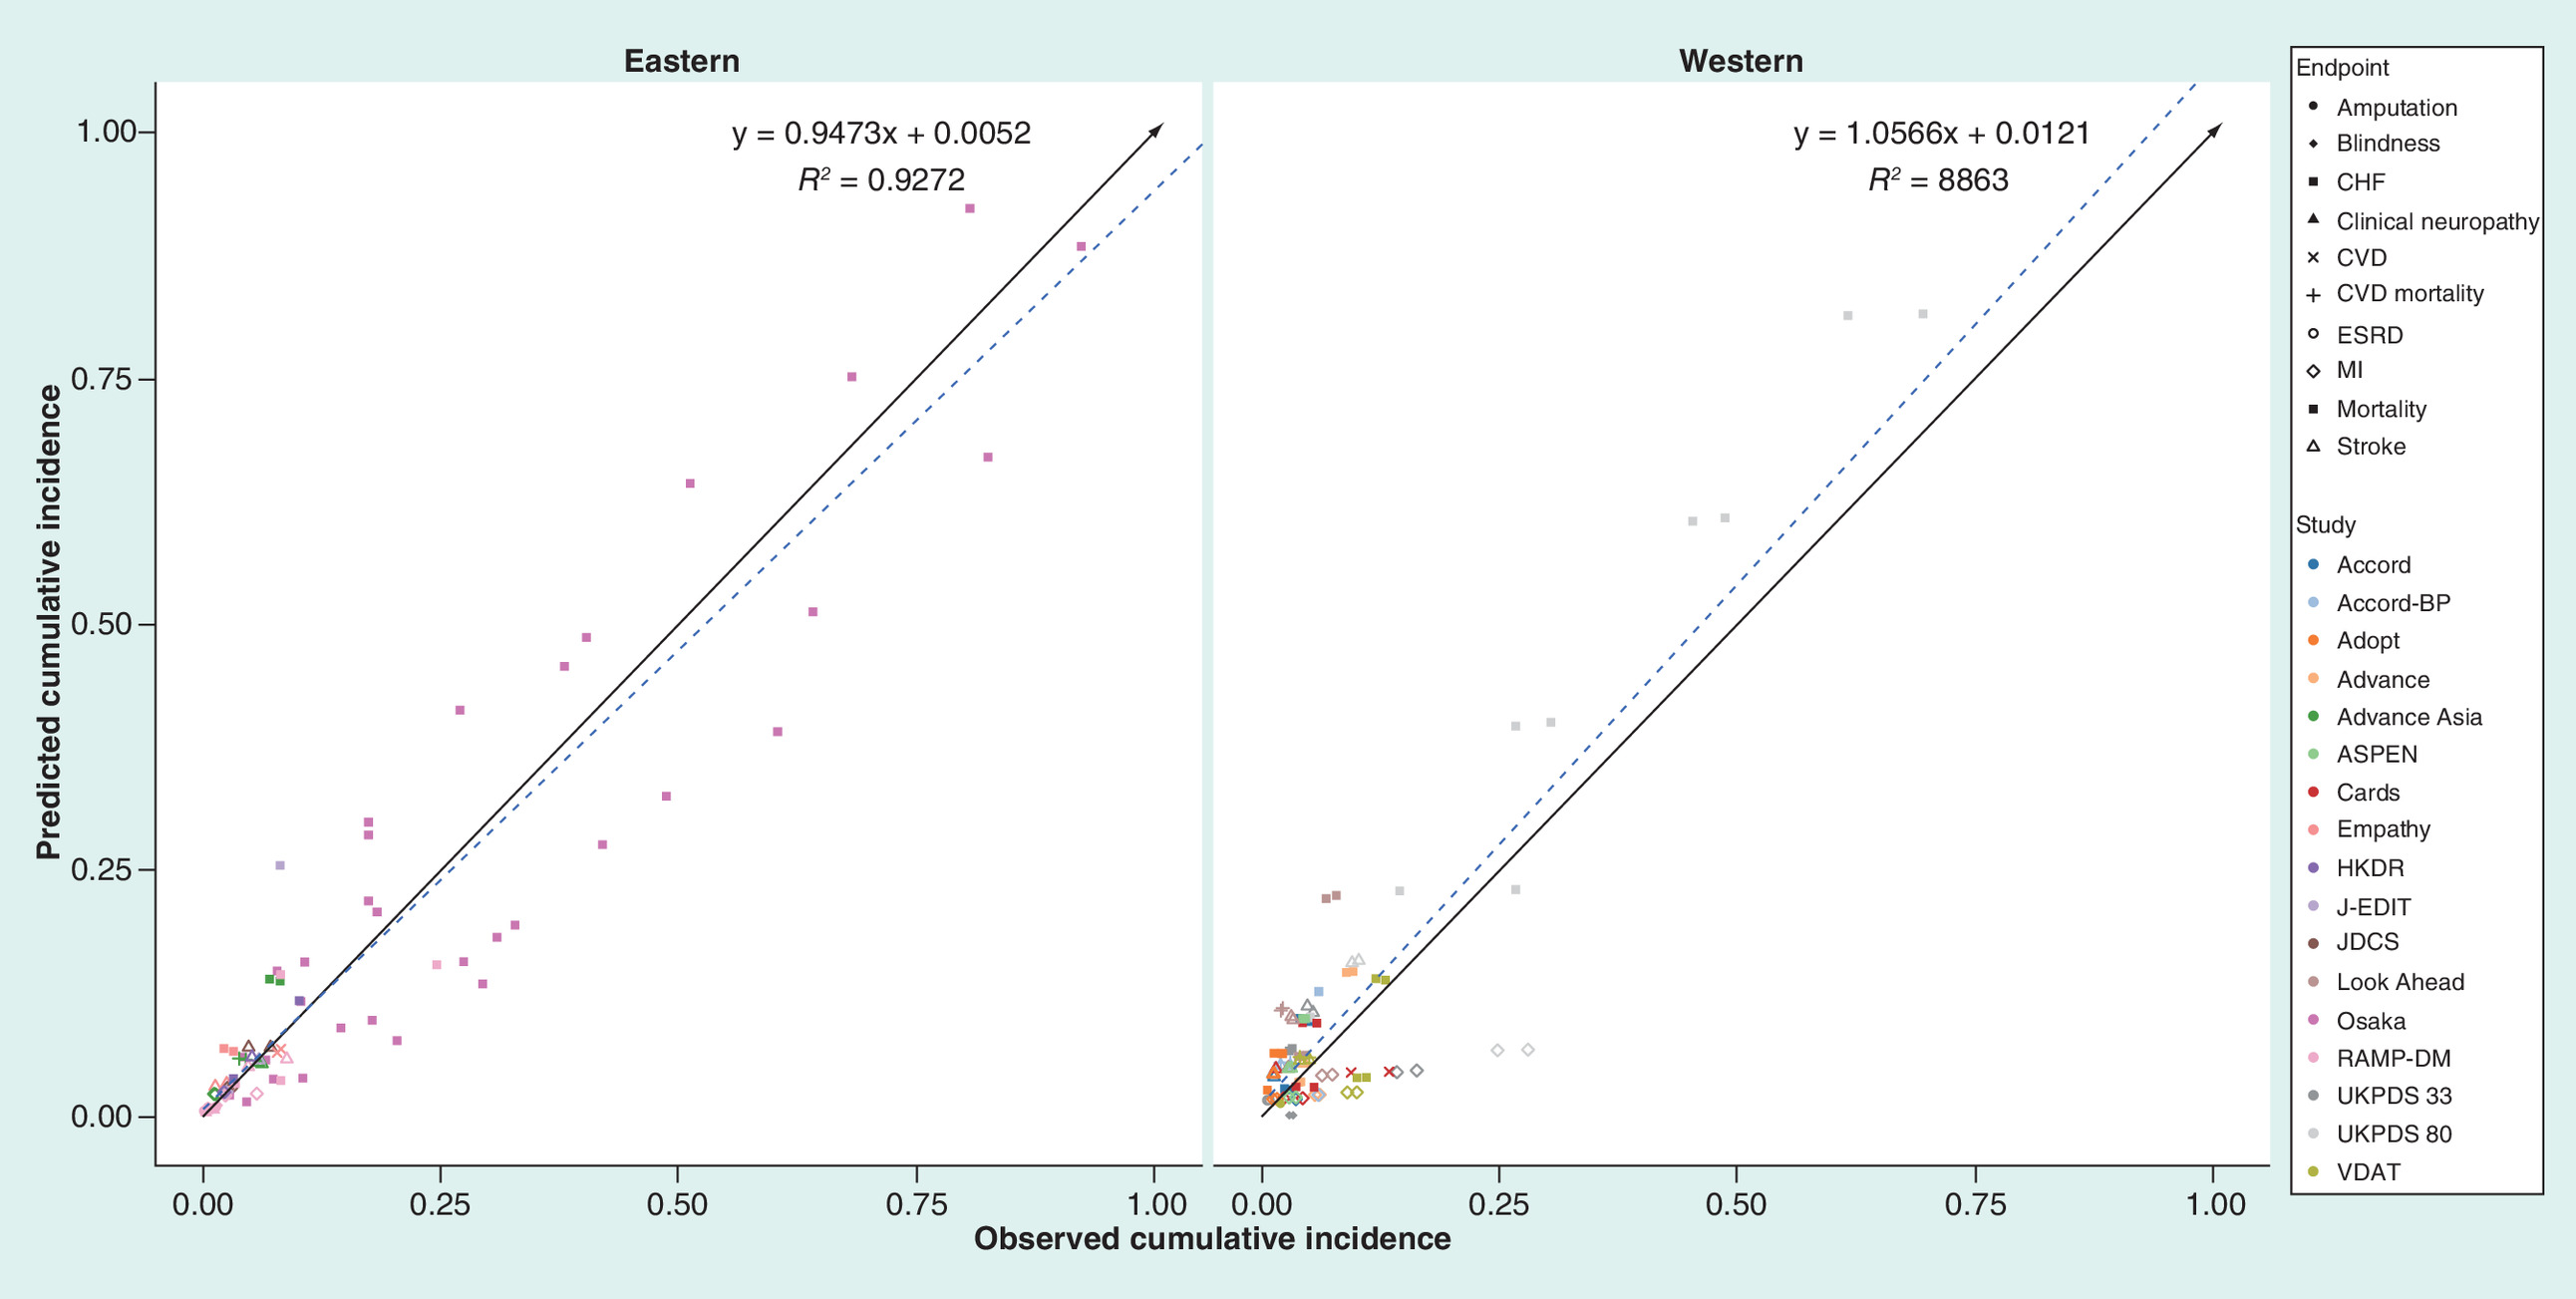
Figure 4. All end points stratified by eastern and western populations: predicted versus observed cumulative incidence.
The solid black arrow line indicates the identity line and the blue dashed line indicates the linear regression.
ACCORD: Action to Control Cardiovascular Risk in Diabetes; ADOPT: A Diabetes Outcome Progression Trial; ADVANCE: Action in Diabetes and Vascular Disease; ASPEN: Atorvastatin Study for Prevention of Coronary Heart Disease End Points in noninsulin-dependent diabetes mellitus; CARDS: Collaborative Atorvastatin Diabetes Study; CHF: Congestive heart failure; CVD: Cardiovascular disease; EMPATHY: Japanese intensive statin therapy for hypercholesterolemic patients with diabetic retinopathy; ESRD: End-stage renal disease; HKDR: Hong Kong Diabetes Registry; JDCS: Japan Diabetes Complications Study; J-EDIT: Japanese Elderly Diabetes Intervention Trial; Look AHEAD: Action for Health in Diabetes; MI: Myocardial infarction; RAMP-DM: Multidisciplinary Risk Assessment and Management Program for Patients with Diabetes Mellitus; UKPDS: UK Prospective Diabetes Study; VDAT: Veterans Affairs Diabetes Trial.
To identify the drivers of this potential overestimation and underestimation, we further examined the validation points in eastern and western populations stratified by mortality, micro- and macro-vascular complications (Figure 5). In Eastern populations, there was a slight tendency for the simulations to underestimate the actual observed mortalities (slope of 0.9208). For micro- and macro-vascular complications, the best-fitting regression lines have values of 0 for the intercept and 1 for the slope. The R2 scores of mortality, micro- and macro-vascular complications in the eastern population were 0.9851, 0.9888 and 0.8763, and the MAPEs were 2.51, 13.32 and 17.92%, respectively. In western populations, there was a tendency for the simulations to overestimate the actual observed mortalities (slope of 1.0345) and underestimate the actual observed values of micro- and macro-vascular complications (slope of 0.9011 and 0.7528). The R2 scores of mortality and micro- and macro-vascular complications in eastern populations were 0.9570, 0.8581 and 0.9583 and the MAPEs were 38.58, 606.87 and 31.64%, respectively.
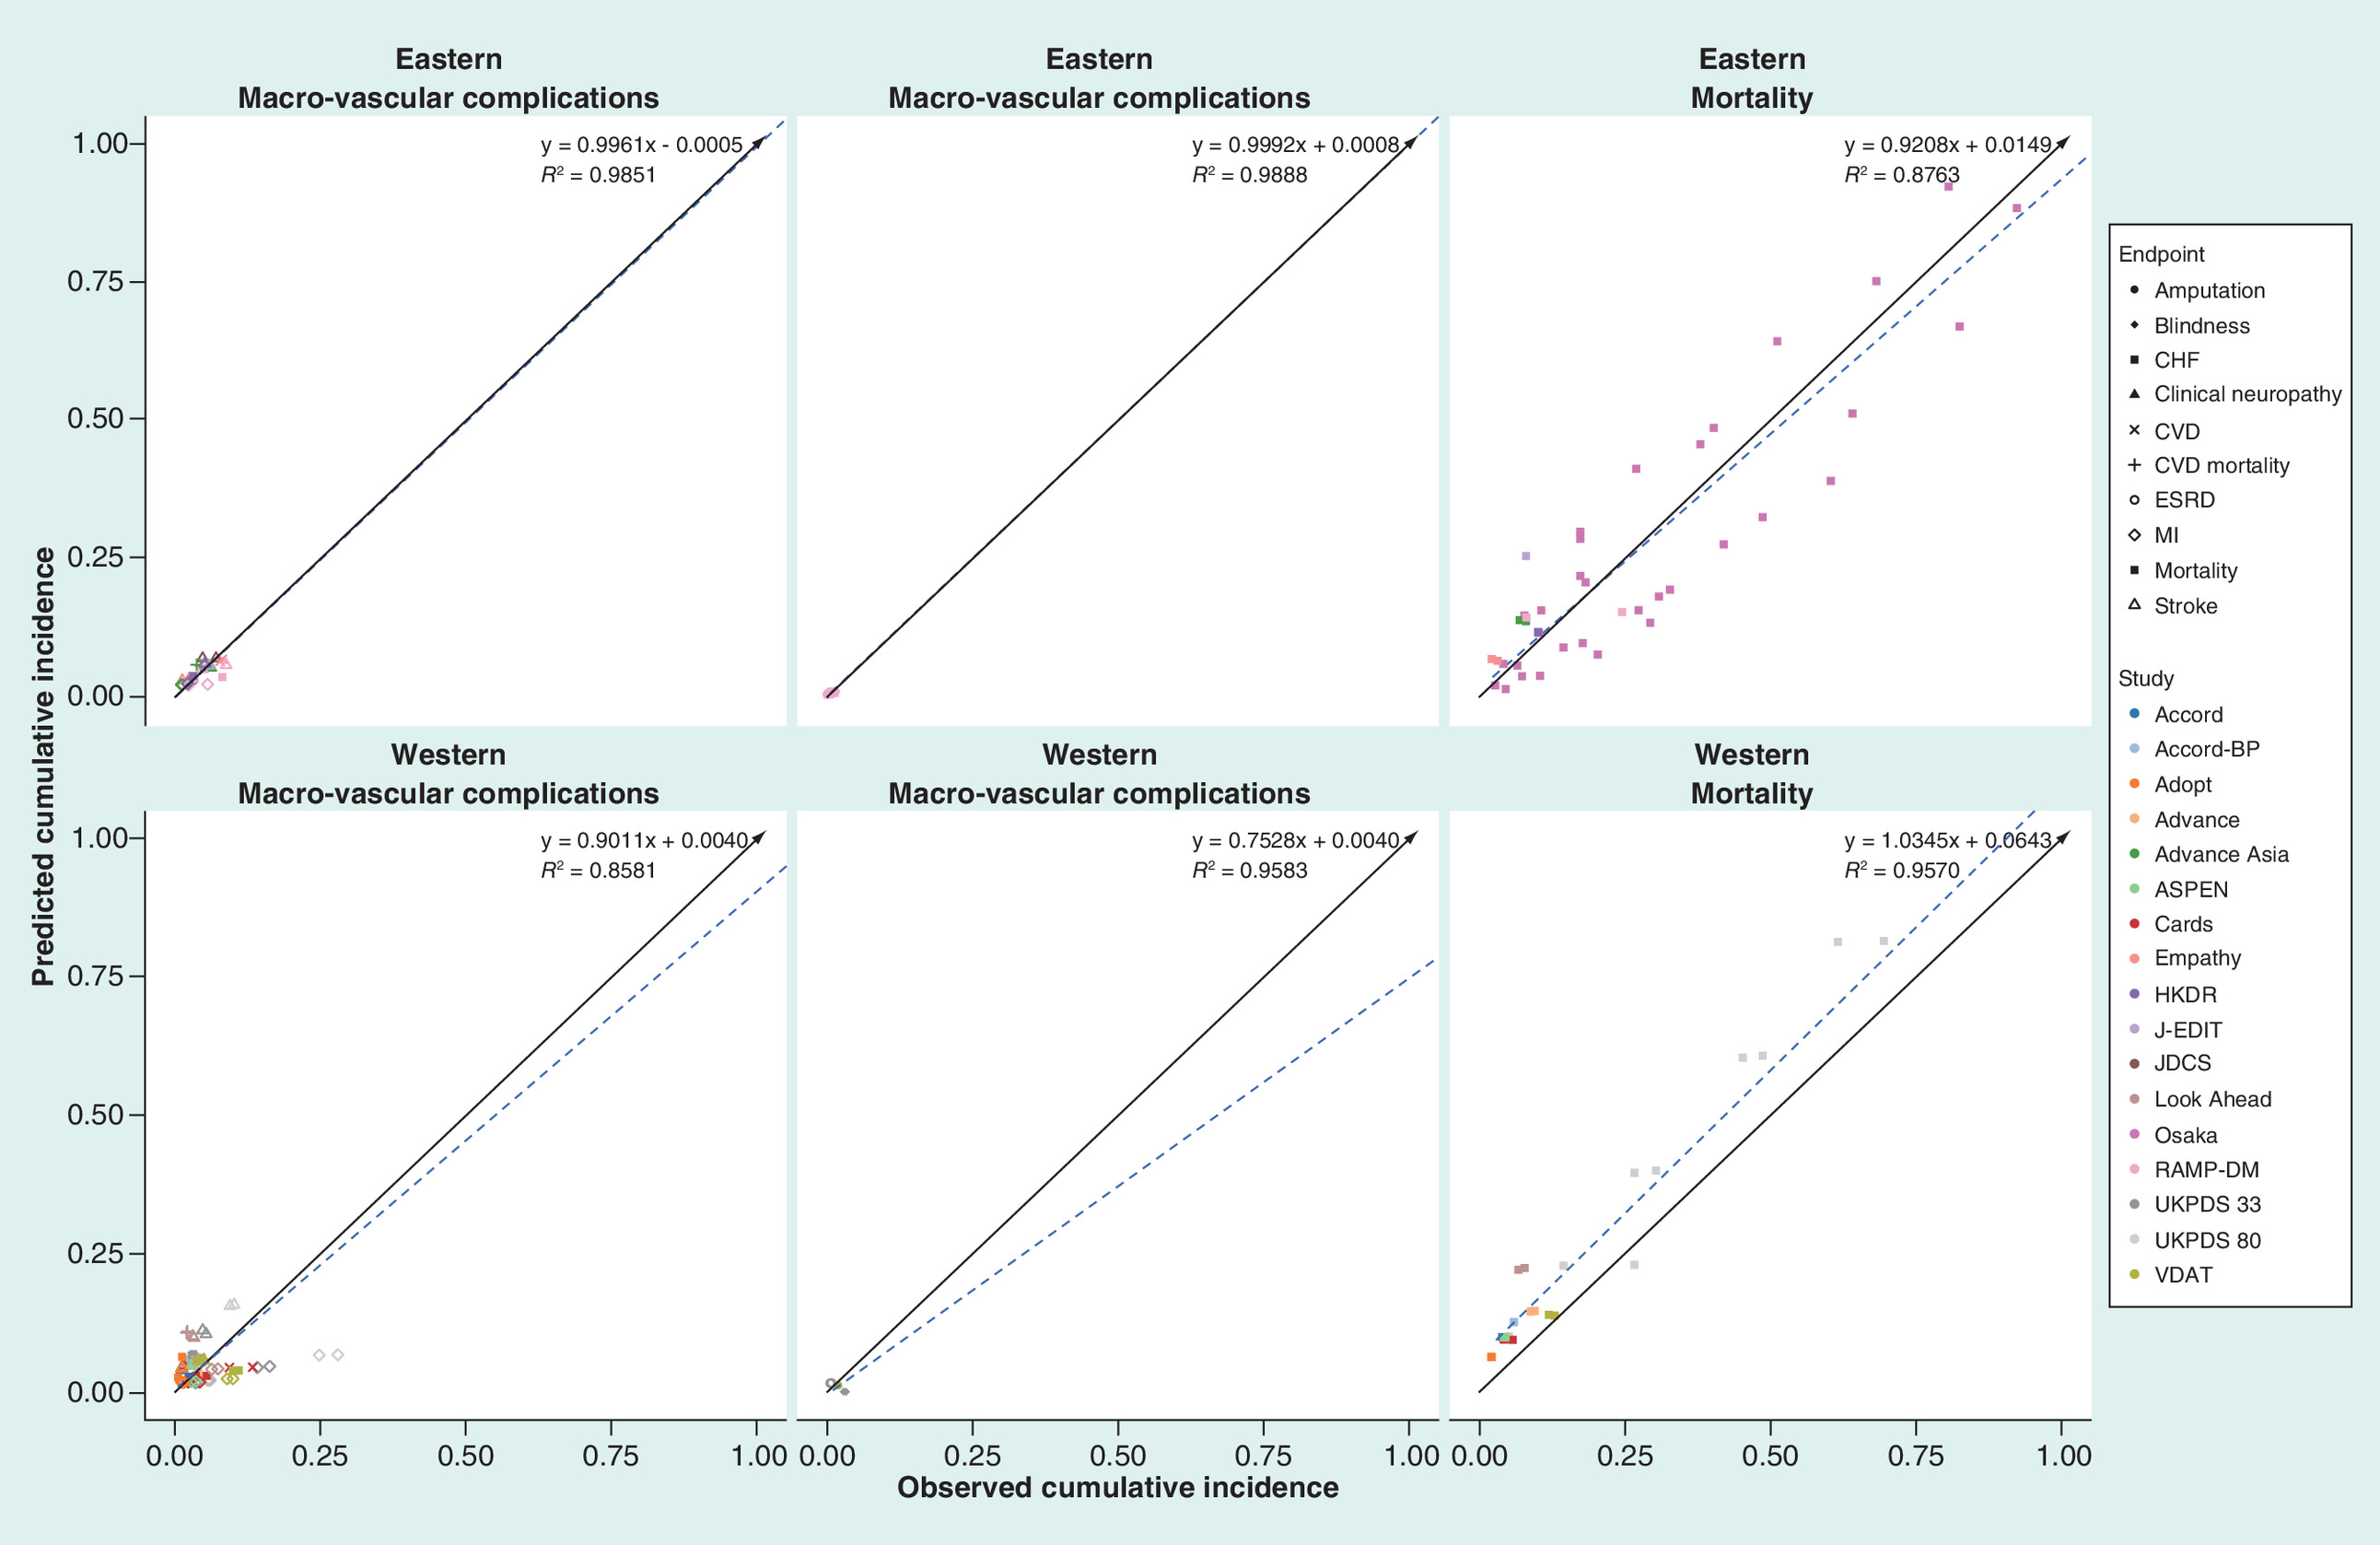
Figure 5. All end points stratified by eastern and western populations and different end points: predicted versus observed cumulative incidence.
The solid black arrow line indicates the identity line and the blue dashed line represents the linear regression.
ACCORD: Action to Control Cardiovascular Risk in Diabetes; ADOPT: A Diabetes Outcome Progression Trial; ADVANCE: Action in Diabetes and Vascular Disease; ASPEN: Atorvastatin Study for Prevention of Coronary Heart Disease End Points in noninsulin-dependent diabetes mellitus; CARDS: Collaborative Atorvastatin Diabetes Study; CHF: Congestive heart failure; CVD: Cardiovascular disease; EMPATHY: Japanese intensive statin therapy for hypercholesterolemic patients with diabetic retinopathy; ESRD: End-stage renal disease; HKDR: Hong Kong Diabetes Registry; JDCS: Japan diabetes complications study; J-EDIT: Japanese Elderly Diabetes Intervention Trial; Look AHEAD: Action for Health in Diabetes; MI: Myocardial infarction; RAMP-DM: Multidisciplinary Risk Assessment and Management Program for Patients with Diabetes Mellitus; UKPDS: UK Prospective Diabetes Study; VDAT: Veterans Affairs Diabetes Trial.
Discussion
To support health decision-making, health economic and policy models must be transparent (description of the model structure published) and validated against real-life studies (clinical and epidemiological trials). During the development of the COMT health policy model, extensive literature reviews were carried out to identify appropriate data sources for the model. Studies were chosen, if they provided appropriate Chinese-specific data and were the largest and most recent data available. As a result, the model was developed by using the latest RECODe risk equations due to their high accuracy in predicting diabetes complications compared with older risk equations [16,32]. Because RECODe risk equations are derived from studies based on western populations, our model recalibrated the equations using Chinese-specific epidemiological data [33–37]. Justifying the credibility of the model is therefore a central issue of model validation. The outcomes predicted by the COMT model were subjected to testing against 171 outcomes extracted from 17 heterogeneous clinical studies, including randomized-controlled trials and observational cohort studies that were conducted in western and eastern populations and that varied chronologically and with length of follow-up. With the adjusted RECODe risk equations, the findings were positive because the best-fitting regression line closely followed the identity line with high R2 scores.
The validation results presented in this model are generally in agreement with validation results from previous validation analyses of T2DM models [14,61–63]. For example, the R2 values of 0.8581–0.9888 (depending on choice of population and end points) suggest a comparable linearity of predictions with the Cardiff model (~0.870) [61], IHE model (~0.83) [63], and CORE model (~0.90) [62]. The slope coefficient of 0.9631 across all validation studies was close to the identical line, especially for validation studies based on eastern Asian patients. The slope coefficient of 0.9631 across all validation studies was slightly higher than the IHE model (0.952) [63] and slightly lower than the Cardiff model (0.999) [61] and CORE model (1.019) [62].
The strengths of the present study are the eastern and western studies and the large number of outcomes included, which contribute a broad profile to examine the validity of the diabetes model. Subgroup populations showed considerable differences between eastern and western populations. The predictions for the end points in eastern populations tracked actual end points closely, especially regarding macro- and micro-vascular complications. There was a tendency to overestimate the end points in western populations. Model simulations performed worse for the stratified end points in western populations, with an underestimation of both macrovascular complications and microvascular complications and an overestimation of mortality. These predicted disparities perhaps reflect differences in the epidemiology associated with T2DM between eastern and western populations. This finding indicates that the risk equations that were used in the creation of a diabetes model for local decision-making should be derived from local populations or adjusted based on local epidemiological data.
There are only two risk engines, the Joint Asia Diabetes Evaluation (JADE) risk engine [53] and the Japan Diabetes Complications Study/Japanese Elderly Diabetes Intervention Trial risk engine [64], created for Asian patients with diabetes. Although the JADE risk engine, which was the only engine developed for Chinese patients with diabetes by the Hong Kong Diabetes Registry consisting of 7534 T2DM patients, was used to predict stroke, MI, angina and CHF over time in Chinese patients with T2DM [53]; we did not employ these risk engines in our model because the JADE and JJ risk engine have some limitations: the first is that they only predict 5-year outcomes; the second is that they sometimes could not accurately detect the impact of antidiabetic, antihypertension and antidyslipidemia therapies, because some equations did not capture the related modified predictors, such as the absence of HbA1c as a factor in the CHD equation of the JADE risk engine [65]; and the last limitation is that the predicted complications in the JADE and JJ risk engines were lower risk than other risk engines. The current analysis also did not consider other risk equations, such as the UKPDS risk equation, which was widely used in the creation of diabetes models [66], because the studies (e.g., UKPDS study) that were used for developing the risk equation were too old to capture recent treatment patterns (e.g., antidyslipidemia therapy) that have improved macro-vascular outcomes.
Naturally, our model also suffers weaknesses. First, as in other diabetes heath policy models [66,67], other complications associated with diabetes, such as cancer and dementia [68–70], were not included in the current model due to the lack of the risk engines for estimating their incidences, and which might underestimate the health benefits of active prevention and treatment of diabetes. When the risk engines are available, the COMT model should be updated. Second, our validation analyses did not include Chinese Mainland data due to the absence of well-designed longitudinal studies investigating the relationship between complications and diabetes, although the validation analyses included several eastern Asian studies from Japan and Hong Kong, PR China. One recent meeting abstract first reported the CVD incidence in populations with T2DM in the Chinese mainland [71] and that data might be added into our validation analysis once the formal report is published. Third, although the RECODe risk equations had better discrimination and calibration than the UKPDS risk equations and are similar to CVD predictions in general [16], they still need to be improved for predicting complications [32], which is of particular importance in the context of east Asian. Fourth, the current model did not cross-validate the studies with other models [67], such as the Cardiff model, IHE model and CORE model, because there is no current guidance to recommend which methods and specific metrics to employ to quantify model concordance [15]. Fifth, the model performance is acceptable with the validation analyses used the composite outcomes for linear regression. However, it should be noted that some individual outcomes, such as the mortality, was markedly discrete. Finally, similar to other validation studies, our validation analyses used trial-reported data for matching model predictions. Due to the varied end points, baseline characteristics and inclusion and exclusion criteria among these different studies, the differences between the simulated cohort and the characteristics of the actual patients in the study could not be avoided, which should be recognized as a challenge for the validation.
Conclusion
In conclusion, the Chinese Health Policy Model of T2DM was subjected to extensive validation testing, and the results were generally in line with the reported data, especially the eastern Asian data. Due to ethnic disparities, we found that there were notable differences in macro-complications between the predicted data and the published data, which were based on western populations. We also found that the RECODe risk equations generally performed as well as other equations.
•
Due to the difference in epidemiology and outcomes between eastern and western populations with Type 2 diabetes mellitus (T2DM), an important challenge is determining how useful the outcomes from diabetes models based on western populations are for eastern patients.
•
The specifically aim of this study was to develop and validate a Health Policy Model (Chinese Outcomes Model for T2DM [COMT]) for supporting Chinese medical and health economic studies.
•
The COMT model is developed to project a series of important complications of T2DM diabetes based on the the latest Risk Equations for Complications of Type 2 Diabetes (RECODe), which was adjusted by adding the adjustment regulator to the linear predictor within the risk equation.
•
The validity of the model was conducted by using a total of 171 validation outcomes from seven studies in eastern populations and ten studies in western populations.
•
Concordance was tested by assessing the difference between the identity (45°) line and the best-fitting regression of the scatterplots for the predicted versus observed outcomes.
•
There were major differences between western and eastern populations. The slope and R2 of predictions were 0.9473 and 0.9272 in the eastern population and 1.0566 and 0.8863 in the western population, which showed more perfect agreement with the observed values in the eastern population than the western populations.
•
The subset of macrovascular and microvascular outcomes in the eastern population showed an identical tendency (the slope coefficient was close to 1) and mortality outcomes showed a slight tendency toward overestimation (the slope coefficient was close to 0.9208).
•
Some degree of underprediction of macrovascular and microvascular end points and overprediction of mortality end point was found in the western population.
•
The COMT diabetes model simulated the long-term patient outcomes observed in eastern Asian T2DM patients with prediction accuracy. This study supports the COMT as a credible tool for Chinese healthcare decision makers. Further work is necessary to incorporate new local data to improve model validity and credibility.
Financial & competing interests disclosure
This study was supported by grants from the National Natural Science Foundation of China (grant No. 71373160) and the Shanghai Municipal Commission of Health and Family Planning (Evidence-based Public Health and Health Economics; grant No. 15GWZK0901). The funding agency had no role in study design, data collection and analysis, decision to publish or preparation of the manuscript. The authors have no other relevant affiliations or financial involvement with any organization or entity with a financial interest in or financial conflict with the subject matter or materials discussed in the manuscript apart from those disclosed.
No writing assistance was utilized in the productionof this manuscript.
Ethical conduct of research
The authors state that they have obtained appropriate institutional review board approval or have followed the principles outlined in the Declaration of Helsinki for all human or animal experimental investigations. In addition, for investigations involving human subjects, informed consent has been obtained from the participants involved.
Supplementary Material
File (suppl_table_1.pdf)
- Download
- 48.90 KB
References
Papers of special note have been highlighted as: • of interest; •• of considerable interest
1.
GBD 2016 DALYs, HALE Collaborators. Global, regional and national disability-adjusted life-years (DALYs) for 333 diseases and injuries and healthy life expectancy (HALE) for 195 countries and territories, 1990–2016: a systematic analysis for the Global Burden of Disease Study 2016. Lancet 390(10100), 1260–1344 (2017).
2.
Wang L, Gao P, Zhang M et al. Prevalence and ethnic pattern of diabetes and prediabetes in China in 2013. JAMA 317(24), 2515–2523 (2017).
3.
Xu Y, Wang L, He J et al. Prevalence and control of diabetes in Chinese adults. JAMA 310(9), 948–959 (2013).
4.
Chan JC, Zhang Y, Ning G. Diabetes in China: a societal solution for a personal challenge. Lancet Diabetes Endocrinol. 2(12), 969–979 (2014).
5.
Wang H, Lin X, Zhang Z et al. The economic burden of inpatients with Type 2 diabetes: a case study in a Chinese hospital. Asia Pac. J. Public Health 27(Suppl. 2), 49S–54S (2015).
6.
Hu H, Sawhney M, Shi L et al. A systematic review of the direct economic burden of Type 2 diabetes in china. Diabetes Ther. 6(1), 7–16 (2015).
7.
Dakin HA, Devlin NJ, Odeyemi IA. ‘Yes’, ‘No’ or ‘Yes’, but multinomial modeling of NICE decision-making. Health Policy 77(3), 352–367 (2006).
8.
Palmer AJ, Clarke P, Gray A et al. Computer modeling of diabetes and its complications: a report on the Fifth Mount Hood challenge meeting. Value Health 16(4), 670–685 (2013).
• Systematic comparison and validation exercises, to identify important differences between models, address key methodological challenges and discuss avenues of research to improve future diabetes models.
9.
Becker C, Langer A, Leidl R. The quality of three decision-analytic diabetes models: a systematic health economic assessment. Expert Rev. Pharmacoecon. Outcomes Res. 11(6), 751–762 (2011).
10.
Kong AP, Xu G, Brown N, So WY, Ma RC, Chan JC. Diabetes and its comorbidities – where East meets West. Nat. Rev. Endocrinol. 9(9), 537–547 (2013).
• Discusses how rapid changes in technology and human behavior have brought on the global epidemic of metabolic diseases and suggests that solutions will be based on using system change, technology and behavioural strategies to combat this societal-turned medical problem.
11.
CDC Diabetes Cost-effectiveness Group. Cost–effectiveness of intensive glycemic control, intensified hypertension control and serum cholesterol level reduction for Type 2 diabetes. JAMA 287(19), 2542–2551 (2002).
12.
Zhou H, Isaman DJ, Messinger S et al. A computer simulation model of diabetes progression, quality of life and cost. Diabetes Care 28(12), 2856–2863 (2005).
13.
Palmer AJ, Roze S, Valentine WJ et al. The CORE diabetes model: projecting long-term clinical outcomes, costs and cost–effectiveness of interventions in diabetes mellitus (Types 1 and 2) to support clinical and reimbursement decision-making. Curr. Med. Res. Opin. 20(Suppl. 1), S5–S26 (2004).
14.
Lundqvist A, Steen CK, Johansen P, Andersson E, Willis M. Validation of the IHE Cohort Model of Type 2 Diabetes and the impact of choice of macrovascular risk equations. PloS ONE 9(10), e110235 (2014).
15.
Eddy DM, Hollingworth W, Caro JJ et al. Model transparency and validation: a report of the ISPOR-SMDM modeling good research practices task force-7. Med. Decis. Mak. 32(5), 733–743 (2012).
• Describes recommendations for achieving transparency and validation, developed by a task force.
16.
Basu S, Sussman JB, Berkowitz SA, Hayward RA, Yudkin JS. Development and validation of risk equations for complications of Type 2 diabetes (RECODe) using individual participant data from randomized trials. Lancet Diabetes Endocrinol. 5(10), 788–798 (2017).
• Developed and validated the risk equations for complications of Type 2 diabetes.
17.
Yang W, Lu J, Weng J et al. Prevalence of diabetes among men and women in China. N. Engl. J. Med. 362(12), 1090–1101 (2010).
18.
Bragg F, Holmes MV, Iona A et al. Association between diabetes and cause-specific mortality in rural and urban areas of China. JAMA 317(3), 280–289 (2017).
19.
Sun GZ, Guo L, Wang XZ et al. Prevalence of atrial fibrillation and its risk factors in rural China: a cross-sectional study. Int. J. Cardiol. 182, 13–17 (2015).
20.
Zhao S, Zhao H, Wang X et al. A prospective study investigating the causes of warfarin underutilization in Chinese patients. Int. J. Clin. Pharm. 38(5), 1286–1293 (2016).
21.
Ding L, Xu Y, Wang L et al. The cardiometabolic risk profile of Chinese adults with diabetes: a nationwide cross-sectional survey. J. Diabetes Complications 31(1), 43–52 (2017).
22.
Jia WP, Xiang KS, Chen L, Lu JX, Wu YM. Epidemiological study on obesity and its comorbidities in urban Chinese older than 20 years of age in Shanghai, China. Obes. Rev. 3(3), 157–165 (2002).
23.
Xu B, Sun J, Deng X et al. Low serum magnesium level is associated with microalbuminuria in Chinese diabetic patients. Int. J. Endocrinol. 2013, 580685(2013).
24.
Huo X, Gao L, Guo L et al. Risk of nonfatal cardiovascular diseases in early onset versus late-onset Type 2 diabetes in China: a cross-sectional study. Lancet Diabetes Endocrinol. 4(2), 115–124 (2016).
25.
Wan E, Fong D, Fung C et al. Prediction of new onset of end stage renal disease in Chinese patients with Type 2 diabetes mellitus: a population-based retrospective cohort study. BMC Nephrol. 18(1), 257 (2017).
26.
Chinese Society of Endocrinology. Expert consensus on the prevention and treatment of Chinese Type 2 diabetes with dyslipidemia (2017 revised version). Chinese J. Endocrinol. Metab. 33(11), 925–936 (2017).
27.
Heart Protection Study Collaborative Group. MRC/BHF heart protection study of cholesterol lowering with simvastatin in 20,536 high-risk individuals: a randomized placebo-controlled trial. Lancet 360(9326), 7–22 (2002).
28.
Task Group of the Chinese Guidelines for pharmacoeconomic evaluations. China guidelines for pharmacoeconomic evaluations. China J. Pharmaceut. Econ. 6(3), 7–48 (2011).
29.
Gerstein HC, Miller ME, Genuth S et al. Long-term effects of intensive glucose lowering on cardiovascular outcomes. N. Engl. J. Med. 364(9), 818–828 (2011).
30.
Wing RR, Bolin P, Brancati FL et al. Cardiovascular effects of intensive lifestyle intervention in Type 2 diabetes. N. Engl. J. Med. 369(2), 145–154 (2013).
31.
Perreault L, Pan Q, Mather KJ, Watson KE, Hamman RF, Kahn SE. Effect of regression from prediabetes to normal glucose regulation on long-term reduction in diabetes risk: results from the diabetes prevention program outcomes study. Lancet 379(9833), 2243–2251 (2012).
32.
Stehouwer C. New risk equations for complications of Type 2 diabetes are welcome, but a broader perspective is needed. Lancet Diabetes Endocrinol. 5(10), 759–761 (2017).
33.
Shi Z, Zhen S, Zimmet PZ et al. Association of impaired fasting glucose, diabetes and dietary patterns with mortality: a 10-year follow-up cohort in eastern China. ACTA Diabetol. 53(5), 799–806 (2016).
34.
Yang X, Ma RC, So WY et al. Development and validation of a risk score for hospitalization for heart failure in patients with Type 2 diabetes mellitus. Cardiovasc. Diabetol. 7, 9 (2008).
35.
Liu JJ, Lim SC, Yeoh LY et al. Ethnic disparities in risk of cardiovascular disease, end-stage renal disease and all-cause mortality: a prospective study among Asian people with Type 2 diabetes. Diabet Med. 33(3), 332–339 (2016).
36.
Wong CK, Wong WC, Wan YF et al. Patient empowerment programme in primary care reduced all-cause mortality and cardiovascular diseases in patients with Type 2 diabetes mellitus: a population-based propensity-matched cohort study. Diabetes Obes. Metab. 17(2), 128–135 (2015).
37.
Wan EY, Fong DY, Fung CS, Lam CL. Incidence and predictors for cardiovascular disease in Chinese patients with Type 2 diabetes mellitus: a population-based retrospective cohort study. J. Diabetes Complications 30(3), 444–450 (2016).
38.
Janssen KJ, Moons KG, Kalkman CJ, Grobbee DE, Vergouwe Y. Updating methods improved the performance of a clinical prediction model in new patients. J. Clin. Epidemiol. 61(1), 76–86 (2008).
•• Reported the methods that can be applied to adjust the model, rather than to develop a new model.
39.
McEwan P, Bennett H, Qin L, Bergenheim K, Gordon J, Evans M. An alternative approach to modeling HbA1c trajectories in patients with Type 2 diabetes mellitus. Diabetes Obes. Metab. 19(5), 628–634 (2017).
40.
Xue B, Head J, McMunn A. The associations between retirement and cardiovascular disease risk factors in China: a 20-year prospective study. Am. J. Epidemiol. 185(8), 688–696 (2017).
41.
Tielemans S, Geleijnse JM, Laughlin GA, Boshuizen HC, Barrett-Connor E, Kromhout D. Blood pressure trajectories in relation to cardiovascular mortality: the Rancho–Bernardo Study. J. Hum. Hypertens. 31(8), 515–519 (2017).
42.
Abbott RD, Sharp DS, Burchfiel CM et al. Cross-sectional and longitudinal changes in total and high-density lipoprotein cholesterol levels over a 20-year period in elderly men: the Honolulu heart program. Ann. Epidemiol. 7(6), 417–424 (1997).
43.
Loh TP, Ma S, Heng D, Khoo CM. Age-Related Changes in the cardiometabolic profiles in Singapore resident adult population: findings from the National Health Survey 2010. Plos ONE 11(8), e162102 (2016).
44.
Knopp RH, D'Emden M, Smilde JG, Pocock SJ. Efficacy and safety of atorvastatin in the prevention of cardiovascular end points in subjects with Type 2 diabetes: the Atorvastatin Study for Prevention of Coronary Heart Disease End Points in noninsulin-dependent diabetes mellitus (ASPEN). Diabetes Care 29(7), 1478–1485 (2006).
45.
Duckworth W, Abraira C, Moritz T et al. Glucose control and vascular complications in veterans with Type 2 diabetes. N. Engl. J. Med. 360(2), 129–139 (2009).
46.
Gerstein HC, Miller ME, Byington RP et al. Effects of intensive glucose lowering in Type 2 diabetes. N. Engl. J. Med. 358(24), 2545–2559 (2008).
47.
Kahn SE, Haffner SM, Heise MA et al. Glycemic durability of rosiglitazone, metformin or glyburide monotherapy. N. Engl. J. Med. 355(23), 2427–2443 (2006).
48.
Wing RR, Bolin P, Brancati FL et al. Cardiovascular effects of intensive lifestyle intervention in Type 2 diabetes. N. Engl. J. Med. 369(2), 145–154 (2013).
49.
Colhoun HM, Betteridge DJ, Durrington PN et al. Primary prevention of cardiovascular disease with atorvastatin in Type 2 diabetes in the Collaborative Atorvastatin Diabetes Study (CARDS): multicentre randomised placebo-controlled trial. Lancet 364(9435), 685–696 (2004).
50.
Intensive blood-glucose control with sulphonylureas or insulin compared with conventional treatment and risk of complications in patients with Type 2 diabetes (UKPDS 33). UK Prospective Diabetes Study (UKPDS) Group. Lancet 352(9131), 837–853 (1998).
51.
Holman RR, Paul SK, Bethel MA, Matthews DR, Neil HA. 10-year follow-up of intensive glucose control in Type 2 diabetes. N. Engl. J. Med. 359(15), 1577–1589 (2008).
52.
Woodward M, Patel A, Zoungas S et al. Does glycemic control offer similar benefits among patients with diabetes in different regions of the world: Results from the ADVANCE trial. Diabetes Care 34(12), 2491–2495 (2011).
53.
Chen J, Alemao E, Yin D, Cook J. Development of a diabetes treatment simulation model: with application to assessing alternative treatment intensification strategies on survival and diabetes-related complications. Diabetes Obes. Metab. 10(Suppl. 1), 33–42 (2008).
54.
Wan E, Fung C, Jiao FF et al. Five-year effectiveness of the multidisciplinary risk assessment and management program for primary care patients with Type 2 diabetes mellitus (RAMP-DM) on DM-related complications and health service use: a population-based and propensity-matched cohort study. Diabetes Care 41(1), 49–59 (2018).
55.
Jiao F, Fung CS, Wan YF et al. Effectiveness of the multidisciplinary risk assessment and management program for patients with diabetes mellitus (RAMP-DM) for diabetic microvascular complications: a population-based cohort study. Diabetes Metab. 42(6), 424–432 (2016).
56.
Sasaki A, Uehara M, Horiuchi N, Hasegawa K, Shimizu T A 15-year follow-up study of patients with noninsulin-dependent diabetes mellitus (NIDDM) in Osaka, Japan: factors predictive of the prognosis of diabetic patients. Diabetes Res. Clin. Pract. 36(1), 41–47 (1997).
57.
Ueshima K, Itoh H, Kanazawa N et al. Rationale and design of the standard versus intensive statin therapy for hypercholesterolemic patients with diabetic retinopathy (EMPATHY) study: a randomized controlled trial. J. Atheroscler. Thromb. 23(8), 976–990 (2016).
58.
Sone H, Tanaka S, Iimuro S et al. Long-term lifestyle intervention lowers the incidence of stroke in Japanese patients with Type 2 diabetes: a nationwide multicentre randomized controlled trial (the Japan Diabetes Complications Study). Diabetologia 53(3), 419–428 (2010).
59.
Araki A, Iimuro S, Sakurai T et al. Long-term multiple risk factor interventions in Japanese elderly diabetic patients: the Japanese Elderly Diabetes Intervention Trial–study design, baseline characteristics and effects of intervention. Geriatr. Gerontol. Int. 12(Suppl. 1), 7–17 (2012).
60.
Cushman WC, Evans GW, Byington RP et al. Effects of intensive blood-pressure control in Type 2 diabetes mellitus. N. Engl. J. Med. 362(17), 1575–1585 (2010).
61.
McEwan P, Ward T, Bennett H, Bergenheim K. Validation of the UKPDS 82 risk equations within the Cardiff diabetes model. Cost Eff. Resour. Alloc. 13, 12 (2015).
62.
McEwan P, Foos V, Palmer JL, Lamotte M, Lloyd A, Grant D. Validation of the IMS CORE diabetes model. Value Health 17(6), 714–724 (2014).
63.
Willis M, Johansen P, Nilsson A, Asseburg C. Validation of the economic and health outcomes model of Type 2 diabetes mellitus (ECHO-T2DM). Pharmacoeconomics 35(3), 375–396 (2017).
64.
Tanaka S, Tanaka S, Iimuro S et al. Predicting macro- and microvascular complications in Type 2 diabetes: the Japan Diabetes Complications Study/the Japanese Elderly Diabetes Intervention Trial risk engine. Diabetes Care 36(5), 1193–1199 (2013).
65.
Yang X, So WY, Kong AP et al. Development and validation of a total coronary heart disease risk score in Type 2 diabetes mellitus. Am. J. Cardiol. 101(5), 596–601 (2008).
66.
Charokopou M, Sabater FJ, Townsend R, Roudaut M, McEwan P, Verheggen BG. Methods applied in cost–effectiveness models for treatment strategies in Type 2 diabetes mellitus and their use in health technology assessments: a systematic review of the literature from 2008 to 2013. Curr. Med. Res. Opin. 32(2), 207–218 (2016).
67.
Yi Y, Philips Z, Bergman G, Burslem K. Economic models in Type 2 diabetes. Curr. Med. Res. Opin. 26(9), 2105–2118 (2010).
68.
Areosa SA, Vernooij RW, Gonzalez-Colaco HM, Martinez G. Effect of the treatment of Type 2 diabetes mellitus on the development of cognitive impairment and dementia. Cochrane Database Syst. Rev. 6, D3804 (2017).
69.
Biessels GJ, Staekenborg S, Brunner E, Brayne C, Scheltens P. Risk of dementia in diabetes mellitus: a systematic review. Lancet Neurol. 5(1), 64–74 (2006).
70.
Noto H, Goto A, Tsujimoto T, Noda M. Cancer risk in diabetic patients treated with metformin: a systematic review and meta-analysis. PLoS ONE 7(3), e33411 (2012).
71.
Cai X, Hu D, Pan C et al. I ndependent predictors of cardiovascular disease (CVD) events identified in a cohort of Type 2 diabetes (T2D) patients in China. Diabetes 641, A387 (2015).
Information & Authors
Information
Published In
Pages: 749 - 763
PubMed: 30132342
Copyright
© 2018 Future Medicine Ltd.
History
Received: 2 January 2018
Accepted: 19 April 2018
Published online: 22 August 2018
Keywords:
Topics
Authors
Metrics & Citations
Metrics
Article Usage
Article usage data only available from February 2023. Historical article usage data, showing the number of article downloads, is available upon request.
Citations
How to Cite
Development and validation of a Health Policy Model of Type 2 diabetes in Chinese setting. (2018) Journal of Comparative Effectiveness Research. DOI: 10.2217/cer-2018-0001
Export citation
Select the citation format you wish to export for this article or chapter.
Citing Literature
- Kristoffer Nilsson, Adam Fridhammar, Riku Ota, Morten Sall Jensen, Michael Willis, Sofie Persson, Validation of the IHE type 2 diabetes cohort model in the Japanese clinical setting, Journal of Medical Economics, 10.1080/13696998.2025.2517506, 28, 1, (944-963), (2025).
- Eric S.H. Lau, Andrea O.Y. Luk, Lee-Ling Lim, Hongjiang Wu, Aimin Yang, Alice P.S. Kong, Ronald C.W. Ma, Risa Ozaki, Elaine Y.K. Chow, Chiu-Chi Tsang, Chun-Kwun O, Amy Fu, Edward W. Gregg, Philip Clarke, Wing-Yee So, Juliana N.M. Lui, Juliana C.N. Chan, Development and Validation of the Patient-Level Chinese Diabetes Outcome Model on Long-term Complications in Type 2 Diabetes: An Application of the Hong Kong Diabetes Register, Diabetes Care, 10.2337/dca24-0069, 48, 4, (579-587), (2025).
- Mari Pesonen, Virpi Jylhä, Eila Kankaanpää, Adverse drug events in cost-effectiveness models of pharmacological interventions for diabetes, diabetic retinopathy, and diabetic macular edema: a scoping review, JBI Evidence Synthesis, 10.11124/JBIES-23-00511, 22, 11, (2194-2266), (2024).
- Zixuan He, Xianqin Huang, Dingyi Chen, Guoan Wang, Yuezhen Zhu, Huangqianyu Li, Sheng Han, Luwen Shi, Xiaodong Guan, Sponsorship bias in published pharmacoeconomic evaluations of national reimbursement negotiation drugs in China: a systematic review, BMJ Global Health, 10.1136/bmjgh-2023-012780, 8, 11, (e012780), (2023).
- Marina Antoniou, Céu Mateus, Bruce Hollingsworth, Andrew Titman, A Systematic Review of Methodologies Used in Models of the Treatment of Diabetes Mellitus, PharmacoEconomics, 10.1007/s40273-023-01312-4, 42, 1, (19-40), (2023).
- Henrik Vitus Bering Laursen, Emmelie Ploug Jørgensen, Peter Vestergaard, Lars Holger Ehlers, A Systematic Review of Cost-Effectiveness Studies of Newer Non-Insulin Antidiabetic Drugs: Trends in Decision-Analytical Models for Modelling of Type 2 Diabetes Mellitus, PharmacoEconomics, 10.1007/s40273-023-01268-5, 41, 11, (1469-1514), (2023).
- Xinyu Li, Fang Li, Junfeng Wang, Anoukh van Giessen, Talitha L. Feenstra, Prediction of complications in health economic models of type 2 diabetes: a review of methods used, Acta Diabetologica, 10.1007/s00592-023-02045-8, 60, 7, (861-879), (2023).
- Elton Mukonda, Susan Cleary, Maia Lesosky, A review of simulation models for the long-term management of type 2 diabetes in low-and-middle income countries, BMC Health Services Research, 10.1186/s12913-021-07324-0, 21, 1, (2021).
- Wen-Qiang Lin, Zhong-jie Cai, Tingting Chen, Mao-Bai Liu, Na Li, Bin Zheng, Cost-Effectiveness of Dipeptidylpeptidase-4 Inhibitors Added to Metformin in Patients With Type 2 Diabetes in China, Frontiers in Endocrinology, 10.3389/fendo.2021.684960, 12, (2021).
- Jiayu Li, Yun Bao, Xuedi Chen, Limin Tian, Decision models in type 2 diabetes mellitus: A systematic review, Acta Diabetologica, 10.1007/s00592-021-01742-6, 58, 11, (1451-1469), (2021).