Impact of comparative effectiveness research on Medicare coverage of direct oral anticoagulants
Publication: Journal of Comparative Effectiveness Research
Abstract
Aim: To evaluate the association of comparative effectiveness research with Medicare coverage of direct oral anticoagulants. Materials & methods: A literature review for direct oral anticoagulants was conducted from 2011 to 2017. Monthly prescription drug plan and formulary files (n = 28) were used to conduct change-point analysis and assess each outcome variable. Results: Up to 2013, studies showed that dabigatran was more effective than rivaroxaban. In 2015, apixaban was shown to be the safest and most effective drug in comparison with all direct oral anticoagulants. In 2016–2017, dabigatran and apixaban were shown to have similar efficacy. Approximately 75% of plans covered dabigatran under tier 3 until 2015. From 2011 to 2017, less than 30% of plans required prior authorizations, 50% imposed quantity limits and mean copayment was lowest for rivaroxaban. Conclusion: Consistent with comparative effectiveness research, Medicare plans covered apixaban more favorably and edoxaban less favorably. However, discrepancies in comparative effectiveness research translation were found for rivaroxaban and dabigatran.
There is a growing emphasis on generating comparative effectiveness research (CER) [1], which compares the benefits and harms of different drugs and helps ascertain the value of new drug therapies. Past research has shown that CER can assist patients, providers and payers in quantifying the value of healthcare and help them make informed clinical decisions [2,3]. However, it is extremely challenging for the US healthcare system to integrate CER evidence into practice, especially with regard to the Medicare system, which currently serves 59 million beneficiaries [4–7]. Although integrating CER into Medicare coverage/reimbursement decisions is crucial [8,9], there is still limited knowledge regarding the extent to which CER evidence is incorporated by the Centers for Medicare and Medicaid Services (CMS) [2,9].
US decision makers struggle to uniformly evaluate CER evidence because it is generated from diverse study designs, including meta-analyses and systematic reviews, indirect treatment comparisons, randomized controlled trials and observational studies [10]. Consolidation of CER evidence is required before it can guide value-based treatment decisions and help improve health outcomes or contain costs for the Medicare population.
One of the most costly and prevalent diseases in the Medicare system is atrial fibrillation (AFib), which is associated with over 99,000 deaths and 467,000 hospitalizations annually [11,12]. AFib's high economic and healthcare utilization burden is due to the high stroke rates associated with it [13], with 95% of strokes occurring in non-valvular AFib (NVAF) patients [12]. Clinical guidelines recommend using direct oral anticoagulants (DOACs) to prevent stroke in NVAF patients [14]. Currently, dabigatran, rivaroxaban, apixaban and edoxaban, the four DOACs approved in the USA, are prescribed heavily for stroke prevention among the Medicare population [15–19]. Abundant CER has been generated comparing the benefits and harms of DOACs [20–25]; however, the extent to which such evidence might guide the coverage decisions of Medicare Part D plans has yet to be explored.
Four hallmark clinical trials have been conducted to assess the safety and efficacy of each DOAC. However, the trials were designed in a way that fails to provide any evidence about the comparability of DOACs to each other in the real world [26,27]. The RE-LY trial found dabigatran 150 mg to be superior and dabigatran 110 mg to be noninferior to warfarin with regard to stroke and systemic embolism (SE). The rate of major bleeding and hemorrhagic stroke was superior for both doses of dabigatran compared with warfarin [28]. In the ARISTOTLE trial, apixaban decreased risk of stroke and SE and risk of major bleeding and death from any cause compared with warfarin [29]. The ROCKET-AF trial found rivaroxaban to be noninferior to warfarin with regard to stroke or SE, with no difference in major or clinically relevant nonmajor bleeding. There was a reduction in intracranial bleeding (ICB) and an increase in gastrointestinal bleeding with rivaroxaban versus warfarin [30]. The ENGAGE AF-TIMI 48 trial favored edoxaban 60-mg doses compared with warfarin for reduction of stroke, SE and rates of major bleeding [31]. Although the trial results might help shape the decision-making process early on, the patients assessed in these studies were varied and may not have represented the real world. ROCKET-AF patients had higher baseline CHADS2 (congestive heart failure, hypertension, age ≥75, diabetes, stroke) scores than those observed in the RE-LY and ARISTOTLE trials. Additionally, ROCKET-AF patients receiving warfarin spent less time with international normalized ratio in the therapeutic range than warfarin patients in the RE-LY and ARISTOTLE trials [32].
Given the limitations of clinical trials, CER evidence acts as a tool to assist providers and payers as they strive to make evidence-based, informed clinical decisions. However, the extent to which CER evidence is translated into practice is under studied.
The overall objective of this study was to assess the extent to which CER evidence generated for DOACs was integrated into the coverage decisions of Medicare plans. The time frame used for this study was 2011–2017, as all DOACs were approved within or before this time period (i.e., dabigatran in October 2010, rivaroxaban in November 2011, apixaban in December 2012 and edoxaban in January 2015). The first aim of this study was to conduct a comprehensive literature search to identify CER evidence published from 2011 to 2017 comparing the effectiveness of two or more DOACs. The second aim of this study was to examine formulary characteristics and cost-sharing structures of Medicare Part D plans in CMS data from 2011 to 2017 and determine whether CER results were reflected in the coverage of DOACs.
Materials & methods
Data
Two kinds of data were examined for this study: CER evidence and monthly prescription drug plan and formulary files from CMS. CER evidence comparing DOACs, including meta-analyses and systematic reviews, indirect treatment comparisons, randomized controlled trials and observational studies, was identified by conducting a comprehensive literature review from 2011 to 2017 using PubMed and Google Scholar. Inclusion criteria for the literature review involved studies conducting head-to-head comparisons of two or more DOACs; efficacy outcomes with regard to the risk of stroke and SE; safety outcomes with regard to mortality, ICB, extracranial bleeding and gastrointestinal bleeding; adherence and persistence outcomes, such as proportion of days covered; and studies conducted on the US adult population. The study selection criteria are outlined in Figure 1.
The quality, validity and generalizability of all included studies were evaluated using a CER tool published by Schaumberg et al. [33]. The tool is designed to evaluate key characteristics of a CER study under three broad sections: importance of the research question, appropriateness of the data source and rigor of the study methods. Each study is rated on a scale of low, medium or high level of adherence to the key methodological principles. Monthly prescription drug plan and formulary files were obtained from CMS for four specific months (January, April, July and October) in each year, from 2011 to 2017, which resulted in a total of 28 data points. Prescription drug plan and formulary files are non-identifiable data files that contain details for each plan, including National Drug Codes; cost-sharing tier level; indicators for step therapy; quantity limits; prior authorization; plan name; plan identifier; service area and plan-level cost-sharing details for preferred, non-preferred and mail order network pharmacies.
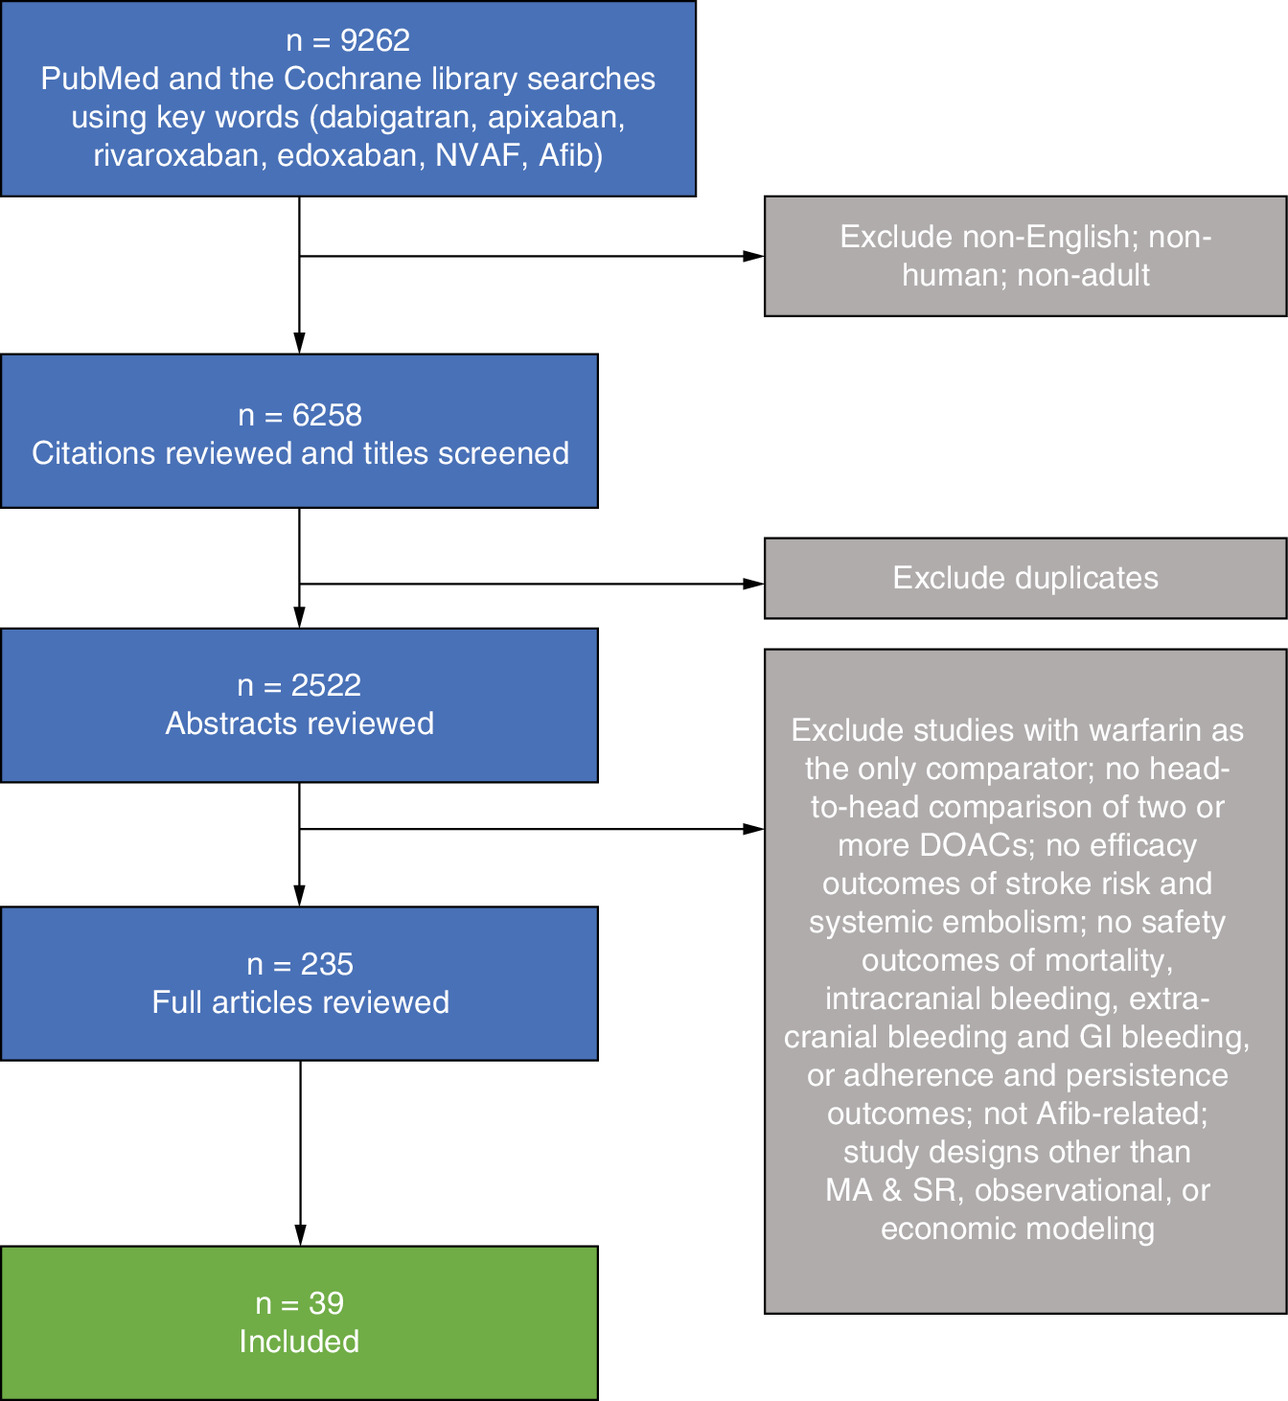
Figure 1. Search strategy for identifying comparative effectiveness research literature from 2011 to 2017.
Afib: Atrial fibrillation; DOAC: Direct oral anticoagulant; GI: Gastrointestinal; MA&SR: Meta-analysis and systematic review; NVAF: non-valvular atrial fibrillation.
Variables
The outcome variables evaluated included tier levels (1–4), quantity limits (yes or no), prior authorization (yes or no), type of cost sharing at preferred pharmacies (0 = not offered, 1 = copay or 2 = coinsurance) and amount of cost sharing at preferred pharmacies (in dollars if the type of cost sharing = 1 or in percentages if the type of cost sharing = 2).
Statistical analysis
Descriptive statistics were conducted for each outcome variable with regard to each DOAC from 2011 to 2017. Significant changes in time series data mean and percentage were identified by a change-point analysis (CPA) performed using a binary segmentation (BinSeg) method with the ‘changepoint’ package in R 3.4.3 [34–38]. CPA has been widely used in various fields to estimate the number of significant changes and identify the locations of change points in time series data [39]. For the purpose of this study, BinSeg and pruned exact linear time (PELT) algorithms were compared and tested with Schwarz information criterion as the penalty criterion using the ‘changepoint’ package in R. For cases with a high number of change points, the penalty was increased to ‘1.5 * log(n)’ with ‘n’ as the length of the time series dataset [37]. Comparing BinSeg and PELT helped ascertain PELT's likeliness to overestimate the number of change points; therefore, BinSeg was chosen to conduct the CPA for this study [40]. Past research also supports the implementation of BinSeg over PELT for better performance [41] and computational efficiency [42] in univariate time series data. CPA was conducted using the monthly files to assess changes in each outcome variable from 2011 to 2017. Associations between CER evidence and change points in outcome variables of the monthly files were evaluated.
Results
CER evidence
Table 1 outlines the summarized results of all included studies by each year. Key characteristics of all included studies are described in Supplementary Appendix 1. The authors noted a lack of studies comparing DOACs head to head in 2011 and 2012. According to the evidence from 2013, apixaban was associated with lower risk of major bleeding compared with dabigatran and rivaroxaban. Additionally, apixaban was found to be the most cost-effective among all DOACs. No significant differences were reported for DOACs with regard to risk of stroke, SE or mortality. In 2014, studies showed that the risk of major bleeding was lower with edoxaban 60 mg compared with rivaroxaban but higher compared with apixaban. Additionally, the risk of stroke/SE was higher for both edoxaban 60 mg and rivaroxaban compared with dabigatran 150 mg. The studies published in 2015 found that dabigatran 150 mg was associated with lower rates of stroke/SE and had the highest performance score with regard to preventing primary stroke compared with other DOACs. Apixaban continued to be associated with a lower risk of major bleeding and lower discontinuation rates compared with other DOACs. Rivaroxaban was reported to be associated with a higher risk of major bleeding compared with dabigatran 110 mg and edoxaban 30 mg. Edoxaban 30 mg was found to be inferior to other DOACs in terms of stroke/SE. Additionally, the likelihood of patients to be adherent, persistent and have proportion of days covered ≥0.80 was significantly higher for rivaroxaban compared with dabigatran. According to the evidence from 2016, no significant differences were found in stroke/SE, ischemic stroke or hemorrhagic stroke for dabigatran, apixaban and rivaroxaban. Among all DOACs, the risk of both major bleeding and ICB was lowest for apixaban and highest for rivaroxaban. Additionally, rivaroxaban was associated with higher risk of bleed-related readmission rates, all-cause readmission length of stay and readmission cost per patient compared with dabigatran. In 2017, studies continued to report no significant differences in stroke/SE for all DOACs. Apixaban was found to be associated with a lower risk of major bleeding than rivaroxaban but was shown to have a risk similar to that associated with dabigatran. Rivaroxaban was associated with a higher risk of other thromboembolic events, all-cause mortality, major bleeding, any bleeding event and gastrointestinal bleeding compared with dabigatran.
| Year | Descriptive summary | Ref. |
|---|---|---|
| 2012 | There was a lack of head-to-head comparisons of DOACs for 2011 and 2012; however, six indirect treatment analyses were published in 2012. One study reported that, compared with rivaroxaban, dabigatran was associated with a lower risk of stroke or SE, ischemic stroke and hemorrhagic stroke. Compared with rivaroxaban, apixaban was associated with an increased risk of SE but a decreased risk of major bleeding. Apixaban was associated with a lower risk of both major bleeding and GI bleeding compared with dabigatran. Similarly, another indirect comparison of phase III trials found rivaroxaban to be less effective than dabigatran 150 mg and to have more associated bleeding events. Two other studies, an NMA and an indirect comparison, found no statistically significant difference among DOACs with regard to all-cause mortality and stroke/SE, respectively. Another study that focused on secondary prevention found a lower risk of myocardial infarction with apixaban compared with dabigatran 150 mg. Another indirect treatment analysis found a significantly lower risk of stroke/SE and hemorrhagic stroke for dabigatran 150 mg compared with rivaroxaban. Moreover, major bleeding was significantly lower with apixaban compared with dabigatran 150 mg and rivaroxaban. | [21,22,42–45] |
| 2013 | Of the six studies included in 2013, two MA&SRs reported that apixaban was associated with significantly lower rates of major bleeding compared with dabigatran and rivaroxaban. However, the third MA came to a different conclusion, as it found no statistically significant difference among DOACs with regard to stroke, mortality or major bleeding and nonmajor bleeding events. A cost–effectiveness model found that dabigatran, apixaban and rivaroxaban produced greater QALYs than warfarin but only apixaban was cost-effective, with a threshold of US$100,000 per QALY. Another SR of cost–effectiveness models found dabigatran 110 mg to not be cost-effective compared with rivaroxaban or apixaban and rivaroxaban to not be cost-effective compared with apixaban. In contrast, another comparative effectiveness study found no difference among DOACs with regard to QALYs gained. | [32,46–50] |
| 2014 | Of the five studies included in 2014, four were MA&SRs. One MA&SR used a random effects model to rank all four DOAC therapies. Dabigatran was associated with the lowest risk of mortality and lowest ischemic stroke and SE score. Dabigatran 150 mg was associated with a 70% probability of being ranked 1 for stroke outcome and a 51% probability of being ranked 1 for ischemic stroke or SE outcome. Another MA&SR found that edoxaban 60 mg was associated with a lower risk of major bleeding compared with rivaroxaban but a higher risk of any bleed compared with apixaban. In addition, a higher risk of stroke/SE was observed in rivaroxaban versus dabigatran and edoxaban 30 mg versus apixaban. Another MA&SR found that apixaban was associated with lower major or CRNM bleeding risk than edoxaban 60 mg. Furthermore, edoxaban 60 mg was associated with decreased efficacy with regard to stroke or SE end points compared with dabigatran 150 mg. An indirect comparison study showed that edoxaban 30 mg was associated with a significantly decreased risk of major bleeding compared with other DOACs and could be an alternative for patients with a high bleeding risk. A modeling study reported apixaban as the most cost-effective option, with a cost of £13,703 per QALY gained or higher. | [25,51–54] |
| 2015 | In 2015, seven studies were included. In an NMA, dabigatran 150 mg had lower rates of stroke and SE versus dabigatran 110 mg, rivaroxaban and apixaban. With regard to major bleeding, apixaban was favorable compared with dabigatran 150 mg and rivaroxaban. Rates of ICB were lowest with dabigatran 110 mg and apixaban. By contrast, another MA&SR, which evaluated 21 RCTs and 11 NRSs, found no difference in stroke or SE among DOACs. However, with regard to major bleeding, apixaban was associated with a lower risk versus dabigatran 150 mg and rivaroxaban. Additionally, rivaroxaban was associated with a higher risk of major bleeding compared with dabigatran 110 mg. In the elderly (≥75 years old), apixaban had lower rates of major bleeding than dabigatran 110 mg, dabigatran 150 mg and rivaroxaban. In the same elderly group, edoxaban showed lower rates of major bleeding than dabigatran 150 mg and rivaroxaban. A third MA&SR, which evaluated nine RCTs, came to a similar conclusion regarding bleeding risk. Apixaban had lower rates of major bleeding compared with dabigatran 110 mg, dabigatran 150 mg and rivaroxaban and edoxaban 30 mg had lower rates of major bleeding compared with dabigatran (both doses), rivaroxaban and edoxaban 60 mg. With regard to stroke and SE, edoxaban 30 mg was inferior to apixaban, rivaroxaban and dabigatran 150 mg. Another MA found that apixaban had the lowest discontinuation rate compared with edoxaban 60 mg, rivaroxaban, dabigatran 150 mg and dabigatran 110 mg. An observational study found that the number of patients with proportion of days covered ≥0.80 was significantly higher for rivaroxaban versus dabigatran. In addition, compared with apixaban, the likelihood of being adherent was significantly higher for rivaroxaban and lower for dabigatran. Another observational study supported these results, concluding that rivaroxaban patients were less likely to be inconsistent and less likely to discontinue therapy than their dabigatran counterparts. Finally, in a multicriteria decision analysis study dabigatran 150 mg had the highest overall benefit–risk performance score (0.529), followed by rivaroxaban (0.462), apixaban (0.426) and warfarin (0.191), among the general population. Apixaban had the highest benefit–risk performance score (0.686) for patients with CHADS2 score ≥3 and dabigatran 150 mg had the highest performance score (0.678) for primary stroke prevention. Moreover, dabigatran 110 mg had the highest performance score (0.901) for secondary stroke prevention. | [55–61] |
| 2016 | In 2016, of the seven studies, two NMAs reported similar results. One NMA reported no differences among DOACs with regard to ischemic stroke rate. However, lower rates of major bleeding were found in apixaban versus other DOACs. Apixaban was found to be superior to other DOACs with regard to major bleeding and CRNM bleeding composite end point. The other NMA found a lower risk of stroke or SE for apixaban, dabigatran, rivaroxaban and edoxaban 60 mg compared with edoxaban 30 mg. In addition, apixaban and edoxaban 30 mg were associated with lower risk of bleeding compared with dabigatran and rivaroxaban. Rivaroxaban was associated with the highest risk of CRNM bleeding compared with other DOACs. Of the remaining five observational studies, two used the Truven MarketScan database, one used Optum, one used CMS Medicare data and one used Premier Hospital and Cerner Health data. Both Truven studies found a higher risk of bleeding with rivaroxaban compared with apixaban, but no differences were observed with regard to apixaban and dabigatran. The study assessing Optum data found no significant differences in risk of stroke or SE and ischemic or hemorrhagic stroke between any of the DOACs. Rivaroxaban was associated with a higher risk of both major bleeding and ICB compared with dabigatran. Apixaban was associated with a lower risk of both major bleeding and ICB compared with dabigatran and rivaroxaban. The study using Medicare data found that rivaroxaban use was associated with a statistically significant increase in ICB and major extracranial bleeding compared with dabigatran. The study using Premier Hospital and Cerner Health data found that the risks of bleeding-related hospital readmission, all-cause readmission length of stay and all-cause readmission cost per patient were significantly higher for rivaroxaban compared with apixaban. | [62–68] |
| 2017 | Eight studies were included in 2017, of which three were MA&SRs and five were observational studies. One MA&SR found that rivaroxaban was associated with a similar risk of stroke or thromboembolism and ICB compared with dabigatran but a higher risk of major bleeding, all-cause mortality, any bleeding and GI bleeding. Another MA&SR found that apixaban had a similar risk of stroke or thromboembolism compared with other DOACs. Apixaban was associated with a lower risk of major bleeding compared with rivaroxaban but demonstrated a risk similar to that of dabigatran. In addition, similar risks of ischemic stroke, ICB and GI bleeding were found between apixaban, rivaroxaban and dabigatran. Similar to the other studies, the third MA&SR reported apixaban as being superior to other DOACs with regard to risk of major bleeding, GI bleeding and any bleeding. Regarding the risk of stroke or any thromboembolic event, no difference was reported between apixaban and dabigatran, but rivaroxaban was reported to be superior to apixaban, mainly due to the reduced dose subgroup. With regard to ICB, no difference was reported between dabigatran and apixaban, but apixaban was superior to rivaroxaban. Of the five observational studies, two were conducted using CMS Medicare data, one used Truven MarketScan, one used Humana and one used VA healthcare data. A study using Medicare data found that risk of ischemic stroke and ICB was no different between rivaroxaban and dabigatran. However, rivaroxaban was associated with a higher risk of other thromboembolic events, all-cause mortality, major bleeding, any bleeding event and GI bleeding compared with dabigatran. Similar to the aforementioned results, the study using Truven data also reported no significant differences in risk of ischemic stroke and ICB for rivaroxaban and dabigatran but a higher risk of GI bleeding for rivaroxaban versus dabigatran. The study using Medicare data found no significant differences in risk of ischemic stroke, SE or death between any of the DOACs. With regard to any bleeding and GI bleeding, no difference was found in apixaban versus dabigatran; however, apixaban and dabigatran were associated with lower bleeding risk compared with rivaroxaban. The study using Humana data found no significant differences in apixaban and dabigatran in terms of stroke, including ischemic, hemorrhagic and SE, or any major bleeding, including ICB and GI bleeding. However, the study found a lower risk of stroke/SE and any bleed in apixaban patients compared with rivaroxaban patients. Finally, the study using VA data found that lower adherence over the first 6 months for dabigatran patients was significantly associated with a higher risk of death or stroke, but this association was not significant for rivaroxaban. | [69–76] |
CHADS2: Congestive heart failure, hypertension, age ≥75, diabetes, stroke (doubled); CMS: Centers for Medicare and Medicaid Services; CRNM: Clinically relevant nonmajor; DOAC: Direct oral anticoagulant; GI: Gastrointestinal; ICB: Intracranial bleeding; MA: Meta-analysis; MA&SR: Meta-analysis and systematic review; NMA: Network meta-analysis; NRSs: Nonrandomized studies; QALY: Quality-adjusted life year; RCTs: Randomized controlled trials; SE: Systemic embolism; SR: Systematic review; VA: Veterans Affairs.
The CER tool was used to assess the quality of evidence included in this study. The CER tool rating key methodological principles of the included studies is outlined in Table 2. Approximately 62% of the studies never had a ‘low’ grading on any of the key principles assessed. All studies were graded ‘high’ on at least five of ten key characteristics. Approximately 45% of the studies were graded ‘high’ on eight of ten key characteristics.
| Study no. | Author, year | Importance of research question | Appropriateness of data source | Rigor of study methods | Ref. | |||||||
|---|---|---|---|---|---|---|---|---|---|---|---|---|
| Are the right patients being studied? | Are the right treatments being studied? | Are the right outcomes being studied? | Is the right timing being used for the study? | Does the data source meet the needs of the study aims? | Does the study include a sufficient number of patients to ensure statistical power to address a clinically meaningful effect size? | Does the study methodology target new initiators of treatment? | Are the comparator cohorts included in the study from the same time period as the main intervention? | Does the analysis include careful consideration and application of appropriate techniques to control for potential bias? | Are sensitivity analyses performed to assess robustness of the findings? | |||
| 1 | Baker, 2012 | High | High | High | Medium | High | Medium | High | Medium | Medium | Low | [42] |
| 2 | Mantha, 2012 | High | High | High | Medium | High | Medium | High | Medium | Medium | Low | [22] |
| 3 | Harenberg, 2012 | High | High | High | Medium | High | Medium | High | Medium | Medium | Low | [21] |
| 4 | Schneeweiss, 2012 | High | High | High | Medium | High | Medium | High | Medium | Medium | High | [43] |
| 5 | Rasmussen, 2012 | High | High | High | Medium | High | Medium | High | Medium | Medium | High | [44] |
| 6 | Lip, 2012 | High | High | High | Medium | High | Medium | High | Medium | Medium | Low | [45] |
| 7 | Mitchell, 2013 | High | High | High | Medium | High | Medium | High | Medium | Medium | High | [46] |
| 8 | Sardar, 2013 | High | High | High | Medium | High | Medium | High | Medium | High | High | [47] |
| 9 | Assiri, 2013 | High | High | High | Medium | High | Medium | High | Medium | Medium | Low | [48] |
| 10 | Canestaro, 2013 | High | High | High | High | High | Medium | High | High | High | High | [49] |
| 11 | Pink, 2013 | High | High | High | High | High | Medium | High | High | High | High | [50] |
| 12 | Limone, 2013 | High | High | High | High | High | Medium | High | High | Medium | High | [32] |
| 13 | Skjoth, 2014 | High | High | High | High | High | Medium | High | High | Medium | Low | [25] |
| 14 | Dogliotti, 2014 | High | High | High | Medium | High | Medium | High | High | High | High | [51] |
| 15 | Fu, 2014 | High | High | High | Medium | High | Medium | High | High | Medium | Low | [52] |
| 16 | Verdecchia, 2014 | High | High | High | Medium | High | Medium | High | High | Medium | Low | [53] |
| 17 | Pink, 2014 | Medium | High | Medium | High | High | High | High | High | High | High | [54] |
| 18 | Cope, 2015 | High | High | High | High | High | Medium | High | High | High | High | [55] |
| 19 | Lin, 2015 | High | High | High | High | High | High | High | High | Medium | High | [56] |
| 20 | Morimoto, 2015 | High | High | High | Medium | High | Medium | High | High | Medium | High | [57] |
| 21 | Komocsi, 2015 | High | High | High | Medium | High | Medium | High | High | Low | Low | [58] |
| 22 | Crivera, 2015 | High | High | High | High | High | Medium | High | High | High | Low | [59] |
| 23 | Nelson, 2015 | High | High | High | High | High | High | High | High | High | Low | [60] |
| 24 | Hsu, 2015 | High | High | High | High | High | High | High | High | High | High | [61] |
| 25 | Bajaj, 2016 | High | High | High | Medium | High | Medium | High | High | Medium | Low | [62] |
| 26 | Lip, 2016i | Medium | High | High | High | High | High | High | High | High | High | [63] |
| 27 | Lip, 2016ii | High | High | High | Medium | High | Medium | High | High | Medium | High | [64] |
| 28 | Lip, 2016iii | High | High | High | High | High | High | High | High | High | High | [65] |
| 29 | Noseworthy, 2016 | High | High | High | High | High | High | High | High | High | High | [66] |
| 30 | Graham, 2016 | High | High | High | Medium | High | Medium | Medium | High | High | High | [67] |
| 31 | Deitelzweig, 2016 | High | High | High | Medium | High | Medium | Medium | High | High | High | [68] |
| 32 | Bai, 2017i | Low | High | High | Low | High | Medium | Low | High | Medium | High | [69] |
| 33 | Bai, 2017ii | Low | High | High | High | High | Medium | Medium | High | Medium | Low | [70] |
| 34 | Proietti, 2017 | High | High | High | High | High | Medium | Medium | High | High | Medium | [71] |
| 35 | Deitelzweig, 2017 | High | High | High | High | High | Medium | High | High | High | Medium | [75] |
| 36 | Norby, 2017 | High | Medium | High | High | High | Medium | High | High | High | High | [73] |
| 37 | Hernandez, 2017i | High | Medium | High | High | High | Medium | High | High | High | High | [72] |
| 38 | Hernandez, 2017ii | High | High | High | High | High | Medium | High | High | High | Medium | [74] |
| 39 | Borne, 2017 | High | Medium | Medium | High | High | Medium | Low | High | High | Low | [76] |
Each study was rated based on a scale of low, medium or high level of adherence to key methodological principles using the comparative effectiveness research tool [33].
CPA of DOAC coverage by Medicare plan
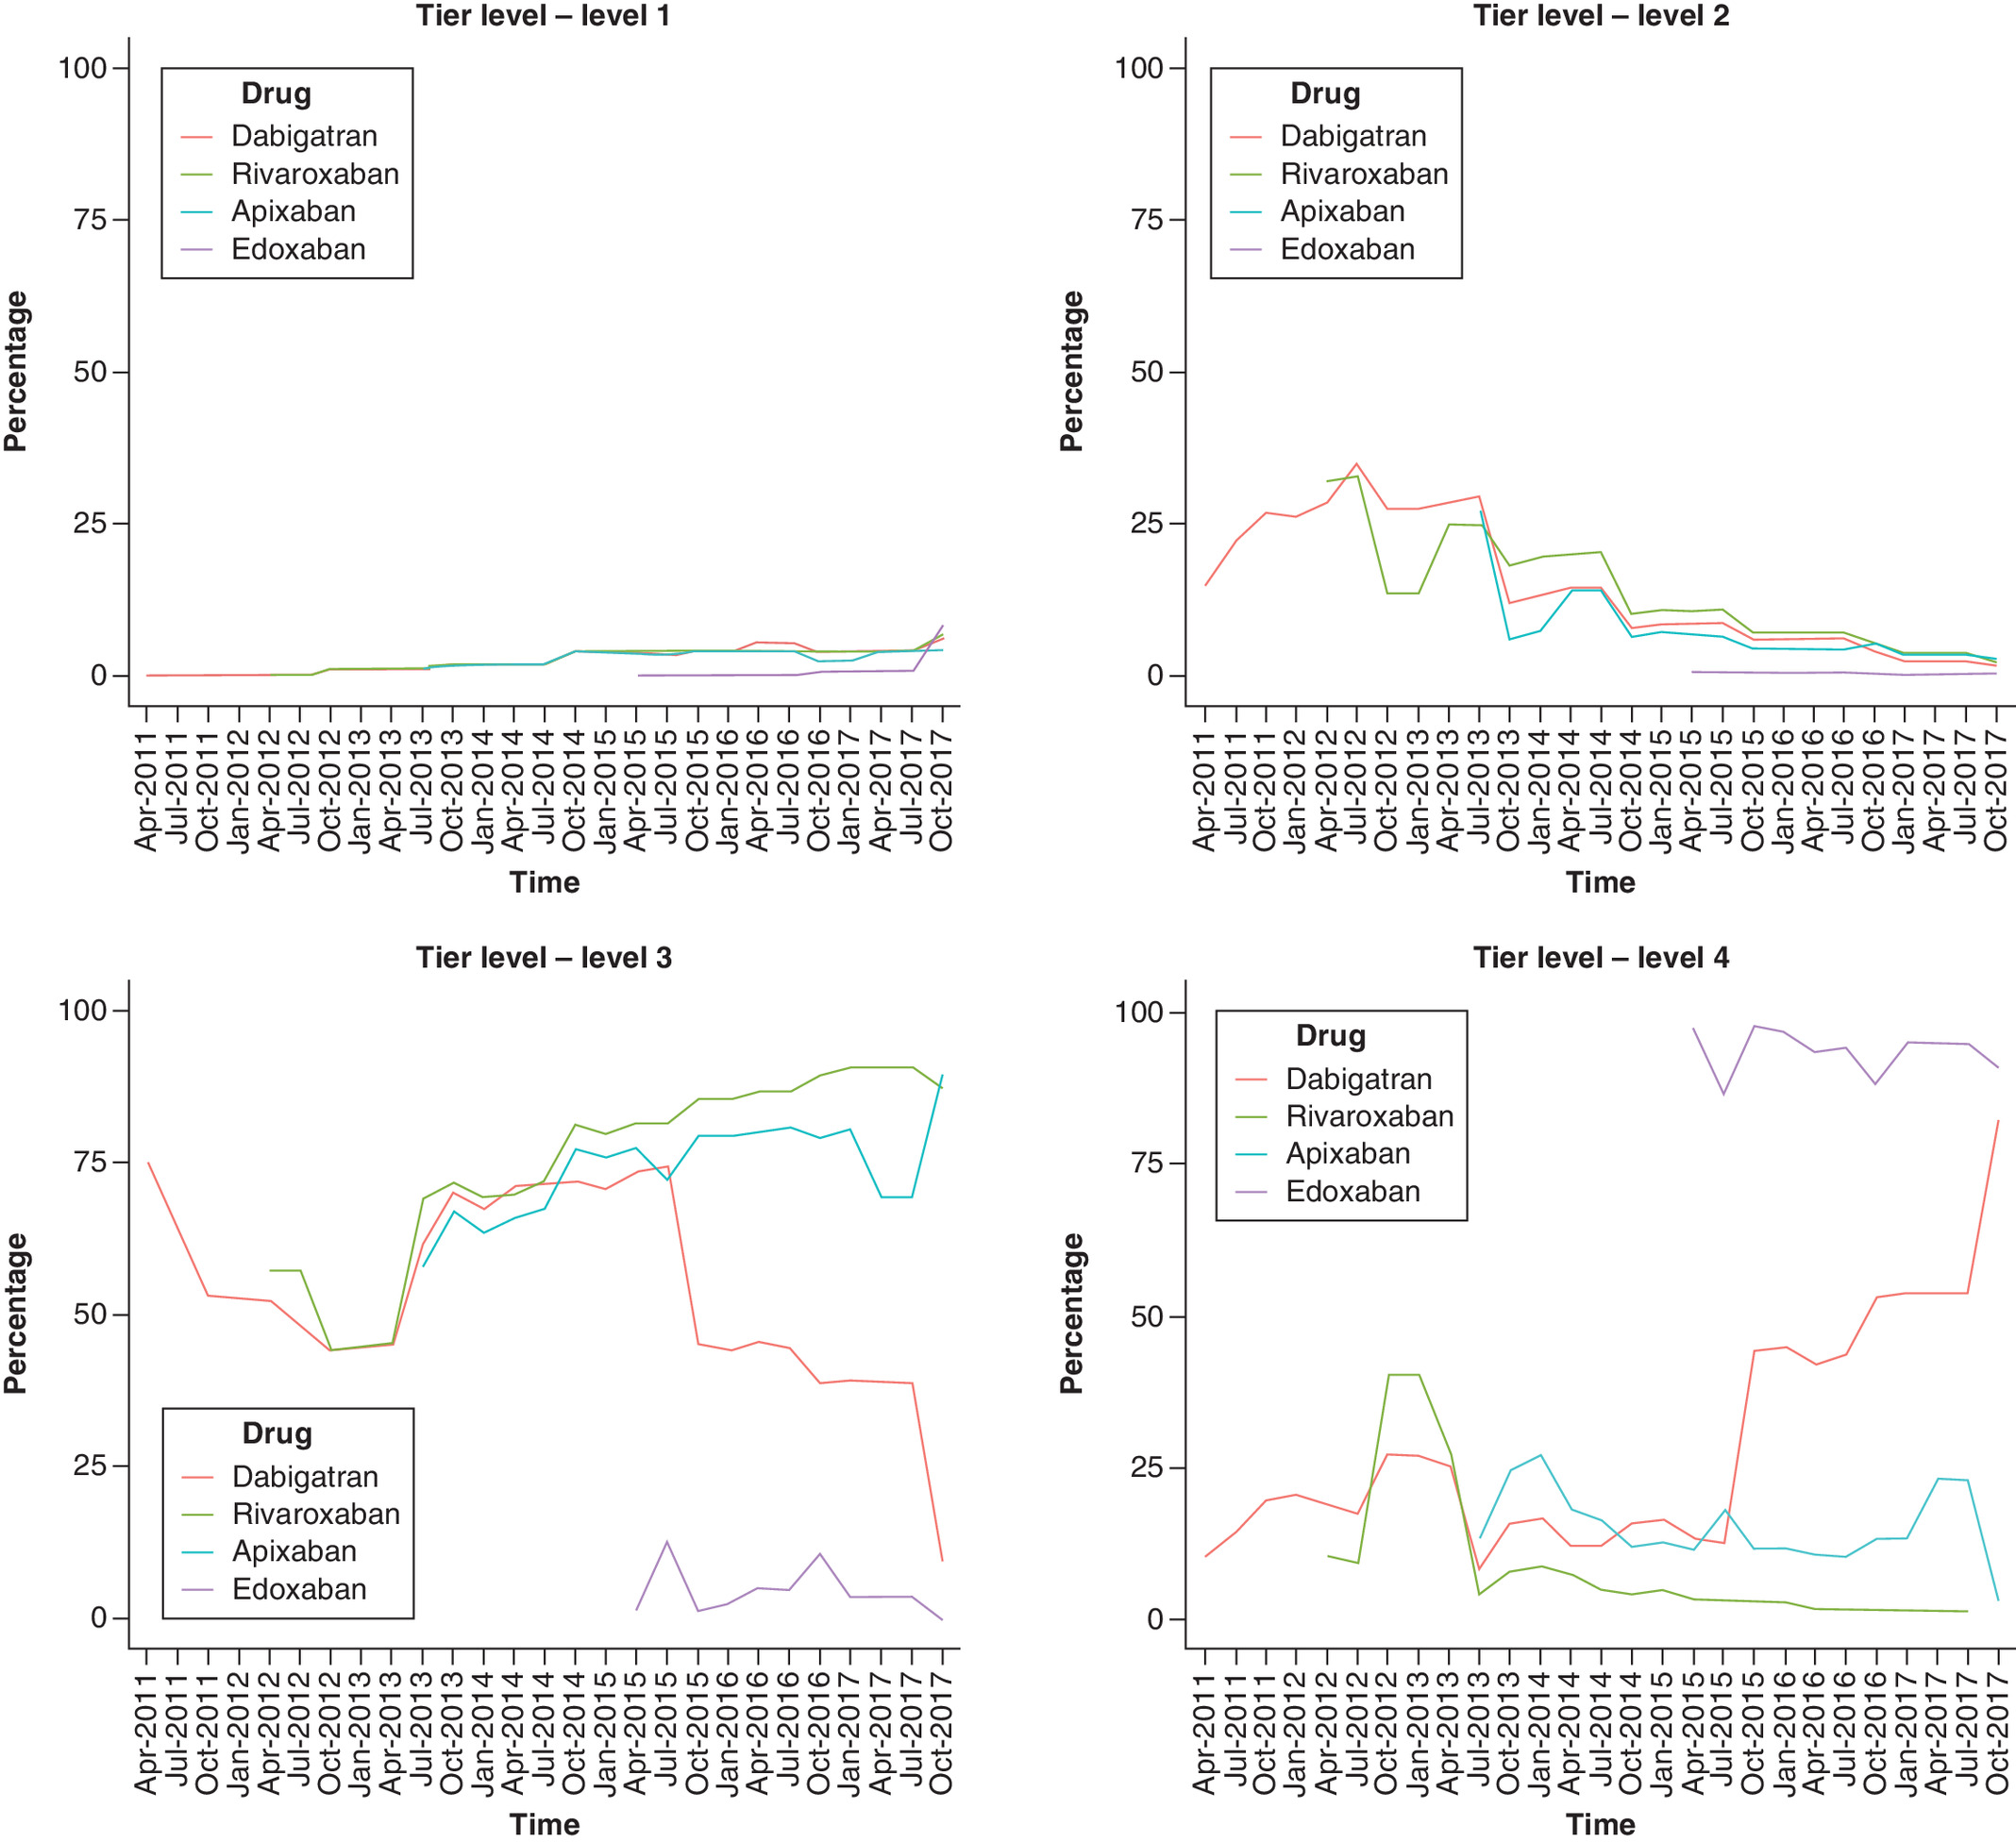
Significant change points (year, month) for all variables are outlined in Supplementary Appendix 2. Figures 2 & 3 & Supplementary Appendixes 3–6 depict CPA plots for outcome variables for each DOAC from 2011 to 2017. Figure 2 displays the percentage of plans covering each DOAC under tier levels (1–4) and Figure 3 displays the mean amount of cost sharing (in dollars) for each DOAC at preferred pharmacies when the type of cost sharing was copay.

Supplementary Appendixes 3 & 4 display the percentage of plans covering DOACs with quantity limits and plans covering DOACs under prior authorization, respectively. Supplementary Appendix 5 displays the percentage of plans covering each DOAC with type of cost sharing at preferred pharmacies where 0 = no cost sharing offered, 1 = copay offered and 2 = coinsurance offered. Supplementary Appendix 6 displays the mean amount of cost sharing (in percentages) for each DOAC at preferred pharmacies when the type of cost sharing was coinsurance.
Dabigatran was the only approved DOAC in 2010 and was covered under tier 3 by 75% of the plans (Figure 2). From 2011 to 2013, there was an increase in the number of plans covering dabigatran under tier 2. However, a significant change point was recorded in October 2013 (Supplementary Appendix 2), when the majority of plans changed the coverage of dabigatran back to tier 3. Other significant common change points were recorded for tiers 3 and 4 in 2015, when edoxaban was approved in the market. After 2015, there was an increase in the percentage of plans moving dabigatran to tier 4, with around 80% of plans covering it under tier 4 by the end of 2017. In addition, the percentage of plans covering rivaroxaban and apixaban under tier 3 continued to increase after 2015, with around 85% of plans covering both drugs under tier 3 by the end of 2017. Throughout the study duration, edoxaban was covered under tier 4 by the majority of plans. Every year at least one change point was recorded in the percentage of plans covering DOACs with quantity limits.
From 2011 to 2017, approximately 50–60% of plans had quantity limits imposed for dabigatran, rivaroxaban and apixaban (Supplementary Appendix 3). Of all plans, approximately 25–35% had prior authorization for dabigatran from April 2011 to October 2014 (Supplementary Appendix 4). A significant change point was recorded in July 2015 (Supplementary Appendix 2), after which the percentage of plans with prior authorization for dabigatran dropped below 25% (Supplementary Appendix 4). With regard to apixaban and rivaroxaban, a common change point was recorded in January 2015 (Supplementary Appendix 2), after which the percentage of plans with prior authorization continued to drop below 25% for both drugs (Supplementary Appendix 4).
From 2011 to 2017, most Medicare plans offered either copay or coinsurance at preferred pharmacies to cover DOACs, with only a small percentage of plans not offering any cost sharing. Less than 10% of plans offered no type of cost sharing until July 2016, after which this percentage rose to approximately 25% for all DOACs (Supplementary Appendix 5). Approximately 40–50% of plans offered copay at preferred pharmacies for three DOACs until July 2016, after which this percentage dropped to 25%. From 2011 to 2017, with the exception of edoxaban, approximately 50% of plans offered coinsurance at preferred pharmacies for DOACs.
For cost sharing with copay at preferred pharmacies, a significant common change point was recorded in April 2014 for dabigatran, rivaroxaban and apixaban (Supplementary Appendix 2). As shown in Figure 3, there was a sharp decrease in the mean amount of copay for all three DOACs (less than US$90) from April to July 2014. The mean copay for dabigatran increased in October 2015 to around US$110 and remained high until the end of 2017. The mean copay for rivaroxaban and apixaban remained steady (less than US$90) until the end of 2017, with rivaroxaban having the lowest copay among all DOACs. Regarding cost sharing with coinsurance at preferred pharmacies, with the exception of edoxaban, the mean coinsurance percentage was less than 10% for all DOACs from 2011 to 2017 (Supplementary Appendix 6).
Integration of CER evidence into Medicare plans
Figure 4 displays the number of plans covering each DOAC from 2011 to 2017 plotted with the CER evidence timeline. There were no CER studies comparing DOACs in 2011. All indirect treatment comparison studies in 2012 favored dabigatran over rivaroxaban with regard to efficacy (i.e., preventing stroke or SE). The 2012 CER evidence favoring dabigatran was reflected in the CMS formulary plans, as a significant number of plans moved dabigatran from tier 3 to tier 2 (Figure 2). In 2013 and 2014, the included CER studies reported contradictory evidence on the superiority of dabigatran in terms of efficacy. Some evidence ranked dabigatran highest with regard to stroke outcome, but other studies found no significant differences in the efficacy of DOACs. However, in 2013–2014, there was ample CER evidence supporting apixaban as the safest option relative to dabigatran and rivaroxaban in terms of bleeding risk. A significant change point was seen in Medicare plans in October 2013, when the majority of plans moved dabigatran back to tier 3. In 2015, there was mixed evidence supporting dabigatran's efficacy in preventing stroke or SE compared with other DOACs. A significant change point was observed in the tier level of plans covering dabigatran and the mean copay offered for dabigatran. In October 2015, most plans moved dabigatran to tier 4 and increased the mean copay to US$110 (from $80) (Figure 3). Some observational studies published in 2015 found patients to be more adherent to and less inconsistent with once-daily rivaroxaban treatment compared with dabigatran. Therefore, despite ample evidence suggesting highest risk of major and clinically relevant nonmajor bleeding with rivaroxaban in 2015–2016, Medicare plans covered rivaroxaban at the lowest copay and coinsurance compared with other DOACs. In 2016–2017, some evidence suggested that dabigatran was superior to rivaroxaban and edoxaban but similar to apixaban in terms of efficacy. Other evidence found no significant difference in the risk of ischemic stroke, SE or death between any of the DOACs. However, dabigatran continued to be covered under tier 4 with a higher copay until 2017. The majority of studies showed rivaroxaban to be the least efficacious and most unsafe compared with other DOACs, yet around 85% of Medicare plans continued to cover rivaroxaban in tier 3 with the lowest copay or coinsurance until 2017. Apixaban, which was found to be superior to other DOACs with regard to a composite end point of major and clinically relevant nonmajor bleeding, was favorably and consistently covered by Medicare plans from 2011 to 2017. Edoxaban was shown to be inferior to other DOACs in terms of preventing stroke and SE, which was translated in the less favorable coverage of edoxaban by Medicare plans (i.e. tier 4 coverage, prior authorization requirement and high cost sharing).
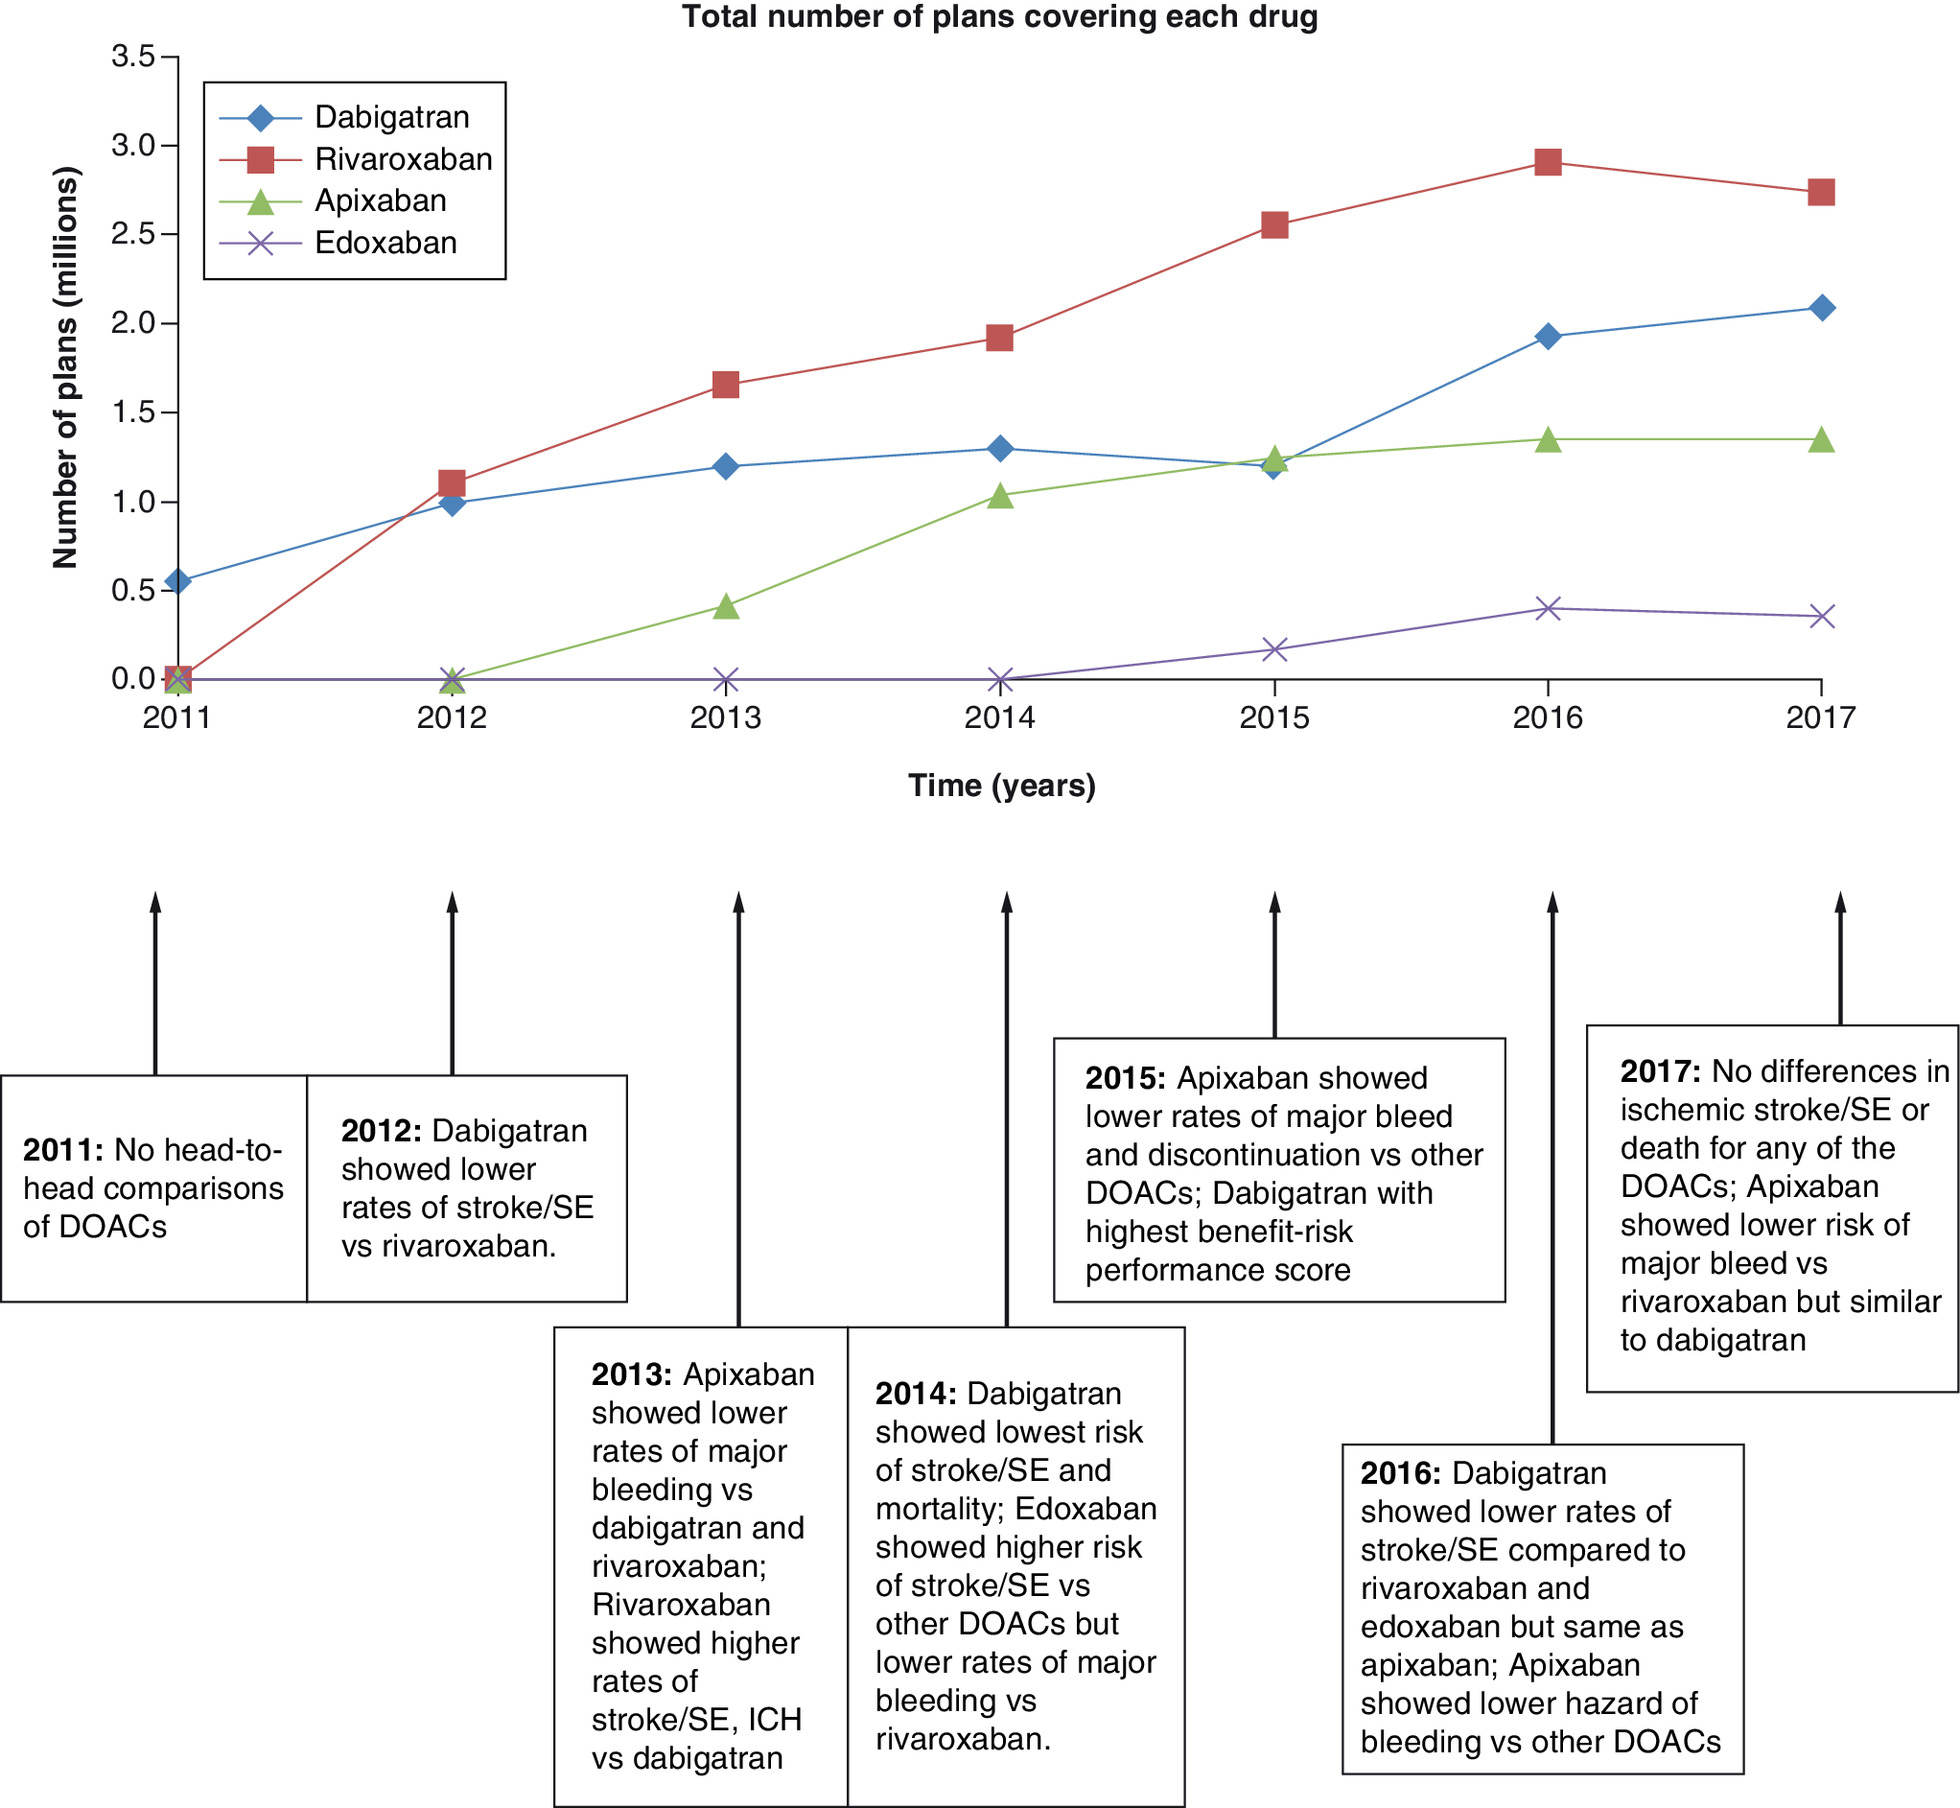
Figure 4. Timeline of the comparative effectiveness research generated from 2011 to 2017 plotted with Part D plans covering each DOAC.
DOAC: Direct oral anticoagulant; ICH: Intracranial hemorrhage; SE: Systemic embolism.
Discussion
Given the growing emphasis on generating CER evidence to evaluate different drugs and thereby improve patient access to affordable care, this study explored the extent to which such evidence is adopted and applied by Medicare for DOACs in the real world. According to this study, from 2011 to 2017, CER evidence comparing the safety and efficacy of DOACs was selectively incorporated into Medicare plans depending on the type of DOAC and the consistency of the evidence supporting a DOAC's superiority. It appeared that Medicare plans adopted CER evidence for apixaban and edoxaban throughout the duration of the study; however, discrepancies in the translation of CER evidence were found for rivaroxaban and dabigatran.
As shown in Figure 4, there was an increasing trend in the number of plans covering rivaroxaban from 2011 to 2017. Additionally, although evidence in 2016–2017 suggested a higher risk of both major bleeding and ICB with rivaroxaban, many plans continued to cover rivaroxaban under tier 3 and most offered the lowest copay or coinsurance at preferred pharmacies. These results are consistent with past studies assessing the utilization trends of DOACs, which found increased uptake and utilization of rivaroxaban compared with dabigatran [77,78]; this may have been due to the once-daily dosing of rivaroxaban and patients therefore having better adherence to rivaroxaban compared with the twice-daily dosing of dabigatran. With regard to dabigatran, despite evidence in 2016–2017 supporting its efficacy, the majority of Medicare plans continued dabigatran under tier 4 (Figure 2). The mean copay for dabigatran rose tremendously after October 2015 and remained high until the end of 2017. These results are in concordance with past studies, which reported high patient out-of-pocket and insurer spending for dabigatran compared with other DOACs [78] and slower uptake of dabigatran once other DOACs entered the market [77].
The study findings suggest that translation of CER evidence in the DOAC market could be dependent on the timing and type of evidence generated for each drug. Evidence supporting the safety of apixaban was generated early on after its approval and was consistent from 2011 to 2017 and therefore could have been incorporated into decisions regarding the drug's coverage. Limited coverage of edoxaban (the last entrant) by Medicare plans was in concordance with the evidence. However, efficacy of dabigatran being similar to apixaban and better than other DOACs could only be established 5 years after it was approved. Dabigatran was the first of the DOACs to enter the market, which could have made it extremely competitive with regard to proving its efficacy and superiority. Compared to other DOACs, more evidence was generated with dabigatran being the active comparator over the course of 7 years. Evaluating the validity, applicability and generalizability of various studies could have led to the delay in uptake of evidence favoring the efficacy and superiority of dabigatran. This finding emphasizes the importance of real-world evidence and regulations around generating large-scale studies using claims data to assess costs, healthcare resource utilization and humanistic outcomes.
This study attempted to shed new light on past theory that suggested it could take up to a decade for clinical evidence to be translated into practice [79]. If CER evidence were generated early on with real-world databases measuring standardized outcomes, it would be easier to interpret and incorporate it into practice. A past study by Arora et al. evaluating the translation of CER into physician prescribing showed the importance of superiority trials in the Type 2 diabetes market [3]. The present study, which analyzed a more robust data source (i.e., CMS) to measure coverage, extends the findings of the study by Arora et al. by emphasizing the importance of generating real-world evidence. Both studies, however, strengthen the argument that translation of evidence into practice is dependent on the type of evidence generated during the initial years after drug approval.
Moreover, it may be challenging for organizations such as CMS to systematically and continually incorporate new evidence generated within a therapeutic market. However, with resources and funds already being earmarked for the generation of more CER evidence, some funds could be redirected toward building independent bodies that can monitor the quality of CER evidence and help translate it into coverage decisions in the long run. In addition, expanding access to larger data sources (e.g., claims) and knowledge/resources for modeling study designs (e.g., cost–effectiveness models) would help improve the efficiency of CER and ensure a timely translation of evidence for US decision makers.
It is already established that linking coverage and cost-sharing decisions to CER evidence could potentially be a fruitful strategy for improving health outcomes and containing the high healthcare expenditures of the Medicare system. Therefore, it would help policymakers such as CMS to ascertain the importance of CER evidence and devise strategies to establish value-based benefit designs. The findings of this study further emphasize the importance of developing different disease-specific value assessment tools to help payers and other decision makers consolidate the complex CER evidence, thus helping the US healthcare system transition from being volume-based to value-based.
Limitations
This study was limited to the DOAC market. It can be extrapolated to other markets with caution, as every therapeutic market is distinct and every drug is unique. This study evaluated the proportion of CMS plans covering each DOAC and did not account for characteristics of the patient cohort being prescribed the DOAC. The CER evidence evaluated in this study focused on AFib/NVAF patients; however, the prescription drug plan and formulary data represented the Medicare population prescribed DOACs and could not be restricted to a specific patient population. Although DOACs have been approved to treat AFib/NVAF and venous thromboembolism, the majority of Medicare patients taking DOACs have a diagnosis of AFib, with only a small percentage having a diagnosis of venous thromboembolism [80]. Most of the early evidence presented in this study came from meta-analyses and systematic reviews and indirect comparisons; hence, this study is limited by the quality and heterogeneity of the randomized controlled trials included in these studies. In addition, warfarin was excluded from the study because it could not be classified and compared under the DOAC therapeutic category. Since the intent of this study was to assess association and not establish causality, it is possible that the coverage decisions of Medicare plans could be guided by other factors that were not accounted for, such as clinical guidelines, evidence with warfarin as a comparator, evidence comparing drug characteristics such as varying renal clearance of DOACs and interactions with other drugs. Additionally, it is possible that evidence rated high in this study with regard to quality and validity might be deemed insufficient by Medicare plans or inapplicable to the Afib population.
Conclusion
CER evidence for DOACs seemed to be translated and incorporated into practice during the initial years of the DOAC market. Its translation into Medicare cost and coverage decisions was dependent on the type of DOAC and the consistency of the evidence generated. Consistent with CER results, the majority of CMS plans covered apixaban more favorably and edoxaban less favorably. However, discrepancies in the translation of CER evidence were found for rivaroxaban and dabigatran. Because of the delay in evidence supporting dabigatran's efficacy over rivaroxaban, Medicare plans continued to cover dabigatran less favorably. Increasing the knowledge and resources needed to obtain real-world evidence and then systematically incorporating this evidence into coverage decisions could help transform clinical practice in the US healthcare system.
•
Comparative effectiveness research (CER) evidence comparing the safety and efficacy of direct oral anticoagulants (DOACs) was selectively incorporated into Medicare plans from 2011 to 2017.
•
Translation of CER evidence into Medicare coverage of DOACs was dependent on the type of DOAC and the consistency of the evidence supporting a DOAC's superiority.
•
In concordance with the CER evidence generated, Medicare plans covered apixaban more favorably and edoxaban less favorably.
•
Delay in the generation of CER evidence supporting dabigatran's efficacy might have affected its coverage by Medicare plans.
•
CER evidence generated using robust measures, real-world datasets and standardized outcomes would be easier to interpret and incorporate into practice.
Disclosure
The funding source had no involvement in the study design, data analysis, data interpretation, manuscript writing or decision to submit the article for publication.
Financial & competing interests disclosure
This research was funded by the Holcomb Awards Committee at Butler University. The funds were used to buy Centers for Medicare and Medicaid Services data. The authors have no other relevant affiliations or financial involvement with any organization or entity with a financial interest in or financial conflict with the subject matter or materials discussed in the manuscript apart from those disclosed.
No writing assistance was utilized in the production of this manuscript.
Supplementary Material
File (supplementary appendices.docx)
- Download
- 593.50 KB
References
Papers of special note have been highlighted as: • of interest; •• of considerable interest
1.
Esposito D, Yong PL, Rich E, Geonnotti K, Kimmey LD. The ARRA investment in CER: a description of the midstream evaluation and how the funds were allocated and CER priorities addressed. J. Comp. Eff. Res. 3(6), 581–589 (2014).
2.
Schumock GT, Pickard AS. Comparative effectiveness and patient-centered outcomes research: enhancing uptake and use by patients, clinicians and payers. J. Comp. Eff. Res. 7(2), 177–180 (2018).
• Emphasizes the importance of comparative effectiveness research (CER) in the decision-making process of different players, including patients, clinicians and payers.
3.
Arora P, Look KA, Kreling DH. Does evidence matter? Comparative effectiveness research and prescribing of Type 2 diabetes mellitus drugs. J. Comp. Eff. Res. 8(16), 1393–1403 (2019).
•• Assesses the association of CER and physician prescribing for Type 2 diabetes mellitus drugs; it was used to identify gaps in the literature and was instrumental in shaping the idea and methodology of the current study.
4.
Kesselheim AS, Avorn J, Sarpatwari A. The High Cost of Prescription Drugs in the United States: Origins and Prospects for Reform. JAMA. 316(8), 858 (2016).
5.
Neumann PJ, Cohen JT. Measuring the Value of Prescription Drugs [Internet]. (2015). Available from: www.nejm.org/doi/10.1056/NEJMp1512009
6.
CMS Fast Facts | CMS [Internet]. Available from: www.cms.gov/Research-Statistics-Data-and-Systems/Statistics-Trends-and-Reports/CMS-Fast-Facts
7.
Davis K, Stremikis K, Squires D, Schoen K. Mirror, Mirror on the Wall, 2014 Update: How the U.S. Health Care System Compares Internationally, [Internet]. The Commonwealth Fund (2014). Available from: www.commonwealthfund.org/publications/fund-reports/2014/jun/mirror-mirror
8.
Mohr P. Looking at CER from Medicare's Perspective. JMCP 18(4 Supp A), S05–S08 (2012).
9.
Pearson SD, Bach PB. How Medicare Could Use Comparative Effectiveness Research In Deciding On New Coverage And Reimbursement. Health Aff. 29(10), 1796–1804 (2010).
•• Used to build the hypothesis for the current study, which assessed the impact of CER on coverage decisions made by the Centers for Medicare and Medicaid Services.
10.
Avorn J, Fischer M. “Bench To Behavior”: Translating Comparative Effectiveness Research Into Improved Clinical Practice. Health Aff. 29(10), 1891–900 (2010).
11.
January CT, Wann LS, Alpert JS et al. 2014 AHA/ACC/HRS Guideline for the Management of Patients With Atrial Fibrillation. Circulation. 130(23), e199–e267 (2014).
12.
Go AS, Hylek EM, Phillips KA et al. Prevalence of Diagnosed Atrial Fibrillation in Adults: National Implications for Rhythm Management and Stroke Prevention: the AnTicoagulation and Risk Factors In Atrial Fibrillation (ATRIA) Study. JAMA 285(18), 2370 (2001).
13.
Wolf PA, Singer DE. Preventing stroke in atrial fibrillation. American family physician. 56(9), 2242–2250 (1997).
14.
You JJ, Singer DE, Howard PA et al. Antithrombotic Therapy for Atrial Fibrillation. Chest. 141(Suppl. 2), e531S–e575S (2012).
15.
Drug Approval Package: Brand Name (Generic Name) NDA # [Internet]. Available from: www.accessdata.fda.gov/drugsatfda_docs/nda/2012/202155Orig1s000TOC.cfm
16.
Drug Approval Package: Brand Name (Generic Name) NDA # [Internet]. Available from: www.accessdata.fda.gov/drugsatfda_docs/nda/2015/206316Orig1Orig2s000TOC.cfm
17.
Drug Approval Package: PRADAXA (dabigatran etexilate mesylate) NDA #022512 [Internet]. Available from: www.accessdata.fda.gov/drugsatfda_docs/nda/2010/022512Orig1s000TOC.cfm
18.
Drug Approval Package: Xarelto (rivaroxaban) NDA # [Internet]. Available from: www.accessdata.fda.gov/drugsatfda_docs/nda/2011/022406Orig1s000TOC.cfm
19.
Baik SH, Hernandez I, Zhang Y. Evaluating the Initiation of Novel Oral Anticoagulants in Medicare Beneficiaries. J Manag Care Spec Pharm. 22(3), 281–292 (2016).
20.
Harrington AR, Armstrong EP, Nolan PE, Malone DC. Cost-Effectiveness of Apixaban, Dabigatran, Rivaroxaban, and Warfarin for Stroke Prevention in Atrial Fibrillation. Stroke. 44(6), 1676–1681 (2013).
21.
Harenberg J, Marx S, Lip GYH, Marder VJ, Wehling M, Weiss C. Comparison of efficacy and safety of dabigatran, rivaroxaban and apixaban in patients with atrial fibrillation using network meta-analysis. Int. Angiol. 31(4), 11 (2012).
22.
Mantha S, Ansell J. An indirect comparison of dabigatran, rivaroxaban and apixaban for atrial fibrillation. Thromb Haemost. 108(9), 476–484 (2012).
23.
Mantha S, Ansell J. Indirect comparison of dabigatran, rivaroxaban, apixaban and edoxaban for the treatment of acute venous thromboembolism. J Thromb Thrombolysis. 39(2), 155–165 (2015).
24.
Gómez-Outes A, Terleira-Fernández AI, Calvo-Rojas G, Suárez-Gea ML, Vargas-Castrillón E. Dabigatran, Rivaroxaban, or Apixaban versus Warfarin in Patients with Nonvalvular Atrial Fibrillation: A Systematic Review and Meta-Analysis of Subgroups. Thrombosis [Internet]. 2013 (2013). Available from: www.ncbi.nlm.nih.gov/pmc/articles/PMC3885278/
25.
Skjøth F, Larsen TB, Rasmussen LH, Lip GYH. Efficacy and safety of edoxaban in comparison with dabigatran, rivaroxaban and apixaban for stroke prevention in atrial fibrillation. Thromb Haemost. 112(5), 981–988 (2014).
26.
Greenspon AJ. A Review of Oral Anticoagulants in Patients with Atrial Fibrillation. Postgrad. Med. 124(6), 7–16 (2012).
27.
Tendera M, Syzdół M, Parma Z. ARISTOTLE RE-LYs on the ROCKET. What's new in stroke prevention in patients with atrial fibrillation? Cardiol J. 19(1), 4 (2012).
28.
Connolly SJ, Ezekowitz MD, Yusuf S et al. Dabigatran versus Warfarin in Patients with Atrial Fibrillation [Internet]. (2009). Available from: www.nejm.org/doi/10.1056/NEJMoa0905561
29.
Granger CB, Alexander JH, McMurray JJV et al. Apixaban versus Warfarin in Patients with Atrial Fibrillation [Internet]. (2011). Available from: www.nejm.org/doi/10.1056/NEJMoa1107039
30.
Patel MR, Mahaffey KW, Garg J et al. Rivaroxaban versus Warfarin in Nonvalvular Atrial Fibrillation [Internet]. (2011). Available from: www.nejm.org/doi/10.1056/NEJMoa1009638
31.
Giugliano RP, Ruff CT, Braunwald E et al. Edoxaban versus Warfarin in Patients with Atrial Fibrillation [Internet]. (2013). Available from: www.nejm.org/doi/10.1056/NEJMoa1310907
32.
Limone BL, Baker WL, Kluger J, Coleman CI. Novel Anticoagulants for Stroke Prevention in Atrial Fibrillation: A Systematic Review of Cost-Effectiveness Models. PLOS ONE. 8(4), e62183 (2013).
33.
Schaumberg DA, McDonald L, Shah S, Stokes M, Nordstrom BL, Ramagopalan SV. Evaluation of comparative effectiveness research: a practical tool. J. Comp. Eff. Res. 7(5), 503–515 (2018).
34.
Truong C, Oudre L, Vayatis N. Selective review of offline change point detection methods. Signal Processing. 167, 107299 (2020).
35.
Aminikhanghahi S, Cook DJ. A survey of methods for time series change point detection. Knowl Inf Syst. 51(2), 339–367 (2017).
36.
Killick R, Eckley I. Changepoint: An R package for changepoint analysis. J. Stat. Softw. 58(3), 1–19 (2014).
37.
Killick R, Fearnhead P, Eckley IA. Optimal detection of changepoints with a linear computational cost. JASA 107(500), 1590–1598 (2012).
38.
van den Burg GJ, Williams CK. An evaluation of change point detection algorithms. (2020). arXiv preprint arXiv:2003.06222
39.
Beaulieu C, Chen J, Sarmiento JL. Change-point analysis as a tool to detect abrupt climate variations. Philos. Trans. Royal Soc. A PHILOS T R SOC A 370(1962), 1228–1249 (2012).
• Discusses the applicability of change-point analysis in various fields to estimate the number of significant changes and the locations of change points in time series data.
40.
Fryzlewicz P. Wild binary segmentation for multiple change-point detection. Ann. Statist. 42(6), 2243–2281 (2014).
41.
Maidstone R, Hocking T, Rigaill G, Fearnhead P. On optimal multiple changepoint algorithms for large data. Stat. Comput. 27(2), 519–533 (2017).
42.
Baker William L, Phung Olivia J. Systematic Review and Adjusted Indirect Comparison Meta-Analysis of Oral Anticoagulants in Atrial Fibrillation. Circ Cardiovasc Qual Outcomes. 5(5), 711–719 (2012).
43.
Schneeweiss S, Gagne JJ, Patrick AR, Choudhry NK, Avorn J. Comparative Efficacy and Safety of New Oral Anticoagulants in Patients With Atrial Fibrillation. Circ Cardiovasc Qual Outcomes. 5(4), 480–486 (2012).
44.
Rasmussen LH, Larsen TB, Graungaard T, Skjøth F, Lip GYH. Primary and secondary prevention with new oral anticoagulant drugs for stroke prevention in atrial fibrillation: indirect comparison analysis. BMJ. 345, e7097 (2012).
45.
Lip GYH, Larsen TB, Skjøth F, Rasmussen LH. Indirect Comparisons of New Oral Anticoagulant Drugs for Efficacy and Safety When Used for Stroke Prevention in Atrial Fibrillation. J. Am. Coll. Cardiol. 60(8), 738–746 (2012).
46.
Mitchell SA, Simon TA, Raza S et al. The Efficacy and Safety of Oral Anticoagulants in Warfarin-Suitable Patients With Nonvalvular Atrial Fibrillation: Systematic Review and Meta-Analysis. Clin Appl Thromb Hemost. 19(6), 619–631 (2013).
47.
Sardar P, Chatterjee S, Wu W-C et al. New Oral Anticoagulants Are Not Superior to Warfarin in Secondary Prevention of Stroke or Transient Ischemic Attacks, but Lower the Risk of Intracranial Bleeding: Insights from a Meta-Analysis and Indirect Treatment Comparisons. PLOS ONE. 8(10), e77694 (2013).
48.
Assiri A, Al-Majzoub O, Kanaan AO, Donovan JL, Silva M. Mixed Treatment Comparison Meta-Analysis of Aspirin, Warfarin, and New Anticoagulants for Stroke Prevention in Patients With Nonvalvular Atrial Fibrillation. Clin. Ther. 35(7), 967–984.e2 (2013).
49.
Canestaro WJ, Patrick AR, Avorn J et al. Cost-Effectiveness of Oral Anticoagulants for Treatment of Atrial Fibrillation. Circ. Cardiovasc. Qual. Outcomes 6(6), 724–731 (2013).
50.
Pink J, Pirmohamed M, Hughes DA. Comparative Effectiveness of Dabigatran, Rivaroxaban, Apixaban, and Warfarin in the Management of Patients With Nonvalvular Atrial Fibrillation. Clin. Pharm. Therap. 94(2), 269–276 (2013).
51.
Dogliotti A, Paolasso E, Giugliano RP. Current and new oral antithrombotics in non-valvular atrial fibrillation: a network meta-analysis of 79 808 patients. Heart. 100(5), 396–405 (2014).
52.
Fu W, Guo H, Guo J et al. Relative efficacy and safety of direct oral anticoagulants in patients with atrial fibrillation by network meta-analysis. J Cardiovasc Med (Hagerstown) 15(12), 873–879 (2014).
53.
Verdecchia P, Angeli F, Lip GYH, Reboldi G. Edoxaban in the Evolving Scenario of Non Vitamin K Antagonist Oral Anticoagulants Imputed Placebo Analysis and Multiple Treatment Comparisons. PLOS ONE. 9(6), e100478 (2014).
54.
Pink J, Pirmohamed M, Lane S, Hughes DA. Cost-Effectiveness of Pharmacogenetics-Guided Warfarin Therapy vs. Alternative Anticoagulation in Atrial Fibrillation. Clin Pharmacol Ther. 95(2), 199–207 (2014).
55.
Cope S, Clemens A, Hammès F, Noack H, Jansen JP. Critical Appraisal of Network Meta-Analyses Evaluating the Efficacy and Safety of New Oral Anticoagulants in Atrial Fibrillation Stroke Prevention Trials. Value Health. 18(2), 234–249 (2015).
56.
Lin L, Lim WS, Zhou HJ et al. Clinical and Safety Outcomes of Oral Antithrombotics for Stroke Prevention in Atrial Fibrillation: A Systematic Review and Network Meta-analysis. J Am Med Dir Assoc. 16(12), 1103.e1–1103.e19 (2015).
57.
Morimoto T, Crawford B, Wada K, Ueda S. Comparative efficacy and safety of novel oral anticoagulants in patients with atrial fibrillation: A network meta-analysis with the adjustment for the possible bias from open label studies. J. Cardiol. 66(6), 466–474 (2015).
58.
Komócsi A. Discontinuation of anticoagulant treatment: from clinical trials to medication persistence. Curr Med Res Opin. 31(10), 1841–1844 (2015).
59.
Crivera C, Nelson WW, Bookhart B et al. Pharmacy quality alliance measure: adherence to non-warfarin oral anticoagulant medications. Curr Med Res Opin. 31(10), 1889–1895 (2015).
60.
Nelson WW, Song X, Thomson E et al. Medication persistence and discontinuation of rivaroxaban and dabigatran etexilate among patients with non-valvular atrial fibrillation. Curr Med Res Opin 31(10), 1831–1840 (2015).
61.
Hsu JC, Hsieh C-Y, Yang Y-HK, Lu CY. Net Clinical Benefit of Oral Anticoagulants: A Multiple Criteria Decision Analysis. PLOS ONE. 10(4), e0124806 (2015).
62.
Bajaj NS, Kalra R, Patel N et al. Comparison of Approaches for Stroke Prophylaxis in Patients with Non-Valvular Atrial Fibrillation: Network Meta-Analyses of Randomized Controlled Trials. PLOS ONE. 11(10), e0163608 (2016).
63.
Lip GYH, Mitchell SA, Liu X et al. Relative efficacy and safety of non-Vitamin K oral anticoagulants for non-valvular atrial fibrillation: Network meta-analysis comparing apixaban, dabigatran, rivaroxaban and edoxaban in three patient subgroups. Int. J. Cardiol. 204, 88–94 (2016).
64.
Lip GYH, Keshishian A, Kamble S et al. Real-world comparison of major bleeding risk among non-valvular atrial fibrillation patients initiated on apixaban, dabigatran, rivaroxaban, or warfarin. Thromb Haemost. 116(11), 975–986 (2016).
65.
Lip GYH, Pan X, Kamble S et al. Major bleeding risk among non-valvular atrial fibrillation patients initiated on apixaban, dabigatran, rivaroxaban or warfarin: a “real-world” observational study in the United States. Int. J. Clin. Pract 70(9), 752–763 (2016).
66.
Noseworthy PA, Yao X, Abraham NS, Sangaralingham LR, McBane RD, Shah ND. Direct Comparison of Dabigatran, Rivaroxaban, and Apixaban for Effectiveness and Safety in Nonvalvular Atrial Fibrillation. CHEST. 150(6), 1302–1312 (2016).
67.
Graham DJ, Reichman ME, Wernecke M et al. Stroke, Bleeding, and Mortality Risks in Elderly Medicare Beneficiaries Treated With Dabigatran or Rivaroxaban for Nonvalvular Atrial Fibrillation. JAMA Intern Med. 176(11), 1662 (2016).
68.
Deitelzweig S, Bruno A, Trocio J et al. An early evaluation of bleeding-related hospital readmissions among hospitalized patients with nonvalvular atrial fibrillation treated with direct oral anticoagulants. Curr Med Res Opin 32(3), 573–582 (2016).
69.
Bai Ying, Deng Hai, Shantsila Alena, Lip Gregory YH. Rivaroxaban Versus Dabigatran or Warfarin in Real-World Studies of Stroke Prevention in Atrial Fibrillation. Stroke. 48(4), 970–976 (2017).
70.
Bai Y, Shi X-B, Ma C-S, Lip GYH. Meta-Analysis of Effectiveness and Safety of Oral Anticoagulants in Atrial Fibrillation With Focus on Apixaban. Am. J. Card. 120(9), 1689–1695 (2017).
71.
Proietti Marco, Romanazzi Imma, Romiti Giulio Francesco, Farcomeni Alessio, Lip Gregory YH. Real-World Use of Apixaban for Stroke Prevention in Atrial Fibrillation. Stroke. 49(1), 98–106 (2018).
72.
Hernandez I, Zhang Y. Comparing Stroke and Bleeding with Rivaroxaban and Dabigatran in Atrial Fibrillation: Analysis of the US Medicare Part D Data. Am J Cardiovasc Drugs. 17(1), 37–47 (2017).
73.
Norby FL, Bengtson LGS, Lutsey PL et al. Comparative effectiveness of rivaroxaban versus warfarin or dabigatran for the treatment of patients with non-valvular atrial fibrillation. BMC Cardiovasc. Disord. 17(1), 238 (2017).
74.
Hernandez I, Zhang Y, Saba S. Comparison of the Effectiveness and Safety of Apixaban, Dabigatran, Rivaroxaban, and Warfarin in Newly Diagnosed Atrial Fibrillation. Am. J. Card. 120(10), 1813–1819 (2017).
75.
Deitelzweig S, Luo X, Gupta K et al. Comparison of effectiveness and safety of treatment with apixaban vs. other oral anticoagulants among elderly nonvalvular atrial fibrillation patients. Curr Med Res Opin. 33(10), 1745–1754 (2017).
76.
Borne RT, O'Donnell C, Turakhia MP et al. Adherence and outcomes to direct oral anticoagulants among patients with atrial fibrillation: findings from the veterans health administration. BMC Cardiovasc. Disord. 17(1), 1–7 (2017).
77.
Wong SL, Marshall LZ, Lawson KA. Direct oral anticoagulant prescription trends, switching patterns, and adherence in Texas Medicaid. AJMC 24(8 Spec No.), SP309–SP314 (2018).
78.
Desai NR, Krumme AA, Schneeweiss S et al. Patterns of Initiation of Oral Anticoagulants in Patients with Atrial Fibrillation— Quality and Cost Implications. Am. J. Med. 127(11), 1075–1082.e1 (2014).
79.
Gesensway D. How do you translate evidence into practice? [Internet]. Today's Hospitalist (2015). Available from: www.todayshospitalist.com/how-do-you-translate-evidence-into-practice/
80.
Barnes GD, Lucas E, Alexander GC, Goldberger ZD. National Trends in Ambulatory Oral Anticoagulant Use. Am. J. Med. 128(12), 1300–1305.e2 (2015).
Information & Authors
Information
Published In
Pages: 1105 - 1120
PubMed: 36065839
Copyright
© 2022 Future Medicine Ltd.
History
Received: 23 December 2021
Accepted: 8 August 2022
Published online: 6 September 2022
Keywords:
Topics
Authors
Funding Information
Holcomb Awards Committee, Butler University
Metrics & Citations
Metrics
Article Usage
Article usage data only available from February 2023. Historical article usage data, showing the number of article downloads, is available upon request.
Citations
How to Cite
Impact of comparative effectiveness research on Medicare coverage of direct oral anticoagulants. (2022) Journal of Comparative Effectiveness Research. DOI: 10.2217/cer-2021-0307
Export citation
Select the citation format you wish to export for this article or chapter.
Citing Literature
- Dionne M. Hines, Riddhi Doshi, Vamshi Ruthwik Anupindi, Feng Dai, Cristina Russ, Robert Stellhorn, Dong Cheng, Serina Deeba, Yi Wang, Mitchell DeKoven, Payer approval and rejection of oral anticoagulant prescriptions and prescription abandonment patterns among patients with venous thromboembolism, Journal of Managed Care & Specialty Pharmacy, 10.18553/jmcp.2024.23194, 30, 5, (441-455), (2024).
- Prachi Arora, Maria Muehrcke, Molly Russell, Saurabh Ghanekar, Utilization outcomes of direct oral anticoagulants in Medicare patients, Research in Social and Administrative Pharmacy, 10.1016/j.sapharm.2023.07.002, 19, 11, (1424-1431), (2023).