Safety and efficacy of GP40071 compared with originator insulin aspart (NovoRapid® Penfill®) in Type 1 diabetes mellitus
Publication: Journal of Comparative Effectiveness Research
Abstract
Aim: To compare safety and efficacy of GP40071 insulin aspart (GP-Asp) and NovoRapid® (NN-Asp). Materials & methods: This randomized open-label, active-controlled, 26-week non-inferiority Phase III clinical trial enrolled 264 Type 1 diabetes mellitus patients (HbA1c: 7.1–12.0%) randomized 1:1 to once daily GP-Asp (n = 132) or NN-Asp (n = 132). The primary safety end point was immune response at week 26. Results: The groups were similar in frequency of immune response (p = 0.323) and in other safety end points. Mean HbA1c change from baseline was -0.57% for GP-Asp and -0.56% for NN-Asp and did not differ between groups (p = 0.955). Intergroup mean difference of HbA1c level change (95% CI) at week 26 from baseline was 0.00 (-0.26, 0.25) %. Insulin doses, fasting plasma glucose levels and seven-point glucose profiles were similar between groups (p > 0.05). The number of patients experiencing hypoglycemic episodes did not differ between the groups (p = 0.497). Conclusion: GP-Asp demonstrated similar safety and efficacy.
Trial registration number: NCT04079413 (ClinicalTrials.gov).
Diabetes mellitus is a serious public health problem worldwide affecting more than 463 million people. Therefore, it is associated with enormous economic and social losses due to the severity of long-term complications. Lifelong insulin therapy is required for patients with Type 1 diabetes mellitus (T1D). Insulin is also used to augment antidiabetic therapy with oral hypoglycemic drugs in patients with Type 2 diabetes mellitus (T2D). Stable glycemic control prevents or slows down the progression of long-term complications. As a result, the quality of patients’ life significantly improves [1].
Due to the complexity of biomanufacturing process of insulins, these medications are rather expensive and require high expenses from the state economics.
A biosimilar is a biological medicinal product highly similar to another already approved biological medicinal product (the ‘reference product’) that is as safe and effective as the originator [2], and being cheaper, it allows patients to reduce treatment costs thereby leading to greater treatment access [3]. Although patients and physicians have many concerns about safety and efficacy of biosimilars, the development of biosimilar drugs including insulin products is a strictly regulated process [4,5].
Insulin aspart is the active ingredient of NovoRapid® Penfill® (NN-Asp) which has been approved and marketed in many countries since 1999 for treatment of patients with diabetes mellitus. GP40071 insulin aspart (GP-Asp) has been developed as a biosimilar to NN-Asp in accordance with the regulatory guidelines of the Eurasian Economic Union and EMA [4,5].
Using the stepwise approach, the similarity in pharmacology, safety and efficacy of GP-Asp and NN-Asp has been demonstrated based on head-to-head analytical and preclinical comparability studies. The pivotal euglycemic clamp study (NCT04184466) was conducted to demonstrate pharmacokinetics and pharmacodynamics of the biosimilar and the reference insulin aspart. This study showed a high degree of similarity between GP-Asp and NN-Asp in pharmacological activity. The results of the glucose clamp study were presented at 22nd European Congress of Endocrinology (AEP366) [6].
In addition to pharmacological similarity, therapeutic equivalence of a biosimilar and reference drug should be proven. In such study, participants with diabetes mellitus should demonstrate equivalent safety and efficacy profile.
This clinical trial was conducted to compare safety (immunogenicity) and efficacy of GP-Asp and NN-Asp, and confirm their similarity as the last stage of the clinical development program.
Materials & methods
Study design & treatment
This was a Phase III, multicenter, openlabel, randomized, activecontrolled, parallelgroup, noninferiority 26-week study conducted in 19 study sites. Eligible study participants with T1D (n = 264) in accordance with the inclusion/exclusion criteria were randomized 1:1 to GP-Asp (n = 132) or NN-Asp (n = 132) treatment. The randomization was concealed using interactive web response system, allowing to manage the randomization.
The study period included screening procedure (up to 4 weeks), insulin dose titration (4 weeks) and treatment period with stable doses (22 weeks). The study participants administered insulin with pensinjectors. During insulin dose titration period, insulin doses of both bolus insulin aspart and basal insulin could be changed as much as needed to achieve optimal glycemic control. Insulin dose titration period took 4 weeks during which the participants measured capillary blood glucose level at least four-times a day or even more often due to their personal requirements each time they were supposed to have a hypoglycemic episode. Insulin dose adjustment was calculated depending on the blood glucose level during the day and optimal glycemic control. Optimal glycemic control was based on the individual HbA1c level according to standards of specialized diabetes care [1]. Measured values of glycemia, daily insulin doses and glycemia measurement frequency were registered by participants in the special diary. Basal insulin doses during the treatment period should have been stable. The study participants adjusted bolus insulin dose on their own according to metabolic requirements during all study periods. The investigators taught the study participants how to calculate bolus insulin dose to achieve target glycemic control.
To provide participants’ safety during the treatment period with stable doses (in case of hypoglycemic episodes associated with dietary or physical activity changes and presence of concominant diseases) basal insulin dose also could be adjusted within 15%, however, it was not recommended generally. To maintain stable blood glucose levels, the participants should have measured capillary blood glucose level at least four-times a day or even more often due to their personal requirements each time they were supposed to have a hypoglycemic episode.
The batch numbers of the used Novorapid Penfills are HJ30068 and HJ30086. Products of Novorapid were supplied by the official Novo Nordisk supplier OOO ‘Torgovyj Dom Zdorovye natsii’. The delivery of the drug to the study centers was provided by the transporting companies in compliance with required temperature conditions.
The study was registered under ClinicalTrials.gov number NCT04079413.
Study population
Eligible participants were 18–65 years old, with T1D diagnosed for at least 12 months before screening, with history of basal-bolus insulin therapy in stable doses for at least 30 days before screening, with HbA1c level 7.1–12.0% and BMI 18.5–35.0 kg/m2 at screening.
The trial included only T1D patients since they are considered to be more sensitive developing insulin antibodies in response to exogenous insulin [4,5].
The key exclusion criteria were as follows:
•
contraindications for insulin aspart treatment;
•
insulin resistance (daily insulin requirement >1.5 units/kg);
•
change in basal or bolus insulin therapy (international non-proprietary name insulin) within 6 months before the screening;
•
prior treatment with insulin pump for 180 days prior to screening or indication for insulin pump;
•
history of severe hypoglycemia within the last 6 months before screening;
•
treatment with any biosimilar insulins, except for the ones manufactured by GEROPHARM within the last 6 months;
•
regular administration of immunosuppressive drugs or/and immunomodulatory therapy.
Patients with several diabetes complications in advanced stage (proliferative diabetic retinopathy, severe peripheral diabetic neuropathy or autonomic neuropathy, diabetic nephropathy with estimated glomerular filtration rate <45 ml/min/1.73 m2, diabetic foot syndrome) found at screening or earlier were also not enrolled to the clinical trial.
The full list of the exclusion criteria is provided at ClinicalTrials.gov.
Immunogenicity end points
Immunogenicity outcome measures were the primary safety end points in this study.
Anti-insulin antibodies (AIA) baseline concentration was assessed before the beginning of treatment at screening. Patients with AIA baseline concentration exceeding 10 IU/ml was estimated as AIA positive patients.
The primary end point was frequency of immune response at week 26. The immune response was assessed by the following criteria:
•
increase of AIA concentration for more than 30% from baseline for subjects with AIA concentration more than 10 IU/ml at screening (positive test);
•
any AIA concentration exceeding 10 IU/ml at week 26 for participants with negative test at screening (AIA concentration of 10 IU/ml or less).
Secondary immunogenicity end points included:
•
change in mean AIA concentration from baseline (at screening) to weeks 12 and 26;
•
presence of neutralizing AIA at week 26 in participants with negative test at screening;
•
percentage of participants with clinically significant immune response at week 26.
AIA concentration was assessed using the validated enzyme immunoassay method in the central laboratory.
Clinically significant immune response included AIA concentration increase for more than 30% from baseline combined with the following criteria:
•
HbA1c increase for 0.2% (NGSP/DCCT) or more from baseline (at screening);
•
increase of basal insulin requirement for 20% or more compared with the stable insulin dose (within 15%, established during the titration period) in the end of titration period.
To detect neutralizing AIA, we used the method with iLiteTM insulin assay ready cells introducing the firefly luciferase reporter gene to their genome under the control of an insulin-dependent promoter [7]. Neutralizing activity was established via binding of insulin alfa-chain and CD220 receptor in samples.
Efficacy end points
In the present clinical trial, efficacy end points were considered as secondary in accordance with the regulatory guidelines [4,5] and included:
•
HbA1c change at week 26 from baseline (at screening);
•
change in fasting plasma glucose (FPG) level at week 26 from baseline (at screening);
•
change in seven-point glucose profile (SPGP) at week 26 from baseline (in the end of titration period – week 4);
•
percentage of participants who achieved HbA1c ≤7.0% at week 26;
•
percentage of participants who achieved an individual glycemic target at week 26 based on HbA1c value;
•
change in insulin dose at week 26 from baseline (in the end of titration period – week 4);
•
change in bodyweight at week 26 from baseline (at screening);
•
patients’ satisfaction with the current diabetes treatment in diabetes treatment satisfaction questionnaire status version (DTSQs) and change version (DTSQc) tests at week 26, DTSQs values were also compared with baseline ones (at randomization).
The study investigators established individual glycemic target for each participant in accordance with the national guidelines for diabetes treatment [1] at the randomization visit. They did not change this target during the study periods.
HbA1c (in %) was measured in blood samples at screening and weeks 12 and 26 in the central laboratory (automated HPLC method) (ZAO ‘Unimed Laboratories’, Moscow). The laboratory has been assessed and certified as meeting the requirements of ISO 9001:2015, providing validated methodology of testing.
FPG level was measured in venous blood samples at screening, week 12 and 26. The analysis of FPG level was also performed at the central laboratory (enzymatic UV test [hexokinase method] for the quantitative determination of glucose in human serum, plasma, urine, hemolysate and cerebrospinal fluid on Beckman Coulter analyzers).
SPGP was performed by the participants using glucometers Accu-Chek Active provided by the sponsor. The study subjects performed SPGP for 3 days, whereas two out of three measurement days should have been consecutive. SPGP was performed at the week preceding 4th, 6th and 9th visit (weeks 4, 12 and 26, respectively). They measured capillary blood glucose in fasting condition, 2 h after breakfast, before lunch, 2 h after lunch, before dinner, 2 h after dinner and at 3 am.
DTSQs and DTSQc questionnaires measured patients' satisfaction with the current diabetes treatment. Both questionnaires consisted of eight questions estimating absolute and relevant satisfaction values for DTSQs and DTSQc, respectively. Patients completed DTSQs at randomization and week 26, while DTSQc was completed only at week 26.
Safety end points
In the study, incidence and severity of adverse events (AEs) including adverse events of special interest such as hypoglycemic episodes, injection site reactions and hypersensitivity reactions, were assessed. In addition, the changes in vital signs, ECG and laboratory results compared with baseline were also assessed. All investigators reported AEs either observed at the study visits or spontaneously reported by study subjects. AEs were recorded in source documents and electronic case report forms. AE details were collected for all study participants from signing the informed consent form to their last visit.
Each AE was assessed by the study investigators according to the following criteria: seriousness, severity, relationship with the investigational or comparator insulin (WHO-UMC causality assessment). Therefore, any symptom, complaint or illness which occurrence might have been associated with GP-Asp or NN-Asp, was attributed to AE.
A serious AE (SAE) was any untoward medical occurrence at any drug dose that, in the opinion either of the investigator or sponsor, resulted in death, was lifethreatening, required hospitalization, led to persistent/significant disability/incapacity or was congenital anomaly/birth defect. If a SAE occurred, it was reported to the sponsor within 24 h. Every SAE was reviewed by the Sponsor’s central Pharmacovigilance and Medical teams based on their clinical judgment. All non-SAEs were periodically analyzed by the Sponsor's Medical team.
Hypoglycemic episodes, ketoacidosis, allergic and injection site reactions were evaluated separately from other AEs since they were considered as AEs of special interest (according to the study protocol). Hypoglycemic episodes were recorded by the participants in their personal self-care glycemic diaries. Only episodes with capillary blood glucose level less than 3.9 mmol/l were considered hypoglycemic episodes. In addition, symptoms of hypoglycemia, need in assistance from other people, loss of consciousness, starting time of the hypoglycemia event and nocturnal hypoglycemia were also considered to describe hypoglycemia episodes. Severe hypoglycemia was reported if a person needed any assistance from other people [1]. Local injection site reactions and hypersensitivity reactions were assessed during visits of each patient to the study site and were also recorded by the study participants in their diaries. The data were entered into electronic case report forms.
Statistical analysis
All data analyses were made using Windows software RStudio version 3.5.0 in accordance with the approved statistical analysis plan. The statistical analyses were performed in the Full Analysis Set population. Full Analysis Set population is the set of subjects that is as close as possible to the ideal implied by the Intention-to-treat principle. It is derived from the set of all randomized subjects by minimal and justified elimination of subjects (ICH E9).
Quantitative statistical analysis is described using:
•
quantitative observations (n);
•
mean variables (mean);
•
95% CI;
•
standard deviations (SD).
ANCOVA was used to estimate changes in continuous variables from baseline. For each of these variables, ANCOVA included baseline variable value as a covariate and treatment group and study site as fixed factors. If the changes from baseline were not assessed, Student’s t-test or Mann–Whitney U-test were used to compare continuous variables depending on normality of distribution. In case of inequality of variances in groups (evaluated using Levene’s test), Welch’s unequal variances t-test was used instead of Student’s t-test.
Qualitative statistical analysis is described using:
•
absolute frequency (quantitative observations);
•
relative frequency (%).
Qualitative (categorical) variables were compared with X2-test (continuity correction was used if any units contained value of 6–10) or exact Fisher’s test (if any units contained value of 0–5). The change in dichotomous variables from baseline with McNemar test was also analyzed.
p-value < 0.05 was accepted as statistically significant.
Sample size estimation
Immunogenicity of insulin is considered to be relatively low, though there was no need to provide high study power in terms of frequency of immune response [4,5]. In the comparative studies of insulin immunogenicity, sample size is estimated based on HbA1c values in accordance with the regulatory guidelines [4,5]. We used α level 0.025, β level 0.2, HbA1c mean difference 0, SD 1.1 and δ 0.4% in accordance with regular practice for antihyperglycemic drugs [8]. Based on the estimated values, the total number of required subjects was estimated as 238 (119 participants per group). Taking into account a possible 10% early withdrawal rate, 264 patients were randomized.
Approvals of the regulatory authorities & Independent Ethics Committee
The trial was conducted in accordance with the Guidelines on Good Clinical Practice and Ethical Principles for Medical Research Involving Human Subjects laid down in the Declaration of Helsinki [9]. All study participants provided the written informed consent before participation in the study. The trial was approved by the Ministry of Health of the Russian Federation (Clinical trial approval no. 217 dated 26 April 2019) and by the Ethics Council (abstract No. 188 dated 12 March 2019).
Results
Study participants
We screened 309 T1D patients and randomized 264 of them (132 to GP-Asp, 132 to NN-Asp groups). Three participants discontinued GP-Asp therapy (two subjects decided to withdraw from the study, the third one was lost to follow-up), and one participant discontinued NN-Asp therapy (death of the subject). Figure 1 provides the flowchart of the study participants. Baseline characteristics of the study subjects are presented in Table 1. All baseline characteristics were comparable between the groups except smoking status: there were more smoking patients in GP-Asp group compared with NN-Asp group.
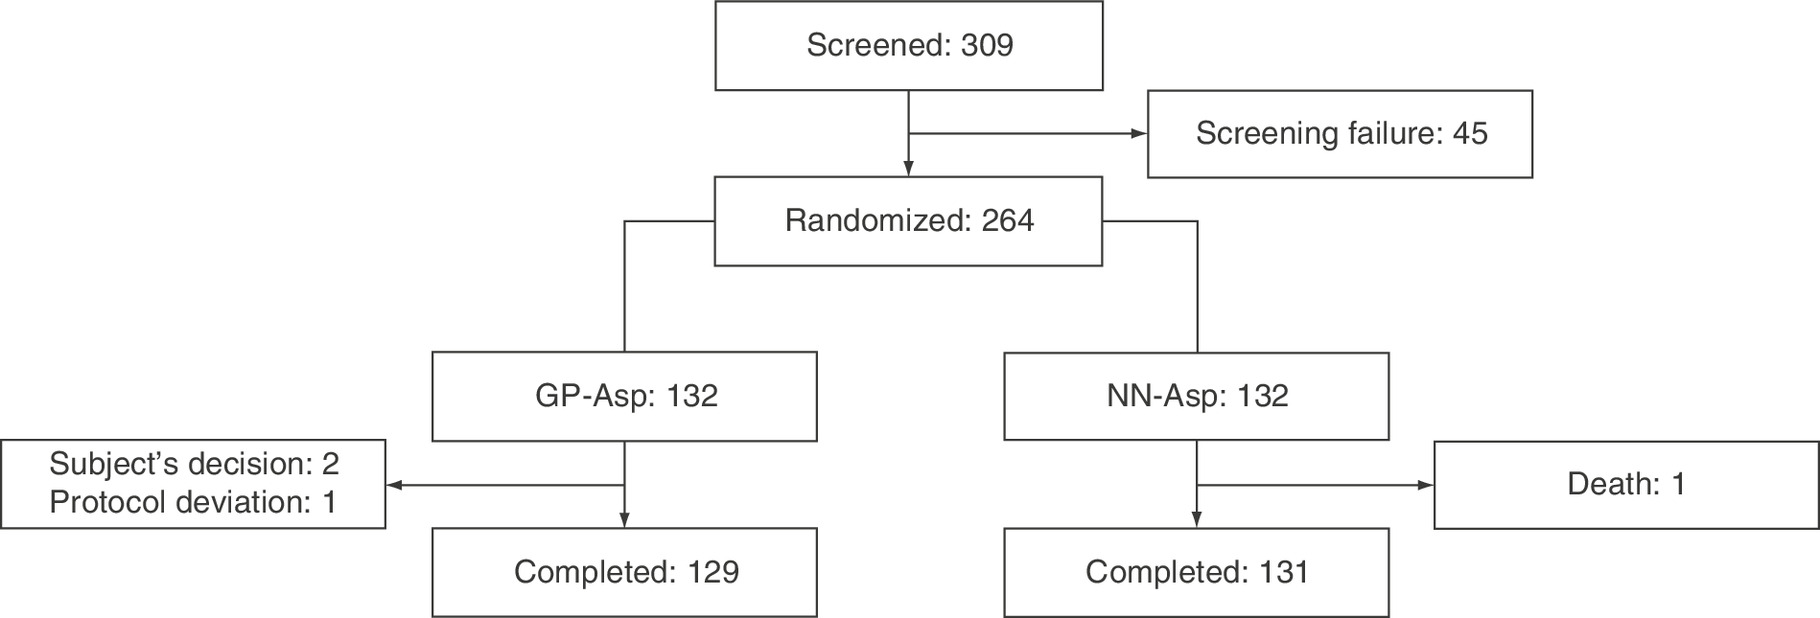
Figure 1. Flowchart of the study participants.
GP-Asp: GP40071 insulin aspart; NN-Asp: NovoRapid® Penfill®.
| Characteristics | GP-Asp (n = 132) | NN-Asp (n = 132) |
|---|---|---|
| Age, years | 37.77 ± 11.59 | 38.03 ± 10.85 |
| Gender (female) | 67 (50.8%) | 63 (47.7%) |
| Ethnicity (European) | 132 (100.0%) | 131 (99.2%) |
| Bodyweight, kg | 73.64 ± 13.59 | 72.30 ± 12.74 |
| BMI, kg/m2 | 25.02 ± 3.56 | 24.66 ± 3.49 |
| Smokers – Yes – No – Prior – Unknown | 28 (21.2%) 100 (75.8%) 3 (2.3%) 1 (0.8%) | 15 (11.4%) 116 (87.9%) 1 (0.8%) 0 (0.0%) |
| Duration of diabetes, years | 13.87 ± 9.67 | 13.18 ± 9.02 |
| Basal insulin therapy (Trade name) – Toujeo – Lantus – Levemir – Tresiba – Biosulin N – Rinsulin NPH – Rosinsulin S – Humulin NPH | 62 (47.0%) 43 (32.6%) 11 (8.3%) 9 (6.8%) 1 (0.8%) 3 (2.3%) 3 (2.3%) 0 (0.0%) | 66 (50.0%) 41 (31.1%) 10 (7.6%) 8 (6.1%) 4 (3.0%) 1 (0.8%) 1 (0.8%) 1 (0.8%) |
| Bolus insulin therapy (Trade name) – Novorapid – Humalog – Apidra – Biosulin R – Rinsulin R – Rosinsulin R – Actrapid | 48 (36.4%) 48 (36.4%) 25 (18.9%) 3 (2.3%) 4 (3.0%) 4 (3.0%) 0 (0.0%) | 53 (40.2%) 37 (28.0%) 30 (22.7%) 5 (3.8%) 4 (3.0%) 2 (1.5%) 1 (0.8%) |
| Frequency of basal insulin therapy – Morning – Evening – Morning and Evening | 9 (6.8%) 105 (79.5%) 18 (13.6%) | 13 (9.8%) 104 (78.8%) 15 (11.4%) |
| Frequency of bolus insulin therapy – Three-times a day – Four-times a day | 122 (92.4%) 10 (7.6%) | 122 (92.4%) 10 (7.6%) |
| Total insulin dose, units/day | 51.10 ± 13.61 | 50.71 ± 15.59 |
| Basal insulin dose, units/day | 24.48 ± 8.30 | 24.52 ± 9.95 |
| Bolus insulin dose, units/day | 26.61 ± 8.16 | 26.20 ± 8.49 |
| AIA concentration, units/ml (at screening) | 4.86 ± 12.62 | 3.74 ± 4.21 |
| HbA1c, % | 8.69 ± 1.05 | 8.63 ± 1.05 |
| FPG, mmol/l | 11.04 ± 4.51 | 11.07 ± 3.77 |
| DTSQs, points | 25.48 ± 6.76 | 23.68 ± 7.06 |
AIA: Anti-insulin antibodies; DTSQs: Diabetes Treatment Satisfaction Questionnaire (status version); FPG: Fasting plasma glucose; GP-Asp: GP40071 insulin aspart; HbA1c: Glycated hemoglobin; NN-Asp: NovoRapid® Penfill®; NPH: Neutral protamine hagedorn.
Immunogenicity
At baseline there were 10 AIA positive (122 AIA negative) patients in GP-Asp group and 12 AIA positive (120 AIA negative) patients in NN-Asp group.
However, variety of immune response trends was registered: three participants in GP-Asp group and two participants in NN-Asp group became AIA negative at week 26 compared with week 12, while eight participants in GP-Asp group and five participants in NN-Asp group developed immune response only after week 26.
The frequency of immune response at week 26 did not differ between the groups (Table 2).
| GP-Asp (n = 132) | NN-Asp (n = 132) | p-value | |
|---|---|---|---|
| Participants with antibody positive and negative immune response at baseline, n (%) | |||
| Antibody positive | 10 (7.6%) | 12 (9.1%) | 0.824 |
| Antibody negative | 122 (92.4%) | 120 (90.9%) | |
| Participants with immune response, n, (%) • at week 12 ○ patients with immune response ○ patients without immune response • at week 26 ○ patients with immune response ○ patients without immune response | 7 (5%) 123 (93%) 12 (9%) 118 (89%) | 4 (3%) 128 (97%) 7 (5%) 125 (95%) | 0.375 0.323 |
| Change of AIA concentration from baseline, units/ml. Data are mean ± standard deviation. • at week 12 • at week 26 | 1.18 ± 7.77 1.65 ± 7.11 | 0.21 ± 2.09 0.40 ± 2.45 | 0.718 0.084 |
| Participants with neutralizing AIAs (n; %) • at screening • at week 26 • newly developed neutralizing AIAs | 29 (22%) 29 (22%) 12 (9.1%) | 29 (22 %) 29 (22%) 14 (10.6%) | 1.000 1.000 1.000 |
AIA: Anti-insulin antibodies; GP-Asp: GP40071 insulin aspart; NN-Asp: NovoRapid® Penfill®.
Mean baseline AIA concentration in GP-Asp group and NN-Asp group were similar (p = 0.545). Mean AIA concentration at week 12 was 6.06 ± 14.17 units/ml in GP-Asp group and 3.95 ± 4.60 units/ml in NN-Asp group. By week 26, mean AIA concentration was 6.53 ± 14.72 units/ml in GP-Asp group and 4.14 ± 4.94 units/ml in NN-Asp group. The changes in AIA levels by weeks 12 and 26 are shown in Table 2. These changes were not statistically significant in both groups.
Due to the evaluated wide SD for AIA change (2.5x the means), outliers were excluded from the statistical analysis. Figure 2 shows box and wafer plots with outliers at baseline, 12 and 26 weeks. Statistical analysis of AIA change also revealed no significant difference between groups, however the SD for means became rather smaller (Table 3).
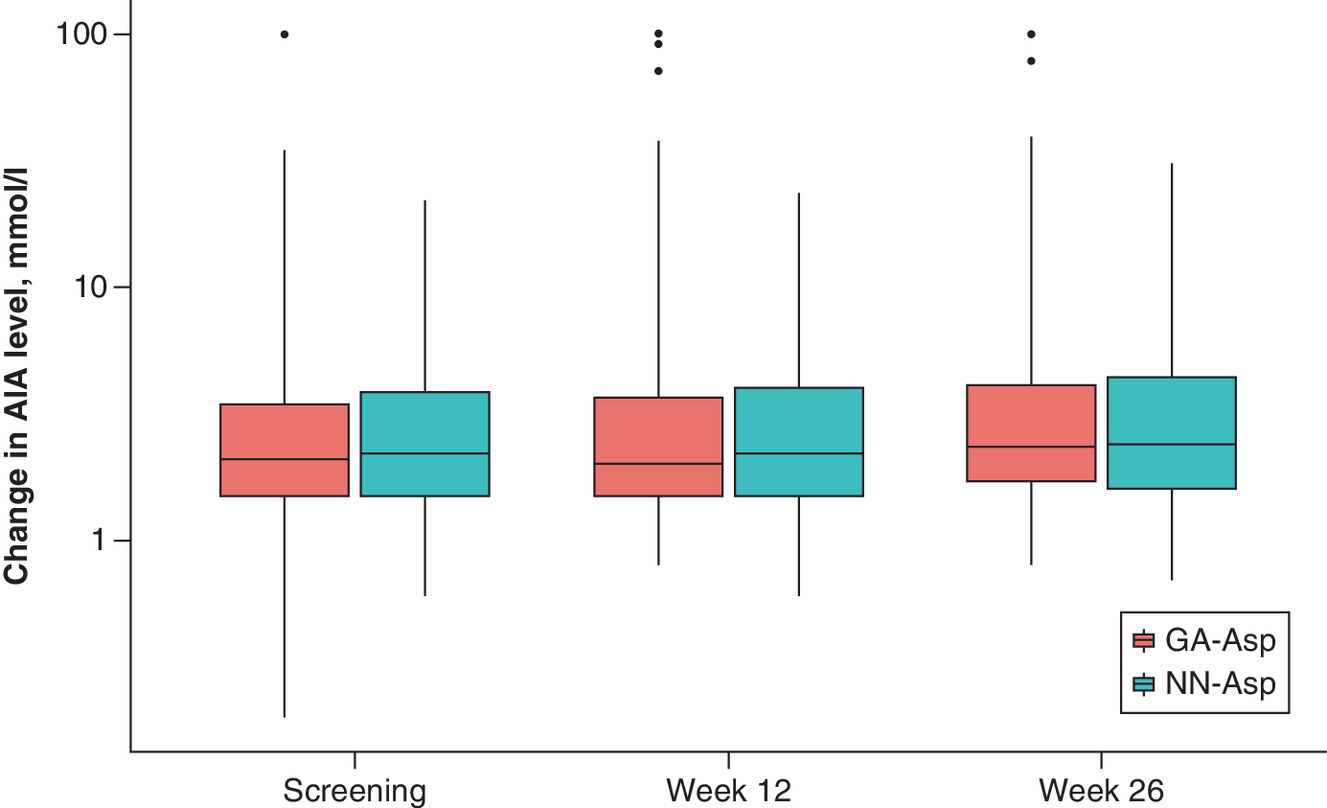
Figure 2. Change of AIA concentration from baseline by study visits.
Outliers are shown out of whiskers. Lower box border: lower hinge, 25% quantile. Upper box border: upper hinge, 75% quantile. Ymin: lower whisker = smallest observation greater than or equal to lower hinge -3 * IQR. Ymax: upper whisker = largest observation less than or equal to upper hinge + 3 * IQR.
AIA: Anti-insulin antibodies; GP-Asp: GP40071 insulin aspart; IQR: Interquartile range; NN-Asp: NovoRapid® Penfill®.
| Visit | Stats | GP-Asp (n = 132) | NN-Asp (n = 132) | p-value (BL/change from BL between groups) | ||
|---|---|---|---|---|---|---|
| Result | Change from BL | Result | Change from BL | |||
| Screening | n | 130 | 132 | 0.408 | ||
| Mean, units/ml | 3.40 | 3.74 | ||||
| 95% CI, units/ml | [2.61, 4.19] | [3.01, 4.46] | ||||
| SD, units/ml | 4.55 | 4.21 | ||||
| Median, units/ml | 2.10 | 2.20 | ||||
| Q1, Q3, units/ml | 1.50, 3.38 | 1.50, 3.85 | ||||
| Min, max, units/ml | 0.20, 35.10 | 0.60, 22.30 | ||||
| Week 12 | n | 127 | 127 | 132 | 132 | 0.712 |
| Mean, units/ml | 4.13 | 0.72 | 3.95 | 0.21 | ||
| 95% CI, units/ml | [3.02, 5.23] | [-0.13, 1.57] | [3.16, 4.74] | [-0.15, 0.57] | ||
| SD, units/ml | 6.27 | 4.85 | 4.60 | 2.09 | ||
| Median, units/ml | 2.00 | 0.10 | 2.20 | 0.00 | ||
| Q1, Q3, units/ml | 1.50, 3.40 | -0.55, 0.70 | 1.50, 3.97 | -0.52, 0.72 | ||
| Min, max, units/ml | 0.80, 37.90 | -23.90, 34.10 | 0.60, 23.50 | -5.70, 12.10 | ||
| p-value | 0.293 | 0.572 | ||||
| Week 26 | n | 127 | 127 | 132 | 132 | 0.109 |
| Mean, units/ml | 4.49 | 1.16 | 4.14 | 0.40 | ||
| 95% CI, units/ml | [3.41, 5.56] | [0.42, 1.89] | [3.29, 4.99] | [-0.02, 0.83] | ||
| SD, units/ml | 6.13 | 4.19 | 4.94 | 2.45 | ||
| Median, units/ml | 2.30 | 0.30 | 2.40 | 0.20 | ||
| Q1, Q3, units/ml | 1.70, 3.85 | -0.20, 1.15 | 1.60, 4.40 | -0.50, 0.90 | ||
| Min, max, units/ml | 0.80, 39.30 | -19.50, 26.30 | 0.70, 31.00 | -7.10, 11.70 | ||
| p-value | <0.001 | 0.083 | ||||
BL: Baseline; GP-Asp: GP40071 insulin aspart; Min: Minimum value; Max: Maximum value; NN-Asp: NovoRapid® Penfill®; SD: Standard deviation; Q1: 25% quantile; Q3: 75% quantile.
During the study, no subject developed a clinically significant immune response. Developing AIAs did not affect treatment efficacy (p = 0.093).
Blood samples of all study participants were also tested for neutralizing AIA at screening and week 26. Seventeen of 132 patients in GP-Asp group and 15 of 132 in NN-Asp group developed neutralizing AIAs by week 26 (p = 1.000) and none of them had any clinical signs indicating the reduced efficacy of insulin treatment and the development of neutralizing AIA did not affect treatment efficacy (p = 0.895).
Efficacy
HbA1c level significantly decreased from baseline at week 12 for 0.55 ± 1.10% in GP-Asp group (p < 0.001) and for 0.64 ± 1.09% in NN-Asp group (p < 0.001). HbA1c level also significantly decreased from baseline at week 26 for 0.57 ± 1.21% in GP-Asp group (p < 0.001) and for 0.56 ± 1.10% in NN-Asp group (p < 0.001). The following changes did not differ between the groups either at week 12 (p = 0.542) or week 26 (p = 0.955). HbA1c changes are shown in Figure 3.
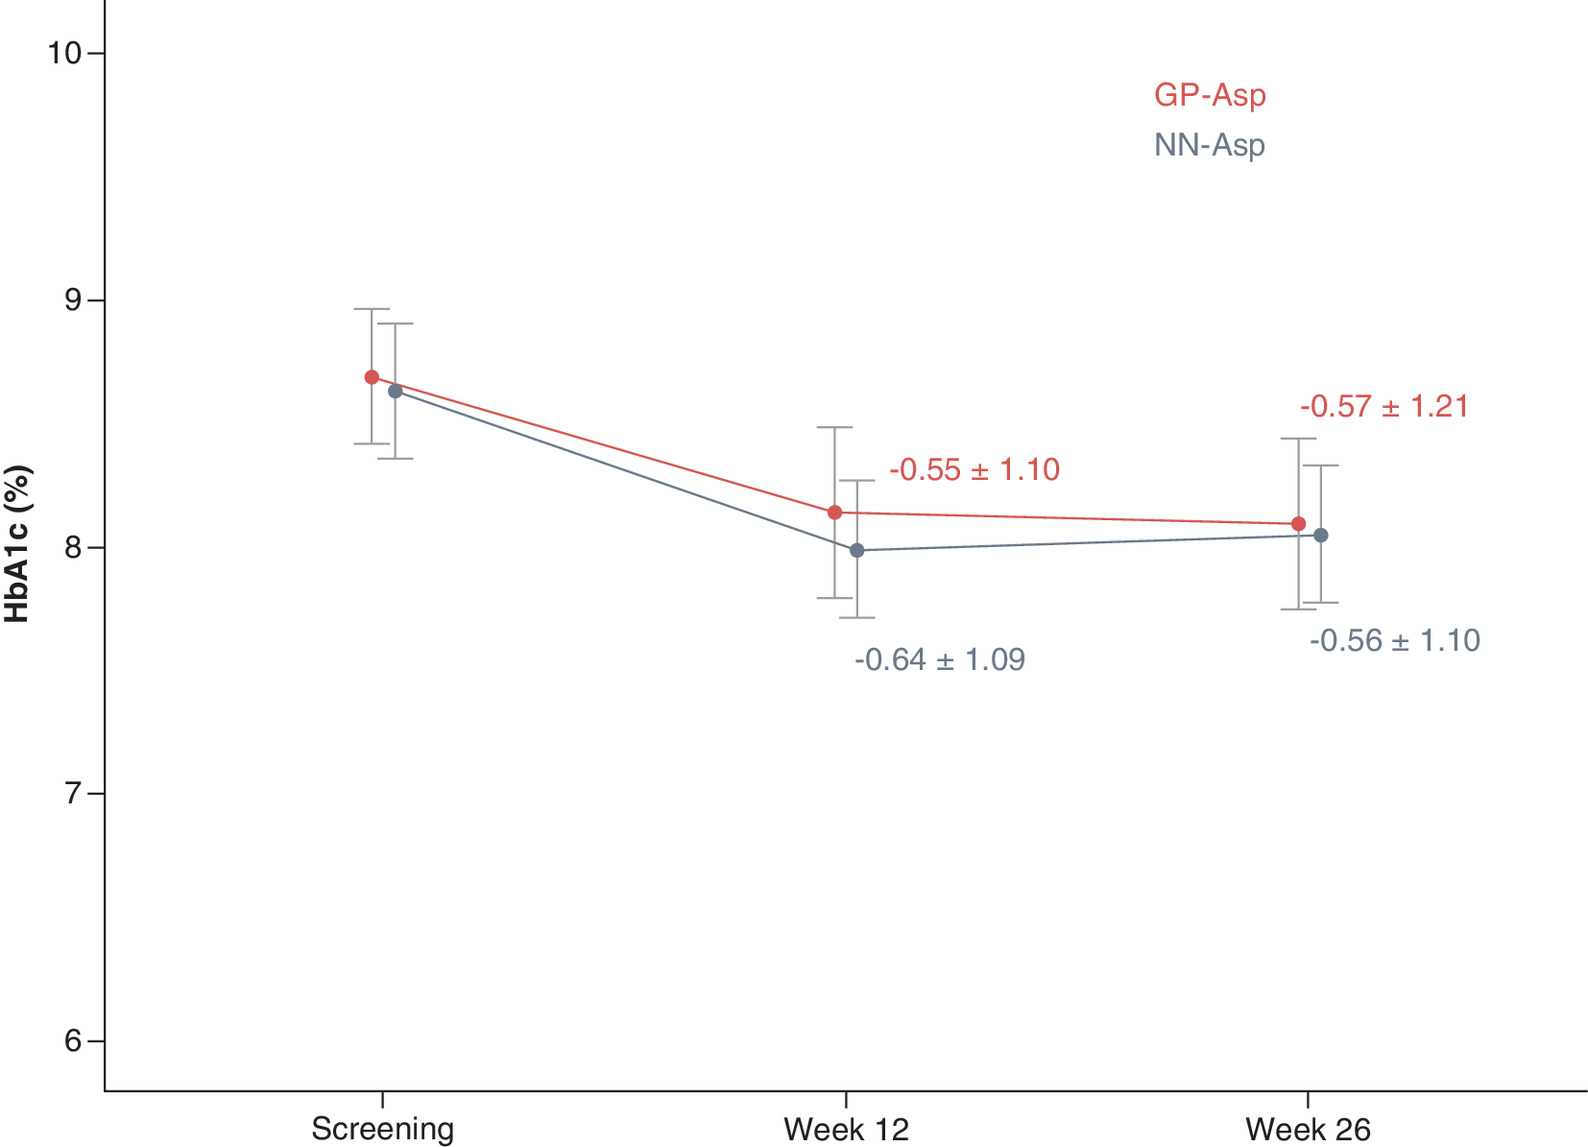
Figure 3. HbA1c (%) by study visit.
Data are mean ± standard deviation.
GP-Asp: GP40071 insulin aspart; HbA1c: Glycated hemoglobin; NN-Asp: NovoRapid® Penfill®.
Intergroup mean difference of HbA1c level change (95% CI) at week 26 from baseline was 0.00 [-0.26, 0.25] %. The CI did not cross the established 0.4% noninferiority margin demonstrating that GP-Asp was noninferior to NN-Asp in terms of hypoglycemic efficacy.
Moreover, 26 patients (25%) in GP-Asp group and 19 (22%) patients in NN-Asp group could achieve HbA1c ≤7% at week 26 (p = 0.298). GP-Asp and NN-Asp groups also did not differ in individual glycemic target achieved at week 26 (p = 0.602).
FPG level significantly decreased from baseline at week 12 for 1.67 ± 5.19 mmol/l in GP-Asp group (p = 0.002) and for 1.09 ± 5.22 mmol/l in NN-Asp group (p = 0.006). FPG level also decreased significantly from baseline at week 26 for 1.25 ± 5.32 mmol/l in GP-Asp group (p = 0.015) and for 1.15 ± 4.70 mmol/l in NN-Asp group (p = 0.001). These changes did not differ between the groups either at week 12 (p = 0.232) or week 26 (p = 0.720). FPG changes are shown in Figure 4.
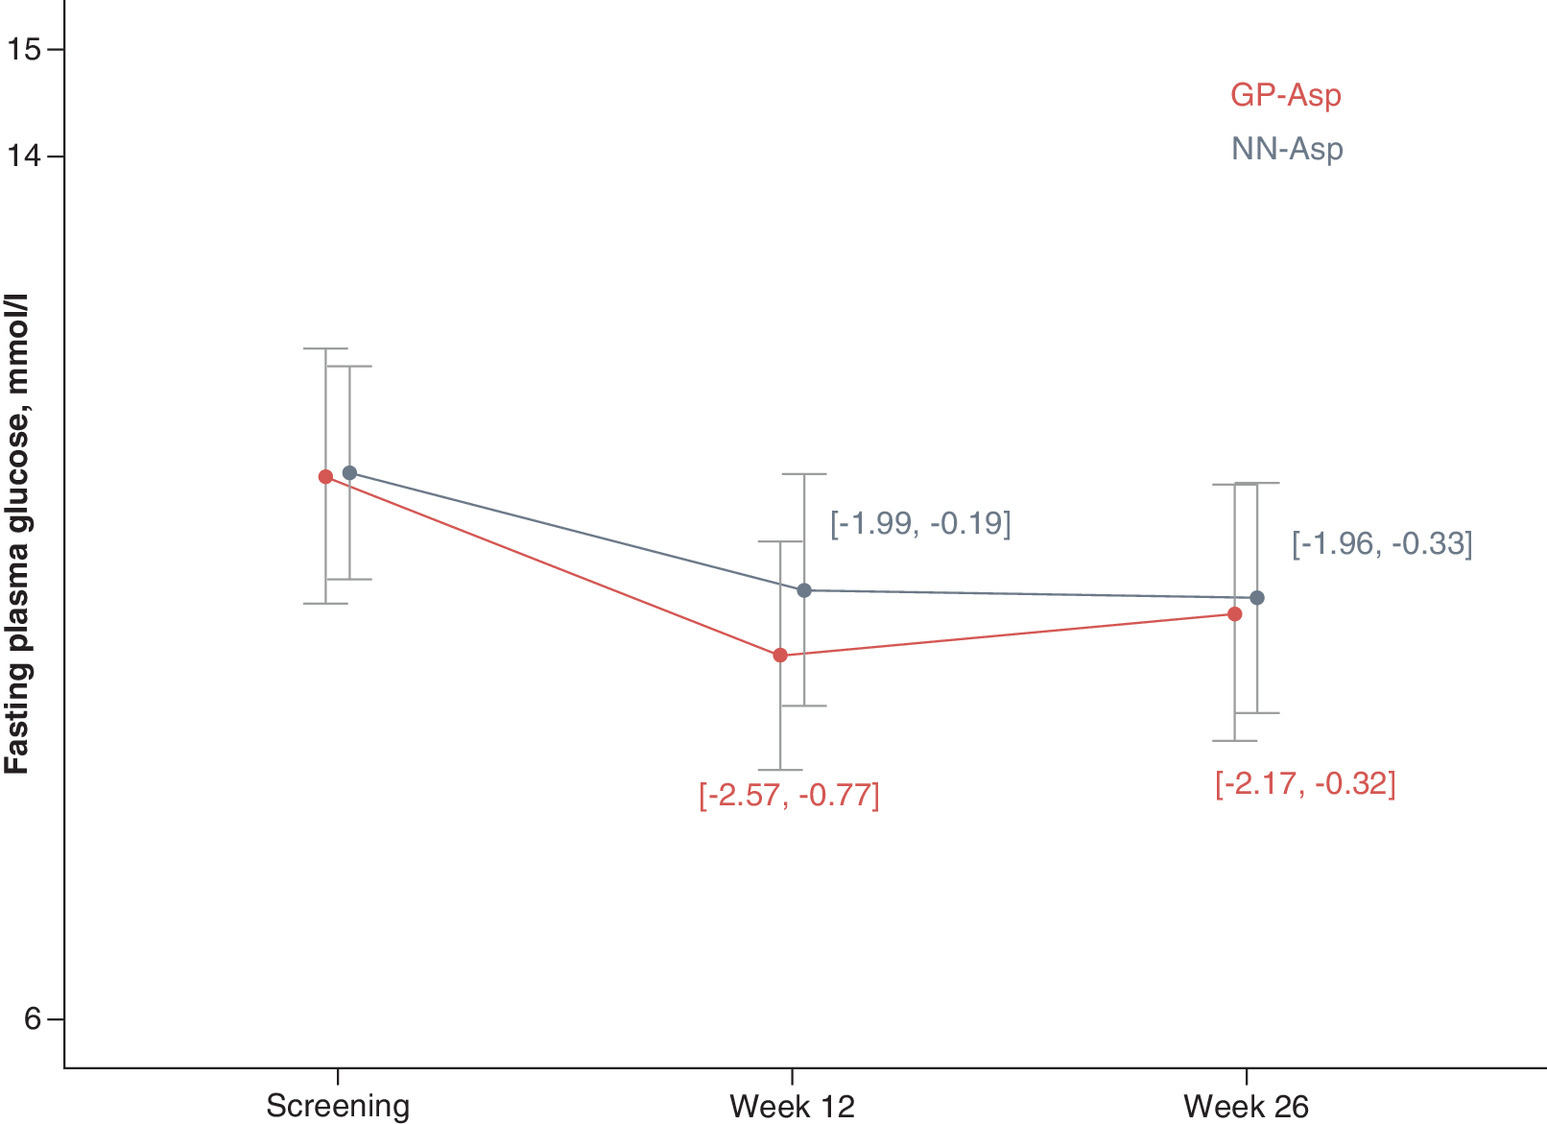
Figure 4. Fasting plasma glucose (mmol/l) by study visit.
Data are mean ± standard deviation.
FPG: Fasting plasma glucose; GP-Asp: GP40071 insulin aspart; NN-Asp: NovoRapid® Penfill®.
SPGP changes did not differ between the groups at week 26 (p = 0.579; p = 0.327; p = 0.559; p = 0.633; p = 0.867; p = 0.309; p = 0.671 in fasting condition, 2 h after breakfast, before lunch, 2 h after lunch, before dinner, 2 h after dinner and 3 am, respectively). SPGP data are shown in Figure 5.
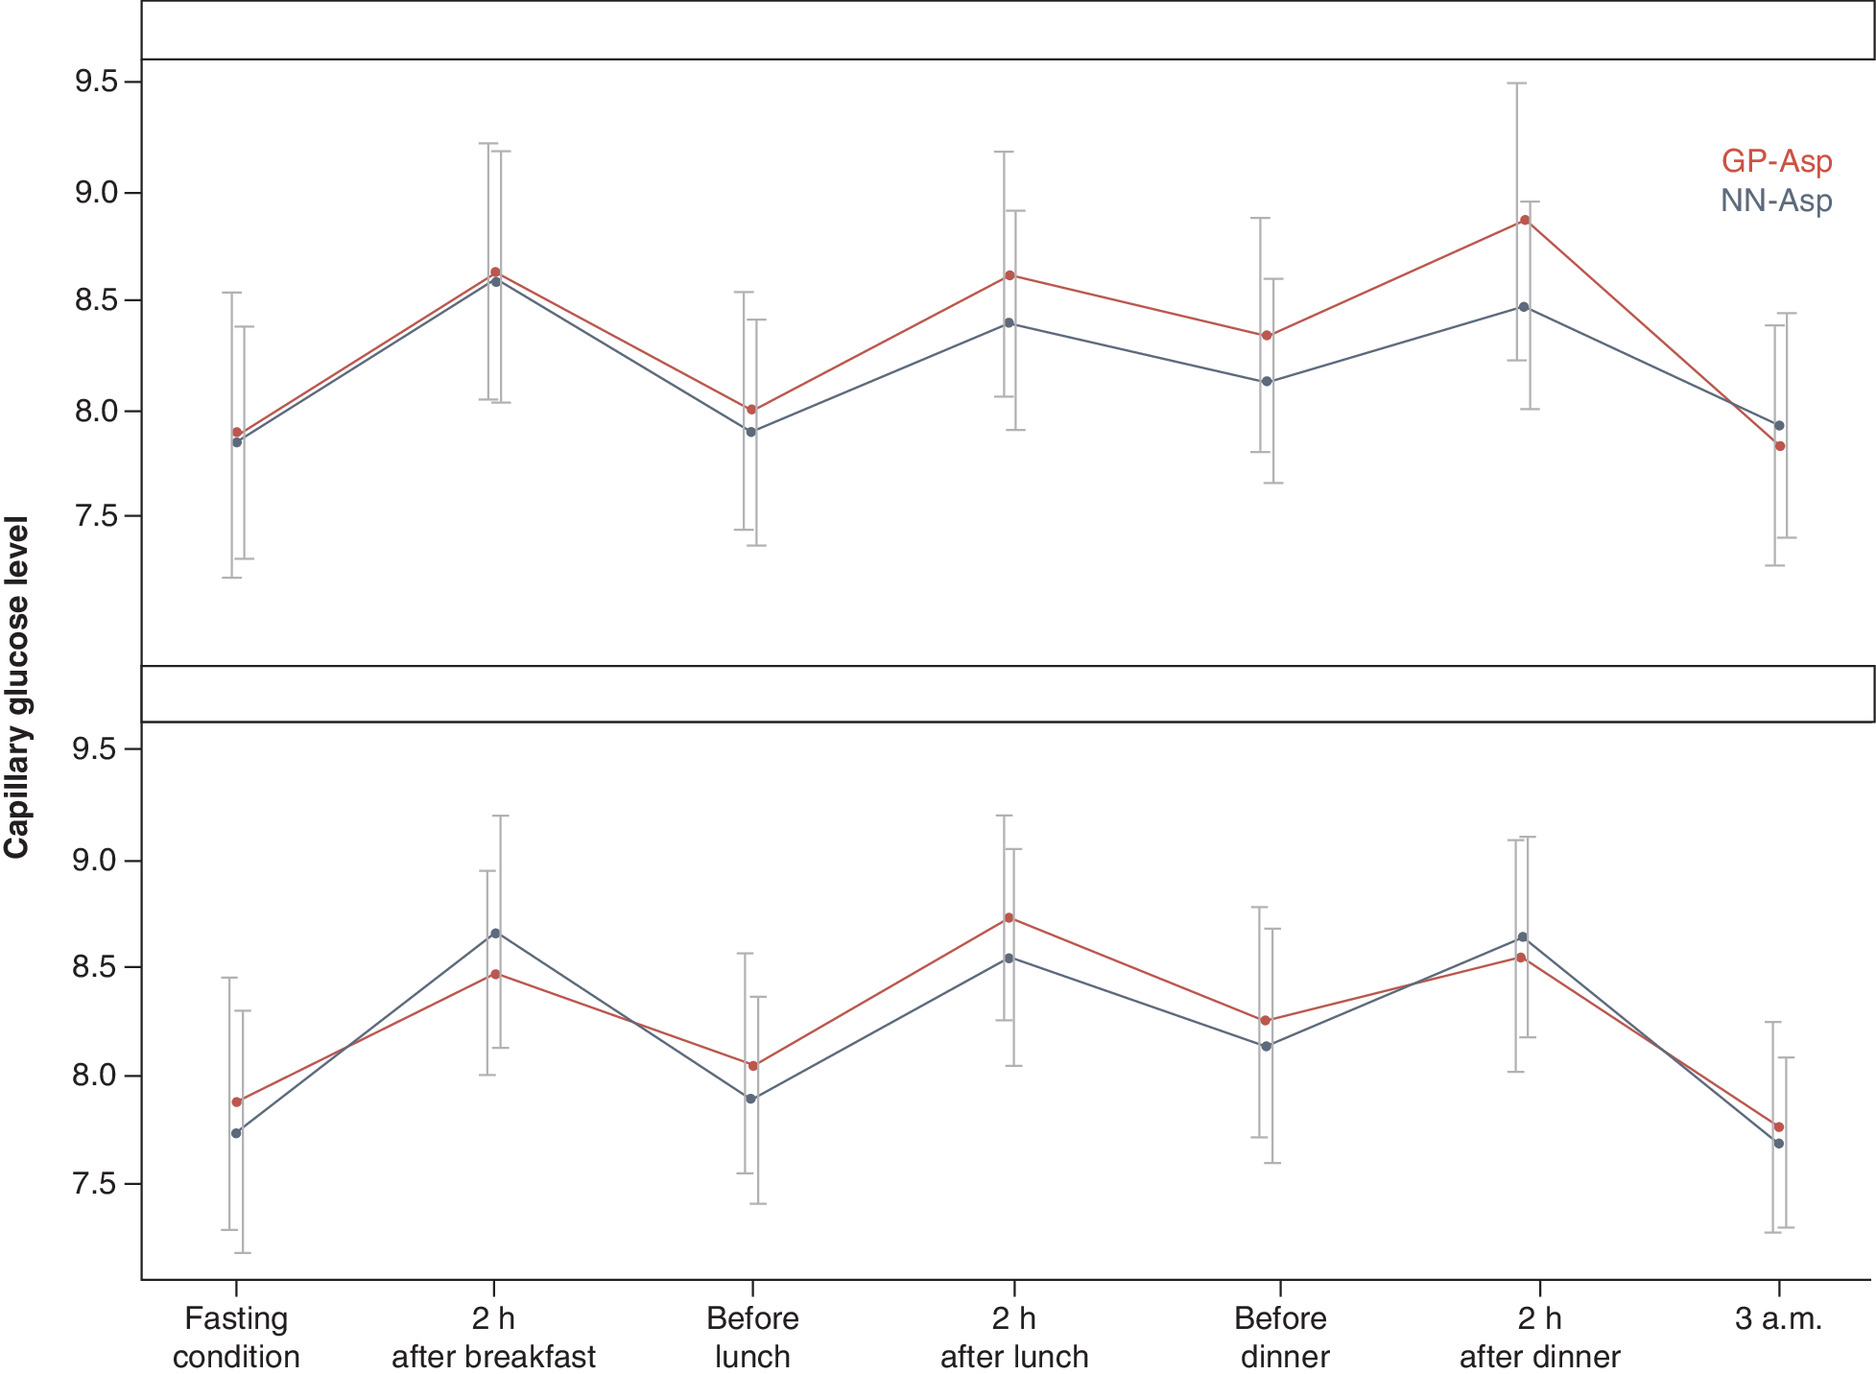
Figure 5. Seven-point self-monitored plasma glucose profiles (mmol/l) at baseline (screening) and week 26.
Data are mean ± standard deviation.
GP-Asp: GP40071 insulin aspart; NN-Asp: NovoRapid® Penfill®; SMPG: Self-monitored plasma glucose.
Total insulin dose was significantly increased in both groups at week 26 compared with week 4 for 1.25 ± 6.43 units/day in GP-Asp group (p = 0.025) and 1.45 ± 4.67 units/day in NN-Asp group (p < 0.001), but these changes did not differ between the groups (p = 0.667). Insulin dose per kg was slightly increased by week 26 in both groups (0.02 ± 0.09 units/kg/day in GP-Asp; p = 0.016 and 0.01 ± 0.07 units/kg/day in NN-Asp; p = 0.001), but these changes did not differ between the groups (p = 0.975).
In GP-Asp group, bodyweight of the patients did not change (-0.04 ± 1.77 kg; p = 0.772), however bodyweight was increased in NN-Asp group at week 26 compared with baseline values for 0.38 ± 2.13 kg (p = 0.004). These changes did not differ between the groups (p = 0.113).
Treatment satisfaction was significantly increased in both groups at week 26. The increase in DTSQs total score was 4.23 ± 6.95 points in GP-Asp group (p < 0.001) and 6.06 ± 7.32 points in NN-Asp group (p < 0.001) and was similar between the groups (p = 0.801). DTSQc scores did not differ between the groups in any question.
Safety
The incidence of AEs, SAEs, discontinuations due to AEs and adverse drug reactions reported in GP-Asp group were similar to those in NN-Asp group (Table 4). Two of 56 AEs in GP-Asp group and seven of 88 AEs in NN-Asp groups were classified as adverse drug reactions, and their incidence did not differ between the groups (p = 0.480).
| GP-Asp (n = 132) | NN-Asp (n = 132) | |
|---|---|---|
| Participants with one or more AEs (n, [%]) | 38 (28.8%) | 51 (38.6%) |
| AEs (total) (number of cases) – Mild – Moderate – Severe | 56 52 4 0 | 88 68 18 2 |
| Adverse drug reactions (number of cases) | 2 | 7 |
| Serious AEs (number of cases) | 2 | 8 |
| AEs of special interest (number of cases) – Injection site reactions – Hypersensitivity reactions | 1 0 | 0 0 |
AE: Adverse event.
Most of these AEs were mild. There were ten SAEs: two in GP-Asp group and 8 in NN-Asp group. Only one SAE was considered by the investigator as possibly related to the investigational drug. It was a serious hypoglycemic episode in NN-Asp group, the investigator assessed the episode as a possibly life-threatening, however, the subject recovered without medical care and continued participation in the study. One death was reported in NN-group due to heart failure. The investigator assessed the death as not related to NN-Asp. One patient in GP-Asp group had an injection site reaction, and patients in NN-Asp group did not develop any injection site reactions. No hypersensitivity reactions were observed in either of the groups. There were no differences in any laboratory safety values or vital signs between the groups (data not shown).
Table 5 contains the summary of hypoglycemic episodes. The number of patients experiencing hypoglycemic episodes did not differ between the groups (p = 0.497). GP-Asp group had less hypoglycemic episodes for 1.4 events/patient-year (p = 0.052). During the study, there were two severe hypoglycemic episodes in GP-Asp group and one episode in NN-Asp group. Most patients in both groups experienced a mild hypoglycemia. Most hypoglycemic episodes were symptomatic in both groups, the patients with symptomatic or asymptomatic episodes did not differ between the groups (p = 0.840). Most hypoglycemic episodes occurred at daytime (06:00–23:59).
| GP-Asp (n = 132) | NN-Asp (n = 132) | |||
|---|---|---|---|---|
| n of subjects (%) | n of events (incidence rate/patient-year) | n of subjects (%) | n of events (incidence rate/patient year) | |
| Total patient-years | 63.88 | 64.93 | ||
| Total | 97 (73.5) | 1847 (28.9) | 91 (68.9) | 1967 (30.3) |
| Severity – Mild – Moderate – Severe – Unknown | 95 (72.0) 0 (0.0) 2 (1.5) 9 (6.8) | 1830 (28.6) 0 (0.0) 4 (0.1) 13 (0.2) | 91 (68.9) 0 (0.0) 1 (0.8) 7 (5.3) | 1941 (29.9) 0 (0.0) 1 (0.0) 25 (0.4) |
| Symptoms – Present – Absent – Unknown | 84 (63.3) 62 (47.0) 14 (10.6) | 1098 (17.2) 703 (11.0) 46 (0.7) | 82 (62.1) 56 (42.2) 16 (12.1) | 1260 (19.4) 665 (10.2) 42 (0.6) |
| Time of the episode – Night (00:00–05:59) – Day (06:00–23:59) | 56 (42.4) 96 (72.7) | 215 (3.4) 1632 (25.5) | 60 (45.5) 90 (68.2) | 281 (4.3) 1686 (26.0) |
GP-Asp: GP40071 insulin aspart; NN-Asp: NovoRapid® Penfill®.
Discussion & recommendations
Biosimilar insulins can potentially reduce treatment costs for people with diabetes mellitus owing to the lower price of biosimilars compared with reference products, thereby giving a greater access to insulin treatment for people with diabetes mellitus.
The immunogenic potential of insulin aspart was mainly assessed by determination of developing AIA to GP-Asp or NN-Asp. Similar immunogenicity was also confirmed based on assessment of neutralizing AIA using all pre-established immunogenicity end points. Both GP-Asp and NN-Asp were generally well tolerated, and there was no evidence of clinically significant differences in their safety profiles. Both changes in AIA concentration and development of neutralizing AIA did not influence treatment efficacy.
There were no significant differences in safety profiles including AEs and SAEs, between the groups. The AE profile of GP-Asp was consistent with the AE profile of NN-Asp in adults with T1D.
There were less hypoglycemic episodes (total and episodes per patient-year) in GP-Asp compared with NN-Asp, however not statistically significant (p = 0.052). The absolute difference in events per patient-year (1.4 event/patient-year) was comparable with the incidence rates observed in other studies of insulin biosimilars in patients with diabetes mellitus [8,10,11]. Injection site reactions were very rare and also similar between the groups.
The current study in patients with T1D showed that GP-Asp used in combination with basal insulin was noninferior to the commercially available NN-Asp, as measured by the change in HbA1c from baseline to week 26. Similar proportion of patients treated with GP-Asp and NN-Asp achieved either HbA1c <7% or their individual glycemic targets at week 26.
Both treatment groups improved their glycemic control, with FPG and SPGP levels similarly reduced from baseline to 26 weeks, along with similar changes in insulin dose and bodyweight. FPG changes from baseline at week 12 and 26 were significant in both groups, and they did not differ between GP-Asp and NN-Asp groups. SPGP changes did not differ between the groups at week 26.
The changes in GP-Asp and NN-Asp doses did not differ between the groups and were not clinically significant during the treatment period. The changes in bodyweight did not differ between the groups, however, it was a slight increase in bodyweight in NN-Asp group. The results of DTSQs and DTSQc questionnaires confirmed similar treatment satisfaction with GP-Asp and NN-Asp treatment.
However, the open-label design has some potential limitations. Patient blinding was not possible (and it was also not required) as GP-Asp was administered with disposable pens which design was different from the design of disposable pens used for the reference NN-Asp. Thus, the assessments were based on objective data that were analyzed in the central blinded laboratory.
The present study showed that GP-Asp was well tolerated and demonstrated similar immunogenicity (safety) and efficacy profile as NN-Asp which allows to prove its biosimilarity to commercially available insulin aspart.
Future perspective
Biosimilar products require less clinical trials than the original drugs since efficacy and safety of active pharmaceutical substance has already been proven by an originator, and the main goal of all biosimilar development programs is to show that a biosimilar does not differ from original biological drug. A less expensive development program makes it possible to establish a lower price for biosimilar products as compared with original biologicals, and it can be crucial in some countries with expensive biological drugs. Biosimilars allow more people to get access to effective treatment.
Study limitations
This study was open-label, and it could influence the investigators’ approach to insulin dose titration. However, it is not possible to blind such studies due to specific signs on insulin delivery systems and even is not required as immunogenicity end points are objective, and openlabel design cannot influence them [4,5].
•
Clinical development program of biosimilars is strictly regulated.
•
Safety (immunogenicity) and efficacy study is the last stage of a biosimilar clinical development program.
•
The primary objective of the current study was to compare immunogenicity of GP-Asp (biosimilar) and NN-Asp (original biological drug).
•
A pivotal efficacy study for biosimilar insulins is the euglycemic clamp study, whereas the current study confirms efficacy.
•
GP-Asp was similar to NN-Asp in terms of immunogenicity, safety and efficacy based on the established end point.
•
The biosimilarity of GP-Asp to NN-Asp was proven.
Acknowledgments
The authors thank DA Alpenidze, EV Arefyeva, IN Barikina, IA Karpova, ND Krasnopeyeva, NV Kuritsina, TI Kulagina, VL Orlova, AF Verbovoy, TI Rodionova, MA Startseva, JG Samoilova, SV Vorobiev, ZV Paltsman and all investigator teams for taking part in this study. The authors also thank Unimed Laboratories and Exacte Labs for laboratory testing.
Financial & competing interests disclosure
This study was funded by GEROPHARM, Russia. MA Magruk, IV Grigoryeva, A Myshkovets, AA Mosikian and RV Drai are current employees of GEROPHARM, Russia. TL Karonova, AY Mayorov, OK Khmelnitski, TM Parfenova and ST Zyangirova were principal investigators.
No writing assistance was utilized in the production of this manuscript.
Ethical conduct of research
The trial was conducted in accordance with the Guidelines on Good Clinical Practice and Ethical Principles for Medical Research Involving Human Subjects laid down in the Declaration of Helsinki. All study participants provided the written informed consent before participation in the study. The trial was approved by the Ministry of Health of the Russian Federation (Clinical trial approval no. 217 dated 26 April 2019) and by the Ethics Council (abstract No. 188 dated 12 March 2019).
Data sharing statement
The authors certify that this manuscript reports original clinical trial data (ClinicalTrials.gov identifier: NCT04079413). The data will not be made publicly available.
References
1.
Dedov II, Shestakova MV, Mayorov AY et al. Standards of specialized diabetes care (9th ed.). Diabetes Mellitus 22(S1), 1–144 (2019).
2.
EMA. Biosimilar medicines: overview (2020). www.ema.europa.eu/en/human-regulatory/overview/biosimilar-medicines-overview
3.
Mulcahy AW, Hlavka JP, Case SR. Biosimilar cost savings in the United States: initial experience and future potential. Rand Health Q. 7(4), 3 (2018).
4.
The Eurasian Economic Union. Resolution No. 89 of November 3, 2016 On Approval of the Rules for Conduct of Studies of Biological medicines in the Eurasian Economic Union, Chapter 15.7 Preclinical and clinical development of bioanalogue (biosimilar) medicinal products containing recombinant insulin and insulin analogues.
5.
EMA. European Medical Agency. Guideline on nonclinical and clinical development of similar biological medicinal products containing recombinant human insulin and insulin analogues (2015). (EMEA/CHMP/BMWP/32775/2005_Rev. 1). www.ema.europa.eu/en/documents/scientific-guideline/guideline-non-clinical-clinical-development-similar-biological-medicinal-products-containing_en-0.pdf
6.
Dorotenko A, Makarenko I, Mosikyan A, Magruk M, Drai R. Clinical pharmacology of insulin aspart: hyperinsulinemic euglycemic clamp study of the biosimilar product. Endocrine Abstracts 70, AEP 366 (2020).
7.
Abramenko NB, Vnukova PI, Golovina ES et al. Development and validation of the approach for the detection of neutralizing antibodies against insulin (glargine) in human blood plasma. Drug Devel. Reg. 8(3), 70–78 (2019).
8.
Hollander PA, Carofano WL, Lam RLH et al. Efficacy and safety of MK-1293 insulin glargine compared to originator insulin glargine (Lantus) in Type 2 diabetes: a randomized, open-label clinical trial. Diabetes Obes. Metab. 20(9), 2229–2237 (2018).
9.
World Medical Association. World Medical Association Declaration of Helsinki: ethical principles for medical research involving human subjects. JAMA 310, 2191–2194 (2013).
10.
Garg SK, Wernicke-Panten K, Wardecki M et al. Efficacy and safety of insulin aspart biosimilar SAR341402 versus originator insulin aspart in people with diabetes treated for 26 weeks with multiple daily injections in combination with insulin glargine: a randomized open-label trial (GEMELLI 1). Diabetes Technol. Ther. 22(2), 85–95 (2020).
11.
Derwahl KM, Bailey TS, Wernicke-Panten K et al. Efficacy and safety of biosimilar SAR342434 insulin lispro in adults with Type 2 diabetes, also using insulin glargine: SORELLA 2 study. Diabetes Technol. Ther. 20(1), 49–58 (2018).
Information & Authors
Information
Published In
Pages: 763 - 775
PubMed: 33928797
Copyright
© 2021 Future Medicine Ltd.
History
Received: 21 September 2020
Accepted: 26 March 2021
Published online: 30 April 2021
Keywords:
Topics
Authors
Funding Information
GEROPHARM, Russia
Metrics & Citations
Metrics
Article Usage
Article usage data only available from February 2023. Historical article usage data, showing the number of article downloads, is available upon request.
Citations
How to Cite
Safety and efficacy of GP40071 compared with originator insulin aspart (NovoRapid® Penfill®) in Type 1 diabetes mellitus. (2021) Journal of Comparative Effectiveness Research. DOI: 10.2217/cer-2020-0208
Export citation
Select the citation format you wish to export for this article or chapter.
Citing Literature
- Xiaoxuan Xing, Lingyi Zhao, Ke Wang, Zhizhou Wang, Lan Zhang, Xianzhe Dong, Therapeutic equivalence and switching between biosimilar and reference insulins: A systematic review and meta‐analysis of randomised controlled trials, Diabetes, Obesity and Metabolism, 10.1111/dom.70328, 28, 2, (1371-1382), (2025).
- Amar D.E. van Laar, Laura Gallardo-Nuell, Sofia Pazmino Lucio, Margaretha M. Visser, Ann Mertens, Roman Vangoitsenhoven, Pieter Gillard, Ebaa Al Ozairi, Carel W. Le Roux, Jonathan Rosen, Carmen Hurtado del Pozo, Yenny Leal, José Manuel Fernández-Real, Chantal Mathieu, Nele Steenackers, Bart Van der Schueren, Trends in baseline HbA1c and body-mass index in randomised trials of people with type 1 diabetes from 1993 to 2025: an IMI2 SOPHIA systematic review and meta-analysis, eClinicalMedicine, 10.1016/j.eclinm.2025.103589, 89, (103589), (2025).
- Ravisankar Santhanam, Sanjeev Kumar Sharma, Nilesh Lomte, Layeeq Baig, Sushil Kale, Shailesh Chauthankar, Santosh Tawari, Sushant Chincholkar, Ameet Jaiswal, Assessing biosimilarity of insulin aspart injection and NovoRapid® through pharmacokinetic and pharmacodynamic comparisons in healthy volunteers: A double-blind, randomized, crossover study, European Journal of Pharmacology, 10.1016/j.ejphar.2025.177881, 1003, (177881), (2025).
- Ekaterina Koksharova, Roman Drai, Sergei Noskov, Artem Dorotenko, Ekaterina Protsenko, Kseniia Radaeva, Anna Arefeva, Maria Gefen, Gagik Galstyan, Igor Makarenko, Clinical Pharmacology of GP40321 (Insulin Glulisine Biosimilar): Pharmacokinetic and Pharmacodynamic Comparability in a Hyperinsulinemic‐Euglycemic Clamp Procedure, Clinical Pharmacology in Drug Development, 10.1002/cpdd.1401, 13, 7, (828-836), (2024).
- Roman V Drai, Alexander Y Mayorov, Tatiana L Karonova, Tatiana M Parfenova, Igor E Makarenko, Maxim A Magruk, Diana N Alpenidze, Vladislav V Kovalik, Bella R Zinnatulina, Irina V Grigorjeva, Alena T Andreeva, The efficacy and safety of GP40081 (insulin aspart biphasic 30) compared with NovoMix® 30 in Type 2 diabetes patients, Journal of Comparative Effectiveness Research, 10.2217/cer-2021-0232, 11, 18, (1337-1347), (2022).
- Т. L. Karonova, A. Y. Mayorov, Study of equivalence and comparable immunogenicity of biosimilar insulin aspart in comparison with the registered analogue, Meditsinskiy sovet = Medical Council, 10.21518/2079-701X-2022-16-10-75-82, 10, (75-82), (2022).
- Thomas Danne, Lutz Heinemann, Jan Bolinder, New Insulins, Biosimilars, and Insulin Therapy, Diabetes Technology & Therapeutics, 10.1089/dia.2022.2503, 24, S1, (S-35-S-57), (2022).
- Li-Jou Yang, Ta-Wei Wu, Chao-Hsiun Tang, Tzu-Rong Peng, Efficacy and immunogenicity of insulin biosimilar compared to their reference products: a systematic review and meta-analysis, BMC Endocrine Disorders, 10.1186/s12902-022-00944-5, 22, 1, (2022).