Predicting optimal treatment regimens for patients with HR+/HER2- breast cancer using machine learning based on electronic health records
Publication: Journal of Comparative Effectiveness Research
Abstract
Aim: To predict optimal treatments maximizing overall survival (OS) and time to treatment discontinuation (TTD) for patients with metastatic breast cancer (MBC) using machine learning methods on electronic health records. Patients/methods: Adult females with HR+/HER2- MBC on first- or second-line systemic therapy were eligible. Random survival forest (RSF) models were used to predict optimal regimen classes for individual patients and each line of therapy based on baseline characteristics. Results: RSF models suggested greater use of CDK4 & 6 inhibitor-based therapies may maximize OS and TTD. RSF-predicted optimal treatments demonstrated longer OS and TTD compared with nonoptimal treatments across line of therapy (hazard ratios = 0.44∼0.79). Conclusion: RSF may help inform optimal treatment choices and improve outcomes for patients with HR+/HER2- MBC.
Breast cancer is the most frequently diagnosed cancer in women worldwide [1]. In 2020 in the US, 276,480 new breast cancer cases are estimated to be diagnosed and a staggering 42,170 deaths are estimated to occur [2]. Breast cancer is one of the main contributors to cancer deaths. Early diagnosis and treatment are critical to halting cancer growth. However, 30% of women diagnosed with early breast cancer go on to develop metastatic breast cancer (MBC) and 6% of cancer cases are metastatic upon diagnosis [2,3].
MBC is a heterogenous disease, categorized into several subtypes, depending on HR status and HER2 protein expression. HR-positive (HR+)/HER2-negative (HER2-) breast cancer is the most common cancer subtype, and accounts for approximately 70% of cases [4]. HR+ breast cancer is estrogen receptor (ER)-positive and/or progesterone receptor (PR)-positive [5]. Disease subtype is a major determinant in selecting a treatment regimen, however therapeutic options in the MBC setting are complex and diverse. At present MBC is incurable, with treatment directed toward prolonging life and palliating symptoms [4]. Systemic treatment options include endocrine-based therapy, targeted therapy and chemotherapy.
The primary systemic therapy for HR+/HER2- MBC is endocrine therapy alone or endocrine therapy in combination with targeted agents [6]. By reducing estrogen levels or by downregulating ER signaling, endocrine agents can control disease progression and induce a tumor response [7]. Endocrine therapies include aromatase inhibitors, selective ER modulators and biologic response modifiers [8]. Within the treatment algorithm of MBC, subsequent lines of therapy often consist of sequential endocrine-based therapy regimens. However, endocrine therapy resistance, de novo or acquired, is a major problem as patients fail to respond to treatment [9].
The addition of CDK 4 & 6 inhibitors to endocrine therapy has demonstrated considerable benefit to patients with HR+/HER2- MBC. Three CDK4 & 6 inhibitors have been approved for the treatment of advanced HR+/HER2- breast cancer by the US FDA in the past 5 years: abemaciclib (Verzenio, Eli Lilly, IN, USA), palbociclib (Ibrance, Pfizer, NY, USA) and ribociclib (Kisqali, Novartis, NJ, USA) [4]. A CDK4 & 6 inhibitor in combination with endocrine therapy significantly improved progression-free survival in patients with HR+/HER2- advanced breast cancer compared with endocrine therapy alone [10–15]. Furthermore, the addition of abemaciclib or ribociclib to endocrine therapies resulted in significantly longer overall survival (OS) compared with endocrine therapy alone [16–18]. CDK4 & 6–Cyclin D complexes serve as mediators of cell cycle progression. CDK4 & 6 inhibitors disrupt cell cycle progression and inhibit cell proliferation [19].
Thus, according to current guidelines, preferred regimens for patients with HR+/HER2- MBC on first-line therapy include either an aromatase inhibitor plus a CDK4 & 6 inhibitor, a selective ER down-regulator (fulvestrant) with or without a nonsteroidal aromatase inhibitor, fulvestrant with or without a CDK4 & 6 inhibitor, a selective ER modulator or monotherapy with a steroidal or nonsteroidal aromatase inhibitor [6]. Upon disease progression, patients switch to second or subsequent lines of therapy. The preferred regimen for second-line therapy includes fulvestrant plus CDK4 & 6 inhibitors, monotherapy with fulvestrant, aromatase inhibitor or a selective ER modulator [6].
Treatment options for patients with HR+/HER2- MBC also include chemotherapeutic agents, which can be incorporated at diagnosis or after initial lines of treatment. Chemotherapy is recommended if a patient is experiencing symptomatic visceral metastasis or when HR+ tumors are refractory to endocrine therapy [6].
In current practice, physicians select a treatment strategy with the aim of achieving the best possible outcome for a patient. The chosen treatment is dependent on patient and clinical characteristics (such as age, prior therapies, Eastern Cooperative Oncology Group [ECOG] performance status [PS], HR status and HER2 protein expression), treatment guidelines (e.g., NCCN guidelines), previous physician experience and patient preference [6]. Whether a patient has visceral crisis or bone metastases impacts on therapy choice [6]. Additional factors may also inform treatment choice: menopausal status, tumor grade, number of metastatic sites and liver metastasis [6,20,21]. Identifying the optimal treatment for an individual patient, from the complex array of options, can be incredibly challenging.
To investigate patient specific optimal treatment strategies, real-world data (RWD) sources and machine learning algorithms can be leveraged. RWD sources are growing in availability and volume, and hold information on heterogenous populations in real-world settings [22]. Machine learning can be used to uncover associations and patterns in these rich datasets, permitting increased knowledge about the effectiveness of different treatments [23,24].
Individual patient responses to a given treatment can differ considerably. While one treatment regimen works well for one patient, it may not be successful for another. To identify the most effective treatment regimen and to improve patient outcomes, a tailored approach is necessary. Numerous methodologies in personalized medicine have emerged in the past decade, including subgroup identification [25–27], recursive partitioning algorithms [28–31] and value function optimization [32–34]. Individualized Treatment Recommendation, a value function optimization approach, adjusts for treatment selection bias by incorporating inverse probability weighting (IPW).
In this study, we applied a recursive partitioning algorithm, random survival forests (RSF), to a large oncology patient dataset from electronic health records (EHR). The main analyses utilized EHR data. An additional EHR dataset and simulated data were utilized to perform replication analyses and sensitivity analyses, respectively. The RSF method was chosen due to its suitability to analyze time-to-event outcomes such as OS and time to treatment discontinuation (TTD). By using treatment options available in the EHR, this machine learning based model generates data-driven predictions of optimal treatments for a given patient. The aim of this work is to gain understanding about how machine learning may be used to inform clinical decision-making. This approach could have the potential to assist physician decision-making and improve outcomes in patients with MBC.
Materials & methods
Study design & data sources
This retrospective observational cohort study used the Flatiron Health database (FHD), a nationwide longitudinal, demographically and geographically diverse de-identified database derived from EHR data [35]. At the time of dataset delivery, the broader FHD included de-identified data from 280 cancer clinics (∼800 sites of care) consisting of more than 2.4 million US patients with cancer. Approximately 90% of patients came from community practice and approximately 10% from academic centers. Both structured (e.g., demographics, laboratory values and medications) and unstructured data (e.g., from physician’s notes) were included in the dataset.
This study included females who were diagnosed with HR+/HER2- MBC between 1 January 2013 and 31 January 2019. Eligible patients were ≥18 years of age and must have initiated first- or second-line systemic therapy for MBC between 15 February 2015 and 31 January 2019. Patients diagnosed with MBC who initiated first-line therapy more than 90 days after diagnosis date were excluded due to the possibility that they received prior treatment for MBC outside of the Flatiron Health network.
Study variables & outcomes
Variables obtained or derived from the database included: age (year), bodyweight (kg), date of metastatic diagnosis, ER status (negative, positive), PR status (negative, positive, unknown/missing), BReast CAncer gene (BRCA) status (negative, positive, unknown/missing), practice region of the US (northeast, midwest, south, west, unknown/missing), practice type (academic, community, unknown/missing), race (white, black, Hispanic, Asian, other, unknown/missing), group stage (i.e., cancer stage) at initial diagnosis (Stage 0, Stage I, Stage II, Stage III, Stage IV, unknown/missing), ECOG PS (0, 1, 2, 3, 4, unknown/missing), first-line regimen class (for patients on second-line therapy only) and TTD of first-line therapy (defined below). Regimen and line of therapy were determined according to oncologist-defined, rule-based lines of therapy using structured data for drug orders and administrations, as defined in the FHD. Categorical variables with missing or unknown datapoints were reported as a separate category and included in the descriptive summary. Continuous variables with unknown/missing datapoints were also reported in the descriptive summary. All missing values were imputed using the default imputation algorithm for RSF (R package randomForestSRC) described in [37].
Baseline patient characteristics (such as bodyweight, ECOG PS) were collected in the time window of 45 days prior to the start of first- and second-line therapy. When multiple observations were identified, the observation closest to the start of the line of therapy was chosen. For BRCA, ER and PR status results, a positive result overwrites a negative result; a negative result overwrites missing/unknown.
Outcomes included OS and TTD. The survival analyses used a mortality variable in the Flatiron EHR, which is amalgamated from multiple data sources to supplement EHR data and has demonstrated high sensitivity and date agreement with the National Death Index [36]. OS was measured as the time to death from start of first- or second-line therapy, and patients without a date of death were censored at last structured activity date. TTD was defined as days from first to last medication administration or order of a line of therapy. Patients with last administration of a line of therapy within 42 days from the database cutoff date and without a subsequent line of therapy or a death date were censored at the last administration date for TTD.
Regimen classes
Individual regimens were grouped into hierarchy regimen classes (Table 3 [35]). CDK4 & 6 inhibitor-based therapy, chemotherapy and endocrine only based therapy were included in the analyses due to having the largest sample sizes (Table 1). The regimen classes were mutually exclusive. Patients whose therapy did not meet the criteria in Table 1 were not included in the analyses.
| Regimen class hierarchy | Criteria |
|---|---|
| CDK4 & 6 inhibitor-based therapy | Therapies containing Ibrance (palbociclib), Verzenio (abemaciclib) or Kisqali (ribociclib), with or without endocrine therapy |
| Chemotherapy | Therapies containing chemotherapy drugs only, with or without endocrine therapy |
| Endocrine therapy | Therapies containing only endocrine drugs |
CDK4 & 6 supplemental dataset
A supplemental dataset from FHD, the Flatiron spotlight project dataset (SPD), was used in the replication analyses to explore potential confounders. The SPD consisted of patients from the FHD. It contained additional variables, which were extracted from patient charts, on patients with HR+/HER2- MBC who received CDK4 & 6 inhibitor-based therapy. In addition to the covariates found in the FHD, the SPD included: Charlson comorbidity index (CCI), comorbidities, sites of metastases (bone, brain, distant lymph node, liver, lung, other central nervous system, other) and tumor grade. Systemic therapy in the metastatic setting with CDK4 & 6 inhibitor-based therapies were initiated on or after 30 June 2016 and with no prior CDK4 & 6 inhibitor-based therapies. Follow-up data were available until 31 January 2019. Patients who received a CDK4 & 6 inhibitor in either first- or second-line therapy were eligible for the SPD, as well as any patient who received abemaciclib regardless of line of therapy. If a patient did not receive a CDK4 & 6 inhibitor in first-line treatment, the patient must have survived long enough to receive the second-line CDK4 & 6 inhibitor. This created an immortal bias in the subset of patients who did not receive CDK4 & 6 inhibitors in first-line therapy. Therefore, the replication analyses only considered patients with second-line therapy.
Statistical methods
Identification of optimal treatment regimens was done using a generic RSF algorithm [37] (implemented in the R package randomForestSRC) under Neyman-Rubin potential outcome framework [38,39]. RSF was chosen as it is routinely used in predicting potential survival curves. Optimal treatment regimens are defined as those that maximize OS and TTD. For a patient i (i = 1, 2, …, n) with covariate profile , conditional survival distributions were computed, one for each potential treatment (i.e., the 3 regimen classes in this study), including the one that was actually taken and two counterfactual treatments, . An overall measure of the value of treatment was computed as the area under the survival distribution up to the time , where and was maximal observed time to event for the kth treatment cohort. The optimal treatment for the ith patient was estimated as the one that maximized the .
To estimate the value of the counterfactual treatment regimen and the uncertainty associated with estimation, the following resampling procedure was performed.
1.
The data were randomly split into training (80%) and test (20%) datasets. Covariates with missing values were imputed using the default imputation algorithm for RSF (R package randomForestSRC) described in [37] and allowing simultaneously imputing data while growing the forest. The optimal treatment was estimated for each patient from the test set using the RSF fitted to the training data.
2.
Patients in the test set were divided into two subsets: those whose actual treatment was the same as estimated optimal treatment (“ON optimal”) and the rest (“OFF optimal”).
3.
Estimated the probability of being in “ON optimal” class using random forest for binary outcome [40] and then constructed propensity based weights for each patient: for “ON optimal” and for “OFF optimal”.
4.
Estimated restricted mean survival time (RMST) up to time and years assuming all patients would have followed their optimal treatment, and assuming they would have stayed off optimal treatment, using IPW estimators applied to “ON optimal” and “OFF optimal” subsets, respectively. IPW was based on all available baseline covariates (Tables 2 & 3). The product-limit Kaplan–Meier estimator up to time is combined with parametric fit from to . The time was determined as the time when only 10% of patients remained at risk. The parametric model for the “tail” was determined as the one giving the best fit (minimum Akaike Information Criterion) among the 6 candidate models: exponential, Weibull, Gompertz, log-logistic, lognormal and generalized gamma. T = 3 years for TTD and T = 5 years for OS were selected based on the observed outcome data distributions so that the RMST covered all the observed outcome data points and minimally used parametric extrapolations.
5.
Computed the difference in restricted mean survival times, .
6.
Computed the estimated hazard ratio for the estimators assuming everyone is ON optimal treatment versus OFF optimal treatment using the IPW Cox proportional hazards regression model, .
7.
A comparison between “ON optimal” treatment group versus all patients in the real-world practice was also conducted.
8.
Steps 1–7 were repeated 1000-times resulting in predictive distributions for and and constructed 95% intervals using 2.5 and 97.5 percentiles of the distributions. These are reported along with means of respective distributions.
| Variable | CDK4 & 6 inhibitor-based therapy (N = 1674) | Chemotherapy (N = 791) | Endocrine therapy (N = 1500) | p-value† | Total (N = 3965) |
|---|---|---|---|---|---|
| Age (year), mean (Std) | 64.76 (11.52) | 60.26 (12.4) | 68.09 (12.57) | <0.001 | 65.12 (12.43) |
| Bodyweight (kg), mean (Std) | 76.65 (18.88) | 76.48 (19.68) | 75.39 (20.74) | 0.307 | 76.18 (19.73) |
| – Missing/unknown, n | 511 | 78 | 531 | 1120 | |
| Time from metastatic diagnosis (year), mean (Std) | 0.05 (0.05) | 0.07 (0.06) | 0.06 (0.06) | <0.001 | 0.06 (0.06) |
| ER status, n (%) | |||||
| – Negative | 16 (0.96) | 43 (5.44) | 15 (1) | <0.001 | 74 (1.87) |
| – Positive | 1658 (99.04) | 748 (94.56) | 1485 (99) | 3891 (98.13) | |
| PR status, n (%) | |||||
| – Negative | 468 (27.96) | 299 (37.8) | 406 (27.07) | <0.001 | 1173 (29.58) |
| – Positive | 1199 (71.62) | 488 (61.69) | 1077 (71.8) | 2764 (69.71) | |
| – Missing/unknown | 7 (0.42) | 4 (0.51) | 17 (1.13) | 28 (0.71) | |
| BRCA status, n (%) | |||||
| – Negative | 439 (26.22) | 203 (25.66) | 242 (16.13) | 0.22 | 884 (22.3) |
| – Positive | 58 (3.46) | 39 (4.93) | 40 (2.67) | 137 (3.46) | |
| – Missing/unknown | 1177 (70.31) | 549 (69.41) | 1218 (81.2) | 2944 (74.25) | |
| Practice region, n (%) | |||||
| – Midwest | 311 (18.58) | 107 (13.53) | 242 (16.13) | <0.001 | 660 (16.65) |
| – Northeast | 351 (20.97) | 115 (14.54) | 324 (21.6) | 790 (19.92) | |
| – South | 570 (34.05) | 385 (48.67) | 557 (37.13) | 1512 (38.13) | |
| – West | 308 (18.4) | 161 (20.35) | 271 (18.07) | 740 (18.66) | |
| – Missing/unknown | 134 (8) | 23 (2.91) | 106 (7.07) | 263 (6.63) | |
| Practice type, n (%) | |||||
| – Academic | 130 (7.77) | 22 (2.78) | 99 (6.6) | <0.001 | 251 (6.33) |
| – Community | 1544 (92.23) | 769 (97.22) | 1401 (93.4) | 3714 (93.67) | |
| Race, n (%) | |||||
| – Asian | 37 (2.21) | 18 (2.28) | 34 (2.27) | 0.062 | 89 (2.24) |
| – Black or African American | 114 (6.81) | 77 (9.73) | 112 (7.47) | 303 (7.64) | |
| – Hispanic or Latino | 3 (0.18) | 2 (0.25) | 5 (0.33) | 10 (0.25) | |
| – White | 1187 (70.91) | 517 (65.36) | 1059 (70.6) | 2763 (69.68) | |
| – Other race | 168 (10.04) | 104 (13.15) | 155 (10.33) | 427 (10.77) | |
| – Missing/unknown | 165 (9.86) | 73 (9.23) | 135 (9) | 373 (9.41) | |
| Group stage at initial diagnosis, n (%) | |||||
| – 0 | 1 (0.06) | 0 (0) | 0 (0) | <0.001 | 1 (0.03) |
| – I | 196 (11.71) | 79 (9.99) | 186 (12.4) | 461 (11.63) | |
| – II | 513 (30.65) | 180 (22.76) | 413 (27.53) | 1106 (27.89) | |
| – III | 328 (19.59) | 147 (18.58) | 310 (20.67) | 785 (19.8) | |
| – IV | 501 (29.93) | 333 (42.1) | 428 (28.53) | 1262 (31.83) | |
| – Missing/unknown | 135 (8.06) | 52 (6.57) | 163 (10.87) | 350 (8.83) | |
| ECOG PS, n (%) | |||||
| – 0 | 367 (21.92) | 219 (27.69) | 221 (14.73) | <0.001 | 807 (20.35) |
| – 1 | 221 (13.2) | 143 (18.08) | 204 (13.6) | 568 (14.33) | |
| – 2 | 76 (4.54) | 56 (7.08) | 66 (4.4) | 198 (4.99) | |
| – 3 | 19 (1.14) | 9 (1.14) | 26 (1.73) | 54 (1.36) | |
| – 4 | 1 (0.06) | 0 (0) | 0 (0) | 1 (0.03) | |
| – Missing/unknown | 990 (59.14) | 364 (46.02) | 983 (65.53) | 2337 (58.94) | |
†
p-values comparing the three regimen classes were calculated using two-sided F-test for continuous variables, two-sided Kruskal–Wallis test for ordinal variables and two-sided chi-squared/Fisher’s exact test for nominal variables. Chi-squared test was used if no cell had an expected count less than 1, and more than 80% of the cells had expected counts of at least 5, otherwise Fisher’s exact test was used.
ECOG: Eastern Cooperative Oncology Group; ER: Estrogen receptor; FHD: Flatiron Health database; HR: Hormone receptor; MBC: Metastatic breast cancer; PR: Progesterone receptor; PS: Performance status; Std: Standard deviation; TTD: Time to treatment discontinuation.
The procedure outlined above was applied to FHD data with covariates listed in Tables 2 and 3. Variable importance scores were computed for each covariate as percent of patients in the full dataset whose optimal treatment allocation changed after a given X was permuted in the originally fitted random forest. Specifically, covariate values were permuted, and the optimal treatment estimated without refitting the RSF. This was done for 100 permutations in each split and the average were reported in graphical form. Additionally, we reported partial dependency plots, summarizing relationships between each important covariate and the optimal patient allocation per regimen class.
| Variable | CDK4 & 6 inhibitor-based therapy (N = 993) | Chemotherapy (N = 678) | Endocrine therapy (N = 784) | p-value† | Total (N = 2455) |
|---|---|---|---|---|---|
| Age (year), mean (Std) | 64.67 (12.11) | 61.25 (12.3) | 66.15 (13.21) | <0.001 | 64.2 (12.67) |
| Bodyweight (kg), mean (Std) | 75.25 (19.03) | 74.96 (19.07) | 74.24 (19.59) | 0.598 | 74.86 (19.21) |
| Missing/unknown, n | 138 | 53 | 146 | 337 | |
| Time from metastatic diagnosis, (year), mean (Std) | 0.84 (0.85) | 0.61 (0.59) | 0.97 (0.86) | <0.001 | 0.82 (0.8) |
| ER status, n (%) | |||||
| – Negative | 6 (0.6) | 26 (3.83) | 7 (0.89) | <0.001 | 39 (1.59) |
| – Positive | 987 (99.4) | 652 (96.17) | 777 (99.11) | 2416 (98.41) | |
| PR status, n (%) | |||||
| – Negative | 304 (30.61) | 290 (42.77) | 228 (29.08) | <0.001 | 822 (33.48) |
| – Positive | 679 (68.38) | 384 (56.64) | 548 (69.9) | 1611 (65.62) | |
| – Missing/unknown | 10 (1.01) | 4 (0.59) | 8 (1.02) | 22 (0.9) | |
| BRCA status, n (%) | |||||
| – Negative | 269 (27.09) | 208 (30.68) | 154 (19.64) | 0.419 | 631 (25.7) |
| – Positive | 42 (4.23) | 40 (5.9) | 33 (4.21) | 115 (4.68) | |
| – Missing/unknown | 682 (68.68) | 430 (63.42) | 597 (76.15) | 1709 (69.61) | |
| Practice region, n (%) | |||||
| – Midwest | 184 (18.53) | 104 (15.34) | 118 (15.05) | 0.068 | 406 (16.54) |
| – Northeast | 211 (21.25) | 121 (17.85) | 151 (19.26) | 483 (19.67) | |
| – South | 356 (35.85) | 282 (41.59) | 329 (41.96) | 967 (39.39) | |
| – West | 175 (17.62) | 119 (17.55) | 131 (16.71) | 425 (17.31) | |
| – Missing/unknown | 67 (6.75) | 52 (7.67) | 55 (7.02) | 174 (7.09) | |
| Practice type, n (%) | |||||
| – Academic | 64 (6.45) | 50 (7.37) | 54 (6.89) | 0.772 | 168 (6.84) |
| – Community | 929 (93.55) | 628 (92.63) | 730 (93.11) | 2287 (93.16) | |
| Race, n (%) | |||||
| – Asian | 30 (3.02) | 14 (2.06) | 18 (2.3) | 0.34 | 62 (2.53) |
| – Black or African American | 63 (6.34) | 64 (9.44) | 64 (8.16) | 191 (7.78) | |
| – Hispanic or Latino | 4 (0.4) | 3 (0.44) | 1 (0.13) | 8 (0.33) | |
| – White | 718 (72.31) | 471 (69.47) | 578 (73.72) | 1767 (71.98) | |
| – Other race | 101 (10.17) | 72 (10.62) | 80 (10.2) | 253 (10.31) | |
| – Missing/unknown | 77 (7.75) | 54 (7.96) | 43 (5.48) | 174 (7.09) | |
| Group stage at initial diagnosis, n (%) | |||||
| – 0 | 0 (0) | 0 (0) | 1 (0.13) | 0.169 | 1 (0.04) |
| – I | 121 (12.19) | 72 (10.62) | 85 (10.84) | 278 (11.32) | |
| – II | 276 (27.79) | 202 (29.79) | 198 (25.26) | 676 (27.54) | |
| – III | 213 (21.45) | 155 (22.86) | 146 (18.62) | 514 (20.94) | |
| – IV | 306 (30.82) | 200 (29.5) | 268 (34.18) | 774 (31.53) | |
| – Missing/unknown | 77 (7.75) | 49 (7.23) | 86 (10.97) | 212 (8.64) | |
| ECOG PS, n (%) | |||||
| – 0 | 232 (23.36) | 157 (23.16) | 128 (16.33) | 0.075 | 517 (21.06) |
| – 1 | 244 (24.57) | 168 (24.78) | 178 (22.7) | 590 (24.03) | |
| – 2 | 76 (7.65) | 50 (7.37) | 61 (7.78) | 187 (7.62) | |
| – 3 | 16 (1.61) | 20 (2.95) | 15 (1.91) | 51 (2.08) | |
| – 4 | 2 (0.2) | 2 (0.29) | 0 (0) | 4 (0.16) | |
| – Missing/unknown | 423 (42.6) | 281 (41.45) | 402 (51.28) | 1106 (45.05) | |
| First-line regimen class, n (%) | |||||
| – CDK4 & 6 inhibitor-based therapy | 193 (19.44) | 189 (27.88) | 164 (20.92) | <0.001 | 546 (22.24) |
| – Endocrine therapy | 577 (58.11) | 166 (24.48) | 429 (54.72) | 1172 (47.74) | |
| – Chemotherapy | 151 (15.21) | 293 (43.22) | 158 (20.15) | 602 (24.52) | |
| – Chemo + HER2 targeted-based therapy | 3 (0.3) | 3 (0.44) | 7 (0.89) | 13 (0.53) | |
| – HER2 targeted-based therapy | 4 (0.4) | 2 (0.29) | 1 (0.13) | 7 (0.29) | |
| – mTOR inhibitor-based therapy | 17 (1.71) | 10 (1.47) | 9 (1.15) | 36 (1.47) | |
| – Clinical study therapies | 27 (2.72) | 7 (1.03) | 10 (1.28) | 44 (1.79) | |
| – Other therapies | 19 (1.91) | 8 (1.18) | 5 (0.64) | 32 (1.3) | |
| – Missing/unknown | 2 (0.2) | 0 (0) | 1 (0.13) | 3 (0.12) | |
| TTD of first-line therapy, (year), mean (Std) | 0.66 (0.79) | 0.43 (0.52) | 0.65 (0.76) | <0.001 | 0.59 (0.72) |
| – Missing/unknown, n | 55 | 37 | 34 | 126 | |
†
p-values comparing the three regimen classes were calculated using two-sided F-test for continuous variables, two-sided Kruskal–Wallis test for ordinal variables and two-sided chi-squared/Fisher’s exact test for nominal variables. Chi-squared test was used if no cell had an expected count less than 1, and more than 80% of the cells had expected counts of at least 5, otherwise Fisher’s exact test was used. Flatiron definitions for regimen class hierarchy can be found at Flatiron Health [30].
ECOG: Eastern Cooperative Oncology Group; FHD: Flatiron Health database; MBC: Metastatic breast cancer; mTOR: Mammalian target of rapamycin; PS: Performance status; Std: Standard deviation; TTD: Time to treatment discontinuation.
The individualized optimal treatments were estimated in first- and second-line therapy separately. Of note, predicting optimal treatment sequence was not an objective of this study.
Supplemental analyses were conducted to evaluate the stability of the findings from the FHD. These analyses used the SPD both as replication of the original analyses in a different dataset and as sensitivity analyses to assess the potential impact of unmeasured confounders on the findings from the primary FHD dataset. The SPD had a smaller number of patients but a broader set of covariates than FHD and included potential confounders that were not available in the FHD (i.e., unmeasured confounders). For the replication, the same RSF approach as described in steps 1–8 was applied to the SPD using two different models. First, a “full” model with all 39 SPD covariates was conducted to assess if the results differed from the main analyses. Second, a “reduced” model using only the 13 covariates available in FHD was conducted to have a direct replication of the main analyses in an additional dataset.
The sensitivity analyses were conducted to evaluate the role of liver metastasis. As the variable “Liver metastasis” was not present in the FHD, it was believed to have possibly been a potential unmeasured confounder in the main analyses. The SPD showed that presence/absence of liver metastasis was associated with survival [41,42]. Furthermore, liver metastasis status was unevenly distributed across regimen classes (with much lower prevalence among patients who received CDK4 & 6 inhibitor-based therapies; Supplementary Table 1). To evaluate its potential impact on the analysis of FHD data, a series of sensitivity analyses were performed using generated data that mimicked FHD and included a new confounder variable.
A synthetic version of FHD was created where survival outcomes were generated, mimicking the relationships, in terms of variable distribution and correlation, with all FHD covariates using a Weibull model (selected based on its simple parametric form and reasonably good fit to the data based on Akaike Information Criterion). The binary covariate in the SPD “Liver metastasis” was added to this data generation model. Liver metastasis status was simulated with strong association with the outcome and an uneven distribution over regimen classes and correlations with the rest of covariates, as observed in the SPD (Supplementary Table 1) [41,42]. By varying the hazard ratio associated with the “Liver metastasis” variable in the Weibull model and its distribution across treatment classes, the synthetic data were reanalyzed using the same RSF-based approach as for the FHD data. This allowed insight into whether the proportion of patients optimally allocated to CDK4 & 6 inhibitor-based therapies depended on the presence of such an unmeasured confounder. Furthermore, if that was the case, what hazard ratio associated with unmeasured confounder was necessary to have an impact, sufficient to overturn the primary findings.
Results
Patient baseline characteristics
Out of 18,961 patients with breast cancer in the FHD, 12194 were diagnosed with MBC at 18 years or older. Of this, 9964 received at least one line of anticancer systemic therapy. Further selecting female patients with HR+/HER2- MBC, who initiated first-line anticancer systemic therapy on or after 15 February 2015, and had complete data in OS, resulted in a cohort of 4295 patients, of which, 330 patients did not meet the required regimen classes as outlined in Table 1. In total, 3965 patients on first-line therapy were identified and included (Table 2). A total of 1674 patients received CDK4 & 6 inhibitor-based therapy, 791 received chemotherapy and 1500 received endocrine therapy. In the first-line therapy cohort, patients differed (p < 0.05) across the three regimen classes in age, time from metastatic diagnosis, ER status, PR status, practice region, practice type, group stage at initial diagnosis and ECOG PS (Table 2).
In the second-line therapy cohort, a total of 2455 patients were eligible (Table 3). A total of 993 patients received CDK4 & 6 inhibitor-based therapy, 678 received chemotherapy and 784 received endocrine therapy. Patients differed (p < 0.05) across the three regimen classes in age, time from metastatic diagnosis, ER status, PR status, first-line regimen class and TTD of first-line therapy (Table 3).
Optimal treatment recommendation
The proportion of observed treatments in patients on first- or second-line therapy are shown in Figure 1. To estimate optimal treatment, separate RSF models were built for each outcome (OS and TTD) and for each line of therapy, using 80% of the eligible Flatiron cohort. The remaining 20% was used to test the model. This test dataset consisted of 792 and 758 patients for first-line OS and first-line TTD treatment optimization, respectively, and 490 and 465 patients for second-line OS and second-line TTD treatment optimization, respectively. The RSF models suggested that greater use of CDK4 & 6 inhibitor-based therapies would maximize both OS or TTD in first- and second-line therapy (Figure 1). Based on the 20% test data, to maximize OS, the RSF models recommended CDK4 & 6 inhibitor-based therapy for 75% of patients on first-line therapy, an increase over the observed 42.1% of patients assigned to CDK4 & 6 inhibitor-based therapies in the database. To maximize OS in patients on second-line therapy, RSF models recommended use of CDK4 & 6 inhibitor-based therapy for 66.3% of patients, an increase over the observed 40.4%. Similarly, to maximize TTD, RSF recommended CDK4 & 6 inhibitor-based therapy for 97.7% of patients on first-line therapy, compared with the observed 44%. In the second-line setting, RSF recommended use of CDK4 & 6 inhibitors for 95.4% of patients, an increase from the observed 42.1% (Figure 1).
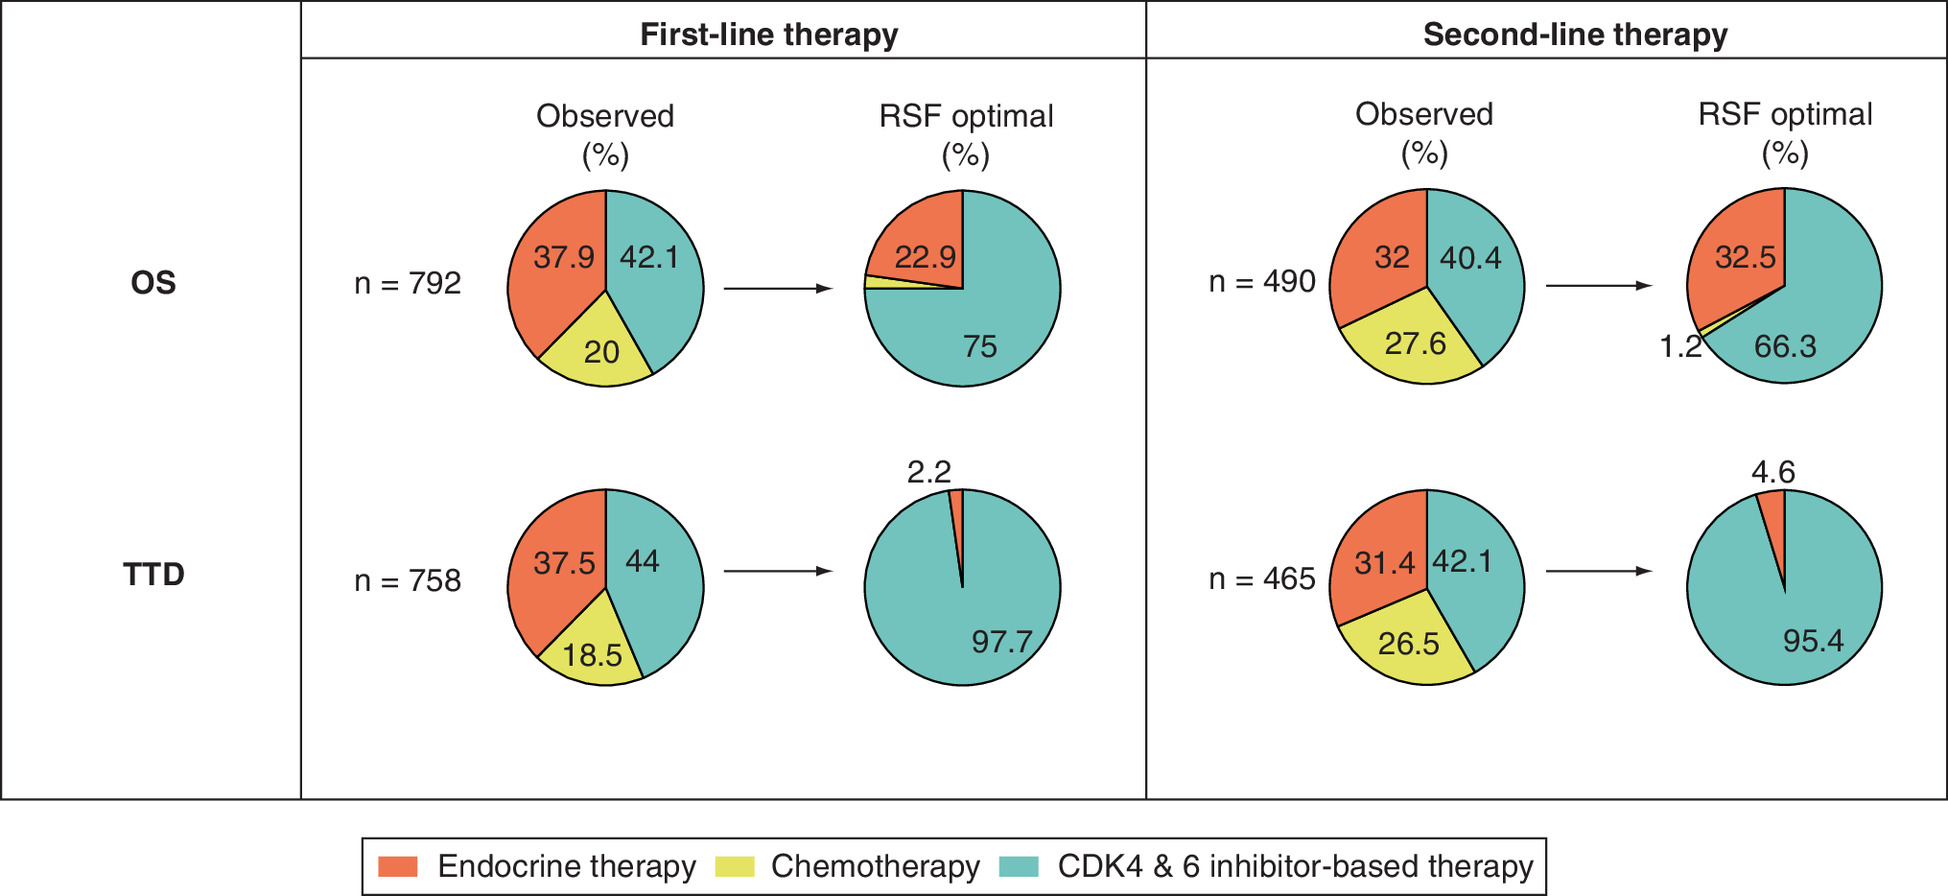
Figure 1. Summary of optimal treatment recommendations for patients with HR+/HER2- metastatic breast cancer in the Flatiron Health database dataset using RSF.
OS: Overall survival; RSF: Random survival forest; TTD: Time to treatment discontinuation.
Gains in OS
The RSF model predicted an optimal regimen class for each patient from the 20% test dataset. If the predicted optimal regimen class matched the observed regimen class, the patient was classified into the “ON optimal” group. However, if the predicted optimal regimen class did not match the observed regimen class, the patient was classified into the “OFF optimal” group. Based on the RSF prediction, less than 50% of patients in the study cohort received the optimal regimen class (Table 4). Outcome differences between the “OFF optimal” group and the “ON optimal” group were estimated using IPW estimators applied to both subsets, with the assumption that all patients would have either stayed off optimal treatment or followed optimal treatment, respectively.
| Line of therapy | Outcome | N | ON Optimal % | OFF Optimal RMST year (95% PI)† | ON Optimal RMST year (95% PI)† | Hazard ratio (95% PI) |
|---|---|---|---|---|---|---|
| 1L | OS | 792 | 36.88 | 2.81 (2.61, 2.99) | 3.13 (2.85, 3.4) | 0.79 (0.61, 1.01) |
| 1L | TTD | 758 | 38.16 | 0.59 (0.52, 0.67) | 1.32 (1.21, 1.42) | 0.44 (0.37, 0.51) |
| 2L | OS | 490 | 35.89 | 2.38 (2.16, 2.59) | 3.01 (2.65, 3.35) | 0.62 (0.45, 0.82) |
| 2L | TTD | 465 | 37.26 | 0.5 (0.42, 0.58) | 1.03 (0.91, 1.18) | 0.51 (0.41, 0.61) |
†
Restricted mean survival time was estimated with 5-year time horizon for overall survival and 3-year time horizon for time to treatment discontinuation.
1L: First-line; 2L: Second-line; FHD: Flatiron Health database; IPW: Inverse probability weighting; MBC: Metastatic breast cancer; OS: Overall survival; PI: Prediction interval based on 1000 random split replications; RMST: Restricted mean survival time; RSF: Random survival forest; TTD: Time to treatment discontinuation.
Gains in OS among patients in the “OFF optimal” group over the “ON optimal” group were estimated and compared. In first-line therapy, the “OFF optimal” group had an IPW-adjusted OS, in terms of RMST over a 5-year horizon, of 2.81 years, whereas the “ON optimal” group increased to 3.13 years with a 0.79 hazard ratio (95% prediction interval [PI]: 0.61–1.01; Table 4). In second-line therapy, IPW-adjusted OS was 2.38 years for the “OFF optimal” group and 3.01 years for the “ON optimal” group with a hazard ratio of 0.62 (95% PI: 0.45–0.82; Table 4).
Gains in TTD
Outcome gains in TTD among patients within the “OFF optimal” group versus the “ON optimal” group were also estimated and compared. In patients on first-line therapy, the “OFF optimal” group had an IPW-adjusted TTD, in terms of RMST over a 3-year horizon, of 0.59 years, whereas the “ON optimal” group showed an increase to 1.32 years with a hazard ratio of 0.44 (95% PI: 0.37–0.51; Table 4). Similar improvements in TTD were found in patients classified into the “OFF optimal” group compared with those classified into the “ON optimal” group on second-line therapy: IPW-adjusted TTD increased from 0.5 years for “OFF optimal” group to 1.03 years “ON optimal” group with a hazard ratio of 0.51 (95% PI: 0.41–0.61; Table 4).
Gains of optimal treatment over real-world practice
The gains in OS and TTD of the “ON optimal” group over the “OFF optimal” group were estimated from the two opposing scenarios. The “OFF optimal” group may never be observed in real-world clinical practice. The more conservative outcome gains in OS and TTD were estimated and compared between patients in the “ON optimal” group versus all patients in real-world practice (including those ON and those OFF optimal regimen classes). The gains of the “ON optimal” group over patients in real-world practice were less than the gains observed in the ON versus OFF optimal group comparisons (Table 5).
| Line of therapy | Outcome | N | ON Optimal % | Real-world practice RMST year (95% PI)† | ON Optimal RMST year (95% PI)† | Hazard ratio (95% PI) |
|---|---|---|---|---|---|---|
| 1L | OS | 792 | 43.37 | 2.97 (2.84, 3.06) | 3.13 (2.85, 3.4) | 0.89 (0.76, 1.04) |
| 1L | TTD | 758 | 44.95 | 0.93 (0.88, 0.97) | 1.32 (1.21, 1.42) | 0.65 (0.59, 0.72) |
| 2L | OS | 490 | 42.56 | 2.64 (2.51, 2.76) | 3.01 (2.65, 3.35) | 0.75 (0.59, 0.92) |
| 2L | TTD | 465 | 43.18 | 0.72 (0.66, 0.77) | 1.03 (0.91, 1.18) | 0.68 (0.61, 0.76) |
†
Restricted mean survival time was estimated with 5-year time horizon for overall survival and 3-year time horizon for time to treatment discontinuation.
1L: First-line; 2L: Second-line; FHD: Flatiron Health database; IPW: Inverse probability weighting; MBC: Metastatic breast cancer; OS: Overall survival; PI: Prediction interval based on 1000 random split replications; RMST: Restricted mean survival time; RSF: Random survival forest; TTD: Time to treatment discontinuation.
Variable importance scores
Various baseline characteristics were important in predicting optimal treatments in first- and second-line therapy which resulted in improved OS and TTD. Figure 2 provides the variable importance scores from the RSF models for each outcome and line of therapy. The variable importance score plots showed the relative importance of the variables that were used in the RSF models, in other words, the larger the score the more important the variable. Age at initiation of first-line treatment and group stage (i.e., cancer stage) at initial diagnosis were the most important baseline characteristics available in FHD in predicting first-line optimal treatment for OS (Figure 2A). Partial dependency plots showed that both older age and more advanced group stage were factors which contributed to higher probabilities that CDK4 & 6 inhibitor-based therapies were the optimal treatment selection for patients to maximize survival outcomes (from the OS first-line model; Figure 3). Conversely, older age and more advanced group stage contributed to lower probabilities that endocrine-therapy was the optimal treatment selection for patients to maximize survival outcomes. Time from metastatic diagnosis and age at initiation of first-line treatment were the most important baseline characteristics in predicting first-line optimal treatment resulting in improved TTD (Figure 2B). Time from metastatic diagnosis, age at initiation of second-line treatment and TTD of first-line therapy were the most important baseline characteristics in predicting second-line optimal treatment resulting in improved OS and TTD (Figure 2C & D).
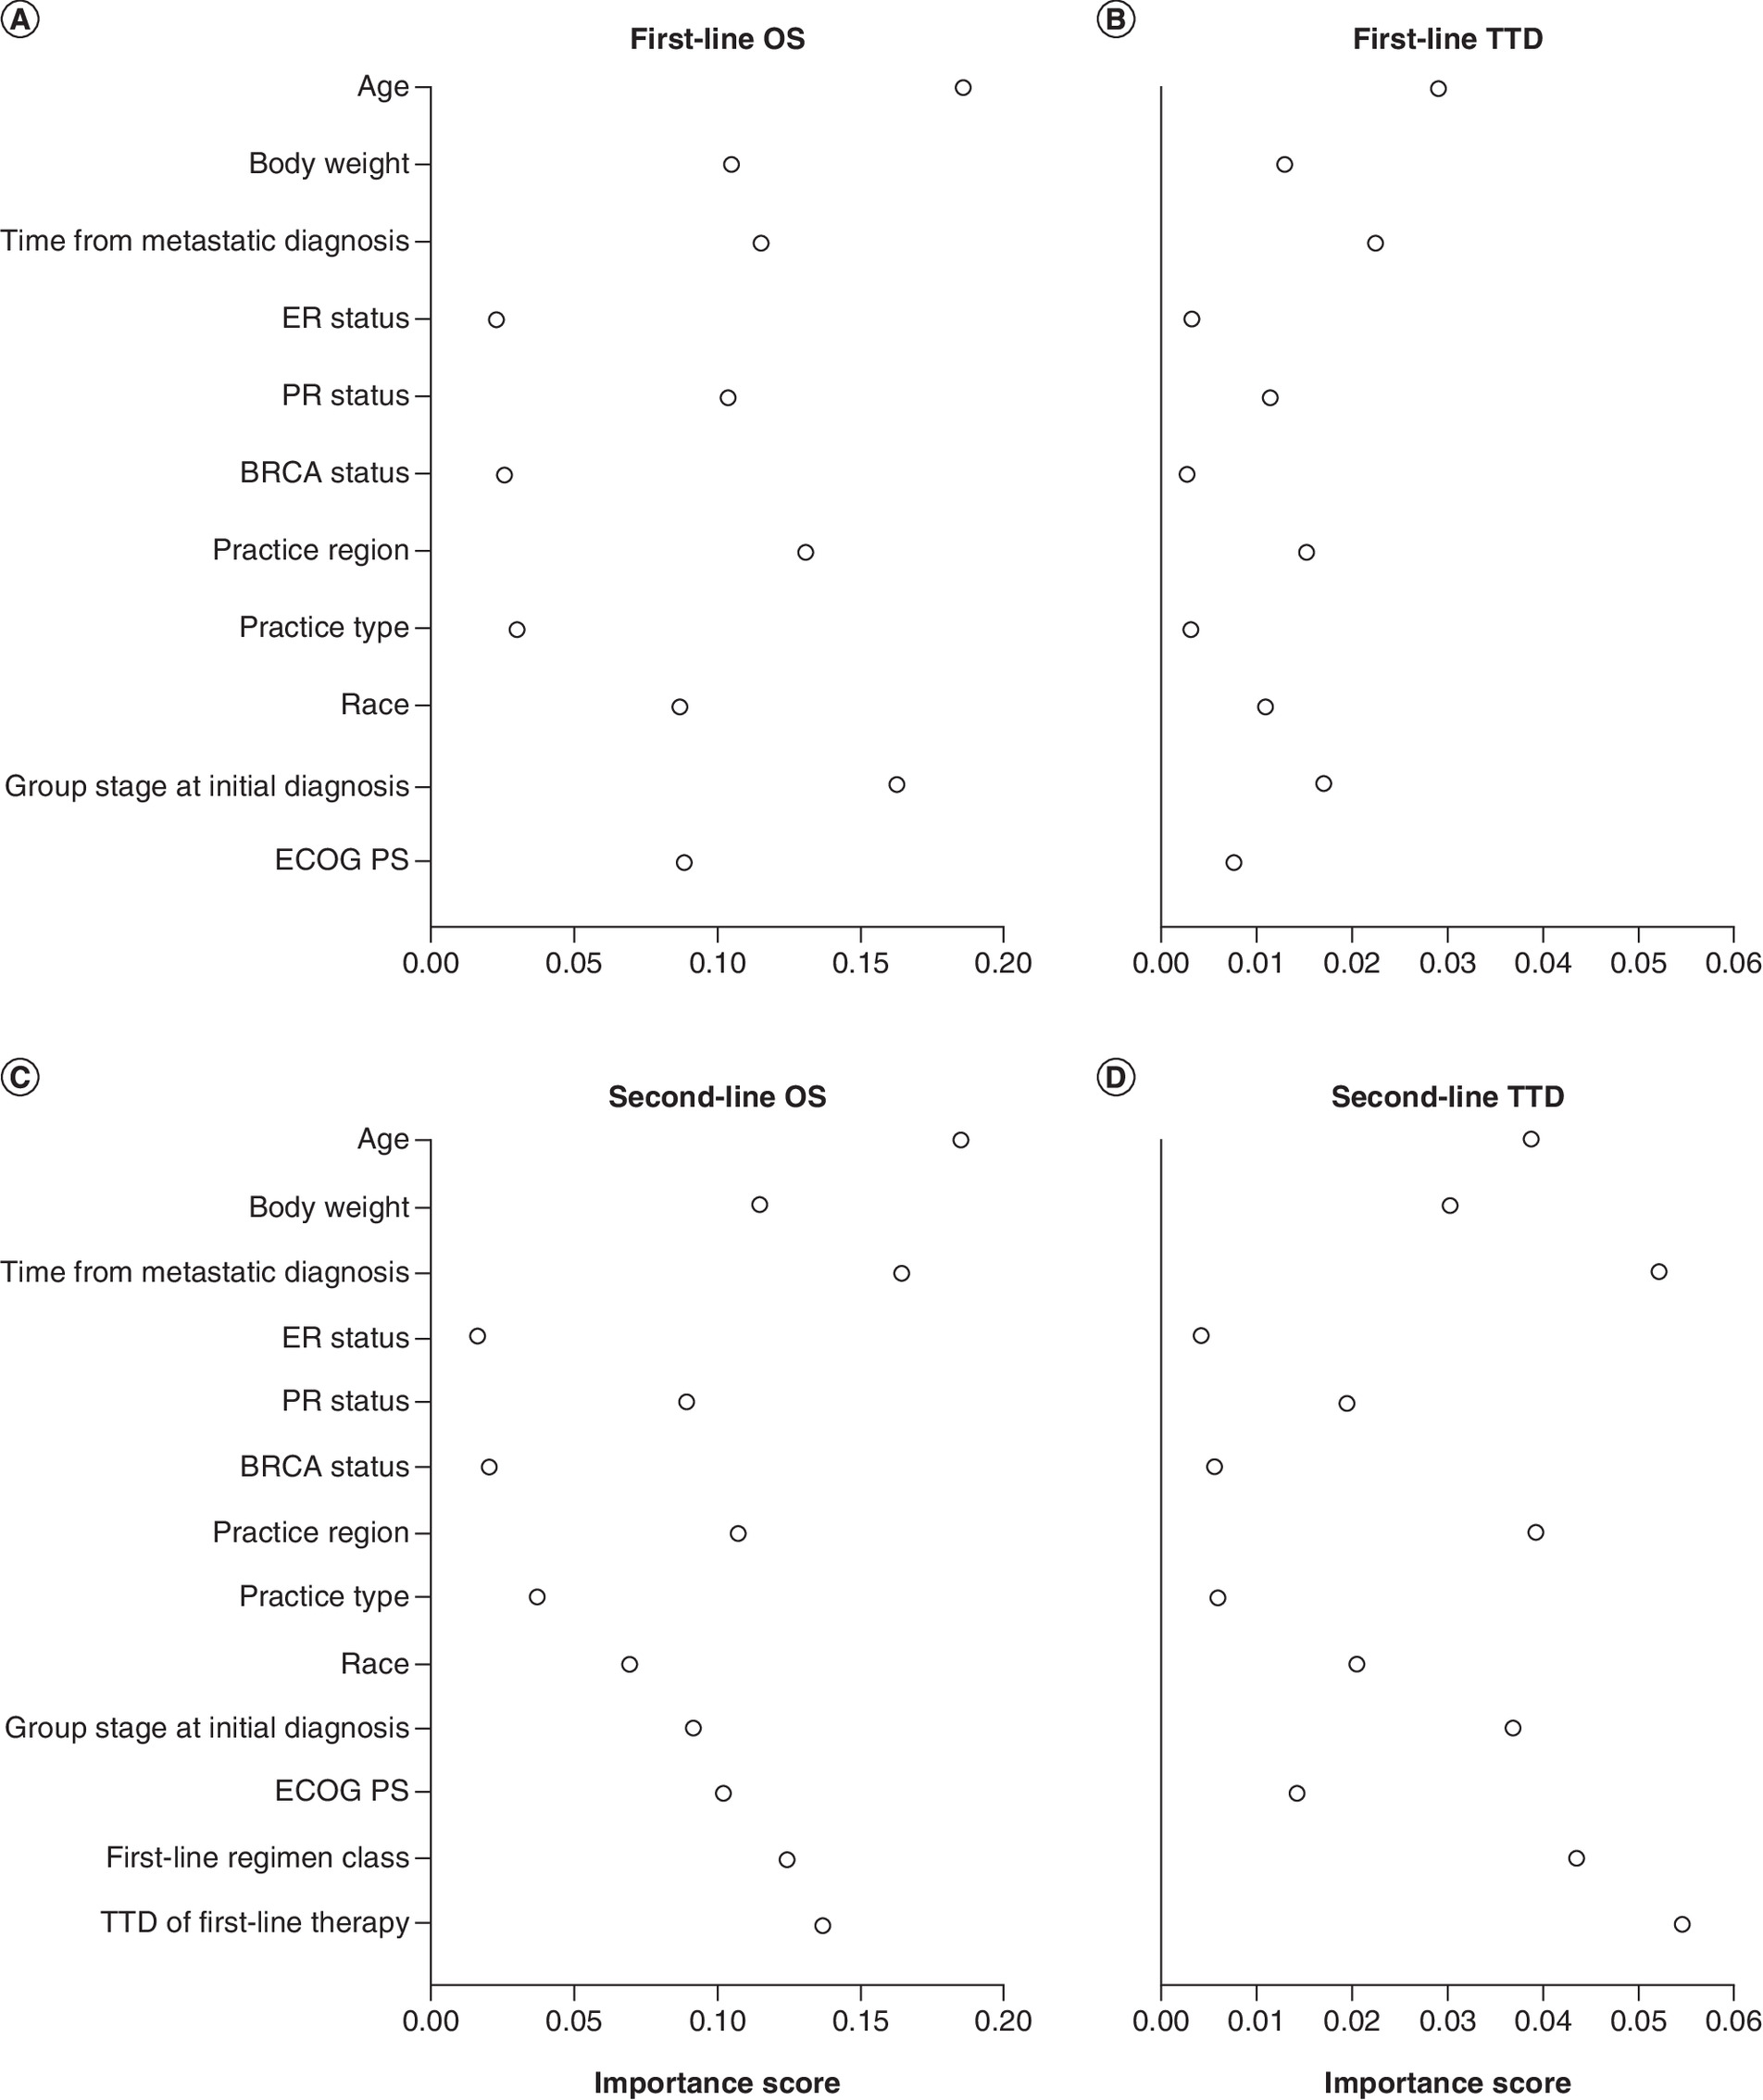
Figure 2. Importance of factors in the RSF models.
(A) First-line therapy OS, (B) first-line therapy TTD, (C) second-line therapy OS, (D) second-line therapy TTD. Larger importance scores indicated greater relative importance of a variable among all other variables in the RSF model.
ECOG: Eastern Cooperative Oncology Group; OS: Overall survival; PS: Performance status; RSF: Random survival forest; TTD: Time to treatment discontinuation.
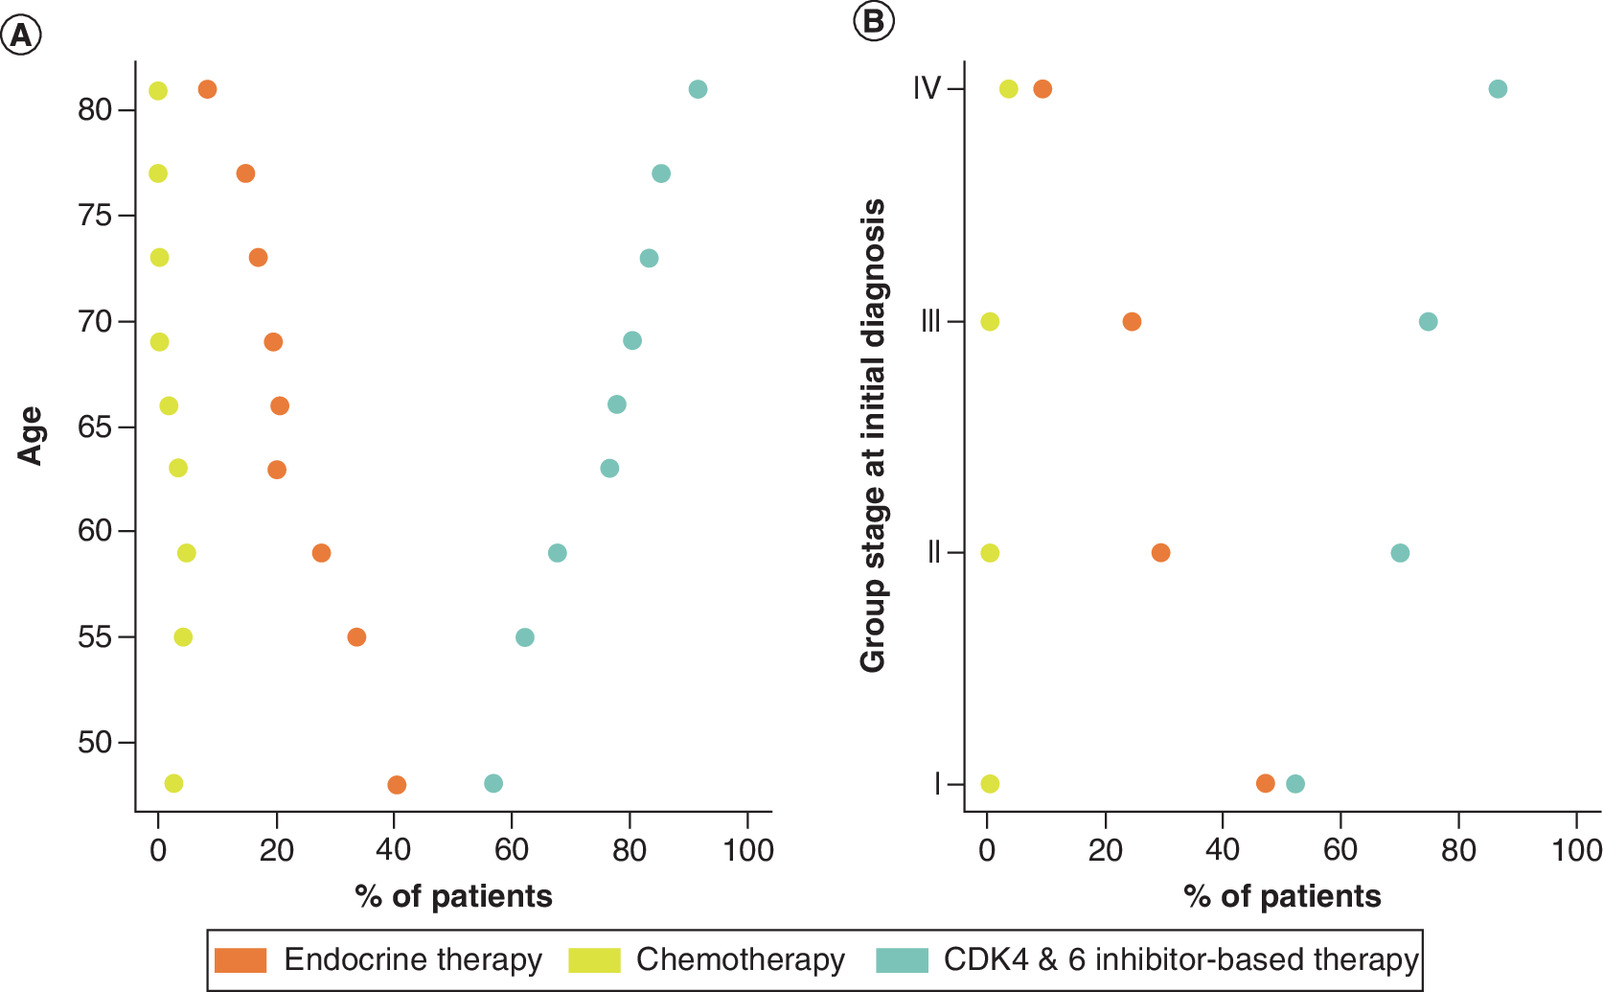
Figure 3. Partial dependency plots for first-line overall survival.
(A) Age and (B) group stage at initial diagnosis. The percentages for optimal allocation to the 3 regimen classes to maximize overall survival are shown on the X axis. Older age and advanced group stage at initial diagnosis contributed to greater use of CDK4 & 6 inhibitor-based therapy, whereas older age and advanced group stage at initial diagnosis contributed to less use of endocrine therapy. Recommendation of chemotherapy was not impacted by age or group stage at initial diagnosis.
Replication analyses using SPD
The SPD allowed for replication of the RSF main analyses using a second dataset that included a richer set of baseline covariates. A total of 379 patients on second-line therapy met all eligibility criteria (see methods) and were included in the replication analyses (Supplementary Table 1). A total of 39 baseline variables were available in the SPD. Patients differed (p < 0.05) among the three regimen classes in age, time from metastatic diagnosis, BRCA status, first-line regimen classes, modified-CCI score, number of metastatic sites and liver metastasis status (Supplementary Table 1).
The RSF model was built on the 39 available baseline variables. 20% of patients in the SPD were randomly selected and used to test the model. This test dataset consisted of 75 and 76 patients for second-line OS and TTD treatment optimization, respectively. The RSF models suggested greater use of CDK4 & 6 inhibitor-based therapies to maximize both OS and TTD in second-line therapy (Figure 4). Specifically, to maximize OS, RSF models recommended use of CDK4 & 6 inhibitor-based therapies for 94% of patients, an increase over the observed 69.6% of patients assigned CDK4 & 6 inhibitors. Likewise, to maximize TTD, RSF models recommended use of CDK4 & 6 inhibitor-based therapies for 96% of patients, an increase over the observed 70.2% of patients (Figure 4).
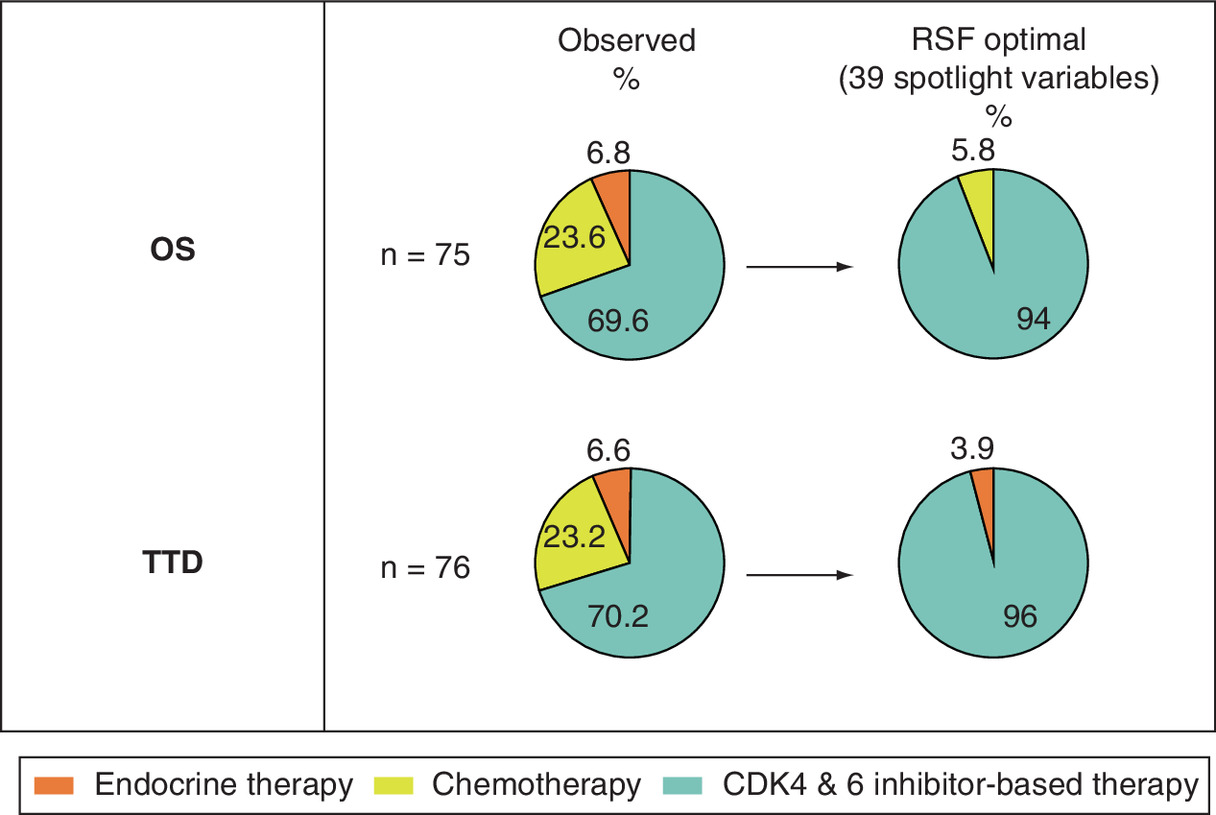
Figure 4. Optimal treatment recommendation for HR+/HER2- metastatic breast cancer in second-line therapy using RSF based on SPD data.
RSF: Random survival forest; OS: Overall survival; SPD: Flatiron spotlight project dataset; TTD: Time to treatment discontinuation.
To evaluate the robustness of the findings in FHD, further RSF modeling was performed on the SPD using only the 13 covariates available in the FHD. The optimal treatment recommendations from the additional RSF model were similar to the original analyses with 39 covariates (data not shown). Although percentages were higher in the SPD cohort than in the FHD cohort, 64.1% of patients received the optimal regimen class in the OS optimization analysis, and 68.7% of patients received the optimal regimen class in the TTD optimization analysis in the SPD cohort (data not shown).
Outcome gains in second-line OS and TTD in patients in the “ON optimal” group versus “OFF optimal” group were estimated and compared in the SPD cohort. The results from the SPD cohort were similar to the FHD cohort (data not shown). The more conservative outcome gains in OS and TTD were estimated and compared between the patients who were ON optimal regimen class to all patients in real-world practice (including those ON and those OFF optimal regimen classes). The gains of optimal regimen classes over real-world practice were smaller than those of ON versus OFF optimal regimen classes comparisons (data not shown).
Figure 5 displays the variable importance scores from the SPD replication analyses. Tumor grade, practice region, first-line regimen class and age were the most important factors for second-line OS. Age, first-line regimen class, body weight and TTD of first-line therapy were the main drivers of the TTD model. There were modest correlations between the variable importance scores in the SPD and FHD though this may be due to the additional variables in SPD, such as tumor grade and correlations among covariates. Among the additional 26 covariates in the SPD, tumor grade, liver metastasis, bone metastasis, number of metastatic sites, modified-CCI score and number of comorbidities were relatively important in treatment decision making (Figure 5).
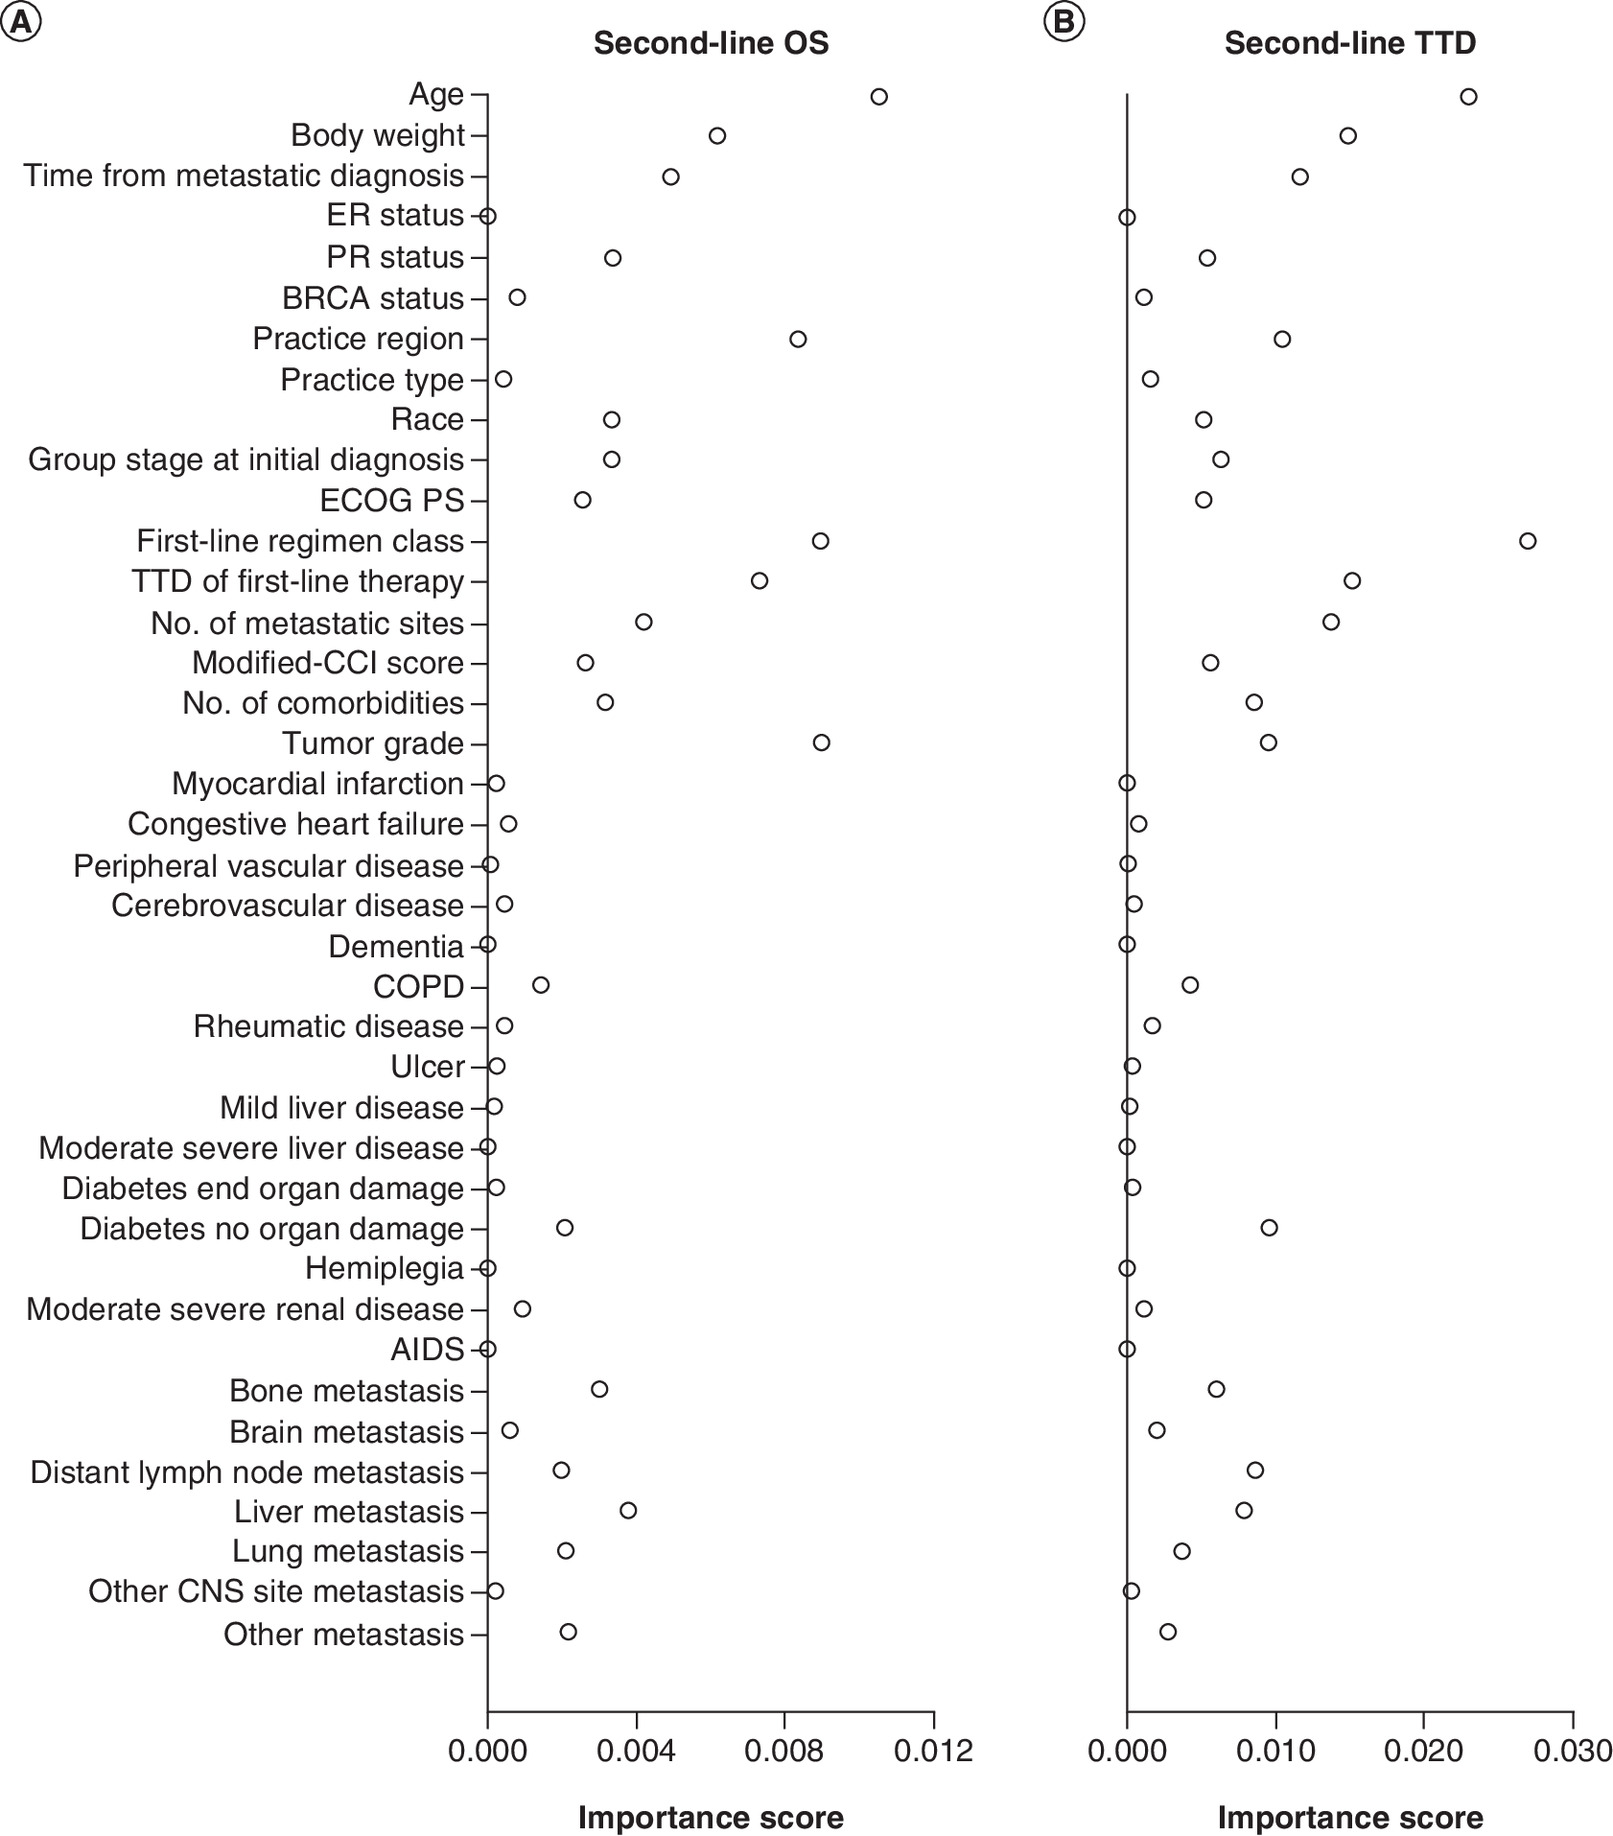
Figure 5. Importance of factors in optimal treatment models from sensitivity analyses.
(A) second-line therapy OS, (B) second-line therapy TTD. Larger importance scores indicated greater relative importance of a variable among all other variables in the RSF model.
CCI: Charlson Comorbidity Index; COPD: Chronic obstructive pulmonary disease; ECOG: Eastern Cooperative Oncology Group; OS: Overall survival; PS: Performance status; RSF: Random survival forest; TTD: Time to treatment discontinuation.
Sensitivity analyses – evaluating the potential effect of an unmeasured confounder (liver metastasis) in the FHD data
Liver metastasis was strongly associated with survival and unevenly distributed across regimen classes (with much lower baseline prevalence among patients who received CDK4 & 6 inhibitor-based therapy; Supplementary Table 1) [41,42]. The RSF method was repeatedly applied (N = 1000) to 80% of the synthetic training data. The optimal Individualized Treatment Recommendation was estimated using the remaining 20% test data. The data were regenerated and reanalyzed by varying the hazard ratio from 1.44 (similar to that in the SPD) to 12.76 (an implausibly high value). The goal was to uncover how strong the confounder needed to be, so that the RSF analysis of synthetic data no longer increased the proportion of patients who were recommended the CDK4 & 6 inhibitor-based regimen class over that observed in FHD (42.1%; Figure 1).
The larger the assumed hazard ratio for ‘liver metastasis’ status, the larger the reduction in the proportion of patients who were recommended CDK4 & 6 inhibitor-based therapies (Table 6). A hazard ratio of 12.76 optimally allocated CDK4 & 6 inhibitor-based therapies to 41.94% of patients – close to the percentage of CDK4 & 6 inhibitors observed in the FHD. Whereas a hazard ratio of 1.44 (similar to the observed HR in SPD) allocated CDK4 & 6 inhibitor-based therapies to 72.96% of patients (Table 6). Recommendation of CDK4 & 6 inhibitor-based therapies over chemotherapy and endocrine therapy persisted until a high, eightfold increase in the hazard ratio associated with liver metastasis. The additional confounder, had it been available in the main analyses, would not have overturned the main finding, that a higher than currently observed proportion of patients should be allocated CDK4 & 6 inhibitor-based therapies.
| Assumed HR for liver metastasis status on OS | CDK4 & 6 inhibitor-based therapy | Chemotherapy | Endocrine therapy |
|---|---|---|---|
| 1.44 | 72.96 (54.89, 87.55) | 1.1 (0, 4.29) | 25.94 (10.81, 43.68) |
| 4.28 | 67.55 (52.86, 82.86) | 6.37 (0.2, 18.78) | 26.09 (10.81, 40.61) |
| 12.76 | 41.94 (20.97, 62.93) | 31.61 (7.93, 51.53) | 26.45 (7.94, 45.21) |
Data are median percent allocations, 2.75 and 97.5% percentiles evaluated on the test data over 1000 random splits.
FHD: Flatiron Health database; HR: Hazard ratio; OS: Overall survival.
Discussion
The treatment landscape for HR+/HER2- MBC is complex and choosing the optimal treatment regimen for a given patient from the available treatment options can be challenging. Endocrine therapy selection and whether it is prescribed alone or in combination with targeted therapies, such as CDK4 & 6 inhibitors, depends on clinician and patient preferences, comorbidities, disease burden and disease biology [44].
In this study, RSF machine-learning algorithms were used to predict the optimal treatment regimen that delivers the best possible outcomes in patients with HR+/HER2- MBC based on EHR. An FDA pooled analysis of five Phase III trials of CDK4 & 6 inhibitors demonstrated that TTD was associated with progression-free survival, and, therefore, may serve as a pragmatic end point for real-world analysis [45]. Furthermore, TTD is associated with progression-free survival across multiple therapeutic strategies including targeted therapy, immunotherapy and chemotherapy in other tumor types [46]. The RSF models suggested greater use of CDK4 & 6 inhibitor-based therapies improves OS and TTD. We found that RSF-predicted optimal treatments that prolonged OS and TTD compared with nonoptimal treatments in patients with HR+/HER2- MBC on either first- or second-line therapy. Similarly, RSF-predicted optimal treatments prolonged OS and TTD compared with treatments assigned in real-world practice. Furthermore, this study identified the importance of key individual variables in predicting optimal treatments which resulted in improved OS and TTD. Further work is necessary to validate these variables, once validated these variables could provide a foundation for future predictive models.
It is important to incorporate clinical opinion with any data-driven machine learning approach to ensure the robustness of the interpretation which may influence treatment decisions for an individual patient. The decision to include CDK4 & 6 inhibitors in a patient’s treatment varies across the practicing oncologist community. An expert panel identified principal drivers to consider when deciding whether or not to use CDK4 & 6 inhibitors in the first-line setting [47]. These principal drivers include whether a patient is symptomatic, whether metastases are primarily visceral or nonvisceral, menopausal status and the disease-free interval. Physicians may be more likely to use CDK4 & 6 inhibitors in younger patients and in those with aggressive, PR negative and symptomatic disease. Endocrine-only therapy is more likely in patients with asymptomatic and relatively indolent disease. However, the expert panel agreed that there is no clinical feature or biomarker which can indicate when to use CDK4 & 6 inhibitors, nor is it possible to reliably predict who would or would not benefit from treatment with CDK4 & 6 inhibitors [47]. The current study could be expanded with further machine learning research incorporating clinical opinion, to potentially develop tools to assist physician and patient treatment decision-making in clinical practice.
One major strength of this work was that the SPD addressed two common concerns with predictive modeling: lack of replication and unmeasured confounders. Due to unmeasured predictors of treatment assignment and outcome, evaluation of treatment effects from observational data may be subject to selection bias even after all measured confounders are accounted for [48]. To address this, the robustness of the findings was examined. Sensitivity analyses were conducted by mimicking the observed outcomes with simulated data where additional predictors of both outcome and treatment assignment, not available in the observed data, were added. Sensitivity parameter(s) were introduced which calibrated the relationship strength between a confounder and the outcome.
Based on the literature and analysis of the SPD data, liver metastasis was identified as a potential confounder for this study. It is less likely that patients with liver metastasis received CDK4 & 6 inhibitor-based therapies based on current prescribing patterns (Supplementary Table 1). The presence of liver metastasis is a risk factor for poor survival [40,41]. As a result, it may be that the estimated optimal treatment regimen favored CDK4 & 6 inhibitor-based therapies simply because patients with liver metastasis were underrepresented in this class and so led to improved survival outcomes. In the sensitivity analyses, we evaluated whether a higher than observed proportion of patients would still be allocated CDK4 & 6 inhibitors by our analysis after accounting for liver metastasis (in other words, if this variable was available in the dataset). The results from the simulated data show that such a risk factor may have only modest impact on the main findings, as it required an unrealistically strong association between the risk factor and survival before there was a significant impact on the results. It is important that future research uncovers if key prognostic factors, such as liver metastasis, impact optimal treatment for specific regimens within a class. In addition, other prognostic factors (both measured and unmeasured confounders, such as endocrine resistance) could be explored. A simulation study is underway to evaluate the operating characteristic of this novel methodology under a variety of scenarios.
While relatively new, the use of machine learning in personalized medicine research is growing. Its application is expected to have profound effects on the detection, diagnosis and treatment of disease [24]. Several studies have successfully applied machine learning algorithms to large patient datasets and results have been promising. For example, machine learning has been used to predict onset of gestational diabetes mellitus during pregnancy [49], to predict risk of Clostridium difficile infection in hospitals [50], to predict the development of certain diseases in patients [51], and to predict palliative care needs of patients [52]. While more recent machine learning methods have been developed, the RSF algorithm was used in this study due to its wide acceptance and ability to handle survival outcomes. For many of the newer machine learning approaches, methods have been developed for continuous outcomes, whereas the theory for survival outcomes remains to be fully developed.
This study has a number of limitations. First, although the sample size used to perform the main analyses was adequate, the sample size used in the replication analyses was small. The patients in SPD were not a random sample from the Flatiron Health metastatic breast cancer database and partially overlapped with those in the main analysis, which may represent a biased sample. A larger sample size would have improved the robustness of the results. Second, key variables such as site of metastases and comorbidities were not available in the FHD used for the main analyses, leading to the need for sensitivity analyses for unmeasured confounders. This violates the assumptions of appropriately using RSF and the inclusion of factors, such as comorbidities, which may impact the optimal treatment estimation. Although we conducted a replication analysis using a dataset with richer baseline covariates, further external validation is necessary. Third, common to real-world analysis, there were missing patient data in some variables, such as BRCA status and ECOG PS. This may hinder the use of these variables as predictors while retaining validity. This missingness is reflective of real-world testing practices for BRCA mutation, and documentation of ECOG PS in the patient chart. Evidence supporting BRCA status as an important prognostic variable is warranted, however, ECOG PS demonstrates considerable potential as a prognostic variable/confounder. We included them in the propensity score model and RSF model with the intention to embrace the available RWD. Forth, the study population included patients initiating first- or second-line treatment from 2015 to 2019, during which time three CDK4 & 6 inhibitors were approved by FDA. The user base of a newly marketed drug or drug class may change during the early marketing period, and there are many patient-, provider-, and system-level factors that could influence uptake. As a result, the observed effect of the drug could change over time, until the user population has stabilized. Additional potential limitations of this study are that the SPD included patients who received abemaciclib regardless of line of therapy resulting in a biased population, and that the extent of liver metastasis may also impact a physician’s decision to choose chemotherapy versus CDK4 & 6 inhibitor-based therapy. Furthermore, the recommendation of CDK4 & 6 inhibitors may be overestimated. However, based on the three sets of analyses, this overestimation is likely small.
In this study, broad regimen classes were used which are limited in terms of direct interpretation to clinical care. Future analyses should use individual regimens as appropriate sample sizes become available. This would assist physicians and patients in choosing specific optimal treatments. In this study, only OS and TTD were optimized, however physicians must consider all potential outcomes and patient preferences in their decision making. In addition, although optimal treatments were estimated for each line of therapy separately, treatment sequence was not taken into account. Future research should explore treatment sequences which are more useful in clinical practice. Other machine learning methods, such as extreme gradient boosting, outcome-weighted learning and penalized regression may be utilized in future studies.
Importantly, chemotherapy is the recommended treatment for patients in visceral crisis per NCCN guidelines and visceral crisis was not characterized as a variable in this oncology dataset. Therefore, it is possible that some of the chemotherapy patients would not be eligible to receive an alternative class of therapy, as predicted by the model. A replication analysis of a dataset with visceral crisis and a sensitivity analysis similar to that for liver metastasis status would be valuable for treatment decision making.
Conclusion
In this study, machine learning algorithms were applied to RWD to predict optimal treatment assignments to improve outcomes for patients with HR+/HER2- MBC in clinical practice. The optimal treatment regimen class predicted by the algorithm suggested greater use of CDK4 & 6 inhibitor-based therapies can maximize the potential for improved outcomes for patients over the observed regimen in both first- and second-line therapy. This study suggests that this type of research has the potential to inform physicians and treatment decision-making strategies to benefit patient outcomes. However, further work is necessary, such as replication analyses and ensuring the availability of appropriate clinical variables that may affect patient outcomes.
•
Systemic treatment options for HR+/HER2- metastatic breast cancer include endocrine therapy, targeted therapy and chemotherapy.
•
This study applied machine learning algorithms to patient datasets obtained from electronic health records.
•
This machine-learning model generated data-driven predictions of optimal treatments for a given patient. Optimal treatments result in longest overall survival (OS) and time to treatment discontinuation (TTD).
•
The machine-learning model suggested greater use of CDK4 & 6 inhibitor-based therapies can improve both OS and TTD. We estimated that less than 50% of patients in the study cohort received their optimal treatment.
•
Outcomes for patients “ON optimal” treatments, as predicted by the model, showed longer OS and TTD compared with patients off optimal treatment (hazard ratios = 0.44∼0.79) in both first- and second-line settings.
•
Variable importance score is a simple and direct measure of importance of a variable for treatment decision making. Patient age, group stage at initial diagnosis, time from metastatic diagnosis were identified as important variables for optimal treatment prediction.
•
Replication analyses using a supplementary dataset with additional variables produced similar results as the main analyses.
•
The robustness of the findings was checked by introducing sensitivity parameters calibrating the strength of relationship between a confounder and the outcome.
•
The use of machine learning with real-world data can inform treatment strategy choices, assisting physicians in the identification of optimal treatments that improve outcomes for patients with HR+/HER2- metastatic breast cancer.
Author contributions
Author ZL Cui, DE Faries, KM Sheffield, GC Carter were responsible for study conception and design; author GC Carter was responsible for acquisition of data; authors Z Kadziola, and I Lipkovich were responsible for data analysis, and all authors were responsible for drafting and revision of the manuscript.
Acknowledgments
The authors thanked A O’Sullivan and G Lawrence for their writing/editing/submission of the manuscript; XI Li for generation of analysis datasets and summaries; B Ratitch for her method selection and code validation; H Fu for his study conception and design; and T Sugihara for her dataset preparation and summarization. All of them are employees of Eli Lilly and Company.
Financial & competing interests disclosure
All the authors are employees of Eli Lilly and Company. The authors have no other relevant affiliations or financial involvement with any organization or entity with a financial interest in or financial conflict with the subject matter or materials discussed in the manuscript apart from those disclosed.
No writing assistance was utilized in the production of this manuscript.
Ethical conduct of research
This study utilized a deidentified dataset, which is not considered human subjects research under the US Code of Federal Regulations.
Open access
This work is licensed under the Attribution-NonCommercial-NoDerivatives 4.0 Unported License. To view a copy of this license, visit http://creativecommons.org/licenses/by-nc-nd/4.0/
Supplementary Material
File (suppl_file.docx)
- Download
- 35.54 KB
References
Papers of special note have been highlighted as: • of interest
1.
Bray F, Ferlay J, Soerjomataram I, Siegel RL, Torre LA, Jemal A. Global cancer statistics 2018: GLOBOCAN estimates of incidence and mortality worldwide for 36 cancers in 185 countries. CA Cancer J. Clin. 68(6), 394–424 (2018).
2.
National Cancer Institute. Cancer Stat Facts: Female Breast Cancer. https://seer.cancer.gov/statfacts/html/breast.html
3.
O'Shaughnessy J. Extending survival with chemotherapy in metastatic breast cancer. Oncologist 10(S3), 20–29 (2005).
4.
Waks AG, Winer EP. Breast cancer treatment: a review. JAMA 321(3), 288–300 (2019).
5.
American Cancer Society. Breast Cancer Facts & Figures 2015-2016 (2015). www.cancer.org/content/dam/cancer-org/research/cancer-facts-and-statistics/breast-cancer-facts-and-figures/breast-cancer-facts-and-figures-2015-2016.pdf
6.
Breast Cancer. National Comprehensive Cancer Network: National Clinical Practice Guidelines in Oncology. Version 6 (2020). www.nccn.org
7.
Milani A, Geuna E, Mittica G, Valabrega G. Overcoming endocrine resistance in metastatic breast cancer: current evidence and future directions. World J. Clin. Oncol. 5(5), 990 (2014).
8.
Puhalla S, Bhattacharya S, Davidson NE. Hormonal therapy in breast cancer: a model disease for the personalization of cancer care. Mol. Oncol. 6(2), 222–236 (2012).
9.
Castrellon AB. Novel strategies to improve the endocrine therapy of breast cancer. Oncol. Rev. 11(1), 323 (2017).
10.
Finn RS, Crown JP, Lang I et al. The cyclin-dependent kinase 4/6 inhibitor palbociclib in combination with letrozole versus letrozole alone as first-line treatment of oestrogen receptor-positive, HER2-negative, advanced breast cancer (PALOMA-1/TRIO-18): a randomised Phase II study. Lancet Oncol. 16(1), 25–35 (2015).
11.
Hortobagyi GN, Stemmer SM, Burris HA et al. Ribociclib as first-line therapy for HR-positive, advanced breast cancer. N. Engl. J. Med. 375(18), 1738–1748 (2016).
12.
Sledge GW Jr, Toi M, Neven P et al. MONARCH 2: abemaciclib in combination with fulvestrant in women with HR+/HER2− advanced breast cancer who had progressed while receiving endocrine therapy. J. Clin. Oncol. 35(25), 2875–2884 (2017).
13.
Hortobagyi GN, Stemmer SM, Burris HA et al. Updated results from MONALEESA-2, a Phase III trial of first-line ribociclib plus letrozole versus placebo plus letrozole in hormone receptor-positive, HER2-negative advanced breast cancer. Ann. Oncol. 29(7), 1541–1547 (2018).
14.
Slamon DJ, Neven P, Chia S et al. Phase III randomized study of ribociclib and fulvestrant in hormone receptor-positive, human epidermal growth factor receptor 2-negative advanced breast cancer: MONALEESA-3. J. Clin. Oncol. 36(24), 2465–2472 (2018).
15.
Tripathy D, Im S-A, Colleoni M et al. Ribociclib plus endocrine therapy for premenopausal women with hormone-receptor-positive, advanced breast cancer (MONALEESA-7): a randomised Phase III trial. Lancet Oncol. 19(7), 904–915 (2018).
16.
Slamon DJ, Neven P, Chia S et al. Overall survival with ribociclib plus fulvestrant in advanced breast cancer. N. Engl. J. Med. 382(6), 514–524 (2020).
17.
Im S-A, Lu Y-S, Bardia A et al. Overall survival with ribociclib plus endocrine therapy in breast cancer. N. Engl. J. Med. 381(4), 307–316 (2019).
18.
Sledge GW, Toi M, Neven P et al. The effect of abemaciclib plus fulvestrant on overall survival in hormone receptor–positive, ERBB2-negative breast cancer that progressed on endocrine therapy—MONARCH 2: a randomized clinical trial. JAMA Oncol. 6(1), 116–124 (2020).
19.
Gelbert LM, Cai S, Lin X et al. Preclinical characterization of the CDK4/6 inhibitor LY2835219: in-vivo cell cycle-dependent/independent anti-tumor activities alone/in combination with gemcitabine. Invest. New Drugs 32(5), 825–837 (2014).
20.
Kucharczyk MJ, Parpia S, Walker-Dilks C, Banfield L, Swaminath A. Ablative therapies in metastatic breast cancer: a systematic review. Breast Cancer Res. Treat. 164(1), 13–25 (2017).
21.
Di Leo A, O'Shaughnessy J, Sledge GW et al. Prognostic characteristics in hormone receptor-positive advanced breast cancer and characterization of abemaciclib efficacy. NPJ Breast Cancer 4(1), 1–8 (2018).
22.
Makady A, De Boer A, Hillege H, Klungel O, Goettsch W. What is real-world data? A review of definitions based on literature and stakeholder interviews. Value Health 20(7), 858–865 (2017).
23.
Raghupathi W, Raghupathi V. Big data analytics in healthcare: promise and potential. Health Inform. Sci. Syst. 2(1), 3 (2014).
• Summary of the impact big data can have on healthcare.
24.
Goecks J, Jalili V, Heiser LM, Gray JW. How machine learning will transform biomedicine. Cell 181(1), 92–101 (2020).
25.
Su X, Tsai C-L, Wang H, Nickerson DM, Li B. Subgroup analysis via recursive partitioning. J. Machine Learn. Res. 10(2), 141–158 (2009).
26.
Lipkovich I, Dmitrienko A, Denne J, Enas G. Subgroup identification based on differential effect search—a recursive partitioning method for establishing response to treatment in patient subpopulations. Stat. Med. 30(21), 2601–2621 (2011).
27.
Doove LL, Dusseldorp E, Van Deun K, Van Mechelen I. A comparison of five recursive partitioning methods to find person subgroups involved in meaningful treatment–subgroup interactions. Adv. Data Anal. Class. 8(4), 403–425 (2014).
28.
Cai T, Tian L, Wong PH, Wei L. Analysis of randomized comparative clinical trial data for personalized treatment selections. Biostatistics 12(2), 270–282 (2011).
29.
Zhao L, Tian L, Cai T, Claggett B, Wei L-J. Effectively selecting a target population for a future comparative study. J. Am. Stat. Assoc. 108(502), 527–539 (2013).
30.
Foster JC, Taylor JM, Ruberg SJ. Subgroup identification from randomized clinical trial data. Stat. Med. 30(24), 2867–2880 (2011).
• One of earliest statistical papers that connects personalized medicine and machine learning, proposing a general approach for subgroup identification based on random forests (Virtual twins).
31.
Faries DE, Chen Y, Lipkovich I, Zagar A, Liu X, Obenchain RL. Local control for identifying subgroups of interest in observational research: persistence of treatment for major depressive disorder. Int. J. Meth. Psych. Res. 22(3), 185–194 (2013).
32.
Qian M, Murphy SA. Performance guarantees for individualized treatment rules. Ann. Stat. 39(2), 1180 (2011).
• This seminal paper introduces the value function as a major tool for evaluating individualized treatment assignment rules/regimens in patent populations with heterogeneous response to treatment.
33.
Zhao Y, Zeng D, Rush AJ, Kosorok MR. Estimating individualized treatment rules using outcome weighted learning. J. Am. Stat. Assoc. 107(499), 1106–1118 (2012).
34.
Zhang B, Tsiatis AA, Laber EB, Davidian M. A robust method for estimating optimal treatment regimes. Biometrics 68(4), 1010–1018 (2012).
35.
Flatiron Health. Accelerate research with the most advanced real-world evidence platform in oncology. https://flatiron.com/real-world-evidence/
36.
Curtis MD, Griffith SD, Tucker M et al. Development and validation of a high-quality composite real-world mortality endpoint. Health Serv. Res. 53(6), 4460–4476 (2018).
37.
Ishwaran H, Kogalur UB, Blackstone EH, Lauer MS. Random survival forests. Ann. App. Stat. 2(3), 841–860 (2008).
• This paper generalizes the random forests originally developed in Leo Bierman’s seminal paper (Breiman, 2001) to time to event outcomes (random survival forests) and proposed graphical tools for their interpretation.
38.
Rubin DB. Bayesian inference for causal effects: the role of randomization. Ann. Stat. 34–58 (1978).
39.
Neyman JS. On the application of probability theory to agricultural experiments. Essay on principles. Section 9. Statistical Science 5, 465–480 (1990).
40.
Breiman L. Random forests. Machine Learning 45(1), 5–32 (2001).
41.
Saverno K, Carter GC, Li L et al. Influence of prognostic factors on outcomes among metastatic breast cancer patients treated with CDK4&6 inhibitors in routine clinical practice. Presented at: San Antonio Breast Cancer Symposium. TX, USA, (2018) (Abstract P2-08-38).
• Evidence of rationale for focus on liver metastsis.
42.
Saverno K, Carter GC, Dufour R et al. Outcomes among metastatic breast cancer patients with characteristics that confer a less favorable prognosis. Presented at: San Antonio Breast Cancer Symposium. TX, USA, (2018) (Abstract P2-08-66:).
43.
Quan H, Li B, Couris CM et al. Updating and validating the Charlson comorbidity index and score for risk adjustment in hospital discharge abstracts using data from 6 countries. Am. J. Epidemiol. 173(6), 676–682 (2011).
44.
Ballinger TJ, Meier JB, Jansen VM. Current landscape of targeted therapies for hormone-receptor positive, HER2 negative metastatic breast cancer. Front. Oncol. 8(308), (2018).
45.
Gao JJ, Gong Y, Cheng J, Schroeder RJ et al. Time to treatment discontinuation as a pragmatic endpoint: a U.S. Food and Drug Administration pooled analysis of CDK 4/6 inhibitors. Presented at: San Antonio Breast Cancer Symposium. TX, USA (2018) (Abstract P5-14-02).
46.
Blumenthal GM, Gong Y, Kehl K et al. Analysis of time-to-treatment discontinuation of targeted therapy, immunotherapy, and chemotherapy in clinical trials of patients with non-small-cell lung cancer. Ann. Oncol. 30(5), 830–838 (2018).
47.
Abraham J, Coleman R, Elias A et al. Use of cyclin-dependent kinase (CDK) 4/6 inhibitors for hormone receptor-positive, human epidermal growth factor receptor 2-negative, metastatic breast cancer: a roundtable discussion by The Breast Cancer Therapy Expert Group (BCTEG). Breast Cancer Res. Treat. 171(1), 11–20 (2018).
48.
Faries D, Zhang X, Kadziola Z et al. Real World Health Care Data Analysis: Causal Methods and Implementation Using SAS. SAS Institute, NC, USA (2020).
49.
Artzi NS, Shilo S, Hadar E et al. Prediction of gestational diabetes based on nationwide electronic health records. Nat. Med. 26(1), 71–76 (2020).
50.
Oh J, Makar M, Fusco C et al. A generalizable, data-driven approach to predict daily risk of Clostridium difficile infection at two large academic health centers. Infect. Control Hosp. Epidemiol. 39(4), 425–433 (2018).
51.
Miotto R, Li L, Kidd BA, Dudley JT. Deep patient: an unsupervised representation to predict the future of patients from the electronic health records. Sci. Rep. 6(1), 1–10 (2016).
52.
Avati A, Jung K, Harman S, Downing L, Ng A, Shah NH. Improving palliative care with deep learning. BMC Med. Inform. Decis. Mak. 18(4), 122 (2018).
Information & Authors
Information
Published In
Pages: 777 - 795
PubMed: 33980048
Copyright
© 2021 Eli Lilly and Company. This work is licensed under the Attribution-NonCommercial-NoDerivatives 4.0 Unported License
History
Received: 23 October 2020
Accepted: 9 March 2021
Published online: 13 May 2021
Keywords:
Topics
Authors
Metrics & Citations
Metrics
Article Usage
Article usage data only available from February 2023. Historical article usage data, showing the number of article downloads, is available upon request.
Citations
How to Cite
Predicting optimal treatment regimens for patients with HR+/HER2- breast cancer using machine learning based on electronic health records. (2021) Journal of Comparative Effectiveness Research. DOI: 10.2217/cer-2020-0230
Export citation
Select the citation format you wish to export for this article or chapter.
Citing Literature
- Ilya Lipkovich, Zbigniew Kadziola, Chenyin Gao, Duzhe Wang, Douglas Faries, Evaluation of Machine Learning Approaches for Estimating Individualized Treatment Regimens for Time-to-Event Outcomes in Observational Studies, Statistics in Biopharmaceutical Research, 10.1080/19466315.2025.2587047, 18, 3, (492-508), (2026).
- Peng Liao, Deoxynivalenol regulates intestinal and stem cell regeneration via the Hippo pathway and clinical intervention strategies, Toxicon, 10.1016/j.toxicon.2025.108553, 266, (108553), (2025).
- Shely Kagan, Lyndsey Huynh, Caro Strickland, Alyssa Wang, Jennifer Y.Y. Kwan, Terry L. Ng, Katarzyna J. Jerzak, Shing Fung Lee, Adrian Chan, Srinivas Raman, Edward Chow, Henry C.Y. Wong, Survival prediction in metastatic breast cancer using artificial intelligence: a scoping review, Current Opinion in Supportive & Palliative Care, 10.1097/SPC.0000000000000780, 19, 4, (279-289), (2025).
- F. Moreno, V. Iranzo, I. Álvarez, A. Antón, J. I. Chacón, J. Gavilá, M. Martín, P. Sánchez Rovira, P. Gratal, M. J. Fernández González, R. López, CDK4/6 inhibitors for metastatic breast cancer in routine clinical practice in Spain: survey of patterns of use and oncologists’ perceptions, Clinical and Translational Oncology, 10.1007/s12094-025-03896-z, 27, 9, (3819-3826), (2025).
- Bianca Vora, Ashutosh Jindal, Erick Velasquez, James Lu, Benjamin Wu, Integrating real‐world data and machine learning: A framework to assess covariate importance in real‐world use of alternative intravenous dosing regimens for atezolizumab, Clinical and Translational Science, 10.1111/cts.70077, 17, 11, (2024).
- Ana Victoria Ponce‐Bobadilla, Vanessa Schmitt, Corinna S. Maier, Sven Mensing, Sven Stodtmann, Practical guide to SHAP analysis: Explaining supervised machine learning model predictions in drug development , Clinical and Translational Science, 10.1111/cts.70056, 17, 11, (2024).
- Ilia Rattsev, Vered Stearns, Amanda L Blackford, Daniel L Hertz, Karen L Smith, James M Rae, Casey Overby Taylor, Incorporation of emergent symptoms and genetic covariates improves prediction of aromatase inhibitor therapy discontinuation, JAMIA Open, 10.1093/jamiaopen/ooae006, 7, 1, (2024).
- Nadia Terranova, Didier Renard, Mohamed H. Shahin, Sujatha Menon, Youfang Cao, Cornelis E.C.A. Hop, Sean Hayes, Kumpal Madrasi, Sven Stodtmann, Thomas Tensfeldt, Pavan Vaddady, Nicholas Ellinwood, James Lu, Artificial Intelligence for Quantitative Modeling in Drug Discovery and Development: An Innovation and Quality Consortium Perspective on Use Cases and Best Practices, Clinical Pharmacology & Therapeutics, 10.1002/cpt.3053, 115, 4, (658-672), (2023).
- Melody Zhao, Kent A. Hanson, Yixie Zhang, Anna Zhou, Ashley S. Cha-Silva, Place in Therapy of Cyclin-Dependent Kinase 4/6 Inhibitors in Breast Cancer: A Targeted Literature Review, Targeted Oncology, 10.1007/s11523-023-00957-7, 18, 3, (327-358), (2023).