Trends in transfusion rates after the FOCUS trial
Abstract
Aim: We estimate the impact of the FOCUS trial, which concluded that hip surgery patients with hemoglobin values above 8 g/dl do not benefit from routine transfusions, on transfusion rates. Methods: We evaluated trends in transfusion rates using inpatient discharge data from four states. Results: The transfusion rate was 5.2 percentage points lower in the fourth quarter of 2013 than it would have been had pre-FOCUS trends continued. Transfusion rates declined more in hospitals with a low end-of-life treatment intensity index, a general measure of treatment intensity. Conclusion: The FOCUS trial affected practice, but there are additional opportunities to reduce the use of transfusions.
The FOCUS trial, published in December 2011, compared liberal versus restrictive use of postoperative transfusion in patients undergoing hip surgery in the USA [1]. Patients in the liberal transfusion arm received postoperative transfusions to maintain hemoglobin at 10 g/dl. Patients in the restrictive arm received postoperative transfusions if they had a hemoglobin level below 8 g/dl and at the discretion of their physician or if they displayed symptoms of anemia. Patients randomized to the restrictive transfusion arm received 65% fewer blood units than patients in the liberal transfusion arm. There were no differences between groups in rates of mortality or mobility limitation at 60 days postrandomization. These results were consistent with the results of earlier trials in different patient populations [2–5]. The FOCUS trial was notable because it was limited to hip fracture patients with co-existing cardiovascular disease or cardiovascular disease risk factors, groups previously thought to require aggressive anemia management. Following the publication of the FOCUS trial, the American Association of Blood Banks (AABB) published a practice guideline in July 2012 recommending that physicians use a restrictive transfusion protocol in postoperative patients [6]. AABB guidelines are the most widely-followed transfusion guidelines [7].
Although transfusions are costly and associated with a number of adverse effects [8], it was unclear if the FOCUS trial would affect transfusion patterns. Clinicians may be slow to incorporate new evidence into practice, especially in cases where established practices have been shown to be ineffective [9–11]. We report trends in transfusion rates before and after the publication of the trial. We also examined the association between hospital-level transfusion rates and a general measure of hospital-level treatment intensity, the Dartmouth Atlas end-of-life care intensity index [12]. We hypothesized that patients treated in hospitals with higher end-of-life treatment intensity would be more likely to receive transfusions, reflecting the common influence of hospital-level management practices and clinical culture. We further hypothesized that if the FOCUS trial affected transfusion practices, then the association between the index and the proportion of patients receiving transfusions would grow weaker over time as the adoption of evidenced-based transfusion practices reduced unwarranted practice variation.
Methods
Data/sample
We used 100% state inpatient discharge data from Kentucky, Maryland, New Jersey and Washington state to measure trends in transfusion rates among patients undergoing surgical repair (hip replacement or internal fixation) for hip fracture. The data spanned the period 2010–2013 (the latest year available) for Maryland and Washington and 2010–2014 for Kentucky and New Jersey. We selected these states because: their inpatient discharge data are available at a reasonable cost through the Agency for Healthcare Research and Quality’s Healthcare Cost and Utilization Project; the states are geographically diverse; recent data are available; and the data include revenue codes, which some hospitals use to report transfusions. The data do not include patients’ hemoglobin or hematocrit values.
We identified patients who had an International Classification of Diseases version 9 (ICD-9) diagnosis codes for hip fracture 820.X and who had ICD-9 procedure codes for arthroplasty (81.51 and 81.52) or internal fixation (78.55, 79.15 and 79.35).
The main sample includes 101,750 patients at 252 hospitals, including 88,589 patients who were treated between 1 January 2010 and 31 December 2013 and 13,161 patients treated in Kentucky and New Jersey in 2014.
Outcome & control variables
The outcome of interest was receipt of a blood transfusion during the hospitalization based on the Agency for Healthcare Research and Quality-coded blood utilization flag, which indicates if a patient’s record included transfusion-related revenue codes, ICD-9 procedure codes or both [13]. Covariates included patient demographics (e.g., patient age, sex and race/ethnicity), payer, surgery type, Elixhauser comorbidity count [14], an indicator for the presence of Elixhauser cardiac disease or cardiac disease risk factor comorbidities (heart failure, valvular disease, pulmonary circulation or peripheral vascular disorders hypertension and diabetes) and an indicator for the presence of anemia-related diagnosis codes (280.X-285.X).
Statistical analysis
We compared trends before and after the publication of the FOCUS trial and revision to AABB guidelines. Because the guidelines were revised shortly after the publication of the trial, we cannot separately determine how trends changed before and after each event. For purposes of analysis and explication, we focus on the publication of the trial as the event of interest, though it is possible that the revision of guidelines had a larger impact on behavior.
We used χ2 tests to compare patient characteristics before (2010–2011) and after (2012–2013) the publication of the FOCUS trial. We used logistic regression models to calculate adjusted trends and the impact of the trial on transfusion rates. All models included hospital-level random effects to adjust standard errors for clustering at the hospital level. We calculated standard errors for predicted values using the delta method [15]. We also estimated models with fixed effects. Results were similar, and so we present only results based on the random effects specification.
We estimated adjusted quarterly trends in the proportion of patients receiving transfusions by state using models that included year-quarter indicator variables. We estimated the change in the proportion of patients receiving transfusions in 2011 and 2013 using a model that included an indicator variable for 2013.
We used an interrupted time series design to estimate changes in transfusion rates before and after publication of the FOCUS trial. The logistic model included a quarterly time trend variable, a post-FOCUS publication indicator variable and an interaction between the time trend and the post-FOCUS indicator variable. Using the model, we predict how observed transfusion rates differ from what rates would have been had pre-FOCUS trends continued.
We repeated the analysis for patients undergoing intestinal surgeries (ICD-9 procedure code 45.X). Use of transfusions in this population may have been affected by the publication of the FOCUS trial and subsequent revision to AABB guidelines, which applied to all hospitalized patients, but not to the same degree as patients undergoing surgical repair for hip fracture. Thus, we expect that the impact of the FOCUS trial on transfusion rates will be smaller. If it is larger, then our estimates may be biased by other events that affected the use of transfusions.
We merged our data to the Dartmouth Atlas end-of-life treatment intensity index12, which is a composite measure of Medicare beneficiaries’ use of hospital care in the last 2 years of life, and grouped hospitals by tertile. Transfusion rates were similar among hospitals in the middle and top tertiles, and so we compared trends between hospitals in the middle and top tertiles versus hospitals in the bottom tertile. We reran the interrupted time series model by fully interacting the time trend and post-FOCUS variables with tertile. We estimated 95% CIs using the method of Krinsky and Robb [16]. We repeated this analysis for teaching hospitals (as indicated by membership in the Council of Teaching Hospitals) and high versus low volume hospitals (≥75 or <75 procedures per year, the median). All analyses were performed in Stata version 14.0 (Stata Corporation, TX, USA). We determined significance based on two-sided tests using an α-level of 0.05.
Estimate of the effect size
The results of the FOCUS trial applied to patients with hemoglobin values between 8 and 10 g/dl, but our data, which does not include laboratory values, include patients with hemoglobin values outside this range. To get a more accurate estimate of the magnitude of the impact of the FOCUS trial on transfusion rates, we divided the effect size from the primary analysis by the proportion of patients undergoing hip surgery who have a minimum postoperative hemoglobin value between 8 and 10 g/dl. We estimated this proportion using electronic medical record data for patients undergoing surgery for hip fracture between 1 January 2009 and 31 December 2013 in one of 79 community hospitals that use a common electronic platform to calculate quality measures.
Results
Table 1 displays the characteristics of patients treated between 1 January 2010 and 31 December 2013. Differences in the distribution of patient characteristics between the pre- and post-FOCUS periods were statistically significant but qualitatively small.
| Characteristic | All patients | Year of surgery n (%) | p-value | ||
|---|---|---|---|---|---|
| 2010–2011 | 2012–2014 | ||||
| Age group: | < 0.001 | ||||
| – <65 | 10,013 (11.3) | 5051 (11.4) | 4962 (11.2) | ||
| – 65–74 | 12,784 (14.4) | 6582 (14.8) | 6202 (14.0) | ||
| – 75–84 | 27,785 (31.4) | 13,642 (30.8) | 14,143 (32.0) | ||
| – ≥85 | 36,350 (41.0) | 18,231 (41.1) | 18,119 (41.0) | ||
| Males | 24,967 (28.2) | 11,917 (26.9) | 13,050 (29.5) | < 0.001 | |
| Race/ethnicity: | < 0.001 | ||||
| – White | 74,443 (84.0) | 35,723 (80.5) | 38,720 (87.5) | ||
| – Black | 3975 (4.5) | 2046 (4.6) | 1929 (4.4) | ||
| – Hispanic | 2717 (3.1) | 1857 (4.2) | 860 (1.9) | ||
| – Other | 7454 (8.4) | 4727 (10.7) | 2727 (6.2) | ||
| Comorbidities: | < 0.001 | ||||
| – 0–1 | 30,103 (34.0) | 15,356 (34.6) | 14,747 (33.3) | ||
| – 2 | 29,050 (32.8) | 14,500 (32.7) | 14,550 (32.9) | ||
| – ≥3 | 29,436 (33.2) | 14,497 (32.7) | 14,939 (33.8) | ||
| Heart disease | 55,376 (62.5) | 27,578 (62.2) | 27,798 (62.8) | 0.042 | |
| Anemia | 48,604 (54.9) | 24,683 (55.7) | 23,921 (54.1) | < 0.001 | |
| Surgery type: | < 0.001 | ||||
| – Total hip replacement | 4062 (4.6) | 2169 (4.9) | 1893 (4.3) | ||
| – Partial hip replacement | 28,135 (31.8) | 13,821 (31.2) | 14,314 (32.4) | ||
| – Internal fixation | 56,392 (63.7) | 28,363 (63.9) | 28,029 (63.4) | ||
| Payer: | < 0.001 | ||||
| – Medicare | 68,632 (77.5) | 32,583 (73.5) | 36,049 (81.5) | ||
| – Medicaid | 2022 (2.3) | 988 (2.2) | 1034 (2.3) | ||
| – Private | 10,696 (12.1) | 5007 (11.3) | 5689 (12.9) | ||
| – Other | 7239 (8.2) | 5775 (13.0) | 1464 (3.3) | ||
| Total n | 88,589 | 44,353 | 44,236 | ||
The proportion of patients who received transfusions declined from 53.7% in 2011 to 47.9% in 2013. Figure 1 shows adjusted trends. The adjusted difference in the transfusion rate is 6.2 percentage points (95% CI: 5.3–7.0; p < 0.001).
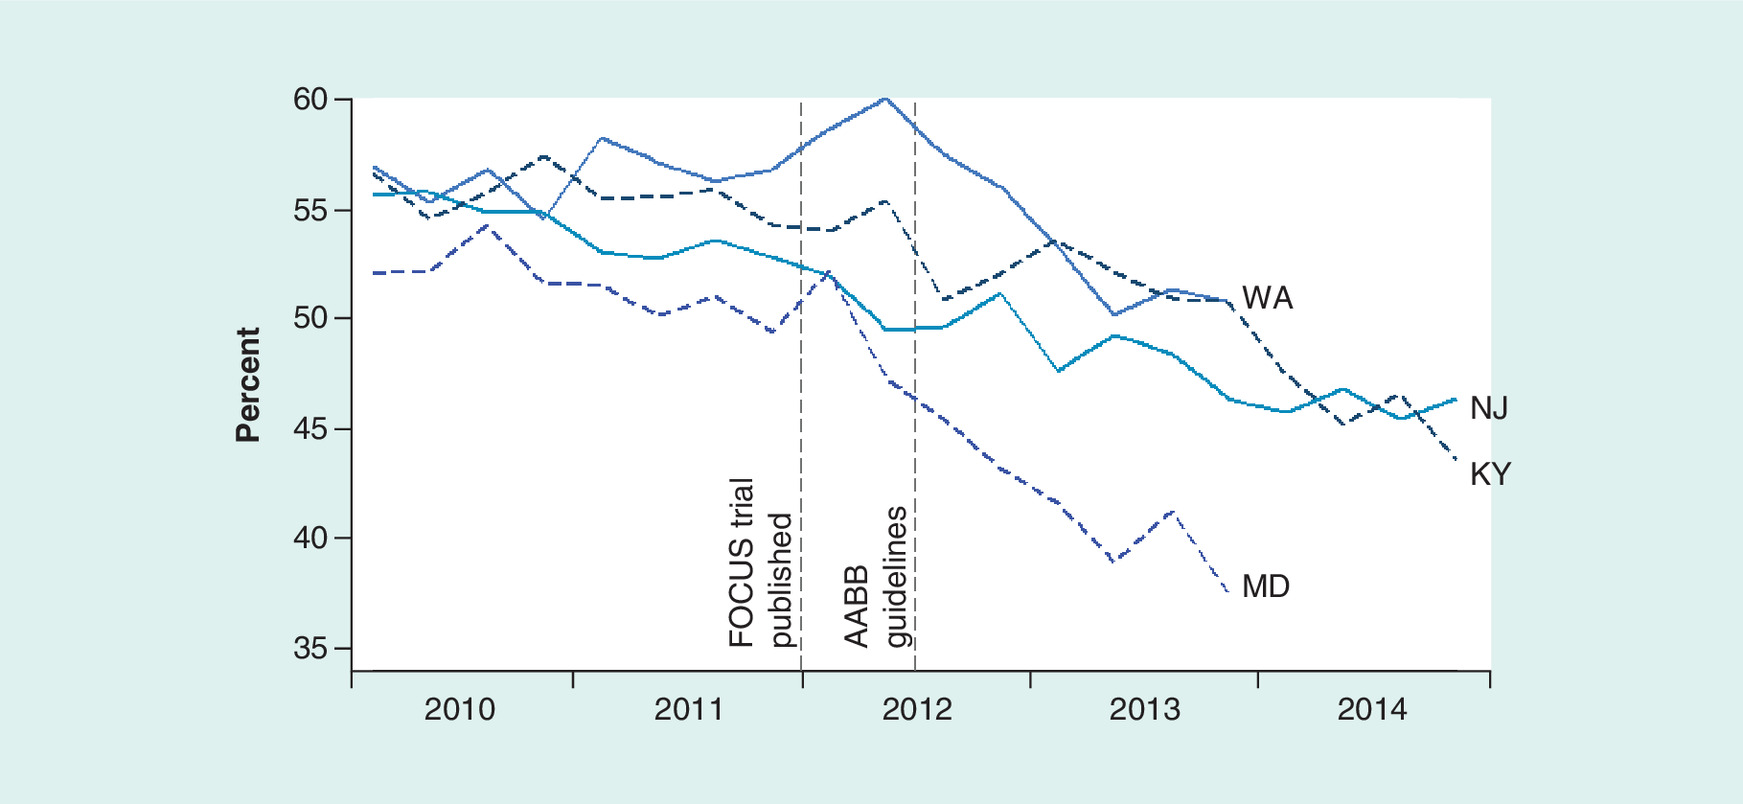
Figure 1. Adjusted trends in the proportion of patients receiving transfusions, by state.
Analysis of state inpatient discharge files from Kentucky (KY), Maryland (MD), New Jersey (NJ) and Washington (WA). Trends are adjusted for patient demographic and clinical characteristics.
AABB: American Association of Blood Banks.
The first set of columns in Table 2 show adjusted quarterly trends in transfusion rates. In Kentucky, rates were declining by a tenth of percentage points per quarter (e.g., from 55.1 to 55.0%) before the publication of the FOCUS trial. After the publication of the FOCUS trial, rates declined by eight-tenths of percentage points per quarter (e.g., from 55.0 to 54.2%).
| State | Quarterly rate of change | Change in share of patients receiving transfusions† | ||
|---|---|---|---|---|
| Pre-FOCUS | Post-FOCUS | Fourth quarter 2013 | Fourth quarter 2014 | |
| Percentage point change (95% CI) p-value | ||||
| Kentucky | -0.1 (-0.5, 0.3) | -0.8 (-1.3, -0.4) | -3.7 (-8.7, 1.3) 0.150 | -8.8 (-15.3, -2.3) 0.008 |
| New Jersey | -0.5 (-0.8, -0.2) | 0.0 (-0.4, 0.3) | -1.7 (-5.8, 2.3) 0.401 | -1.5 (-6.8, 3.7) 0.569 |
| Maryland | 0.1 (-0.3, 0.5) | -1.1 (-2.0, -0.3) | -7.9 (-13.3, -2.6) 0.003 | No data |
| Washington | -0.5 (-0.8, -0.1) | -1.3 (-1.8, -0.7) | -8.6 (-13.4, -3.8) < 0.001 | No data |
| All states | -0.3 (-0.5, -0.1) | -0.7 (-0.9, -0.4) | -5.2 (-7.6, -2.9) < 0.001 | No data |
†These estimates account for the change in the trend as well as any discontinuous, immediate declines following the publication of the FOCUS trial.
The second set of columns present estimates of the decline in the share of patients receiving transfusions that account for: the change in trends; and any instantaneous decline in transfusion rates that occurred immediately following publication, as measured by a post-FOCUS trial indicator variable in the regression model. In Kentucky, the estimates indicate that observed transfusion rates were 3.7 percentage points (95% CI: -8.7–1.3; p = 0.15) lower in the fourth quarter of 2013 than they would have been had the pre-FOCUS trend continued. In all states, we estimate that transfusion rates were 5.2 percentage points (95% CI: 2.9–7.6; p < 0.001) lower than they would have been had the pre-FOCUS trend continued. The comparable estimate for the reduction in the use of transfusions in patients undergoing intestinal surgeries was 1.4 percentage points (95% CI: 0.5–2.3; p = 0.002).
From the electronic medical record data from 79 community hospitals, we estimated that 5653 of 12,640 patients (45%) had minimum postoperative hemoglobin values in the 8–10 g/dl range. Combining estimates of the impact of the FOCUS trial on all patients and the proportion of patients in the affected subgroup, we estimate that the FOCUS trial led to, at most, an 11.6 percentage point reduction (= 5.2 ÷ 0.45) in the use of transfusions.
Figure 2 displays the proportion of patients receiving transfusions in each hospital in 2011 and 2013 among the 191 hospitals that treated at least 25 patients in each year. Each circle represents a hospital. The mean (standard deviation) of the proportion of patients receiving transfusions decreased from 54.3% (12.3%) in 2011 to 48.1% (12.7%) in 2013. Hospitals with a higher transfusion rate in 2011 had larger absolute declines between 2011 and 2013 (the correlation coefficient is -0.38). The proportion of patients receiving transfusions declined in 142 (74.4%) hospitals, represented by markers that lie below the 45 degree line. In 44 (23.0%) hospitals the proportion of patients who received transfusions in 2013 was above the 2011 mean (54.3%).
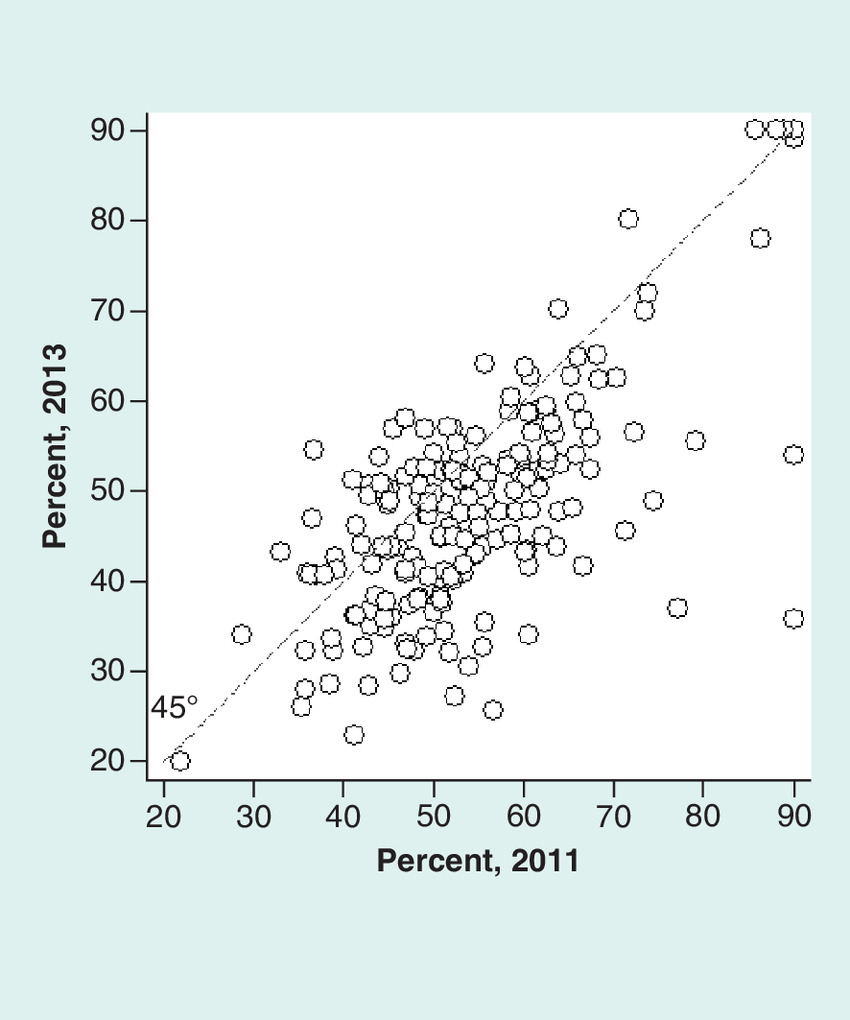
Figure 2. Hospital-level transfusion rates.
The sample includes hospitals that treated at least 25 patients in each year. Proportions below 20% and above 90% were recoded to those values to facilitate display.
We were able to merge the records of 186 hospitals to the Dartmouth Atlas end-of-life treatment intensity index. These hospitals treated 76,436 patients between 2010 and 2013. Figure 3 displays adjusted trends in the proportion of patients receiving transfusions by tertile of the intensity index. Transfusion rates in the fourth quarter of 2013 were 10.1 percentage points lower (95% CI: 1.6–13.0; p = 0.002) among hospitals in the lowest tertile (i.e., low end-of-life intensity index) and 4.5 percentage points lower (95% CI: 2.7–6.2; p < 0.001) among hospitals in the top two tertiles than they would have been, had pre-FOCUS trends continued. The differential decline is 5.7 percentage points (95% CI: 3.3–8.0; p < 0.001).
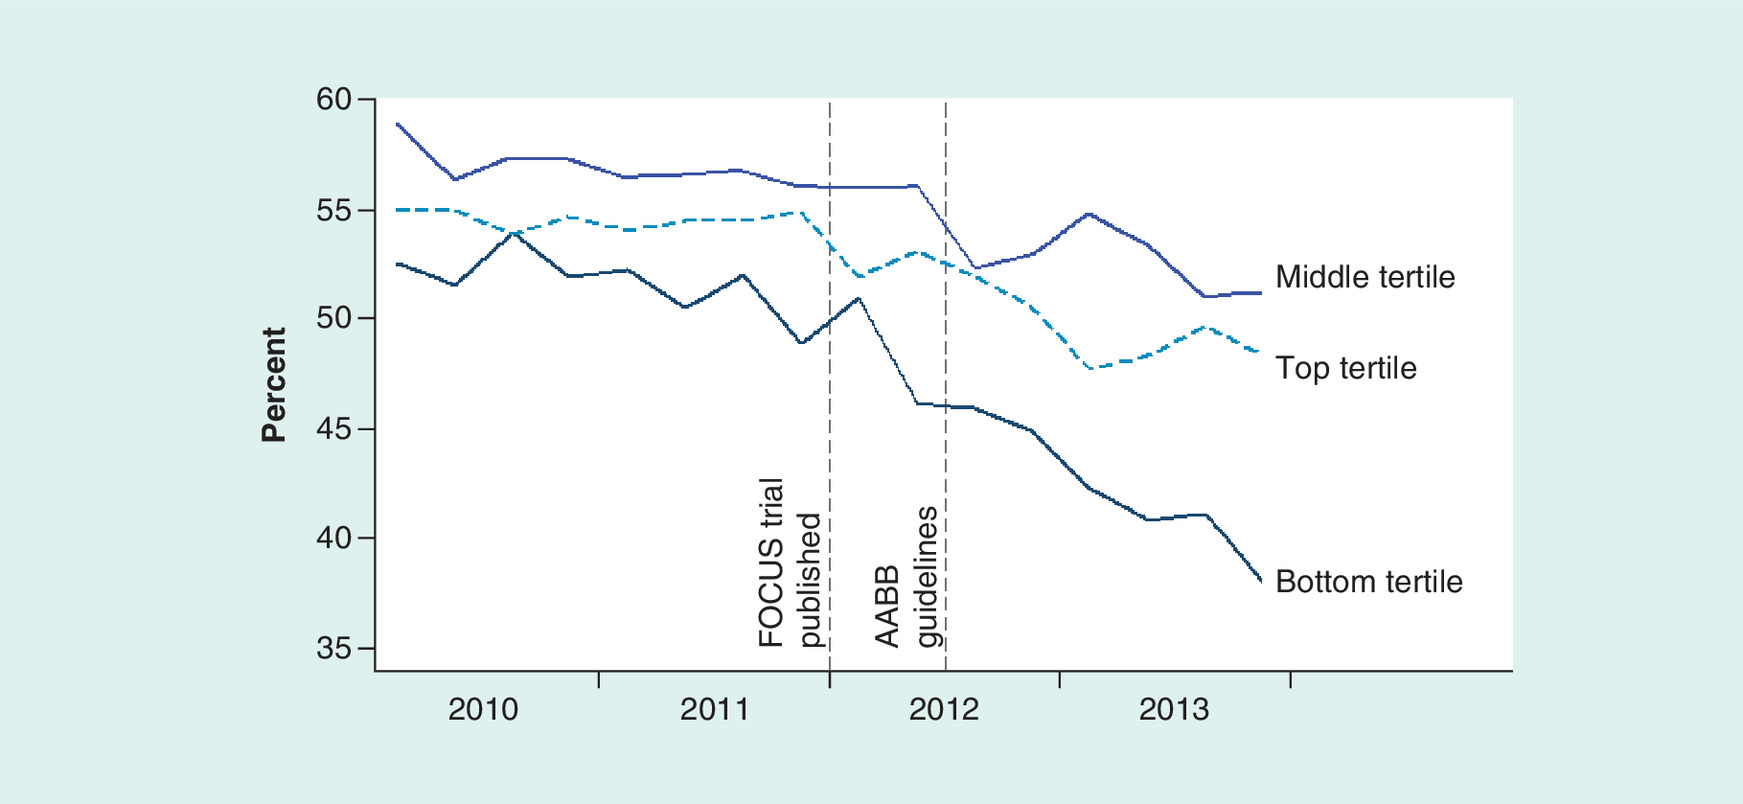
Figure 3. Adjusted trends in the proportion of patients receiving transfusions, by hospital-level end-of-life treatment intensity.
Analysis of state inpatient discharge files from Kentucky (KY), Maryland (MD), New Jersey (NJ) and Washington (WA). Trends are adjusted for patient demographic and clinical characteristics.
AABB: American Association of Blood Banks.
Transfusion rates in teaching hospitals declined from 56.3% in 2011 to 51.8% in 2013. Rates in nonteaching hospitals declined from 53.3 to 47.3%. According to the interrupted time series model, the FOCUS trial led to a larger decline in transfusion rates in nonteaching hospitals (6.5 percentage points [95% CI: 2.9–10.1%; p < 0.001]). The decline in transfusion rates in low volume hospitals was slightly larger than the decline in high volume hospitals (2.3 percentage points [95% CI: 0.01–0.04; p < 0.001]).
Discussion
Transfusion rates were declining prior to the publication of the FOCUS trial. The rate of decline increased following the publication of the trial. In the fourth quarter of 2013, rates were 5.2 percentage points lower than they would have been, had the pretrial trend continued. Assuming that the trial did not have an impact on the care of patients with hemoglobin values outside the 8–10 g/dl range, this translates to a 11.6 percentage point reduction in the use of transfusions for patients with hemoglobin values in that range.
Our estimate of the impact of the FOCUS trial on transfusion rates in New Jersey is small and nonsignificant, but this result may be an artifact of the interrupted time series design, which assumes, conservatively, that pre-FOCUS declines in the proportion of patients receiving transfusions would have continued in 2012 and beyond even if the trial results were not published. Also, the principal investigator of the trial is based in New Jersey and it is probably safe to assume that one or more New Jersey hospitals enrolled patients in the trial (we have been unable to find a list of trial sites).
Our study highlights the value of conducting multiple trials of the same treatment in different populations. The TRICC trial [3] was published in 1999 and found that routine transfusions were unnecessary in critical care patients. The TRICC trial may have influenced patterns of care in hip surgery patients, but the FOCUS trial had an additional effect, suggesting that some physicians waited until there were trial results that were specific to hip surgery patients to implement a restrictive transfusion strategy. Consistent with this conjecture, we found that there was only a small reduction in the share of patients undergoing intestinal surgery who received transfusions following the publication of the FOCUS trial.
The difference in the use of transfusions between hospitals with low and high values of the Dartmouth Atlas end-of-life care intensity index actually grew larger after the publication of the FOCUS trial. Hospitals with a lower end-of-life intensity index may have a management or clinical culture that emphasizes high value, evidenced-based care. The result contradicts the hypothesis that evidence reduces unwarranted practice variation [17]. A number of interventions, including education, adoption of guidelines, feedback and adoption of electronic medical record alerts, have been shown to reduce the use of unnecessary transfusions [18]. However, as of 2011, less than a third of hospitals had implemented restrictive transfusion protocols [7]. There are probably additional opportunities to reduce the proportion of patients receiving transfusions without harming patients.
We are unaware of studies that have documented physicians’ awareness of the FOCUS trial and AABB guidelines. A survey of anesthesiologists and perfusionists (32% response rate) found that most (78 and 67%) were aware of the 2007 Society of Thoracic Surgeons and the Society of Cardiovascular Anesthesiologists’ transfusion guidelines, though few reported that their institutions had taken formal steps to change transfusion and blood management practices [19].
One unexpected result was that transfusion rates declined more in nonteaching hospitals than teaching hospitals. We did not emphasize this finding because: there was a preexisting downward trend in transfusion rates among teaching hospitals; and estimates are not adjusted for patients’ hemoglobin levels.
State discharge data allow us to study transfusion patterns over time in a large sample of hospitals. However, they do not record when during the course of patients’ stays transfusions were administered. Also, they are based on billing records. Billing data are highly specific for measuring the receipt of transfusions, but the sensitivity based on ICD-9 procedure codes alone is around 70–80% [20,21]. We measured the receipt of transfusions using both procedure codes and revenue codes, which ought to improve sensitivity. If sensitivity is less than 100%, then our estimate of the impact of the FOCUS trial will be biased downward.
In the absence of a concurrent control group, we are unable to precisely identify the impact of the FOCUS trial. However, the reduction in transfusion rates among patients undergoing intestinal surgery was much smaller (1.4 percentage points), suggesting that our estimate of the decline among patients undergoing surgery for hip fracture (5.2 percentage points) is not simply an artifact of general trends in blood and patient management.
Conclusion
Between 2008 and 2011, the number of whole and red blood cell units transfused nationally declined by 8.2% [7]. While both the adoption of minimally invasive surgical techniques and the use of techniques such as blood salvage technology to prevent and manage blood loss may have contributed to the decline, our study suggests that the accumulating evidence in favor of restrictive transfusion strategies [5] also played an important role.
The FOCUS trial found that patients with hemoglobin levels between 8 and 10 g/dl do not benefit from routine transfusions.
Methods
We assessed impact of the trial on transfusion rates using hospital discharge data from four states.
We used an interrupted time series model to measure the impact of the trial.
We stratified hospitals based on their end-of-life treatment intensity index and a general measure of hospital practice style.
Results
We estimate that transfusion rates declined by 5.2 percentage points as a result of the FOCUS trial.
Transfusion rates did not decline among hospitals with higher end-of-life treatment intensities.
Conclusion
The FOCUS trial affected practice patterns.
There are additional opportunities to reduce transfusion rates.
Financial & competing interests disclosure
This study was supported by Agency for Healthcare Research and Quality grant R03HS24613-01. The authors have no other relevant affiliations or financial involvement with any organization or entity with a financial interest in or financial conflict with the subject matter or materials discussed in the manuscript apart from those disclosed.
No writing assistance was utilized in the production of this manuscript.
Ethical conduct of research
The research was approved by our institution’s Institutional Review Board.
References
1.
Carson JL, Terrin ML, Noveck H et al. FOCUS investigators. Liberal or restrictive transfusion in high-risk patients after hip surgery. N. Engl. J. Med. 365(26), 2453–2462 (2011).
2.
Hajjar LA, Vincent JL, Galas FR et al. Transfusion requirements after cardiac surgery. The TRACS randomized controlled trial. JAMA 304(14), 1559–1567 (2010).
3.
Hébert PC, Wells G, Blajchman MA et al. A multicenter, randomized, controlled clinical trial of transfusion requirements in critical care. Transfusion requirements in critical care investigators, Canadian critical care trials group. N. Engl. J. Med. 340(6), 409–417 (1999).
4.
Kirpalani H, Whyte RK, Andersen C et al. The premature infants in need of transfusion (PINT) study: a randomised controlled trial of a restrictive (low) versus liberal (high) transfusion threshold for extremely low birthweight infants. J. Pediatr. 149(3), 301–307 (2006).
5.
Holst LB, Petersen MW, Haase N, Perner A, Wetterslev J. Restrictive versus liberal transfusion strategy for red blood cell transfusion: systematic review of randomised trials with meta-analysis and trial sequential analysis. BMJ 350, h1354 (2015).
6.
Carson JL, Grossman BJ, Kleinman S et al. Red blood cell transfusion: a clinical practice guideline from the AABB. Ann. Intern. Med. 157(1), 49–58 (2012).
7.
DHHS. Report of the US Department of Health and Human Services. The 2011 National Blood Collection and Utilization Survey Report. US Department of Health and Human Services, Office of the Assistant Secretary for Health, Washington, DC, USA (2011).
8.
Rohde JM, Dimcheff DE, Blumberg N et al. Health care-associated infection after red blood cell transfusion: a systematic review and meta-analysis. JAMA 311, 1317–1326 (2014).
9.
Ubel PA, Asch DA. Creating value in health by understanding and overcoming resistance to de-innovation. Health Aff. 34(2), 239–244 (2015).
10.
Roman BR, Asch DA. Faded promises: the challenge of de-adopting low-value care. Ann. Intern. Med. 161(2), 149–150 (2014).
11.
Prasad V, Cifu A, Ioannidis JP. Reversals of established medical practices: evidence to abandon ship. JAMA 307(1), 37–38 (2012).
12.
Wennberg JE, Goodman DC, Skinner JS. Tracking the care of patients with severe chronic illness. The Darthmouth Atlas of Health Care 2008. The Dartmouth Institute for Health Policy and Clinical Practice, Lebanon, NH, USA (2008).
13.
Elixhauser A, Barrett M, Nisbet J. Development of utilization flags for use with UB-92 administrative data. HCUP Methods Series Report # 2006–04. US Agency for Healthcare Research and Quality, July 14 2006. www.hcup-us.ahrq.gov/reports/methods/2006_4.pdf
14.
Elixhauser A, Steiner C, Harris DR, Coffey RM. Comorbidity measures for use with administrative data. Med. Care 36(1), 8–27 (1998).
15.
Dowd BE, Greene WH, Norton EC. Computation of standard errors. Health Serv. Res. 49(2), 731–750 (2014).
16.
Krinsky I, Robb AL. On approximating the statistical properties of elasticities. Rev. Econ. Stat. 68, 715–719 (1986).
17.
Phelps CE. Diffusion of information in medical care. J. Econ. Perspect. 6(3), 23–42 (1992).
18.
Tinmouth A, Macdougall L, Fergusson D et al. Reducing the amount of blood transfused: a systematic review of behavioral interventions to change physicians’ transfusion practices. Arch. Intern. Med. 165(8), 845–852 (2005).
19.
Likosky DS, FitzGerald DC, Groom RC et al. Effect of the perioperative blood transfusion and blood conservation in cardiac surgery clinical practice guidelines of the Society of Thoracic Surgeons and the Society of Cardiovascular Anesthesiologists upon clinical practices. Anesth. Analg. 111(2), 316–323 (2010).
20.
Howard DH, Karcz A, Roback JD. The accuracy of claims data for measuring transfusion rates. Transfus. Med. 26(6), 457–459 (2016).
21.
Segal JB, Ness PM, Powe NR. Validating billing data for RBC transfusions: a brief report. Transfusion 41(4), 530–533 (2001).
Information & Authors
Information
Published In
Copyright
© 2018 Future Medicine Ltd.
History
Received: 7 June 2017
Accepted: 17 August 2017
Published online: 21 February 2018
Keywords:
Topics
Authors
Metrics & Citations
Metrics
Article Usage
Article usage data only available from February 2023. Historical article usage data, showing the number of article downloads, is available upon request.
Citations
How to Cite
Trends in transfusion rates after the FOCUS trial. (2018) Journal of Comparative Effectiveness Research. DOI: 10.2217/cer-2017-0038
Export citation
Select the citation format you wish to export for this article or chapter.