

Real-world utilization of pembrolizumab dosing schedules in Belgium: a multi-center retrospective study using a common data model and natural language processing
Abstract
Aim: Pembrolizumab's six-week extended dosing (ED), approved as an alternative to the standard three-week schedule (SD), offers flexibility in treatment plans. Materials & methods: In this retrospective study across four Belgian hospitals, we described real-world pembrolizumab utilization using a pipeline that processed unstructured data with natural language processing (NLP) and mapped both structured and unstructured data to an OMOP-CDM database. Physicians and data analysts collaboratively developed the project-specific data dictionary and performed validation. Results: A total of 303 patients were included, 56% with non-small cell lung cancer (NSCLC). Most patients (72%) received monotherapy, with 89% starting on SD. For NSCLC first-line monotherapy, the median time on treatment (rwTOT) was 106 days in the ‘SD only’ cohort and 666 days in the ‘SD to ED’ cohort, while the median time to next treatment (rwTTNT) was 280 days for ‘SD only’ (median rwTTNT not reached for ‘SD to ED’). Dosing cohort distributions showed that 74% of patients in the ‘SD to ED’ group had NSCLC, compared with 77% with urothelial cancer in the ‘ED only’ group. The mean (StdDev) gap between administrations was 23 (7) days for SD and 43 (5) days for ED. Most patients receiving ED did so after starting on SD, and all ED initiators stayed on ED. Dosing patterns remained stable pre- and during COVID-19. Conclusion: This study describes real-world pembrolizumab dosing patterns across four Belgian hospitals and illustrates how integrating NLP and structured data within an OMOP-CDM framework can support such analyses. Patients switching from SD to ED showed longer rwTOT and rwTTNT than those on SD alone, though potential immortal time bias requires caution in interpretation.
Plain language summary: How pembrolizumab dosing schedules are used in Belgian hospitals using routine health data
What is this article about?
Pembrolizumab is a cancer treatment that can be given every 3 weeks (standard dosing) or every 6 weeks (extended dosing). The extended schedule may reduce hospital visits and improve convenience for patients. However, there is limited information on how these schedules are used in routine care.
In this study, we used routinely collected data from four Belgian hospitals, including information from both structured records and clinical notes, to describe how pembrolizumab is used in practice. This study also shows how advanced data methods can help answer clinical questions using real-world data.
What were the results?
We included 303 patients receiving pembrolizumab. Most patients started on the standard schedule, and many stayed on it. Among those who received extended dosing, most switched from the standard schedule after some time. Patients who switched to extended dosing tended to remain on treatment longer. However, this reflects how the groups are defined and should be interpreted with caution. Dosing patterns remained stable over time, including during the COVID-19 pandemic.
Why is this important?
This study shows that real-world hospital data can be used to understand how cancer treatments are used in practice. The findings suggest that extended dosing is feasible and may reduce the number of hospital visits. However, differences between dosing groups do not necessarily reflect differences in treatment effectiveness.
Real-world health data can address clinical questions not answered in randomized controlled trials, improve allocation of public resources and, at the level of digital twinning, inform personalized decision making. Broad categories of real-world data include ‘thick’ datasets such as registries (containing all features of a small fraction of patients), ‘big’ datasets such as claims data (containing very few features of all patients) and ‘dirty’ routinely-collected data such as electronic health records (EHRs; containing all features of all patients, but with a large amount of missing data and heterogeneity). EHR data have the potential to answer complex and evolving clinical questions for which other data sources are lacking. To leverage this potential, we have built a pipeline to develop scalable clinical data warehouses in a consortium of hospitals, that can be validated in a project-specific way [1–3]. The set-up respects a federated approach that is compliant with the General Data Protection Regulation (GDPR) and maximally preserves patient privacy [4]. The building of this consortium has been partly made possible through the European Heath Data & Evidence Network (EHDEN) project [5]. EHDEN promotes the formation of a federated network of European health data sources, mapped to the open source Observational Medical Outcomes Partnership common data model (OMOP CDM), to address many of the challenges that our healthcare systems are facing [5,6].
Here, we present an oncology use case of this consortium to demonstrate the capability of this infrastructure to answer complex clinical questions, focusing on the real-world utilization of different pembrolizumab dosing schedules in Belgium. Pembrolizumab is a monoclonal programmed death receptor-1 (PD-1)-blocking antibody that is currently approved for the treatment of multiple oncology and hematology indications in both advanced and early stages [7]. The standard dosing (SD) schedule is 200 mg every 3 weeks (Q3W). In April 2019, the EMA approved the extended dosing schedule (ED) of 400 mg every 6 weeks (Q6W) across all adult indications for pembrolizumab monotherapy [8,9], and subsequently for all combination regimens [9]. Following EMA approval, in April 2020, the US FDA granted accelerated approval to the 400 mg ED schedule across all adult indications [10].
The EMA and FDA approvals were based on pharmacokinetic modeling and simulation data, as well as the interim results from KEYNOTE-555 [11]. This was an open-label, Phase I study designed to evaluate the pharmacokinetics, safety and efficacy of the 400 mg ED schedule for patients with advanced melanoma [12] which showed a safety and objective response rate of the 400 mg ED schedule that were comparable to the safety and objective response rate in previous pembrolizumab studies of metastatic melanoma [13]. Subsequent approvals of the pembrolizumab 400 mg ED schedule have followed worldwide, and the 400 mg ED schedule will be included in all future submissions for new pembrolizumab indications. The ED schedule could reduce the burden on patients and providers while maintaining therapeutic outcomes. In addition, the less frequent schedule of administration reduces patient exposure to potential nosocomial infections, which was particularly relevant during the COVID-19 pandemic [14].
Therefore, the aim of this study was to describe the implementation and indication split for the different pembrolizumab dosing schedules, as well as the potential impact of the COVID-19 pandemic on dosing schedules. This study furthermore allows us to evaluate the capability of our extract, transform, load (ETL) pipeline and hospital consortium to produce a high-quality answer to a complex ad hoc clinical question, for which datapoints are not typically available in ‘big’ data sources and for which the ETL pipeline was not specifically designed.
Materials & methods
Study design
The primary objectives of the study were to describe the utilization of different dosing schedules of pembrolizumab in a real-world setting, overall, by treatment type (monotherapy vs combination therapy) and by indication. Within these groups, patient demographics, clinical characteristics and treatment history were to be described. The secondary objective of this study was to gain insights into real-world time on treatment (rwToT) and real-world time to next treatment (rwTTNT) of patients with different pembrolizumab dosing schedules, overall, by treatment type (monotherapy vs combination therapy) and by indication. As an exploratory objective, this study also aimed to evaluate the impact of the COVID-19 pandemic by assessing alternative dosing schedule distributions of pembrolizumab monotherapy for April 2019 through December 2019 versus March 2020 to December 2021.
The study was conducted analyzing data from 4 Belgian hospitals. The index date was defined as the date of first dose of pembrolizumab on or after the regulatory approval date for pembrolizumab alternative ED (Q6W) schedule (Supplementary Figure 1), derived from structured data sources only. The approval in Belgium followed the EMA approval for pembrolizumab monotherapy (4 April 2019) and combination (21 May 2021) alternative ED schedule. The index event for all patients fell within the period between 4 April 2019 and 1 February 2022 (study identification period).
Study population
The patients included in the study were all ≥18 years and treated with pembrolizumab for the indications approved and reimbursed within Belgium (Supplementary Table 1). Included patients had received their first infusion of pembrolizumab on or after the EMA approval dates for the alternative ED schedule: monotherapy indications with a start date on or after 4 April 2019 and combination indications with a start date on or after 21 May 2021. Baseline patient information was assessed at the time of the first dose of the line of therapy in which pembrolizumab was administered (index event). Patients were excluded if they had a prior exposure to anti-PD1/PD-L1 therapy in the pre-index period.
Patients receiving at least one dose of pembrolizumab after the index date were followed from the first dose until the last available data (see study timeline, Supplementary Figure 1). Sub-analysis on dose switching was performed for patients with at least 6 months of treatment. Baseline characteristics were analyzed in the pre-index time period (6 months prior to pembrolizumab treatment initiation). Prior lines of therapy were not analyzed and only the same line of therapy that includes pembrolizumab was included in the study. The time ranges for available data per data source are shown in Supplementary Table 2.
Figure 1 shows the logic employed to ascribe a specific indication for patients with lung cancer treated with pembrolizumab. Once the cancer type was detected (left columns), additional characteristics were detected to match an indication for pembrolizumab. Hence, information regarding treatment line, whether pembrolizumab was used as monotherapy or in combination, and specific treatments (e.g., paclitaxel vs pemetrexed) gives rise to discrete indications. The diagram for all indications is shown in Supplementary Figure 2, including their corresponding randomized clinical trial (KEYNOTE [KN]).
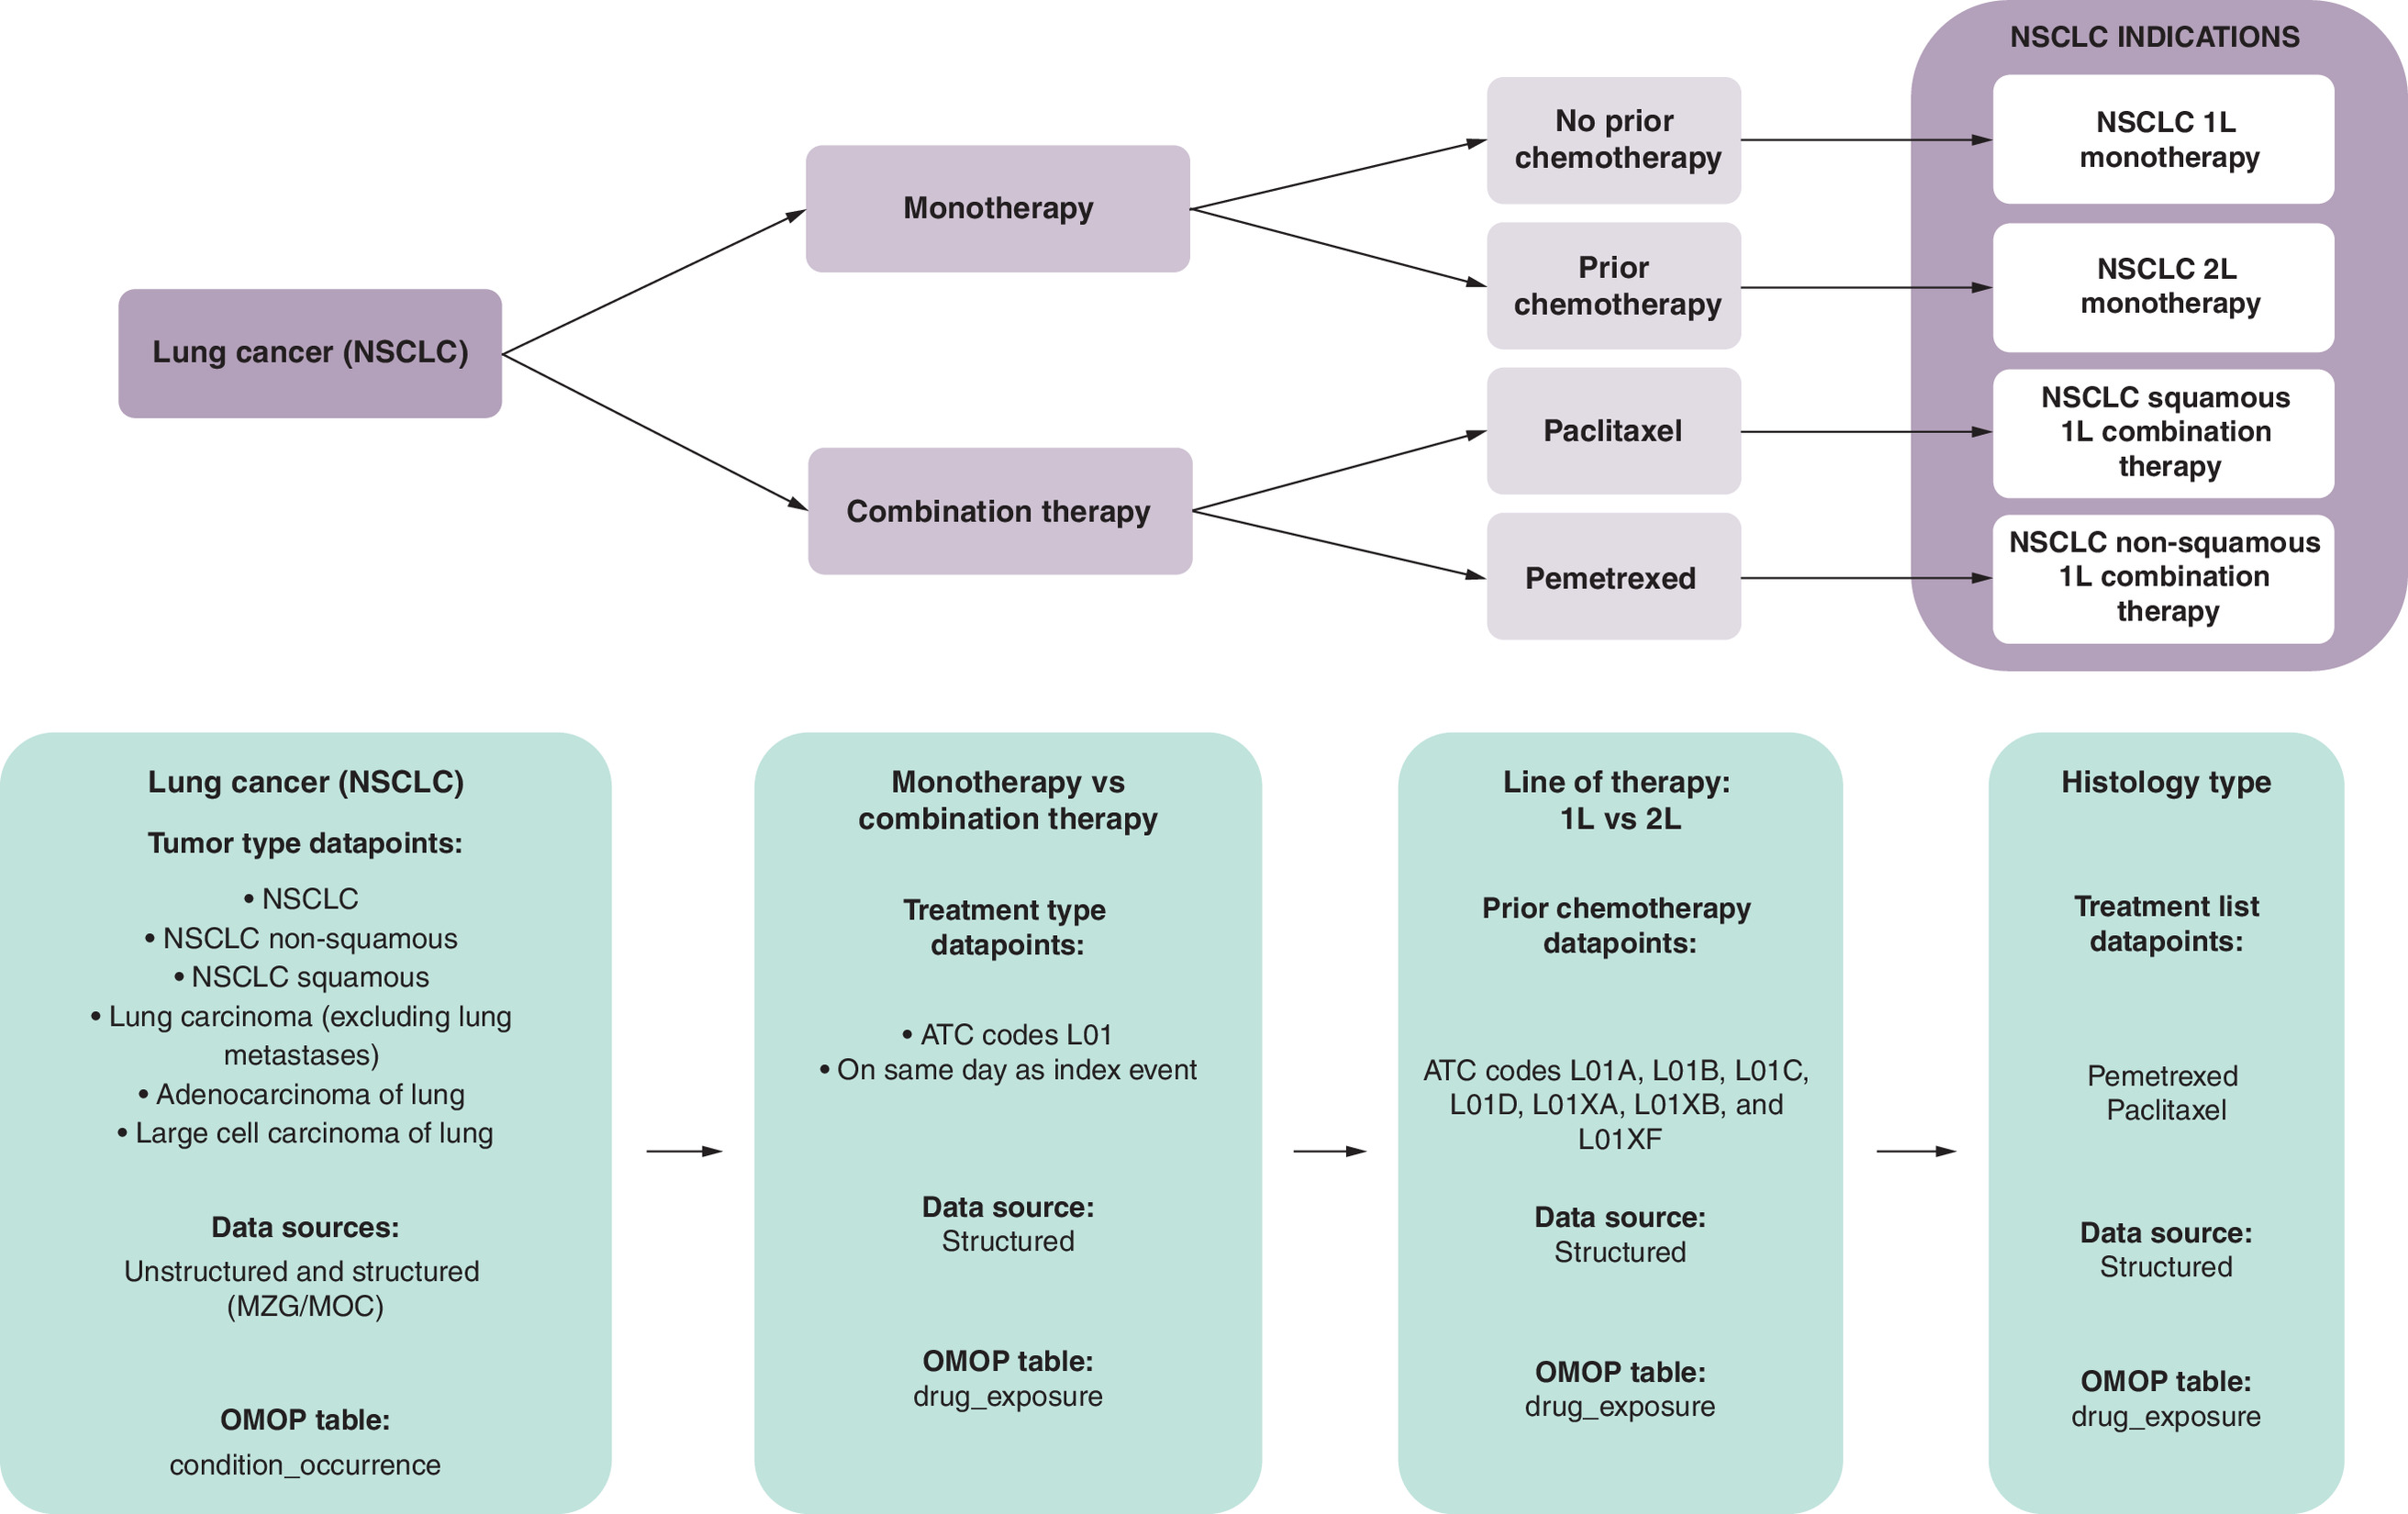
Figure 1. Calculation logic of non-small cell lung cancer indications.
Framework for categorizing NSCLC patients in the OMOP CDM based on tumor type, treatment type (monotherapy vs combination), line of therapy (1L vs 2L) and histology. Sources include both structured and unstructured data, mapped to relevant OMOP tables for consistent analysis.
ATC: Anatomical Therapeutic Chemical classification system; MOC: Multidisciplinary oncology consultation; MZG: Minimale Ziekenhuisgegevens (minimal hospital dataset); NSCLC: Non-small cell lung cancer; OMOP CDM: Observational Medical Outcomes Partnership common data model.
Data sources & datapoint list definition
Supplementary Table 3 provides an overview of datapoints applicable to this study based on the Unified Medical Language System with the Concept Unique Identifier provided per data point. Supplementary Table 4 shows the data dictionary, i.e., the datapoints used to generate each of the variables per objective, including the calculation logic behind them and data source type from which they were derived (structured vs unstructured).
Database generation: data processing & NLP model
The study utilized a previously described NLP pipeline to extract clinically relevant data from unstructured EHR files [1,15], to then map along with structured data to an OMOP CDM. This process is further described in the Supplementary Methods.
Missing data
Differences in data ranges across hospitals can lead to missing data, such as incomplete comorbidity details. Other reasons include incomplete records, absence of data points, or notation issues unrecognized by the algorithm. Among 303 patients, one lacked dosing information, and 35 lacked an initial diagnosis date. Missing data appear in the ‘unknown’ category.
Validation
To optimize scalability, research flexibility and NLP model training, all ingested data pass through the ETL pipeline, with thorough validation being done in a project-specific way. There were four main validation steps performed on the data utilized in this study, in an iterative process whereby issues detected in one step could lead to revalidation of previous steps when indicated. These validation steps were data intake, precision and recall checks and two-step clinical validation. Details can be found in the Supplementary Methods.
Statistical analysis
To analyze the demographics and clinical characteristics, depending on the nature of the variables (continuous vs categorical), the mean, median and standard deviation or absolute number of patients and relative proportions (%) were calculated. Details regarding analysis of specific variables can be found in the Supplementary Methods.
All patients were included in the analyses. However, upon reporting the results of small cells (<5 patients) with multiple clinical datapoints, the exact numbers are masked to protect patient privacy [16].
To maximize transparency and reproducibility, we follow the ESMO GROW guidelines on the reporting of oncology real-world evidence studies [17].
Ethical considerations
The study was conducted in compliance with the principles of the Declaration of Helsinki (version 2013), the principles of GCP, and in accordance with all applicable regulatory requirements. The collection, processing, and disclosure of personal data, such as patient health and medical information, is subject to compliance with applicable personal data protection and the processing of personal data (Directive 95/46/EC and Belgian law of 8 December 1992 on the Protection of the Privacy in relation to the Processing of Personal Data). Patient consent was not required as described in Articles 14.5 and 89 of the current European GDPR. The study was approved by the ethics committees of the participating hospitals.
Results
Performance of the NLP model
The performance of the NLP model in identifying relevant data points for the study was assessed by comparing the algorithm output to a human-generated gold standard using the same free text, as reflected by precision, recall, and F1 score measures (Table 1). Precision was validated through sampling by the provider of the NLP model and by the partaking hospitals, at the level of individual datapoints and through a general sanity check. Recall was validated through sampling of individual datapoints by the provider of the NLP model, and through a general sanity check by the partaking hospitals. All validated data points returned an F1 score ≥0.9.
| Data point | Precision (%) | Precision (n) | Recall (%) | Recall (n) | F1 score |
|---|---|---|---|---|---|
| Cancer stage | 0.98 | 120 | 0.95 | 19 | 0.96 |
| Chronic obstructive pulmonary disease (COPD) | 0.97 | 152 | 1.00 | 75 | 0.99 |
| Diabetes mellitus | 0.93 | 165 | 0.98 | 87 | 0.95 |
| ECOG performance status scale | 0.94 | 50 | 1.00 | 10 | 0.97 |
| Metastatic neoplasm | 0.97 | 195 | 0.99 | 74 | 0.98 |
| Tobacco smoking status | 0.82 | 49 | 1.00 | 27 | 0.90 |
| WHO performance status | 1.00 | 96 | 1.00 | 29 | 1.00 |
Patient cohorts according to dosing schedules
Patients included in the study are shown in Figure 2. A total of 592 patients were detected as having received at least one dose of pembrolizumab, for all approved indications. Of these, 305 patients for which the treatment started after introduction of the alternative ED schedule (Q6W) were included. ED was approved for monotherapy indications on 4 April 2019 and for combination indications on 21 May 2021. Hence, this excluded patients that could not be on the ED pembrolizumab schedule (287 patients excluded due to this criterion). There were two patients exposed to anti-PD1/PD-L1 therapy in the 6 months prior to the index date that were also excluded, leading to a complete study cohort of 303 patients.
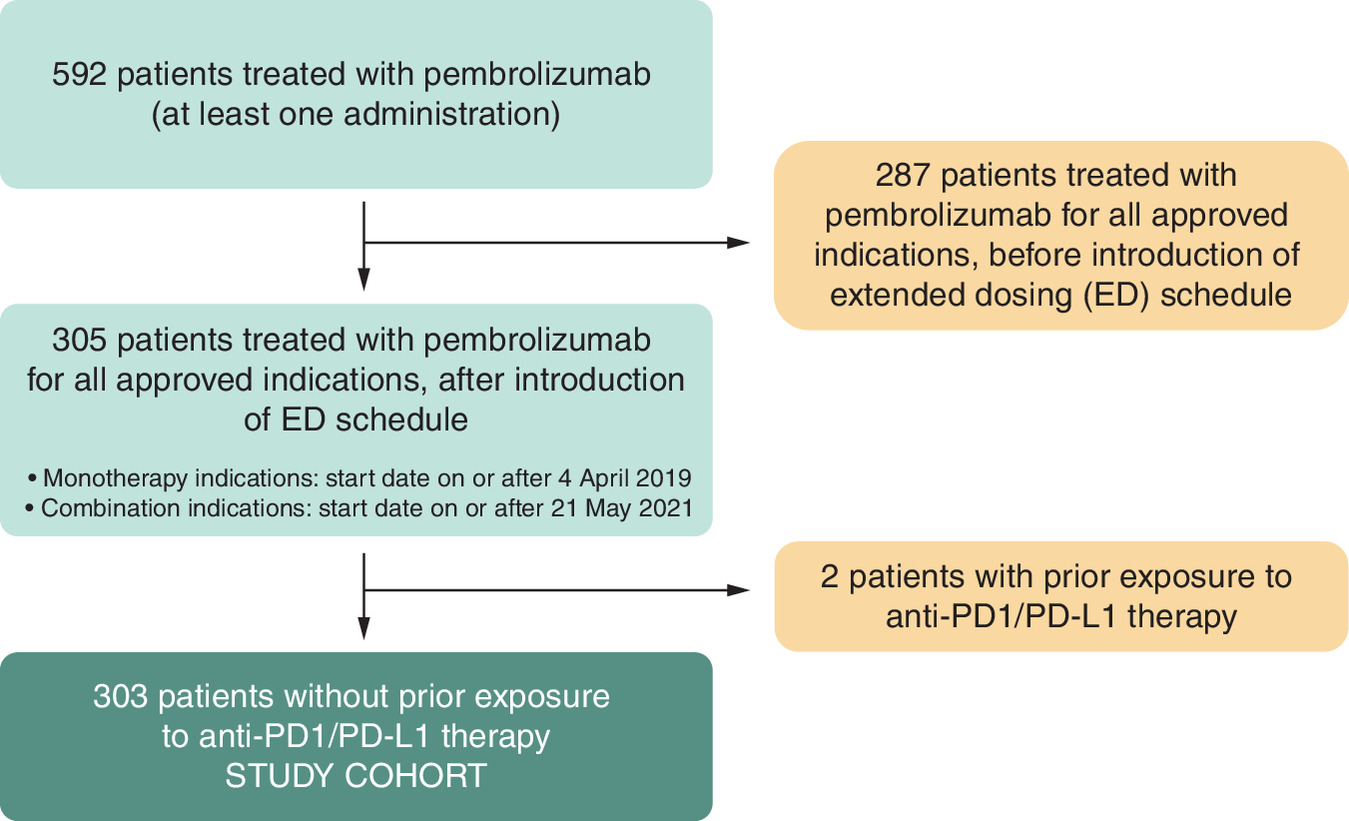
Figure 2. Patient inclusion flowchart.
Flowchart illustrating the selection process for pembrolizumab-treated patients, divided by treatment timing relative to the introduction of the ED schedule. The figure shows separate pathways for patients treated before and after the ED schedule introduction, highlighting those with prior anti-PD1/PD-L1 exposure and defining the final study cohort.
ED: Extended dosing.
Figure 3 shows patients grouped according to their pembrolizumab dosing schedules. Of the total 303 patients of the study cohort, those whose first detected pembrolizumab treatment was 200 mg were included in the ‘SD initiators’ group (n = 280) and those for whom it was 400 mg were ascribed to the ‘ED initiators’ group (n = 22). One patient had no available dosing information. SD initiators without any switches regarding dosing schedules were termed ‘SD only’ (n = 241), whereas patients switching from the SD to the ED regimen were labeled ‘SD to ED and stay’ (n = 31). There were eight patients for which pembrolizumab dosing schedules were switched more than once (‘start SD more than 1 switch’). All ‘ED initiators’ (n = 22) remained on the ED schedule.
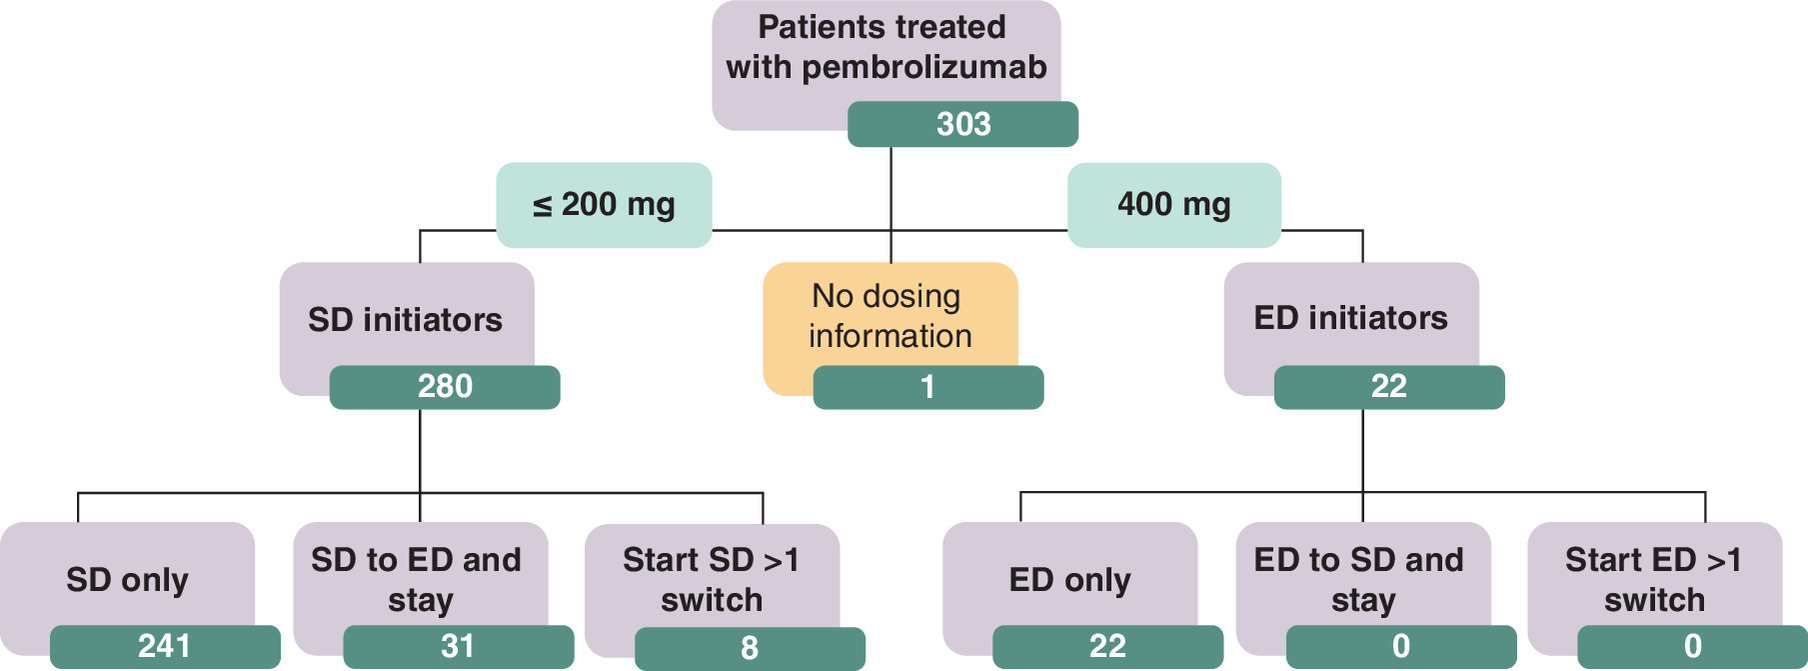
Figure 3. Patient grouping according to pembrolizumab dosing schedules.
Flowchart showing the classification of pembrolizumab-treated patients based on initial dosing. Patients are categorized into those initiating at SD or ED and further grouped by dosing patterns, including SD-only, SD to ED, ED-only, and switching patterns. One patient had missing dosing information.
ED: Extended dosing; SD: Standard dosing.
Patient demographics & clinical characteristics
Patient demographics and clinical characteristics for the overall population and by pembrolizumab dosing schedule groups are shown in Table 2. Median (min, max) age was 69 (27, 93) years for the overall cohort and ‘SD only’ group, 65 (55, 90) years for the ‘SD to ED and stay’ group and 74 (42, 81) years for the ‘start SD more than 1 switch’ group. The overall cohort was predominantly male (71%) and more than half (54%) presented comorbid cardiovascular disease. Median (min, max) time from diagnosis to treatment initiation was 3 (0, 176) months for the overall and “SD only” groups, 13 (3, 147) months for the ‘ED only’ group, 2 (0.4, 89) months for the ‘SD to ED and stay’ group, and 8 (1, 77) months for the ‘start SD more than 1 switch’ group. Of those patients with detectable Performance Status, most had a value of 1 (32%), though a value for this variable was not detected in 42% of patients.
| Overall | SD only | ED only | SD to ED and stay | Start SD more than 1 switch | |
|---|---|---|---|---|---|
| Patients, n | 303 | 241 | 22 | 31 | 8 |
| Age (years) | |||||
| Mean (StdDev) | 68 (10) | 68 (10) | 68 (12) | 68 (10) | 71 (12) |
| Median (min, max) | 69 (27, 93) | 69 (27, 93) | 69 (41, 88) | 65 (55, 90) | 74 (42, 81) |
| Male sex, n (%) | 214 (71) | 168 (70) | 16 (73) | 23 (74) | 6 (75) |
| Smoking history, n (%) | |||||
| Ex-smoker | 73 (24) | 54 (22) | 5 (23) | 10 (32) | <5 |
| Non-smoker | 52 (17) | 45 (19) | <5 | <5 | <5 |
| Smoker | 113 (37) | 89 (37) | 8 (36) | 13 (42) | <5 |
| Unknown | 65 (21) | 53 (22) | 7 (32) | <5 | <5 |
| Comorbidities, n (%) | |||||
| Cardiovascular disease | 164 (54) | 127 (53) | 13 (59) | 19 (61) | 5 (63) |
| COPD | 90 (30) | 74 (31) | <5 | 9 (29) | <5 |
| Auto-immune disease | 17 (6) | 15 (6) | <5 | <5 | <5 |
| Diabetes | 53 (17) | 43 (18) | <5 | <5 | <5 |
| Performance status, n (%) | |||||
| 0 | 33 (11) | 24 (10) | <5 | 5 (16) | |
| 1 | 97 (32) | 71 (29) | 11 (50) | 12 (39) | <5 |
| 2+ | 46 (15) | 37 (15) | <5 | 5 (16) | <5 |
| Unknown | 127 (42) | 109 (45) | <5 | 9 (29) | <5 |
| Cancer type, n (%) | |||||
| NSCLC | 169 (56) | 140 (58) | <5 | 23 (74) | <5 |
| Non-squamous | 123/169 (73) | 100/140 (71) | <5 | 20/23 (87) | <5 |
| Squamous | 33/169 (20) | 28/140 (20) | <5 | <5 | |
| Unknown | 13/169 (8) | 12/140 (9) | <5 | ||
| Urothelial cancer | 56 (18) | 35 (15) | 17 (77) | <5 | <5 |
| Head and neck cancer | 40 (13) | 37 (15) | <5 | <5 | |
| Melanoma | 17 (6) | 13 (5) | <5 | <5 | |
| Colorectal cancer | 8 (3) | 6 (2) | <5 | <5 | |
| Renal cell carcinoma | 8 (3) | 8 (3) | |||
| Other† | <5 | <5 | <5 | ||
| Tumor staging, n (%) | |||||
| Stage IV | 282 (93) | 221 (92) | 22 (100) | 30 (97) | 8 (100) |
| Stage non-IV | 11 (4) | 11 (5) | |||
| Stage unknown | 10 (3) | 9 (4) | <5 | ||
| Treatment line, n (%) | |||||
| 1L | 239 (79) | 197 (82) | 9 (41) | 29 (94) | <5 |
| 2L+ | 44 (15) | 29 (12) | 13 (59) | <5 | |
| Treatment type, n (%) | |||||
| Monotherapy | 219 (72) | 168 (70) | 22 (100) | 21 (68) | <10 (>87) |
| Combination treatment | 84 (28) | 73 (30) | 10 (32) | <5 (<13) | |
| Time from diagnosis to treatment initiation, months | |||||
| Mean (StdDev) | 13 (23) | 11 (21) | 30 (39) | 11 (20) | 23 (30) |
| Median (min, max) | 3 (0, 176) | 3 (0, 176) | 13 (3, 147) | 2 (0.4, 89) | 8 (1, 77) |
†
‘Other’ includes esophageal cancer and classic Hodkin’s lymphoma. Percentages are calculated using the total number of patients in each column (first row: ‘Patients, n’), unless otherwise specified. For NSCLC subtypes, percentages are calculated using the number of NSCLC patients in each column. Counts <5 are masked for privacy reasons; percentages correspond to the column denominator.
COPD: Chronic obstructive pulmonary disease; ED: Extended dosing; NSCLC: Non-small cell lung carcinoma; SD: Standard dosing; StdDev: Standard deviation.
The most common cancer type overall was lung cancer (56%), of which most were non-squamous NSCLC (73% of NSCLC patients), followed by urothelial cancer (18%), head and neck cancer (13%) and melanoma (6%). When focusing on pembrolizumab dosing schedules, the ‘SD only’ and ‘SD to ED and stay’ groups were predominantly lung cancer patients (58% and 74%, respectively), whereas the ‘ED only’ group was mostly urothelial cancer patients (77%). Patients were mostly diagnosed as stage IV for the treated cancers (93% in the overall cohort). Regarding treatment line, most patients were in 1L pembrolizumab therapy (79% overall group, 82% ‘SD only’ group, >87% ‘SD to ED and stay’ group), though the ‘ED only’ group showed more patients in 2L+ therapy (59%). All groups showed predominance of pembrolizumab monotherapy versus combination therapy, including the ‘ED only’ group, which was comprised fully of patients in monotherapy.
Pembrolizumab dosing cohort schedules & switches
The mean (StdDev) gap between administrations was 23 (7) days for SD and 43 (5) days for ED. The mean (StdDev) number of administrations was 9 (10) for SD and 4 (4) for ED. For patients that switched from the SD to the ED schedule, the mean (StdDev) time from treatment initiation to treatment switch was 174 (85) days. Given the cohort definitions, the SD to ED group includes only patients remaining on treatment until switching, whereas the SD only group includes all patients initiating SD, regardless of treatment duration.
The flow of patients regarding pembrolizumab dosing schedules is shown in Figure 4. Of all the patients with dosing information (n = 302), 196 patients were SD initiators on monotherapy, 84 were SD initiators on combination therapy and 22 were ED initiators, all of whom were on monotherapy. Of the SD initiators, most (n = 241) stayed on the SD regimen, whereas 31 switched to ED and stayed on that dosing schedule and eight patients had more than one dosing schedule switch. All ED initiators stayed on that dosing schedule (Figure 4A).
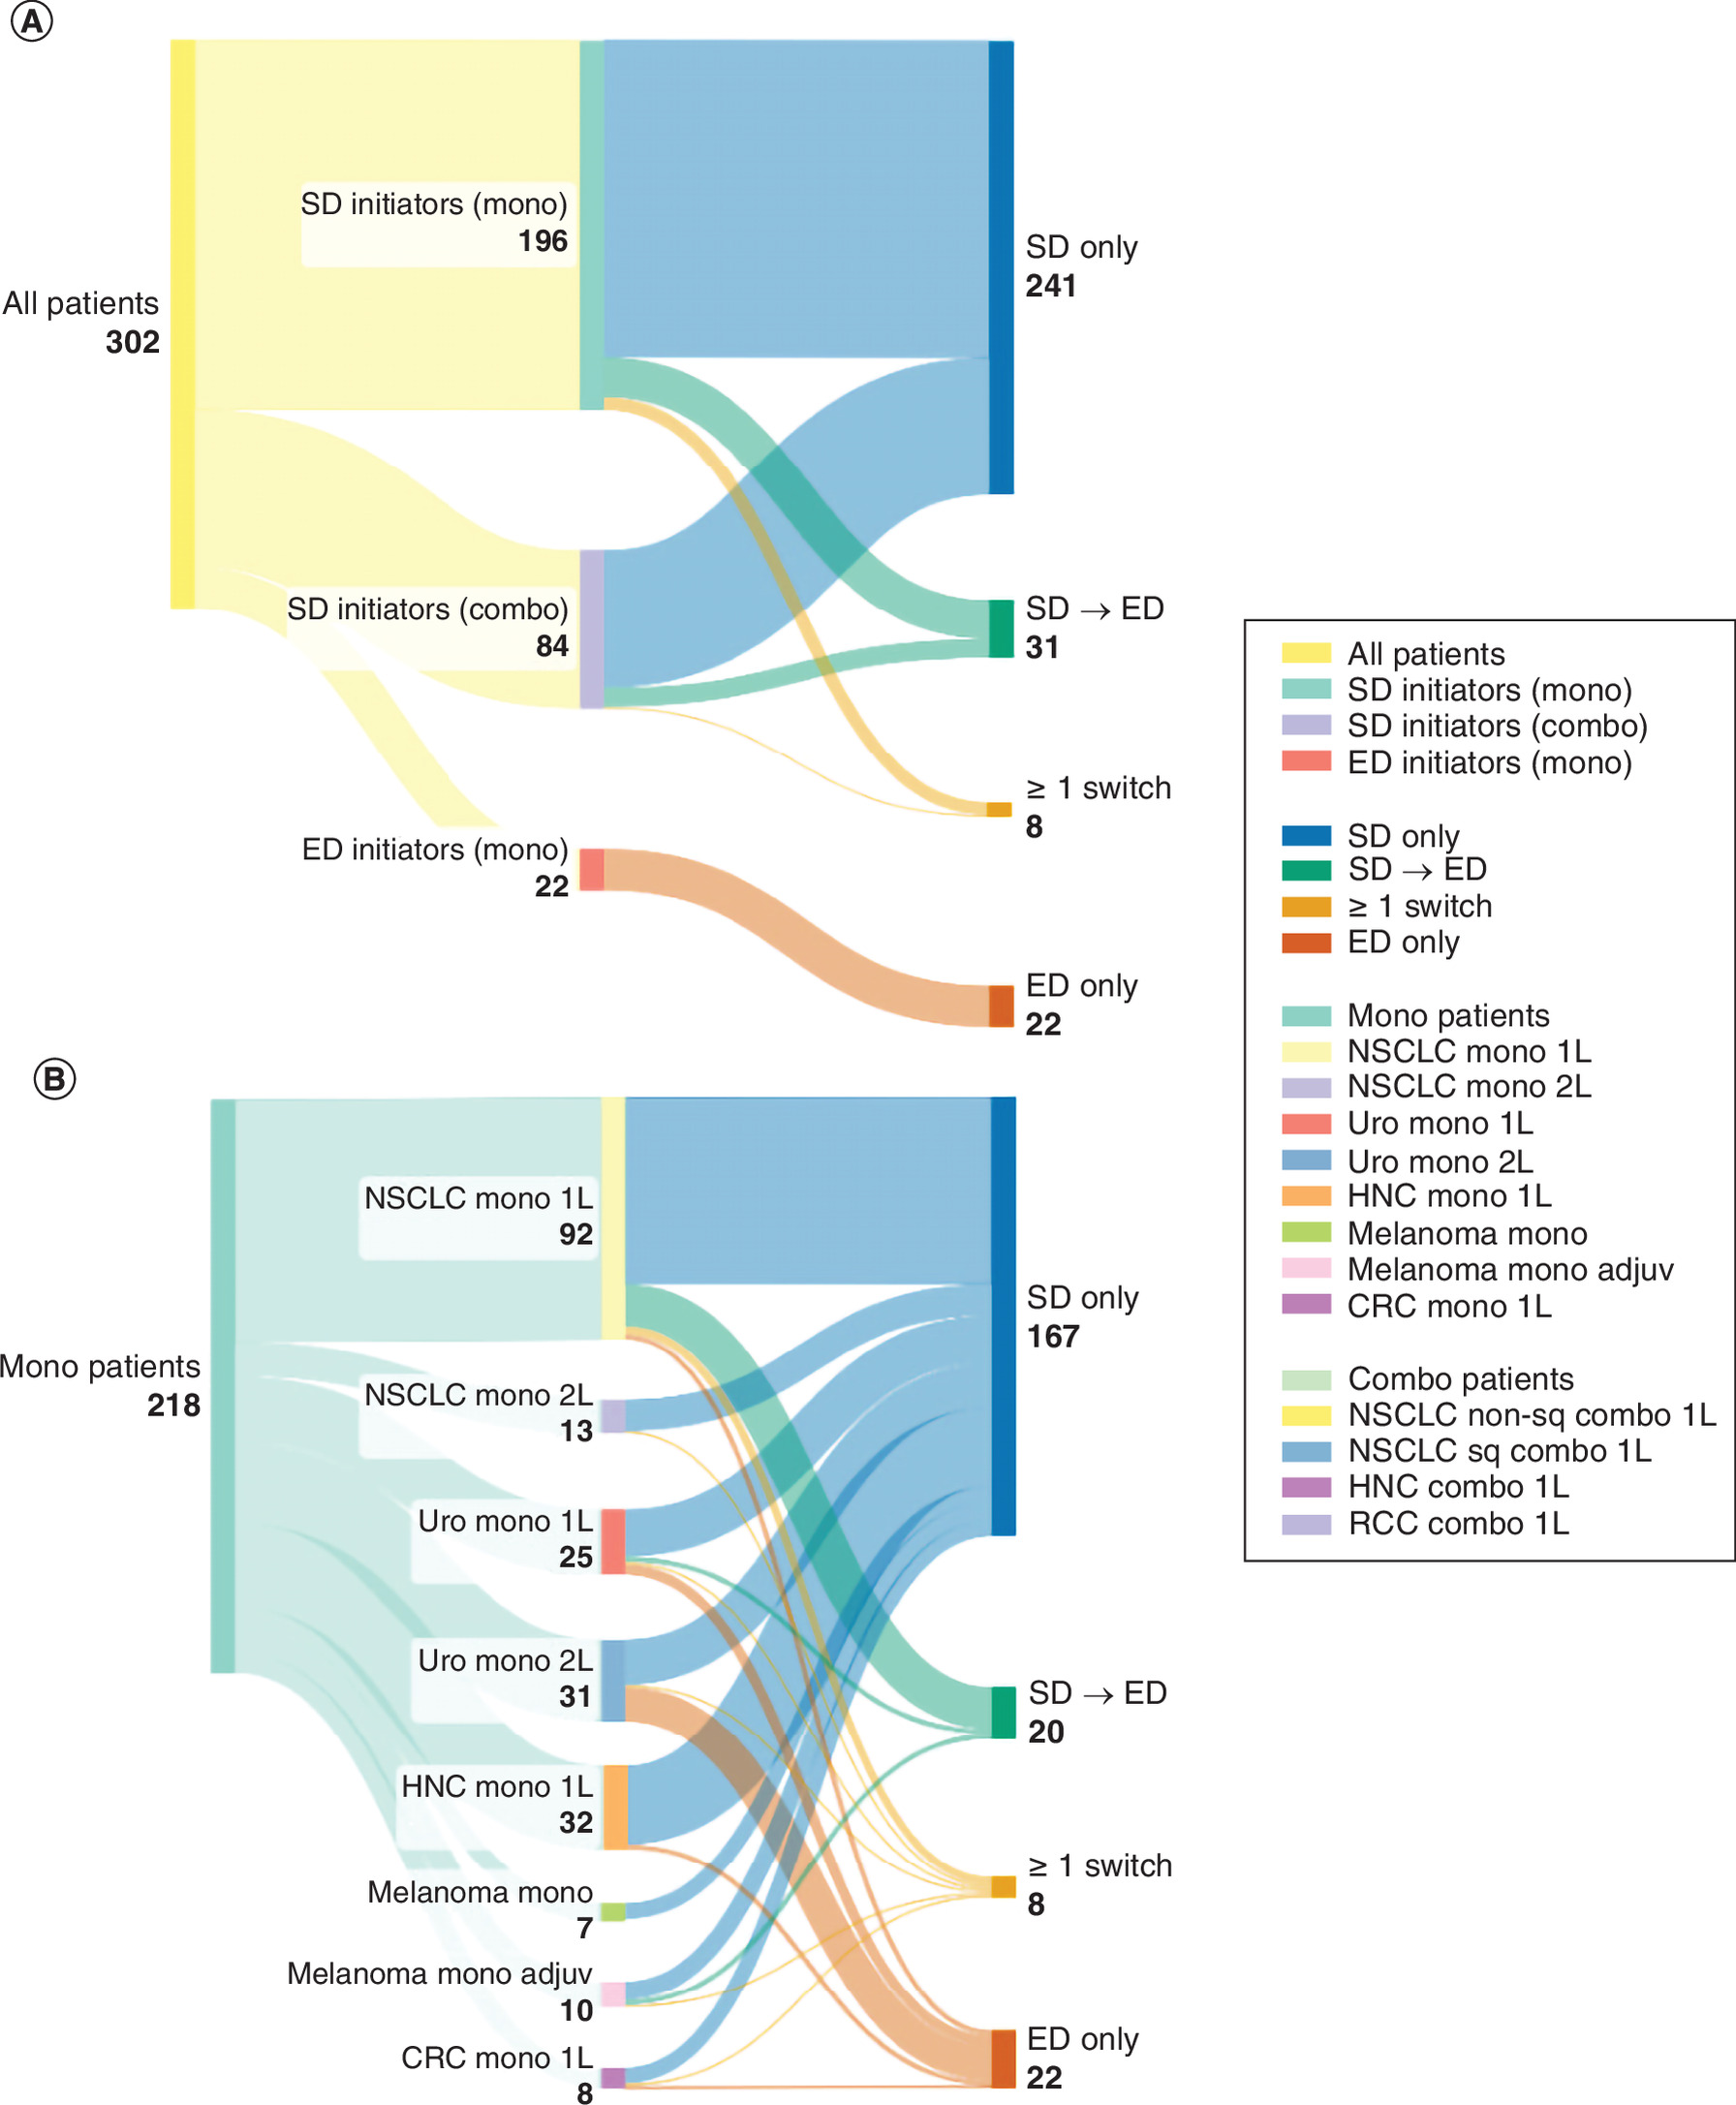
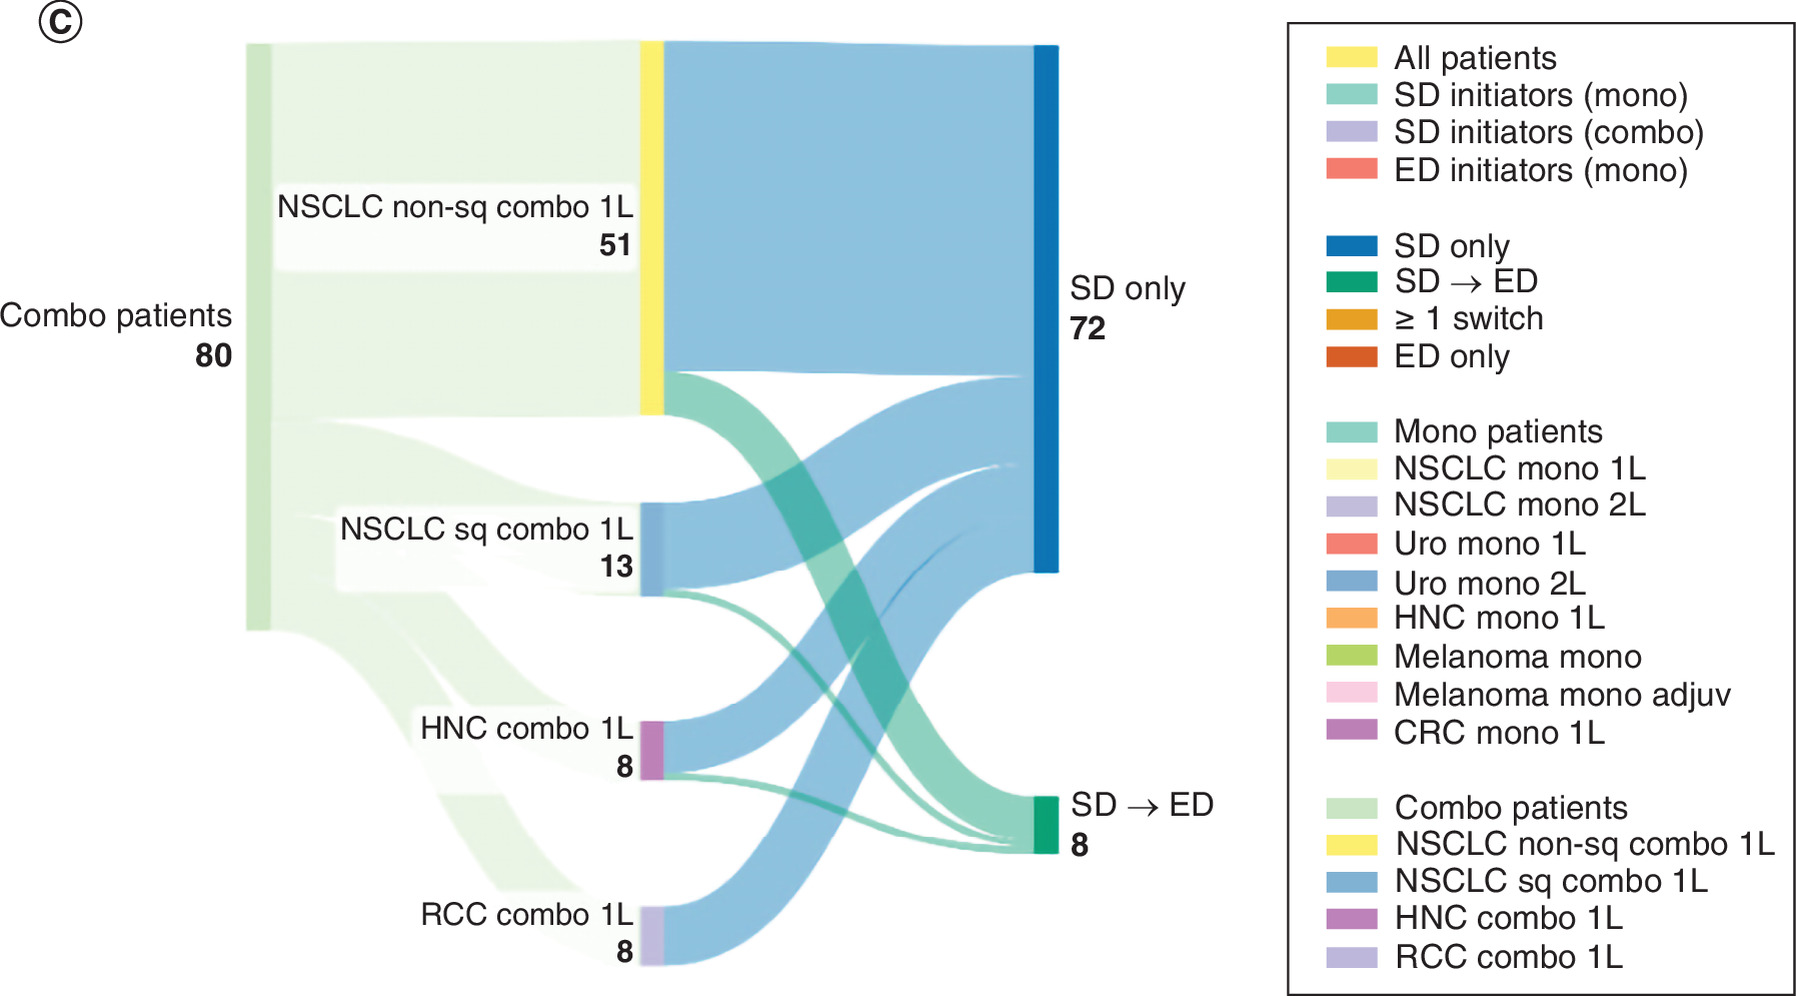
Figure 4. Sankey diagrams illustrating pembrolizumab dosing patterns across patient groups.
(A) All patients categorized by initial dosing schedule (SD or ED) and subsequent dosing changes, showing pathways for SD-only, switching to ED, and staying on ED. (B) Monotherapy patients (‘mono’) further divided by cancer type and line of therapy. (C) Combination therapy patients (‘combo’) by cancer type and line of therapy, with pathways for SD-only and switches to ED. The legend shows the colors used for each node in the diagram.
CRC: Colorectal cancer; ED: Extended dosing; HNC: Head and neck cancer; non-sq: Non-squamous; NSCLC: Non-small cell lung cancer; RCC: Renal cell carcinoma; SD: Standard dosing; sq: Squamous; Uro: Urothelial cancer.
Patient flow among dosing schedules is also shown according to the indication split for patients on pembrolizumab as monotherapy (Figure 4B) and as a combination therapy (Figure 4C). Among the monotherapy group (n = 218), the most common indication was NSCLC in first treatment line (‘1L’; n = 92), followed by head and neck cancer in 1L (n = 32) and urothelial cancer in 2L+ (n = 31) and in 1L (n = 25). Most patients in monotherapy that switched from the SD to the ED schedule were NSCLC 1L patients, whereas those on ED only were mostly urothelial cancer 2L+ patients (Figure 4B). In the case of pembrolizumab as a combination treatment (n = 80), all patients were treated in 1L and the indications were non-squamous NSCLC (n = 51), squamous NSCLC (n = 13), head and neck cancer (n = 8) or renal cell carcinoma (n = 8). Most patients switching from SD to ED had non-squamous NSCLC (Figure 4C).
Pembrolizumab dosing preferences in periods before & during COVID-19
Pembrolizumab dosing schedules and switches for patients on monotherapy were assessed for pre-COVID-19 (between 4 April 2019 and 31 December 2019) and COVID-19 periods (between 18 March 2020 and 31 December 2021), as shown in Supplementary Table 5.
Discussion
With this study, we present a use case of a Belgian hospital consortium that was enabled to build federated OMOP CDM data warehouses from its structured and unstructured oncology data, through the EHDEN project. By combining the mapping of bulk data with project-specific validation and analytics, this approach promises to be both scalable and flexible to answer complex ad hoc clinical questions. This approach is new to the hospitals and brought several challenges with their lessons learned. The most striking was the need for a multidisciplinary team in the hospitals, constituting of an oncology expert, member of IT and data manager, to identify and prepare the relevant data sources, and perform technical and clinical validation. On the analytics side as well, there was a need for intensive interaction between data scientists and clinicians, to develop reliable data dictionaries and validate the results. As these profiles often speak a ‘different’ language, discussion, documentation and transparency proved key. These efforts have laid the basis for further studies, and as a result, we can now present an elaborate and fully transparent methodology, data dictionary and comments on limitations. This way, we strive to maximize reproducibility and offer value to the community.
In terms of novelty of our findings, this study is the first real-world study on pembrolizumab extended dosing schedules that offers insights into such a broad range of patient features [11,18–21], and the first to use such an innovative approach (others used existing claims databases, prospective registries, surveys or record review) [11,18–21]. In the studied population of four Belgian hospitals, the majority of patients (80%) started on the classical SD schedule and stayed. Most patients who received ED did so after an initial period of SD (58%), which makes sense as this can be a period when they receive triweekly combination therapies or are not yet deemed ‘clinically stable’ by their treating physician. All patients who started ED did so in monotherapy. RwTOT and rwTTNT were lengthy (median 666 days to not reached) in the ‘SD to ED’ cohort of NSCLC 1L, though these observations should be interpreted in the context of the selection and immortal time biases inherent to this comparison. ED schedules have been shown to offer increased convenience and flexibility for patients undergoing long-term therapy or facing ambulatory limitations, especially those traveling long distances to cancer care centers [5]. Importantly, this approach has the potential to reduce healthcare costs and administrative burdens, impacting patient scheduling, medical and pharmacy staffing, as well as infusion supplies and dose preparation time [5]. The potential benefits of an ED interval for pembrolizumab have been assessed in studies based on surveys completed by oncologists, oncology nurses, and melanoma patients to obtain insights into the infusion process, bringing to light the significant time savings associated with less frequent dosing [20]. The reduction in the number of infusion visits and associated chair time, as well as the potential for improved patient satisfaction, reduced travel, and exposure time, emphasizes the efficiency and cost-effectiveness of ED schedules [20]. Our results showing that patients on ED schedules received approximately half as many pembrolizumab administrations as those in SD schedules underscore that, in fact, patients undergoing ED in the real-world setting spend less chair time at infusion centers and also reduced travel and exposure time.
From a clinical perspective, a recent retrospective study in the US addressed the comparative effectiveness of SD versus ED of pembrolizumab through time-to-treatment discontinuation [22]. They found near-equivalent effectiveness in more than 800 veterans who began single-agent pembrolizumab after FDA approval of the ED schedule, though the cohort was heavily skewed toward males (96.9%) [22]. Another retrospective, multicenter study focusing on safety, particularly immune-related adverse events (irAEs), compared SD to ED for pembrolizumab and nivolumab [18]. The study found a lower probability of any grade irAEs with the switch to ED, though this trend was not apparent for high-grade (G3 or G4) irAEs. However, they do emphasize that patients that switched to ED had already survived and tolerated immune checkpoint inhibitor treatment well enough with common dosing to transition to ED. This bias toward patients with more favorable prognosis in the ED versus SD schedule group is found in our study, as well.
A study focusing on non-small cell lung cancer (NSCLC) patients in Canada found no overall survival (OS) difference between pembrolizumab administered every 3 weeks (SD) or every 6 weeks (ED) [19]. Comparable safety and efficacy of SD versus ED schedules for pembrolizumab were also reported in a retrospective analysis of patient cohorts (200 approx.) in the Netherlands [23]. In fact, there is a recent study that portrays a higher proportion of patients alive in the ED group compared with SD for pembrolizumab at 6, 12 months, and data cutoff [21]. However, as the authors themselves point out, it is essential to note potential biases, such as selection bias and immortal time bias, especially considering the study's small sample size and differences in baseline characteristics between the SD and extended dosing groups [21].
The study period coincided with the COVID-19 pandemic, potentially influencing dosing schedule trends and resource availability in cancer care centers during pandemic surges, though when splitting our dataset into pre- versus COVID-19 periods we did not observe major differences in dosing schedule trends (Supplementary Table 5). This contrasts with the expectation that ED may have increased during the pandemic to reduce hospital visits. Instead, the stable patterns observed suggest that transitions to ED were primarily driven by clinical considerations, supporting the feasibility of this approach in routine practice.
Limitations
The recall of comorbidities (Table 2) is uncertain, which means that some patients have undetected co-morbidities that are not reported as ‘missing data’. This is inherent to the use of raw hospital data, and we strive to offer maximal transparency through the data dictionary (Supplementary Table 4). For example, ‘cardiovascular disease’ is derived only from structured hospitalization reports, and does not include information from free-text medical history or medication, which may lead to an underestimation of the true comorbidity burden. ‘Auto-immune disease’ is detected largely through NLP, but it is impossible to verify the recall of rare diseases and challenging to train the NLP to detect these, although a sanity check confirmed expected frequencies of auto-immune diseases, including rare diseases. Data sources containing comorbidities were heterogeneous between the hospitals. In addition, the presence of ‘unknown’ categories for variables such as smoking status and performance status reflects incomplete data capture in routine clinical practice and may influence the observed distributions, particularly if missingness is not random. For example, certain clinical features may be more consistently documented when abnormal, which could introduce imbalances in the recorded proportions.
Results must be interpreted taking into account that this study was performed across a multitude of indications, each of which can have dosing schedules that are more commonly used. In compliance with small cell masking, though we did detect more indications than those shown throughout this work, groups with reduced numbers (n <5) were left out. Therefore, the weight of each indication in each dosing schedule group may differ, as noted for the ‘ED only’ group, made up mostly of urothelial cancer patients (Table 2). The same effect can influence patient distribution per treatment line and types (1L vs 2L+ and monotherapy vs combination treatment, Figure 2).
Formal comparisons of outcomes on different dosing schedules are not possible, because missing data and clinical case selection may lead to differences in patient populations. For example, clinicians tend to prefer ED intervals for patients with more favorable prognosis [19]. In addition, selection bias should be considered: patients contributing to the SD to ED cohort are, by definition, those remaining on treatment up to the time of switching, implying a period of sustained treatment exposure consistent with clinical stability and tolerance. In contrast, the SD only cohort includes patients with shorter observed treatment durations, regardless of the underlying reason (e.g., toxicity). Therefore we offer strictly descriptive statistics.
Conclusion
The real-world use of pembrolizumab dosing schedules could be reliably assessed through a scalable and flexible ETL pipeline that delivers OMOP CDM data warehouses based on structured and unstructured hospital data, in combination with the development of a project-specific data dictionary and clinical validation. Using this framework, we described real-world pembrolizumab dosing patterns across four Belgian hospitals. In this population, the majority of patients started on the classical SD schedule and stayed. Most patients who received ED did so after an initial period of SD (174 ± 85 days), whereas all patients who started ED did so in monotherapy. Because schedule choice was strongly linked to tumor type, we did not compare clinical outcomes across schedules. Observed differences in treatment duration should be interpreted in the context of selection and immortal time bias. The observed step-down pattern to ED supports its logistical feasibility and suggests potential gains in patient convenience and healthcare resource efficiency.
Summary points
•
This study describes real-world utilization of pembrolizumab dosing schedules using routinely collected data from four Belgian hospitals.
•
Both structured data and clinical notes were integrated using a common data model and natural language processing.
•
A total of 303 patients were included, of whom 56% had non-small cell lung cancer and 72% received monotherapy.
•
Most patients initiated treatment with standard dosing (SD) (every 3 weeks), with 89% starting on this schedule.
•
Extended dosing (every 6 weeks) was primarily used after an initial period of SD.
•
Patients receiving extended dosing had longer intervals between administrations compared with SD (43 vs 23 days).
•
In first-line non-small cell lung cancer, longer treatment duration was observed in patients transitioning from standard to extended dosing compared with those remaining on SD.
•
These differences should be interpreted with caution due to selection and immortal time bias.
•
Dosing patterns remained stable over time, including during the COVID-19 pandemic.
•
The findings support the feasibility of extended dosing in routine clinical practice and highlight its potential to reduce treatment burden.
Acknowledgments
University Hospital Antwerp, AZ Maria Middelares and AZ Groeninge have all received an EHDEN data partner grant, to enable the development of clinical data warehouses. They want to acknowledge Geert Hellebaut and Elyne Scheurwegs (University Hospital Antwerp), Nicky Van Der Vekens and Lieselot Croes (AZ Maria Middelares) and Lieselot Cool and Emma Callewaert (AZ Groeninge) for data preparation and technical validation.
Financial disclosure
This study was funded by MSD Belgium. The funder was involved in the study design, data analysis, interpretation of the results, and preparation of the manuscript. The NLP provider (LynxCare, Belgium) contributed to data processing, validation, and analysis, and participated in manuscript development.
Competing interests disclosure
The authors have no competing interests or relevant affiliations with any organization or entity with the subject matter or materials discussed in the manuscript. This includes employment, consultancies, honoraria, stock ownership or options, expert testimony, grants or patents received or pending, or royalties.
Writing disclosure
No funded writing assistance was utilized in the production of this manuscript.
Ethical conduct of research
The study was conducted in compliance with the principles of the Declaration of Helsinki (version 2013), the principles of GCP, and in accordance with all applicable regulatory requirements. The collection, processing, and disclosure of personal data, such as patient health and medical information, is subject to compliance with applicable personal data protection and the processing of personal data (Directive 95/46/EC and Belgian law of 8 December 1992 on the Protection of the Privacy in relation to the Processing of Personal Data). Patient consent was not required as described in Articles 14.5 and 89 of the current European GDPR. The study was approved by the ethics committees of the participating hospitals.
Open access
This work is licensed under the Creative Commons Attribution 4.0 License. To view a copy of this license, visit https://creativecommons.org/licenses/by/4.0/
Supplementary Material
File (supplementary materials.docx)
References
1.
Hens D, Wyers L, Claeys KG. Validation of an artificial intelligence driven framework to automatically detect red flag symptoms in screening for rare diseases in electronic health records: hereditary transthyretin amyloidosis polyneuropathy as a key example. J. Peripher. Nerv. Syst. 28(1), 79–85 (2023).
2.
Moya A, Oeste CL, Beles M et al. Detection of transthyretin amyloid cardiomyopathy by automated data extraction from electronic health records. ESC Heart Fail. 10(6), 3483–3492 (2023).
3.
Beles M, Masuy I, Verstreken S et al. Cardio-renal-metabolic syndrome: clinical features and dapagliflozin eligibility in a real-world heart failure cohort. ESC Heart Fail. 10(4), 2269–2280 (2023).
4.
European Union. Regulation (EU) 2016/679 of the European Parliament and of the Council of 27 April 2016 on the protection of natural persons with regard to the processing of personal data and on the free movement of such data, and repealing Directive 95/46/EC (General Data Protection Regulation). Official Journal of the European Union, 1–88 (2016). https://eur-lex.europa.eu/eli/reg/2016/679/oj/eng
5.
European Health Data and Evidence Network. (Accessed 5 April 2024). https://www.ehden.eu/
6.
Hripcsak G, Duke JD, Shah NH et al. Observational Health Data Sciences and Informatics (OHDSI): Opportunities for Observational Researchers. Stud Health Technol Inform. 216, 574–578 (2015).
7.
MSD. KEYTRUDA® (pembrolizumab) injection, for intravenous use. Prescribing Information, revised: 11/2023. (2023). (Accessed 12 December 2023). https://www.merck.com/product/usa/pi_circulars/k/keytruda/keytruda_pi.pdf
8.
MSD. European Medicines Agency adopts positive opinion for Merck's KEYTRUDA® (pembrolizumab) for six-week dosing schedule across all current monotherapy indications. (2019). (Accessed 12 December 2023). https://www.merck.com/news/european-medicines-agency-adopts-positive-opinion-for-mercks-keytruda-pembrolizumab-for-six-week-dosing-schedule-across-all-current-monotherapy-indications/
9.
EMA. European Public Assessment Report (EPAR): keytruda. (2023). (Accessed 12 December 2023). https://www.ema.europa.eu/en/medicines/human/EPAR/keytruda
10.
FDA. FDA approves new dosing regimen for pembrolizumab. (2020). (Accessed 12 December 2023). https://www.fda.gov/drugs/resources-information-approved-drugs/fda-approves-new-dosing-regimen-pembrolizumab
11.
Lala M, Li TR, de Alwis DP et al. A six-weekly dosing schedule for pembrolizumab in patients with cancer based on evaluation using modelling and simulation. Eur. J. Cancer 131, 68–75 (2020).
12.
MSD. A Phase Irandomized clinical study of pembrolizumab (MK-3475) to evaluate the relative bioavailability of subcutaneous injection versus intravenous infusion in participants with advanced melanoma (KEYNOTE-555). (2023). (Accessed 12 December 2023). https://clinicaltrials.gov/study/NCT03665597
13.
Lala M, Akala O, Chartash E et al. Abstract CT042: pembrolizumab 400 mg Q6W dosing: first clinical outcomes data from keynote-555 cohort B in metastatic melanoma patients. Cancer Res. 80(Suppl. 16), CT042 (2020).
14.
Sehgal K, Costa DB, Rangachari D. Extended-interval dosing strategy of immune checkpoint inhibitors in lung cancer: will it outlast the COVID-19 pandemic? Front. Oncol. 10, 1193 (2020).
15.
Van de Meulebroucke C, Beckers J, Corten K. What Can we expect following anterior total hip arthroplasty on a regular operating table? A validation study of an artificial intelligence algorithm to monitor adverse events in a high-volume, nonacademic setting. J. Arthroplasty 34(10), 2260–2266 (2019).
16.
Cox LH. Suppression methodology and statistical disclosure control. J. Am. Stat. Assoc. 75(370), 377–385 (1980).
17.
Castelo-Branco L, Pellat A, Martins-Branco D et al. ESMO Guidance for Reporting Oncology real-World evidence (GROW). Ann. Oncol. 34(12), 1097–1112 (2023).
18.
Cantini L, Paoloni F, Pecci F et al. Safety of extended interval dosing immune checkpoint inhibitors: a multicenter cohort study. J. Natl Cancer Inst. 115(7), 796–804 (2023).
19.
Jones L, Rittberg R, Leung B et al. Alternate pembrolizumab dosing interval in advanced NSCLC with PD-L1 TPS ≥50%: 3 weekly compared to 6 weekly dosing. Curr Oncol. 29(11), 8686–8692 (2022).
20.
Aguiar-Ibáñez R, Scherrer E, Grebennik D et al. Time and productivity loss associated with immunotherapy infusions for the treatment of melanoma in the United States: a survey of health care professionals and patients. BMC Health Serv. Res. 23(1), 136 (2023).
21.
Moffat GT, Hanna L, Hopman W, Fung AS, Gaudreau PO. An assessment of extended pembrolizumab dosing in advanced non-small-cell lung cancer in the COVID-19 pandemic. Immunotherapy 15(12), 921–932 (2023).
22.
Strohbehn GW, Holleman R, Burns J et al. Adoption of extended-interval dosing of single-agent pembrolizumab and comparative effectiveness vs standard dosing in time-to-treatment discontinuation. JAMA Oncol. 8(11), 1663–1667 (2022).
23.
Hijmering-Kappelle LBM, Hiltermann TJN, Bensch F. Safety and efficacy of extended interval dosing for immune checkpoint inhibitors in non-small cell lung cancer during the COVID-19 pandemic. Clin. Lung Cancer 23(2), 143–150 (2022).
Information & Authors
Information
Published In
Copyright
© 2026 The authors. This work is licensed under the Creative Commons Attribution 4.0 License
History
Received: 16 January 2026
Accepted: 27 July 2026
Published online: 21 October 2026
Keywords:
Topics
Authors
Metrics & Citations
Metrics
Article Usage
Article usage data only available from February 2023. Historical article usage data, showing the number of article downloads, is available upon request.
Citations
How to Cite
Real-world utilization of pembrolizumab dosing schedules in Belgium: a multi-center retrospective study using a common data model and natural language processing. (2026) Journal of Comparative Effectiveness Research. DOI: 10.57264/cer-2026-0011
Export citation
Select the citation format you wish to export for this article or chapter.