

On the economics of broadly neutralizing monoclonal antibodies for HIV prevention in high-income countries
Abstract
Aim: To quantify the market opportunity and economic impact of broadly neutralizing monoclonal antibodies (bnAbs) as a novel HIV prevention modality in high-income countries. Materials & methods: Using a decision-tree and revenue model applied to an eligible US population of 1299,708 individuals and projecting to 2040, bnAbs are estimated to capture 1 in 8 PrEP users (12.5% of PrEP users, 95% credible interval 7.3% to 21.1%, equivalent to 8.0% of the prevention-eligible population) following assumed US FDA approval in 2030. All estimates are scenario based and conditional on assumed pricing, uptake and behavior; none are observed outcomes. Critically, roughly half of projected bnAb users, nearly 52,000 individuals, would not otherwise use any biomedical HIV prevention, representing a net expansion of PrEP users (95% credible interval: 21,859–95,581). US manufacturer revenue totaled $12.0 billion discounted at 3% per year to 2030 (95% credible interval $6.2 billion to $21.9 billion), equivalent to $14.5 billion undiscounted, over the 11 years from approval to 2040. Total US payer spending rose 3.6% ($463.6 million annually), though the credible interval crosses zero, and the mean cost per prevention user decreased provided bnAbs are priced at the modeled list price of $14,000 per year, below existing injectable PrEP options. Conclusion: Under the assumptions modeled here, bnAbs could reach roughly one in eight PrEP users in high-income countries, about half of them people not otherwise using biomedical prevention. Whether this translates into an attractive commercial opportunity, and whether per-user prevention costs fall or rise, depends principally on how bnAbs are priced relative to long-acting injectable PrEP. These are projections conditional on assumed efficacy, pricing and adoption behavior, not observed outcomes.
Plain language summary: What would happen if antibody infusions became a new way to prevent HIV in wealthier countries?
What is this article about?
HIV can be prevented with medicines called PrEP, taken either as a daily pill or as an injection every one to 6 months. These work well, but many people do not use them: a daily pill is hard for some to keep up, and others do not want to take HIV medicines at all. Researchers are testing a different option: antibodies, proteins the immune system makes to fight infection, given as an infusion twice a year. This article asks what would happen to HIV prevention in wealthier countries if antibodies were approved in 2030.
What methodology is described?
We built a computer simulation model. It begins with the 1.3 million people in the USA who could benefit from HIV prevention and follows the choices they might make among the available options. We projected how many would use each option each year through 2040, what that would cost health insurers, and what a company making the antibodies could earn. Because almost every number in such a model is uncertain, we ran it 10,000-times with different plausible assumptions and report a range rather than a single figure.
What were the results?
About one in eight people using HIV prevention would choose antibodies. Roughly half of them would be people not using any HIV prevention today, so antibodies would reach people the current options are missing. Total spending by health insurers would rise by about 3.6%. Whether the average cost of protecting one person rises or falls depends almost entirely on how antibodies are priced against the injections already available.
Why is this important?
Antibodies for HIV prevention are still in clinical trials, and no one yet knows how well they work or what they will cost. This article does not claim they are good value for money, because that cannot yet be known. It sets out the conditions that would have to hold for antibodies to be worth developing and paying for, so funders, companies and health systems can see what is at stake before those decisions are made.
HIV remains a major global health challenge. Despite advances in antiretroviral (ARV) therapy and prevention, approximately 1.3 million new HIV infections occurred worldwide in 2024 [1,2]. Pre-exposure prophylaxis (PrEP) with ARV medications has transformed HIV prevention, but more than 10 years after introduction, uptake remains far below targets, with 3.9 million users around the world in 2024 [3]. In the US, an estimated 382,267 individuals were using PrEP in 2022 against a target of 1200,000 [4].
Current small molecule ARV-based PrEP options face adoption barriers. Daily oral PrEP (tenofovir-based regimens) requires consistent adherence, with discontinuation rates exceeding 50% within the first year in some populations [5]. Long-acting injectable PrEP addresses adherence through injections every 2 months (cabotegravir, CAB-LA) or every 6 months (lenacapavir, LEN) but injection-site reactions can occur, numerous drug interactions between long-acting injectable ARV drugs and other commonly used medications exist, and in some populations there is hesitation about the prolonged use of ARV drugs for prolonged prophylaxis [6–8]. The current PrEP arsenal does not fully address the different needs of the population at risk.
Broadly neutralizing monoclonal antibodies (bnAbs) are in advanced clinical development as a new modality for HIV prevention through passive immunization [9,10]. Administered as twice-yearly intravenous infusions, bnAb PrEP would offer a biologic, non-ARV, long-acting prevention option that may appeal to individuals who cannot and/or do not want to use small-molecule ARV-based PrEP. Clinical trials are underway to evaluate bnAb efficacy for HIV prevention, with potential US FDA approval projected for 2030.
This analysis is positioned against a body of prior economic modelling of PrEP scale-up, which has evaluated the cost-effectiveness of oral PrEP in high-income settings [11] and of expanded ARV availability in sub-Saharan Africa [12]. That literature evaluates prevention technologies whose efficacy and price are known, from a payer or health-system perspective. The present analysis instead characterizes the size and composition of a market for a technology still in development, from a manufacturer and budget-impact perspective, and is therefore complementary to rather than a substitute for that work.
This analysis quantifies the market opportunity for bnAb PrEP in high-income countries.
Materials & methods
Study design
We developed an economic model to estimate the market opportunity and healthcare cost impact of bnAbs for HIV prevention across high-income countries over an 18-year horizon (2022–2040). The model links three analytic components: a decision tree that allocates a representative eligible population across competing HIV prevention modalities and computes bnAb market share; a PrEP utilization forecast that projects uptake and a supply and revenue model that applies bnAb market shares to forecast utilization, manufacturer revenue, production costs and net returns. The analysis adopts two perspectives: a US healthcare payer perspective for cost impact analysis, and a manufacturer perspective for revenue and production cost projections. All costs are in US dollars. This is a market-opportunity and budget-impact analysis rather than a cost-effectiveness analysis: it does not estimate HIV infections averted, quality-adjusted life years, or an incremental cost-effectiveness ratio and it excludes administration and infusion costs, monitoring, adverse event management, broader healthcare utilization and downstream savings from averted infections. All multi-year revenue and production-cost streams are discounted at 3% per year and indexed to the decision point in year 2030.
Decision tree
The decision tree (Figures 1 & 2 & Table 1) allocates the US population eligible for biomedical HIV prevention (1299,708 individuals in 2022, based on CDC estimates) [13,14] across prevention modalities through sequential branching probabilities. Two scenarios are modeled: a counterfactual without bnAb access, and a scenario in which bnAbs are available as a prevention option. The difference between the two scenarios identifies the incremental impact of bnAb introduction on both market composition and payer costs.
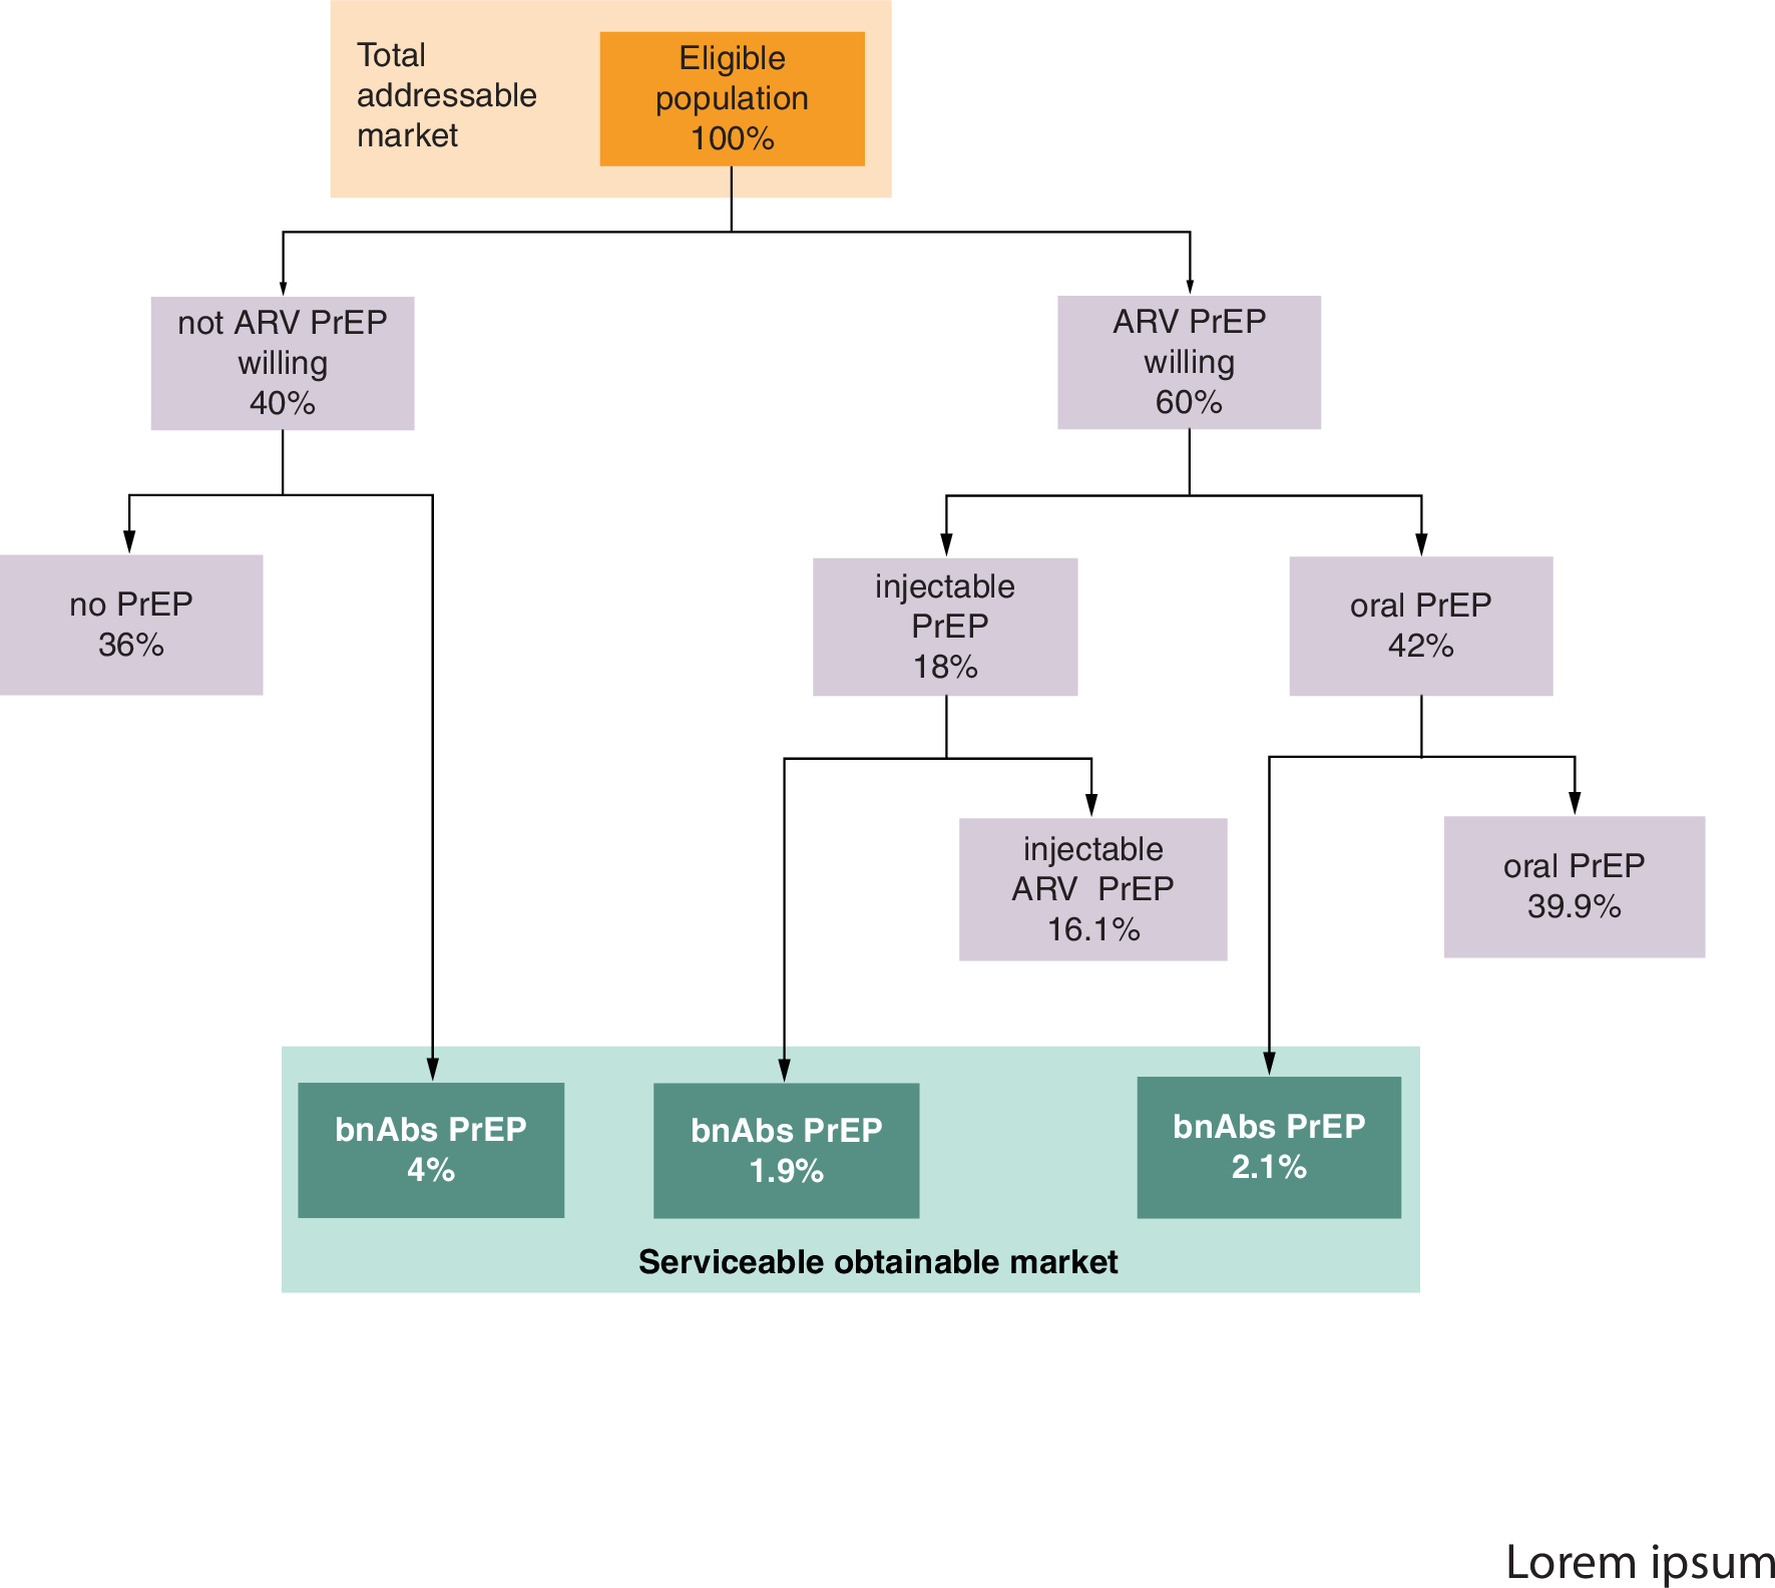
Figure 1. Decision tree for HIV prevention modality allocation.
Population branches by willingness to use PrEP, then by modality preference.
ARV: Antiretroviral; bnAbs: Broadly neutralizing monoclonal antibodies; PrEP: Pre-exposure prophylaxis.
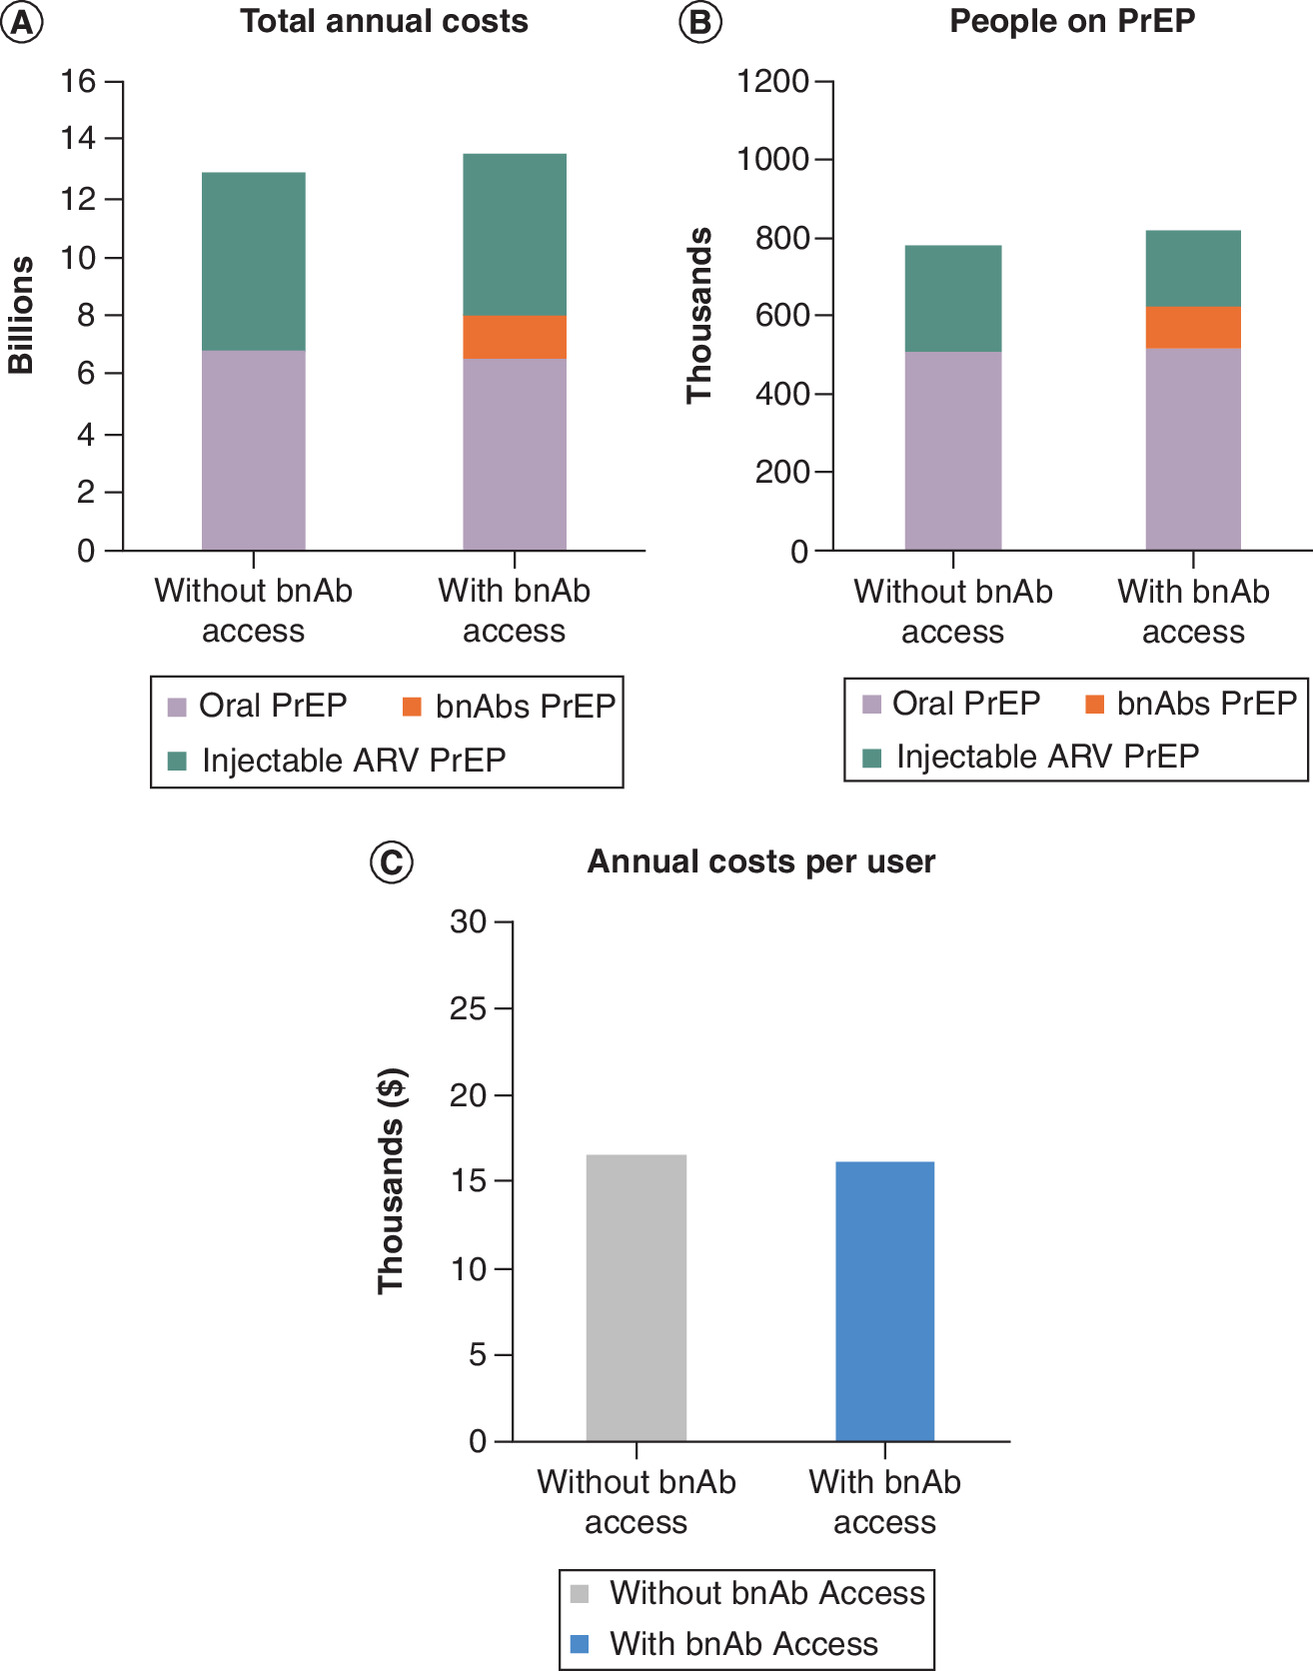
Figure 2. Annual US payer cost by prevention method, number of people on pre-exposure prophylaxis, with and without broadly neutralizing monoclonal antibodies access.
(A) Total annual payer cost by prevention modality, with and without bnAb access. The introduction of bnAbs increases total annual US payer costs by $463.6 million (3.6%), reflecting the addition of new prevention users and partial substitution away from more expensive injectable options. (B) Total number of individuals on PrEP, with and without bnAb access. bnAb introduction expands the prevention user base by 51,988 individuals (6.7% of the 779,825 users projected without bnAb access), representing people who would not otherwise use any biomedical HIV prevention modality. (C) Mean annual cost per prevention user, with and without bnAb access. Despite the increase in total spending, the mean cost per user decreases from $16,600 to $16,120, as bnAbs are priced at $14,000 per year, below existing injectable PrEP options and the expanded user base is weighted toward this lower-cost modality.
ARV: Antiretroviral; bnAb: Broadly neutralizing monoclonal antibody; PrEP: Pre-exposure prophylaxis.
| Prevention modality | Annual cost per user (WAC) | Without bnAb access | With bnAb access | ||||
|---|---|---|---|---|---|---|---|
| Population | Of total population (%) | Annual cost | Population | Of total population (%) | Annual cost | ||
| Branded oral PrEP (TAF/FTC) | $16,600 | 272,939 | 21.0% | $4.5 billion | 259,292 | 20.0% | $4.3 billion |
| Generic oral PrEP (TDF/FTC) | $ 8300 | 272,939 | 21.0% | $2.3 billion | 259,292 | 20.0% | $2.2 billion |
| Total oral PrEP | 545,877 | 42.0% | $6.8 billion | 518,583 | 39.9% | $6.5 billion | |
| bnAbs (ARV willing) | $14,000 | n/a | 52,248 | 4.0% | $731 million | ||
| bnAbs (not ARV willing) | $14,000 | n/a | 51,988 | 4.0% | $728 million | ||
| Total bnAbs PrEP | n/a | 104,237 | 8.0% | $1.5 billion | |||
| Injectable ARV PrEP, every 2 months (CAB-LA) | $25,800 | 187,158 | 14.4% | $4.8 billion | 167,194 | 12.9% | $4.3 billion |
| Injectable ARV PrEP, every 6 months (LEN) | $28,218 | 46,789 | 3.6% | $1.3 billion | 41,799 | 3.2% | $1.2 billion |
| Total injectable PrEP | 233,947 | 18.0% | $6.1 billion | 208,993 | 16.1% | $5.5 billion | |
| Susceptible (no PrEP) | 519,883 | 40.0% | 467,895 | 36.0% | |||
| Total population on PrEP | 779,825 | 60.0% | $12.9 billion | 831,813 | 64.0% | $13.4 billion | |
| Mean annual cost per PrEP user (any PrEP) | $16,600 | $16,120 | |||||
| Total population eligible for PrEP | 1299,708 | 100.0% | 1299,708 | 100.0% | |||
Bold numbers are subtotals.
Costs represent annual expenditure from the US payer perspective. The bnAb cost of $14,000 per year is the cost of a full twice-yearly regimen, that is 2.0 infusions at a $7000 wholesale acquisition cost per infusion. bnAb users represent 12.5% of all PrEP users and 8.0% of the total eligible population; these are two different denominators and should not be read as a single share. Component rows are rounded independently and may not sum exactly to displayed totals.
bnAb: Broadly neutralizing monoclonal antibody; CAB-LA; Long-acting Cabotegravir; LEN: Lenacapavir; PrEP: Pre-exposure prophylaxis; WAC: Wholesale acquisition cost.
At the first branch, 60% of the eligible population is assumed willing to use ARV-based PrEP by the projected year of bnAb approval (2030), based on CDC estimates of PrEP willingness [15]. The remaining 40% are classified as not willing to use ARV-based PrEP. Among those willing to use PrEP, 70% (42% of total) prefer oral formulations. The remaining 30% (18% of total) prefer non-oral modalities. Among non-oral users, 20% (3.6% of total) are assumed to choose bnAbs over injectable PrEP. Of the branching probabilities above, only willingness to use ARV-based PrEP and the size of the eligible population are derived from published data; the modality-preference probabilities are structural assumptions based on expert elicitation rather than analytically derived figures, and all are varied probabilistically in the sensitivity analysis.
When bnAbs are available, two additional behavioral shifts occur: 5% (2.1% of total) of oral PrEP users switch to bnAbs, and 10% (4% of total) of individuals not willing or able to use ARV-based PrEP adopt bnAbs. The latter group represents individuals newly brought into HIV prevention who would not otherwise use any biomedical prevention modality.
The introduction of bnAbs increased net prevention coverage: about 52,000 individuals (6.7% of the PrEP users projected without bnAb access), representing people from the ARV-unwilling population who adopted bnAbs as a non-ARV based alternative. A further 52,248 individuals switched to bnAbs from a prevention modality they would otherwise have used: 27,294 from oral PrEP and 24,954 from injectable PrEP. Together, these two groups account for 12.5% (1 in 8 PrEP users) market share.
Table 1 & Figure 2summarizes the cost impact of bnAb introduction from the US payer perspective. Without bnAb access, 779,825 individuals are on PrEP at a total annual cost of $12.9 billion, yielding a mean cost of $16,600 per prevention user. With bnAb access priced at a modeled list price of $14,000 per year (2.0 infusions per treated person-year at a $7,000 wholesale acquisition cost per infusion), approximately half the annual cost of existing injectable PrEP options (CAB-LA: $25,800; lenacapavir: $28,218), an additional 51,988 individuals enter the prevention cascade, bringing total PrEP users to 831,813. Total annual payer spending rises modestly to $13.4 billion (+$463.6 million, 3.6%), but because the influx of new users is weighted toward the lower-cost bnAb option, the mean annual cost per prevention user decreases to $16,120. This counterintuitive finding reflects the dual effect of bnAb introduction: drawing some users away from more expensive injectables while simultaneously expanding the prevention user base.
| Country | bnAb share | WAC/dose | Clients 2035 | Clients 2040 | Total revenue | Prod. cost | Net revenue |
|---|---|---|---|---|---|---|---|
| US | 12.5% | $7000 | 130,278 | 150,375 | $12,050 million | $399 million | $11,651 million |
| France | 12.5% | $3000 | 16,042 | 23,571 | $676 million | $107 million | $569 million |
Revenue and costs cumulative 2022–2040. Net revenue = revenue minus production costs. All figures are present-valued to 2030 at 3% per year; the undiscounted equivalents are $14,453 million and $815 million of revenue for the US and France, respectively.
PrEP utilization forecasting
Country-level PrEP utilization is projected from 2022 baselines [4] using an 8% annual growth rate extrapolated from the observed trend in national PrEP utilization rather than taken from a published projection, capped at country-specific targets that reflect national prevention goals. Two high-income countries, the US and France, are modeled in Figures 3 & 4. Country-specific targets represent aspirational goals based on national prevention strategies and UNAIDS benchmarks.
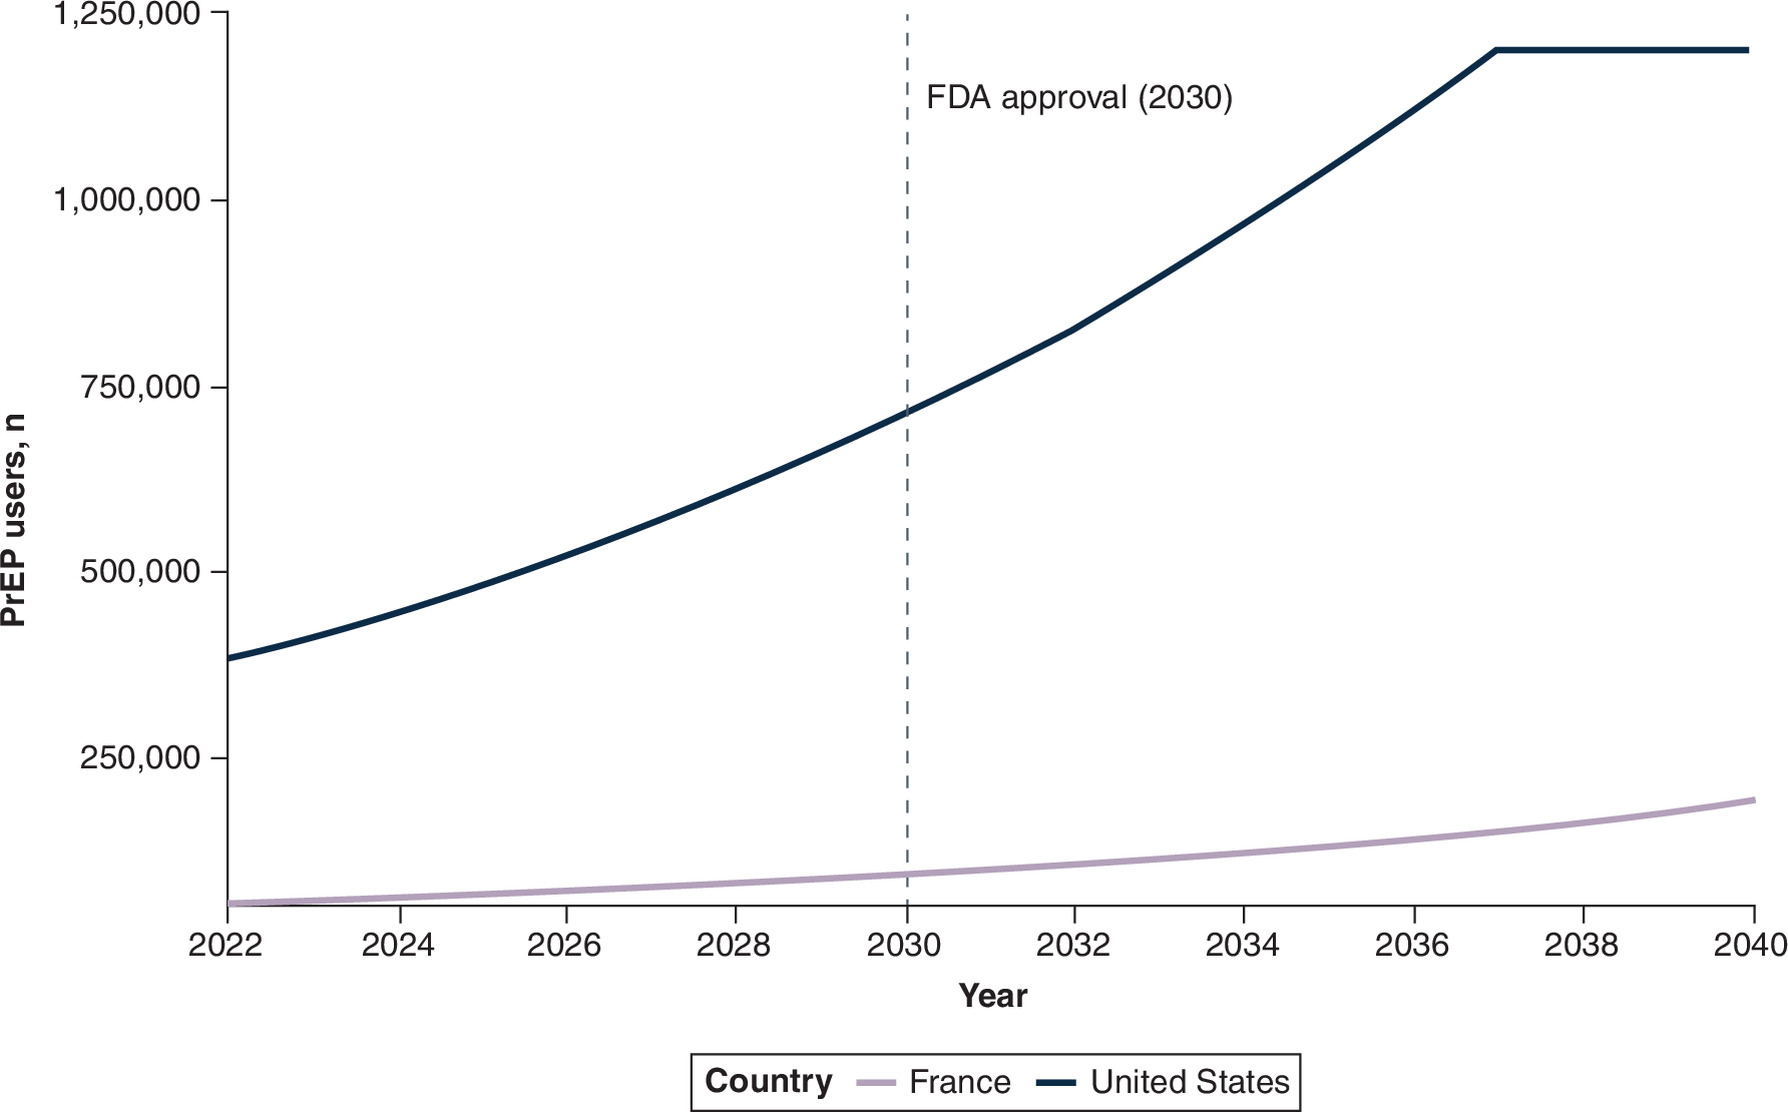
Figure 3. Projected pre-exposure prophylaxis utilization by country, 2022–2040.
Growth follows an 8% annual rate capped at country-specific targets.
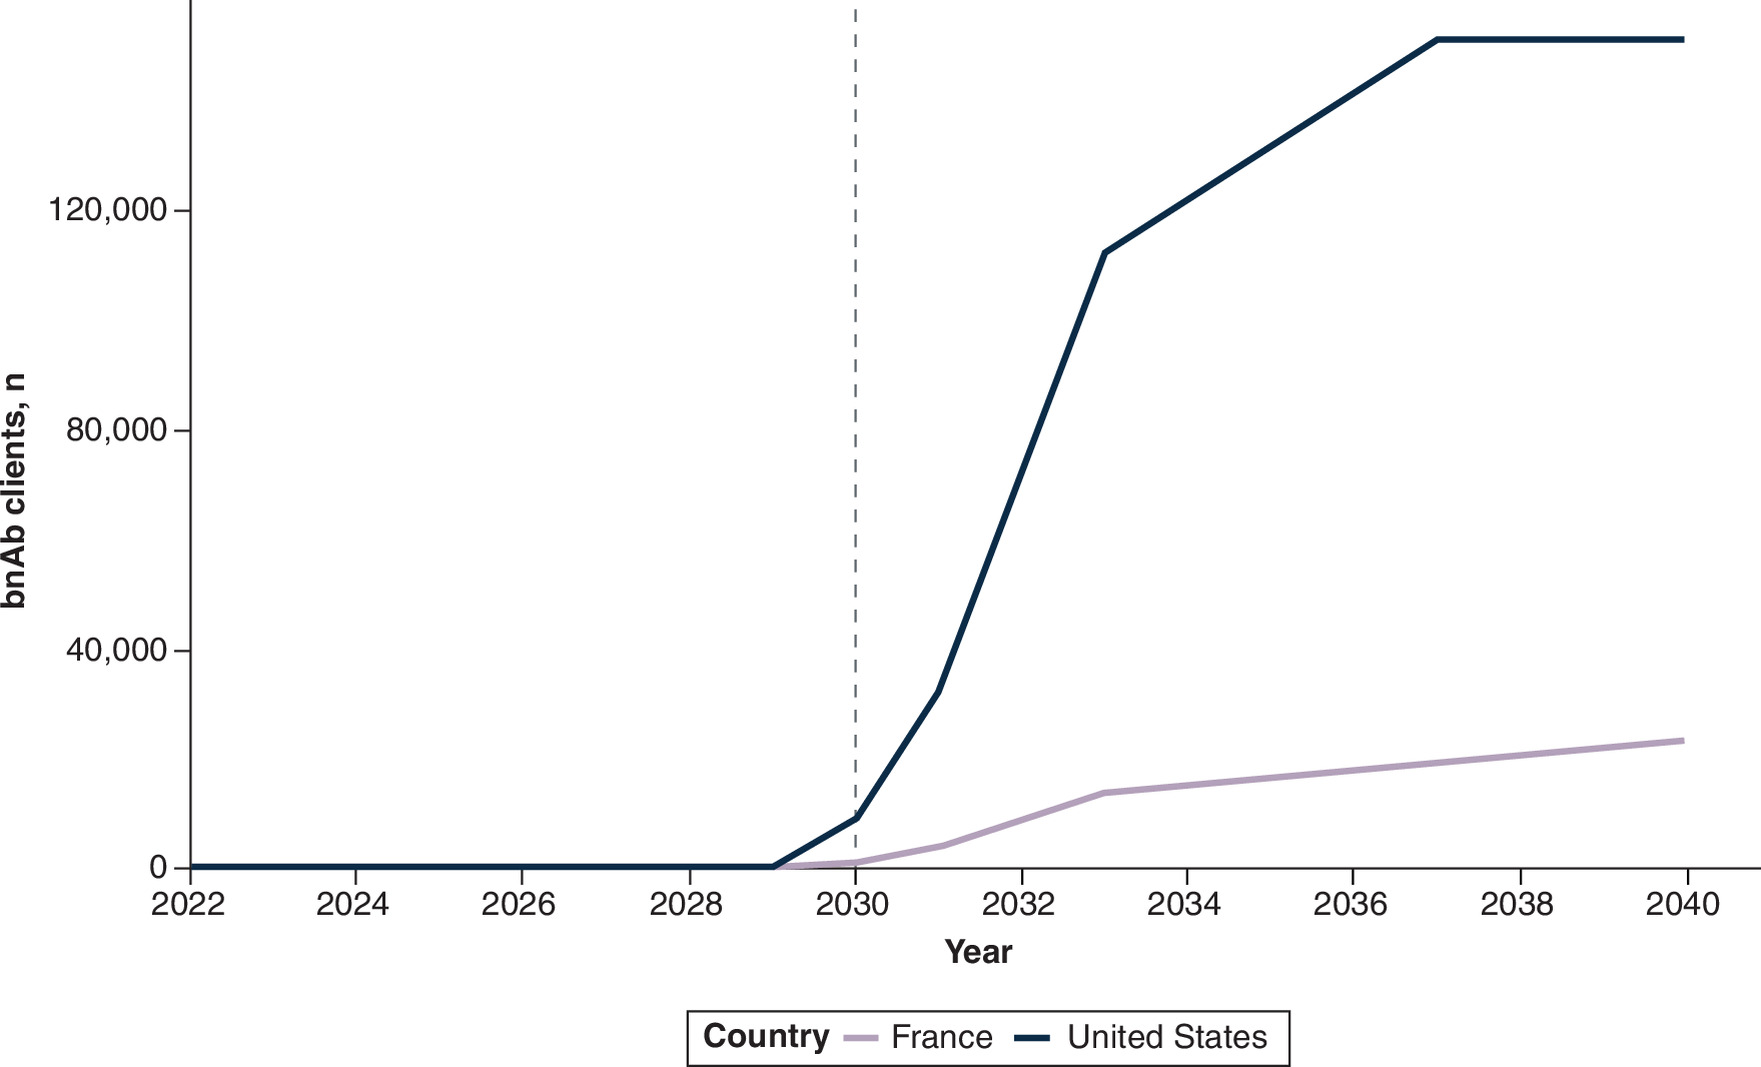
Figure 4. Projected broadly neutralizing monoclonal antibody clients by country, 2022–2040.
Market ramp begins at US FDA approval with 3-year phase-in.
The growth model is deterministic: in each year t, the number of PrEP users equals min(N t-1 × 1.08, target), where N t-1 is the prior year’s utilization and the target serves as a ceiling. This formulation assumes sustained programmatic growth consistent with recent historical trends, without modeling specific policy interventions or market disruptions that could change uptake.
Supply & revenue model
Following FDA approval in 2030, bnAb market uptake was modeled with a three-year ramp: 10% of projected market share in the approval year, 33% in year one, 67% in year two, and full penetration from year three onward. Manufacturer revenue was calculated as the number of bnAb doses, clients multiplied by 1.7 doses per year reflecting real-world utilization of a twice-yearly regimen, multiplied by the country-specific wholesale acquisition cost per dose. The payer and manufacturer perspectives apply the same unit price of $7000 per infusion and differ only in doses assumed per year. The payer analysis costs a person on bnAb PrEP for a full year, who receives the complete twice-yearly regimen, giving 2.0 doses and $14,000 per treated person-year. The manufacturer model forecasts doses shipped across a client cohort in which some clients initiate or discontinue mid-year, giving a cohort mean of 1.7 doses and $11,900 of revenue per client-year. The annual payer price is derived from the per-dose cost rather than entered independently, so the two cannot diverge. Had the payer analysis instead used 1.7 doses per year, incremental annual payer cost would be $244.7 million (1.89%) rather than $463.6 million (3.58%).
Annual costs to the US healthcare payer are computed by multiplying the number of individuals in each prevention modality by the corresponding annual wholesale acquisition cost per user. The incremental cost impact of bnAb introduction is the difference in total annual payer expenditure between the with-bnAb and without-bnAb scenarios (Table 1 & Figure 2).
Manufacturing costs comprise two components: Fixed manufacturing costs for clinical trials ($10,000,000, incurred 5 years before approval) and launch-scale manufacturing expansion ($50,000,000, incurred the year before approval), and marginal manufacturing costs for each dose of $195, calculated as: $50 per g × 3 g per dose, plus a 30% packaging and distribution markup.
Net manufacturer revenue equals total revenue minus total production costs (fixed plus marginal) for each country and year (Table 2 & Supplementary Table 2 & Supplementary Figure 1).
Sensitivity analysis, model validation, software & reproducibility
One-way deterministic sensitivity analysis was conducted to assess the influence of individual model parameters on total US manufacturer revenue through 2040 in nominal terms. The sensitivity analysis was performed on seven key parameters, varying each across a plausible range while holding other inputs at base-case values. The parameters examined were the US wholesale acquisition cost per dose, willingness to use ARV-based PrEP, bnAb preference among non-oral users, bnAb uptake among those not willing to use ARV-based PrEP, doses per user per year, the annual PrEP growth rate and the oral-to-bnAb switching rate. Results are presented as a diagram showing the absolute change in US revenue from the base case (Supplementary Figure 2).
Probabilistic sensitivity analysis
Because many parameters are uncertain simultaneously, one-way analysis alone is not sufficient. Probabilistic sensitivity analyses were conducted to assess combined uncertainty using 10,000 random draws from distributions fitted to eleven inputs: the seven decision-tree probabilities (willingness to use ARV-based PrEP, oral preference among those willing, branded share among oral users, bnAb preference among non-oral users, monthly share among injectable users, bnAb uptake among the ARV-unwilling, and oral-to-bnAb switching), each drawn from a Beta distribution; the annual PrEP growth rate, doses per client-year, and the US wholesale acquisition cost per dose, each drawn from a Gamma distribution; and the discount rate, drawn from a rescaled Beta spanning 0%–5% with a mean at the 3% base case. Distributions were fitted by moment matching to the base-case value with the plausible range treated as an approximate 95% interval, and are listed in full in Supplementary Table 1. The annual bnAb price to the payer was recomputed on every draw from the sampled per-dose price, so the two pricing perspectives remain internally consistent throughout. Comparator prices for oral and injectable PrEP were held at their base-case values, so the reported intervals on payer cost are conditional on those prices. Results are reported as 95% credible intervals (Supplementary Table 4).
Scenario analysis
Four multiparameter scenarios were evaluated to show how the outcomes behave when adverse assumptions coincide. In the adverse pricing scenario (S1), bnAbs launch 50% above the assumed price while long-acting injectable PrEP falls 30%; discounted US revenue rises to $18.07 billion, incremental annual payer cost rises to $1390.0 million (12.5%), and the mean annual cost per prevention user rises from $14,235 to $15,016. In the lower willingness to adopt scenario (S2), willingness to use ARV-based PrEP falls to 0.45, bnAb preference among non-oral users to 0.10, bnAb uptake among the ARV-unwilling to 0.05, and oral-to-bnAb switching to 0.025; bnAb share falls to 8.8% and discounted US revenue to $8.41 billion. In the delayed approval scenario (S3), FDA approval slips from 2030 to 2033 within an unchanged 2040 projection horizon, reducing discounted US revenue to $8.41 billion. Scenario S4 combines S1 and S2, giving discounted US revenue of $12.62 billion and incremental payer cost of $859.8 million (10.3%).
The R model was validated against the original Excel workbook on 16 key outputs spanning market shares, country-level revenue and production cost totals, and US payer cost estimates. All validation checks passed with less than 0.1% deviation between the R and Excel implementations, confirming computational equivalence.
The model is implemented in base R (version 4.3.1) with no external package dependencies. All model parameters are hardcoded as a single input list, facilitating transparency and reproducibility.
Discussion
This analysis identifies the conditions under which bnAbs could become commercially attractive, rather than establishing that they are. Under the assumptions modeled, in less than 5 years after approval bnAbs could capture approximately 12.5% of US PrEP users (95% credible interval 7.3% to 21.1%), equivalent to 8.0% of the prevention-eligible population, generating $12.0 billion in discounted US manufacturer revenue between 2030 and 2040 (95% credible interval $6.2 billion to $21.9 billion), equivalent to $14.5 billion undiscounted. The most consequential finding is not the market share itself but its composition: one in eight PrEP users are likely to choose bnAbs, and roughly half of these projected bnAb users are individuals who were unwilling and/or unable to use ARV-based PrEP and would otherwise remain unprotected. This net expansion of prevention coverage represents a genuine public health gain that complements, rather than cannibalizes, existing PrEP programs. At the same time, the incremental cost to US payers, $463.6M annually or 3.6% above current prevention spending, is modest in the base case, but this is conditional rather than structural: the credible interval runs from -$324.2M to $1277.1M and crosses zero, and the adverse pricing scenario roughly triples the central estimate to $1.39 billion. Because this analysis does not estimate infections averted, we do not calculate the considerable healthcare savings from high grade protection against acquiring new HIV infections. Because this analysis does not estimate infections averted, it cannot offset that cost against downstream treatment savings. Notably, despite the aggregate increase in payer spending, the mean annual cost per prevention user decreases, in 92.6% of simulations, as a direct consequence of bnAbs being priced well below existing injectable options while expanding the total user base. That result is a property of the price relationship rather than of bnAbs themselves: under the adverse pricing scenario the mean cost per prevention user rises from $14,235 to $15,016.
The competitive pricing context matters for interpreting these projections. Long-acting injectable PrEP currently costs approximately $25,800 (cabotegravir) to $28,218 (lenacapavir) per year. bnAbs priced at roughly 50% of that level would represent a meaningful reduction in per-user cost while maintaining comparable adherence advantages. This pricing dynamic has two implications: first, bnAbs may exert competitive pressure that moderates injectable PrEP pricing broadly; second, the modest incremental payer cost projected here is contingent on bnAbs not being priced at parity with existing injectables. Pricing decisions will therefore be central to whether the public health and payer-value arguments for bnAbs are realized in practice. Moreover, technological innovations in monoclonal antibody manufacturing could lead to additional reductions in overall pricing as well as the potential profitability of the products.
Several limitations should inform interpretation. The decision tree applies static branching probabilities across the full forecast horizon, which does not capture how preferences may evolve as bnAb clinical experience accumulates and as the competitive landscape shifts with lenacapavir and next-generation injectables. Modality shares are fixed behavioral probabilities that do not respond to relative price, so in the adverse pricing scenario bnAb market share remains at 12.5% even though bnAbs have become the more expensive option, which is almost certainly optimistic; we have not modeled a price elasticity because there are no data from which to estimate one for a product that has not launched. The assumed approval timeline of 2030 is optimistic. Because the projection horizon is fixed at 2040, a three-year delay truncates rather than shifts the revenue stream: delaying approval to 2033 reduces the selling years captured within the window from 11 to 8 and lowers discounted cumulative US revenue by 30.2%, from $12.05 billion to $8.41 billion, while leaving steady-state market share, annual payer impact, and mean cost per prevention user unchanged. Finally, the populations receiving PrEP may expand over time to include people who don't self-identify but belong to high-risk networks or geographic regions where PrEP indications become warranted. Here the cost and safety profile of each individual approach may lead to expansion of the market: bnAbs may compete favorably in such situations. Finally, this analysis is not a cost-effectiveness analysis and omits administration and infusion costs, monitoring, adverse event management, broader healthcare utilization, infections averted, quality-adjusted life years and downstream savings from averted infections. The model was built to inform whether bnAbs warrant continued investment through clinical development, which turns on whether a plausible market exists at a plausible price, rather than to inform a payer reimbursement decision. A formal cost-effectiveness analysis incorporating all of these components will be both feasible and necessary once efficacy data from the ongoing trials are available and a price is established.
Conclusion
This analysis identifies the conditions under which broadly neutralizing antibodies could become a commercially viable HIV prevention product in high-income countries. Under the assumptions modeled, bnAbs reach roughly one in eight PrEP users, and about half of those users are people not otherwise engaged in biomedical prevention, which is the finding most relevant to public health. Whether payers experience this as a modest budget increase or a substantial one, and whether the mean cost per prevention user falls or rises, depends principally on how bnAbs are priced relative to long-acting injectable PrEP: under an adverse price relationship the per-user advantage reverses. The projected revenue range is large enough that commercial viability is plausible across much of the assumption space explored here, though it remains contingent on efficacy data that do not yet exist, on pricing decisions not yet made, and on regulatory timing that materially affects returns within a fixed horizon. Realizing this potential will require pricing strategies that maintain access across the full spectrum of prevention-eligible individuals.
Summary points
•
Broadly neutralizing monoclonal antibodies (bnAbs) are in advanced clinical development as a twice-yearly, non-antiretroviral (ARV) option for HIV pre-exposure prophylaxis, offering a prevention modality for people who cannot or will not use ARV-based PrEP.
•
This analysis estimates the market bnAbs could reach in high-income countries. It is a market-opportunity and budget-impact analysis rather than a cost-effectiveness analysis, and does not estimate infections averted, quality-adjusted life years or an incremental cost-effectiveness ratio.
•
Under the assumptions modeled, bnAbs would reach 12.5% of US PrEP users (95% credible interval 7.3% to 21.1%), equivalent to 8.0% of the prevention-eligible population.
•
Approximately half of projected bnAb users, about 52,000 people (95% credible interval 21,859 to 95,581), would not otherwise use any biomedical HIV prevention, so bnAbs would expand prevention coverage rather than only substitute within it.
•
Cumulative US manufacturer revenue from 2022 to 2040 is projected at $12.0 billion discounted at 3% per year to 2030 (95% credible interval $6.2 billion to $21.9 billion), equivalent to $14.5 billion undiscounted.
•
Incremental annual US payer spending rises by $463.6 million, or 3.6% above current prevention spending, but the credible interval crosses zero: in 11.4% of simulations bnAb introduction is cost-neutral or cost-saving to payers.
•
The mean annual cost per prevention user falls from $16,600 to $16,120, and falls in 92.6% of simulations, but this reverses under an adverse price scenario in which bnAbs launch above long-acting injectable PrEP, where it rises from $14,235 to $15,016.
•
Whether bnAbs become commercially attractive depends principally on price relative to long-acting injectable PrEP and on regulatory timing: delaying approval from 2030 to 2033 reduces discounted US revenue by 30.2% within a fixed 2040 horizon, while leaving market share and payer impact unchanged.
Acknowledgments
All authors have approved the final manuscript.
Financial disclosure
The authors received no financial and/or material support for this research or the creation of this work.
Competing interests disclosure
The authors have no competing interests or relevant affiliations with any organization or entity with the subject matter or materials discussed in the manuscript. This includes employment, consultancies, honoraria, stock ownership or options, expert testimony, grants or patents received or pending, or royalties.
Writing disclosure
No funded writing assistance was utilized in the production of this manuscript.
Open access
This work is licensed under the Attribution-NonCommercial-NoDerivatives 4.0 Unported License. To view a copy of this license, visit https://creativecommons.org/licenses/by-nc-nd/4.0/
Supplementary Material
File (supplementary data.docx)
- Download
- 307.34 KB
References
Papers of special note have been highlighted as: • of interest; •• of considerable interest
1.
UNAIDS. HIV estimates with uncertainty bounds 1990–present (2025). https://www.unaids.org/sites/default/files/media_asset/HIV_estimates_from_1990-to-present.xlsx
2.
UNAIDS. AIDS, crisis and the power to transform: UNAIDS Global AIDS Update 2025. Geneva, Switzerland (2025). https://www.unaids.org/en/UNAIDS-global-AIDS-update-2025
3.
Beyrer C, Ratevosian J, Gelderblom H, Rosenberg NE. The HIV/AIDS pandemic: where are we now? AIDS 39(11), 1497–1504 (2025).
4.
AVAC. PrEPWatch (2026). https://data.prepwatch.org
5.
Zhang J, Li C, Xu J et al. Discontinuation, suboptimal adherence, and reinitiation of oral HIV pre-exposure prophylaxis: a global systematic review and meta-analysis. Lancet HIV 9(4), e254–e268 (2022).
• Quantifies the oral pre-exposure prophylaxis (PrEP) persistence problem that motivates demand for long-acting non-antiretroviral options and informs the doses-per-client-year assumption in the manufacturer model.
6.
Delany-Moretlwe S, Hughes JP, Bock P et al. Cabotegravir for the prevention of HIV-1 in women: results from HPTN 084, a phase 3, randomised clinical trial. Lancet 399(10337), 1779–1789 (2022).
7.
Kelley CF, Acevedo-Quinones M, Agwu AL et al. Twice-yearly lenacapavir for HIV prevention in men and gender-diverse persons. N. Engl. J. Med. 392(13), 1261–1276 (2025).
• Establishes the efficacy and dosing interval of the twice-yearly injectable comparator whose price is the single most important determinant of the bnAb results reported here.
8.
Bekker LG, Das M, Abdool Karim Q et al. Twice-yearly lenacapavir or daily F/TAF for HIV prevention in cisgender women. N. Engl. J. Med. 391(13), 1179–1192 (2024).
9.
Gelderblom HC, Corey L, Barouch DH. The potential of broadly neutralizing antibodies for HIV prevention. J. Int. AIDS Soc. 27(5), e26257 (2024).
•• The most complete current synthesis of the clinical and programmatic case for bnAb-based prevention, and the basis for the product profile assumed in this model.
10.
Corey L, Gilbert PB, Juraska M et al. Two randomized trials of neutralizing antibodies to prevent HIV-1 acquisition. N. Engl. J. Med. 384(11), 1003–1014 (2021).
•• The Antibody Mediated Prevention trials established proof of concept for passive immunization against HIV and define the efficacy question that must be resolved before a formal cost-effectiveness analysis is possible.
11.
Cambiano V, Miners A, Dunn D et al. Cost-effectiveness of pre-exposure prophylaxis for HIV prevention in men who have sex with men in the UK: a modelling study and health economic evaluation. Lancet Infect. Dis. 18(1), 85–94 (2018).
•• The reference cost-effectiveness analysis for oral PrEP scale-up in a high-income setting, and the closest methodological comparator to the present analysis, which differs in taking a market rather than a payer-decision perspective.
12.
Phillips AN, Bansi-Matharu L, Shahmanesh M et al. Potential cost-effectiveness of community availability of tenofovir, lamivudine, and dolutegravir for HIV prevention and treatment in east, central, southern, and west Africa: a modelling analysis. Lancet Glob. Health 11(10), e1648–e1657 (2023).
13.
Smith DK, Van Handel M, Grey J. Estimates of adults with indications for HIV pre-exposure prophylaxis by jurisdiction, transmission risk group, and race/ethnicity, United States, 2015. Ann. Epidemiol. 28(12), 850–857; e9 (2018).
14.
CDC. Monitoring selected national HIV prevention and care objectives by using HIV surveillance data — United States and 6 dependent areas, 2022. Centers for Disease Control and Prevention, GA, USA (2024).
15.
Sullivan PS, DuBose SN, Castel AD et al. Equity of PrEP uptake by race, ethnicity, sex and region in the United States in the first decade of PrEP: a population-based analysis. Lancet Reg. Health Am. 33, 100738 (2024).
Information & Authors
Information
Published In
Copyright
© 2026 The authors. This work is licensed under the Attribution-NonCommercial-NoDerivatives 4.0 Unported License
History
Received: 11 June 2026
Accepted: 27 August 2026
Published online: 1 October 2026
Keywords:
Topics
Authors
Metrics & Citations
Metrics
Article Usage
Article usage data only available from February 2023. Historical article usage data, showing the number of article downloads, is available upon request.
Citations
How to Cite
On the economics of broadly neutralizing monoclonal antibodies for HIV prevention in high-income countries. (2026) Journal of Comparative Effectiveness Research. DOI: 10.57264/cer-2026-0120
Export citation
Select the citation format you wish to export for this article or chapter.