The cost-effectiveness of real-time continuous glucose monitoring versus intermittently scanned continuous glucose monitoring in individuals with insulin-treated Type 2 diabetes mellitus in Canada
Publication: Journal of Comparative Effectiveness Research
Abstract
Aim: Continuous glucose monitoring (CGM) supports glycemic control and reduces diabetes complications. CGM systems include intermittently scanned CGM (is-CGM) and real-time CGM (rt-CGM). While rt-CGM may provide better outcomes than is-CGM, it costs more upfront and its cost-effectiveness in Canada has not been established. We assessed the cost-effectiveness of rt-CGM versus is-CGM in people with insulin-treated Type 2 diabetes mellitus (T2DM) from a Canadian healthcare payer perspective. Materials & methods: We used the ECHO-T2DM microsimulation model to estimate incremental lifetime health outcomes and costs of rt-CGM versus is-CGM. Clinical inputs came from an indirect treatment comparison; cost and utility data were drawn from published sources. Sensitivity analyses tested robustness. Results: Rt-CGM was more effective and less costly than is-CGM, yielding 0.346 additional quality-adjusted life-years and CAD 2237 in savings over 30 years. Benefits stemmed primarily from better glycemic control and fewer complications, reductions in glycemic events, and reduced fear of hypoglycemia. Although rt-CGM incurred CAD 3867 higher acquisition costs, these were more than offset by avoided complications. Deterministic analysis showed dominance in 14 of 18 scenarios, and cost-effectiveness in the remaining four. Uncertainty analysis showed rt-CGM had an ICER below CAD 50,000 in 98% of simulations. Discussion: Rt-CGM is potentially a cost-saving alternative to is-CGM among people with insulin-treated T2DM in Canada. This finding was strengthened by rigorous sensitivity analysis. Study strengths include use of a validated microsimulation model and adoption of conservative assumptions. Limitations include absence of head-to-head trial evidence and indirect use of time in and out of range. Conclusion: Rt-CGM is a potentially cost-saving option for managing insulin-treated T2DM in Canada, with implications for clinical practice and reimbursement policy.
Plain language summary
What is the article about?
Real-time continuous glucose monitoring (rt-CGM) may help people with Type 2 diabetes mellitus (T2DM) manage their blood sugar more effectively than intermittently scanned CGM (is-CGM). Rt-CGM can reduce episodes of dangerously low or high blood sugar and lower the risk of long-term complications. The two CGM systems differ in terms of user experience, use of alerts and alarms, and acquisition costs per sensor. This study examined the long-term cost-effectiveness of the rt-CGM system versus is-CGM in insulin-treated individuals with T2DM.
What were the results?
Our analysis showed that, over 30 years, using rt-CGM instead of is-CGM can both save money and improve health. The higher device acquisition cost was more than offset by savings associated with avoiding costly health complications. Of our 18 sensitivity tests, 14 supported this result. Even in the four less favorable scenarios, rt-CGM still offered good value compared with the commonly accepted cost threshold of CAD 50,000 per quality-adjusted life-year in Canada.
What do the results mean?
The findings suggest that rt-CGM could be a cost-saving option for managing insulin-treated T2DM in Canada. The benefits of rt-CGM – better blood sugar control, fewer episodes of dangerous blood sugar levels and reduced risk for serious complications like blindness, amputation, and heart disease – outweighed the higher initial acquisition cost. However, these results should be interpreted with caution due to limitations like the lack of head-to-head trials and reliance on model assumptions. More research – especially direct comparisons between rt-CGM and is-CGM – is needed to help confirm and strengthen these findings.
Diabetes poses a significant and growing public health burden in Canada. Nearly 500 individuals are diagnosed daily [1], and more than four million people – about 10% of the population – have been diagnosed with the disease [2,3]. When undiagnosed diabetes and prediabetes are included, the estimated prevalence rises to 30% [3]. Type 2 diabetes mellitus (T2DM) accounts for the majority of new cases, and its increasing incidence has driven much of the overall growth in prevalence [3]. The impact on health is substantial: diabetes is responsible for 30% of strokes, 40% of heart attacks, 70% of nontraumatic leg and foot amputations [3] and contributes to an average of 20 deaths per day due to diabetes-related complications [1].
The economic toll is similarly substantial. In 2008, the total healthcare costs associated with diabetes in Canada were approximately CAD 14 billion, with the majority (52%) spent on medications, while hospital and physician care each accounted for 21% and productivity losses contributed 6% [4]. By 2028, these costs are estimated to more than double to approximately CAD 39 billion [5]. As the prevalence of diabetes continues to rise, the financial strain on the healthcare system will also increase, underscoring the need for interventions that not only improve disease management but also reduce long-term complications and their associated costs.
Effective glycemic management – maintaining normal blood sugar levels – is essential for managing diabetes and preventing its short- and long-term complications [6,7]. Diabetes management typically involves lifestyle modification, dietary changes and pharmacotherapy, with medication regimens adjusted over time based on diabetes type, disease severity and progression. Adjusting medication regimens requires timely and accurate feedback from blood glucose monitoring.
Self-monitoring of blood glucose (SMBG) using fingerstick tests has long been the conventional approach, despite being invasive, painful and limited to intermittent glucose readings. Continuous glucose monitoring (CGM) has emerged as an alternative that mitigates these shortcomings. CGM systems include intermittently scanned CGM (is-CGM) and real-time CGM (rt-CGM). Both systems collect continuous glucose data. Is-CGM requires manual scanning and lacks predictive alerts. Rt-CGM, in contrast, automatically transmits data to a receiver, smartwatch or smartphone. This provides a more comprehensive picture of glucose variability over time to guide therapeutic decisions and enables real-time hypo- and hyperglycemia alerts [8,9].
Clinical evidence demonstrates that both is-CGM and rt-CGM provide superior glycemic benefits compared with SMBG in individuals with T2DM. A meta-analysis including 12 randomized clinical trials [10] and a systematic review [8] showed improved glucose outcomes and reduced need for uncomfortable needlesticks. Rt-CGM may also enhance diabetes self-management in T2DM through behavioral mechanisms such as more frequent monitoring and better adherence to insulin regimens [11]. Although head-to-head trial data in T2DM are lacking, a randomized trial in Type 1 diabetes mellitus (T1DM) suggests that rt-CGM may offer advantages over is-CGM, including reduced time in hypoglycemia and less fear of hypoglycemia (FoH) [12]. Supporting this, a retrospective observational study from the Canadian LMC Diabetes Registry found significantly greater glucose reductions with rt-CGM compared with is-CGM in individuals with T1DM [13].
Although numerous studies have demonstrated the cost-effectiveness of both rt-CGM and is-CGM compared with SMBG in T2DM [14–20], including in Canada [14], and even in T1DM [21–25], no studies to our knowledge have evaluated the cost-effectiveness of rt-CGM versus is-CGM in T2DM. Filling this gap is especially important given the potential for clinical differences between the two technologies and the need to ensure efficient use of healthcare resources.
Objectives
This study uses a patient-level simulation model to evaluate the long-term cost-effectiveness of the Dexcom G7 rt-CGM system versus is-CGM in insulin-treated individuals with T2DM from the Canadian healthcare system perspective.
Materials & methods
A model-based cost-effectiveness analysis was conducted by simulating costs and clinical outcomes over a 30-year time horizon (sufficient to cover the lifetime of most simulated patients) for 1000 cohorts of 2000 unique hypothetical people with insulin-treated T2DM, comparing real-time continuous glucose monitoring (rt-CGM) and intermittent self-monitoring (is-CGM) from a healthcare perspective in Canada. To determine whether an intervention can be considered to be cost-effective, we adopted the commonly used willingness-to-pay (WTP) threshold of CAD 50,000 per quality-adjusted life-years (QALY) gained for Canada [24,26,27]. This study adhered to the diabetes-specific “Checklist of Reporting Model Input in Diabetes Health Economics Studies” issued by The Mount Hood Diabetes Challenge Network [28] (Supplementary Appendix 5) and the universal Consolidated Health Economic Evaluation Reporting Standards (CHEERS) checklist [29], during both the setup and reporting phases (Supplementary Appendix 6).
The model
The Economic and Health Outcomes Model of Type 2 Diabetes (ECHO-T2DM) is a validated patient-level microsimulation tool, programmed in R, developed to assess the long-term clinical and economic impact of treatment strategies for T2DM [16,22]. The model uses Monte Carlo simulation to track disease progression in individual patients over a user-defined time horizon with annual cycles. It incorporates both first- and second-order uncertainty. Key patient characteristics – such as age, sex, disease duration, HbA1c levels – and treatment sequences are included, allowing for personalized therapeutic pathways and intensification rules.
The ECHO-T2DM captures the onset and progression of diabetes-related complications, including microvascular (e.g., nephropathy, neuropathy, CKD) and macrovascular outcomes (e.g., myocardial infarction, stroke, heart failure), using risk equations such as the UKPDS Outcomes Model 2 (UKPDS-OM2) [28], as applied in previous Canadian Agency for Drugs and Technologies in Health (CADTH) studies [30]. The model incorporates treatment effects, adverse events (including severe hypoglycemia [SHE] and severe hyperglycemia) and noncompliance. Outputs include biomarker trajectories, complication rates, life expectancy, QALYs and costs – both total and disaggregated – along with standard economic outcomes such as incremental cost-effectiveness ratios (ICERs) and incremental net monetary benefits (iNMBs). Additional model details are provided in Supplementary Appendix 1; model validation results are presented in Supplementary Appendix 2.
Target population
The analysis focused on insulin-treated individuals with T2DM who are eligible for rt-CGM use. Distributions of baseline characteristics were derived from the Kaiser Permanente Northern California diabetes registry, an extensive database established in 1994 for an integrated healthcare system serving over 4.4 million members. Specifically, patient demographics and clinical parameters were randomly sampled from distributions reflecting real-world characteristics of 344 people with T2DM who initiated rt-CGM between 2015 and 2019 [31]. Table 1 summarizes key baseline characteristics used in the model application.
| Parameter | Type 2 diabetes Kaiser study population [31] | |
|---|---|---|
| Mean/% | SD | |
| Demographics | ||
| Age (years) | 60.0 | 10.4 |
| Males (%) | 51% | n/a |
| Disease duration (years) | 17.1 | 11.1 |
| Ethnicity/race (%) | ||
| African–Americans | 8.7% | n/a |
| American–Indians | 0.0% | n/a |
| Hispanics | 0.1% | n/a |
| Clinical indicators | ||
| Smokers | 5.9% | n/a |
| HbA1c (%) | 8.67 | 0.90 |
| SBP (mmHg) | 130.70 | 15.70 |
| BMI (kg/m2) | 33.40 | 7.50 |
| WBC (*106) | 6.80 | 0.00 |
| HR (beats/minute) | 72.00 | 0.00 |
| Total cholesterol (mg/dl) | 156.50 | 43.10 |
| LDL cholesterol (mg/dl) | 81.40 | 33.30 |
| HDL cholesterol (mg/dl) | 44.60 | 12.20 |
| Triglycerides (mg/dl) | 170.60 | 136.70 |
| eGFR (ml/min/1.73 m2) | 72.80 | 26.60 |
| Atrial fibrillation (%) | 5.1% | n/a |
| Prescence of co-morbidities at baseline (%) | ||
| Macrovascular | ||
| IHD (not including MI) | 11.60% | n/a |
| MI | 5.10% | n/a |
| CHF | 14.10% | n/a |
| Stroke | 3.70% | n/a |
| Microvascular | ||
| NPDR | 33.10% | n/a |
| ME | 9.00% | n/a |
| PDR | 9.20% | n/a |
| Blindness | 3.00% | n/a |
| Microalbuminuria | 54.70% | n/a |
| Macroalbuminuria | 10.10% | n/a |
| ESRD | 2.20% | n/a |
| Symptomatic neuropathy | 44.70% | n/a |
| Symptomatic PVD | 14.60% | n/a |
| Diabetic foot ulcer | 10.00% | n/a |
| LEA | 3.30% | n/a |
CHF: Congestive heart failure; eGFR: Estimated glomerular filtration rate; ESRD: End-stage renal disease; HDL: High density lipoprotein; HR: Heart rate; IHD: Ischemic heart disease; LDL: Low density lipoprotein; LEA: Lower extremity amputation; ME: Macular edema; MI: Myocardial infarction; n/a: not applicable; NPDR: Nonproliferative diabetic retinopathy; PDR: Proliferative diabetic retinopathy; PVD: Peripheral vascular disease; SBP: Systolic blood pressure; SD: Standard deviation; WBC: White blood cell count.
Treatment
At simulation start, the new interventions of rt-CGM or is-CGM are added on current treatment of insulin and comparative efficacy and safety are presented in Table 2. Background insulin treatment was not modeled explicitly, and intensification of insulin treatment was not considered in the analysis.
| Parameters | rt-CGM | is-CGM | ||
|---|---|---|---|---|
| Mean | SE | Mean | SE | |
| Treatment effects | ||||
| HbA1c, % | -0.33 | 0.27 | 0.00 | 0.00 |
| Rates of adverse events (per PY): | ||||
| Severe hypoglycemia | 0.000 | – | 0.014 | – |
| Severe hyperglycemia | 0.000 | – | 0.031 | – |
| Discontinuation due to AE, % | 0.000 | – | 0.000 | – |
AE: Adverse event; is-CGM: Itermittently scanned continuous glucose monitoring; PY: Person-year; rt-CGM: Real-time continuous glucose monitoring; SE: Standard error.
Treatment effects
Since no head-to-head trials comparing rt-CGM and is-CGM in individuals with T2DM were available, an indirect treatment comparison (ITC) was conducted following the CADTH-recommended methods for meta-analysis [32]. This approach estimates relative treatment effects using studies with a shared comparator – in this case, SMBG. The Bucher approach [33] was used to adjust for differences between studies. Two clinical trials were selected: the daily injections and CGM in diabetes for Type 2 diabetes study (DIAMOND T2D) [34], which assessed rt-CGM versus SMBG in 158 participants, and REPLACE [35], which compared is-CGM versus SMBG in 224 participants. Both trials enrolled individuals with T2DM on intensive insulin therapy and had 6-month follow-up periods. Baseline characteristics were comparable. Several clinical outcomes were used to estimate treatment effects: HbA1c reduction, SHE and severe hyperglycemia. Rt-CGM was estimated to result in a 0.33% greater reduction in HbA1c compared with is-CGM. It was assumed that rt-CGM and is-CGM had no impact on other biomarkers. For SHE, no event was recorded in DIAMOND T2D and, as such, it was assumed that the rate for rt-CGM was zero. For is-CGM, an estimated event rate of 0.0136 (per patient-year) was assumed based on the REPLACE study. Time above range was used to assess severe hyperglycemia risk, which showed a greater reduction with rt-CGM compared with is-CGM. Based on the evidence, it was assumed that rt-CGM was associated with no risk of severe hyperglycemia while is-CGM was associated with an event rate of 0.0313 per year. Full details of these parameters and the rationale behind their selection are provided in Supplementary Appendix 3. The impact of these assumptions is tested in sensitivity analysis, specifically, the risk of severe hyperglycemia was assumed to be zero and the risk of SHE was reduced by 50%. Finally, following the one-time HbA1c-lowering, long-term upward drift of 0.15% per year was applied to HbA1c, consistent with the UKPDS follow-up data [36]. No long-term upward drift effects were assumed for the other biomarkers.
Unit costs
Unit costs for diabetes-related complications – including ischemic heart disease, myocardial infarction, stroke, retinopathy, neuropathy, chronic kidney disease (CKD) and amputation) – and adverse events – including SHE and severe hyperglycemia – were sourced primarily from the CADTH Optimal Use Report from 2013 [37], which has also been used in a recent evaluation of rt-CGM versus SMBG in Canada [14], with additional published sources used where necessary. Costs for fatal and nonfatal macrovascular events were assumed to be equivalent. Cost for severe hyperglycemic events could not be identified, and was assumed to be equivalent to diabetic ketoacidosis [38]. Unit costs and their sources are described in Supplementary Table A4. Values were inflated to 2023 Canadian dollars and discounted at an annual rate of 1.5%, in accordance with Canadian guidelines [30]. Annual monitoring acquisition costs were CAD 2700 for rt-CGM (Dexcom G7 list price, including 36 sensors) and CAD 2136 for is-CGM (Freestyle Libre two list price, including 26 sensors).
QALY utility weights
Patient preferences for health were sourced primarily from a comprehensive review performed by Beaudet et al. [39], which compiled published QALY disutility weights from studies in individuals with T2DM (Supplementary Table A5). This has been done in previous cost-effectiveness applications [14,24]. Recommended disutility weights in the review mostly originate from studies conducted in Europe and North America, making them broadly applicable to the Canadian population. Stage-specific disutility weight associated with CKD were sourced from other peer-reviewed studies [40,41]. For SHE and severe hyperglycemia events, QALY disutility weights are applied on a per-event basis and multiplied by the simulated number of events. Specifically, the QALY decrement for SHE was sourced from Evans et al. [42]. To account for diminishing marginal disutility associated with repeated hypoglycemic events, the per-event utility losses were scaled using power coefficients provided by Lauridsen et al. [43]. For severe hyperglycemia, the disutility was assumed to be -0.01 in line with a previous cost-effectiveness analysis [14]. In addition to the health state-related utility values, a direct QALY utility benefit associated with the use of Dexcom rt-CGM device was included to reflect the reduced FoH compared with is-CGM [8,44,45]. Due to limited direct evidence for this effect in T2DM populations, a utility benefit of 0.02536 was applied, based on results from the ALERTT-1 study in individuals with T1DM [44]. QALY outcomes were discounted at an annual rate of 1.5% per year, as recommended by the Canadian Guidelines [30].
Outcomes
Biomarker evolution curves and event rates of micro- and macrovascular complications were simulated over 30 years rt-CGM versus is-CGM. Associated differences for the costs and QALYs were generated for rt-CGM versus is-CGM from which ICERs, scatterplots of the cost-effectiveness planes, and cost-effectiveness acceptability curves were computed. Finally, iNMB – calculated as the product of incremental health benefits and the WTP for them less incremental costs or, in this case, ΔQALYs·WTP – ΔCosts – was also calculated to address limitations associated with ICERs, such as difficulties in interpreting results when interventions are more effective and less costly [46].
Sensitivity analysis
To evaluate the robustness of model outcomes to uncertainty in key parameters, deterministic sensitivity analysis involving clinical, utility, acquisition cost and time domains was conducted (Supplementary Table A8). In total, 18 sensitivity analysis scenarios were evaluated, encompassing both one-way and multiway sensitivity analyses of the following assumptions:
Clinical assumptions
We tested alternative assumptions regarding the frequency and severity of glycemic events:
•
SHE: 50% reduction.
•
Severe hyperglycemia: no increased risk, 50% reduction in risk.
Utility assumptions
•
FoH: Utility gain from reduced fear eliminated (i.e., no effect) or reduced by 50%.
•
Complication-related disutility weights: alternative set of published QALY disutility weights [47].
Acquisition cost assumptions
•
rt-CGM device costs: price rebates ranging from 25 to 70%.
•
Test strip costs: no additional costs for test strips.
Time horizon
•
Shorter and longer: 10, 20 and 40 years.
Discount rate
•
0 and 3% discount rate for costs and QALYs.
Results
Base case
Over a 30-year time horizon, rt-CGM was associated with lower overall costs and improved health outcomes than is-CGM, establishing rt-CGM as the dominant strategy (Table 3). Specifically, treatment with rt-CGM result in CAD 2237 lower overall costs relative to is-CGM, while providing gains of 0.022 additional life-years and 0.346 additional QALYs, yielding an iNMB of CAD 19,518 at a WTP of CAD 50,000 per QALY. There were three primary drivers of the results, first, greater initial HbA1c reduction (Supplementary Figure A2) led to downstream reductions in the incidence of long-term diabetes-related complications (Supplementary Table A6), including myocardial infarction, heart failure, end-stage renal disease, background and proliferative diabetic retinopathy, macular edema and blindness, which in turn led to greater survival (Supplementary Figure A3). Second, lower rates of SHE and severe hyperglycemic events yielded both more QALYs (Supplementary Table A7) as well as associated cost savings (Table 3). Finally, less FoH for rt-CGM was associated with QALY gains compared with is-CGM (Supplementary Table A7).
| rt-CGM | is-CGM | Difference | |
|---|---|---|---|
| Costs (discounted) | |||
| Treatment (CAD) | |||
| CGM | 31,204 | 27,336 | 3867 |
| Hypertension | 463 | 462 | 1 |
| Dyslipidemia | 2048 | 2044 | 3 |
| Macro and microvascular complications (CAD) | |||
| MI | 9355 | 9556 | -200 |
| IHD | 4851 | 4854 | -2 |
| CHF | 13,803 | 13,723 | 81 |
| Stroke | 5659 | 5744 | -85 |
| PVD | 1324 | 1320 | 3 |
| Retinopathy (CAD) | 6331 | 6581 | -250 |
| CKD | 92,206 | 92,386 | -180 |
| Neuropathy | 6759 | 6836 | -77 |
| Foot ulcers | 1800 | 1791 | 9 |
| Amputations | 8645 | 8706 | -61 |
| Adverse events (CAD) | |||
| Severe hypoglycemia | 0 | 286 | -286 |
| Severe hyperglycemia | 0 | 5 058 | -5058 |
| Total costs (CAD) | 184,446 | 186,683 | -2237 |
| Health outcomes (discounted) | |||
| LY’s | 11.719 | 11.697 | 0.022 |
| QALY’s | 6.822 | 6.476 | 0.346 |
| Survival at end of year 30† | 7.6% | 7.5% | 0.1% |
| Incremental cost per QALY gained | rt-CGM dominates |
†
Percent alive at simulation end.
CAD: Canadian Dollar; CGM: Continuous glucose monitoring; CHF: Congestive heart failure; CKD: Chronic kidney disease; IHD: Ischemic heart disease; is-CGM: Itermittently scanned continuous glucose monitoring; LY: Life-year; MI: Myocardial infarction; PVD: Peripheral vascular disease; QALY: Quality-adjusted life year; rt-CGM: Real-time continuous glucose monitoring.
Although the acquisition costs over 30 years for rt-CGM were CAD 3867 higher than that of is-CGM (Table 3), these additional costs were more than offset by savings from avoided acute and chronic complications. The largest cost offset resulted from the avoidance of severe hyperglycemic events, which accounted for a savings of CAD 5058. Additional cost offsets were attributed to avoided SHE (CAD 286), retinopathy (CAD 250), myocardial infarctions (CAD 200) and CKD (CAD 180).
The observed QALY gain of 0.346 was largely driven by QALY gains derived from reduced FoH. Gains from extended survival contributed an additional 0.018 QALYs. Smaller QALY gains were derived from the avoidance of micro- and macrovascular complications, particularly retinopathy (0.011 QALYs), as well as from fewer SHE and severe hyperglycemic events (0.007 and 0.004, respectively) (Supplementary Table A4).
Analysis confirms that these findings were robust to uncertainty in model parameters. As shown in the cost-effectiveness scatterplot (Figure 1), 57% of the cohort replications were consistent with rt-CGM dominance over is-CGM, falling in the southeast quadrant of the plot (i.e., with more QALYs and lower costs). For model convergence across simulated cohort, see Supplementary Figure A4. When applying commonly used WTP thresholds for QALYs, the probability that rt-CGM is cost-effective relative to is-CGM is substantial across a wide range of WTP values. At a threshold of CAD 50,000 per QALY gained, for example, the probability that rt-CGM is cost-effective reached approximately 98% (Figure 2).
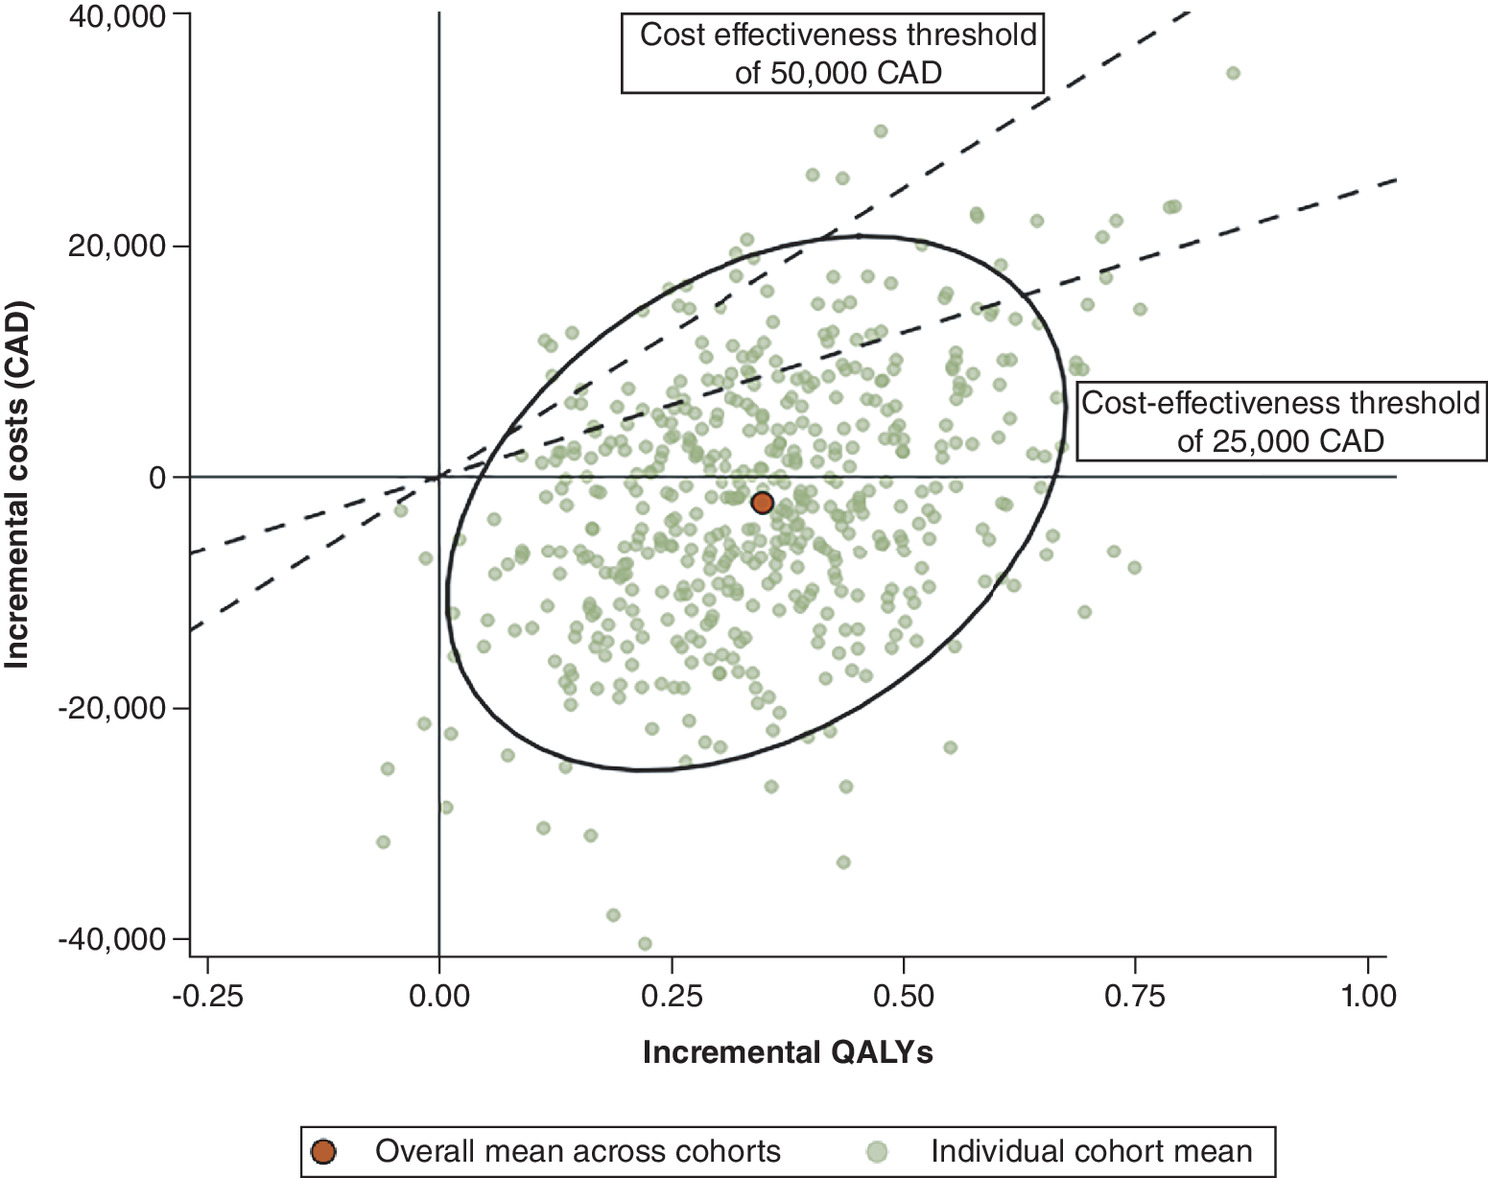
Figure 1. Cost-effectiveness plane for real-time continuous glucose monitoring versus intermittently scanned CGM.
The red circle indicates the mean value across iterations.
CAD: Canadian Dollar; QALY: Quality adjusted life year.
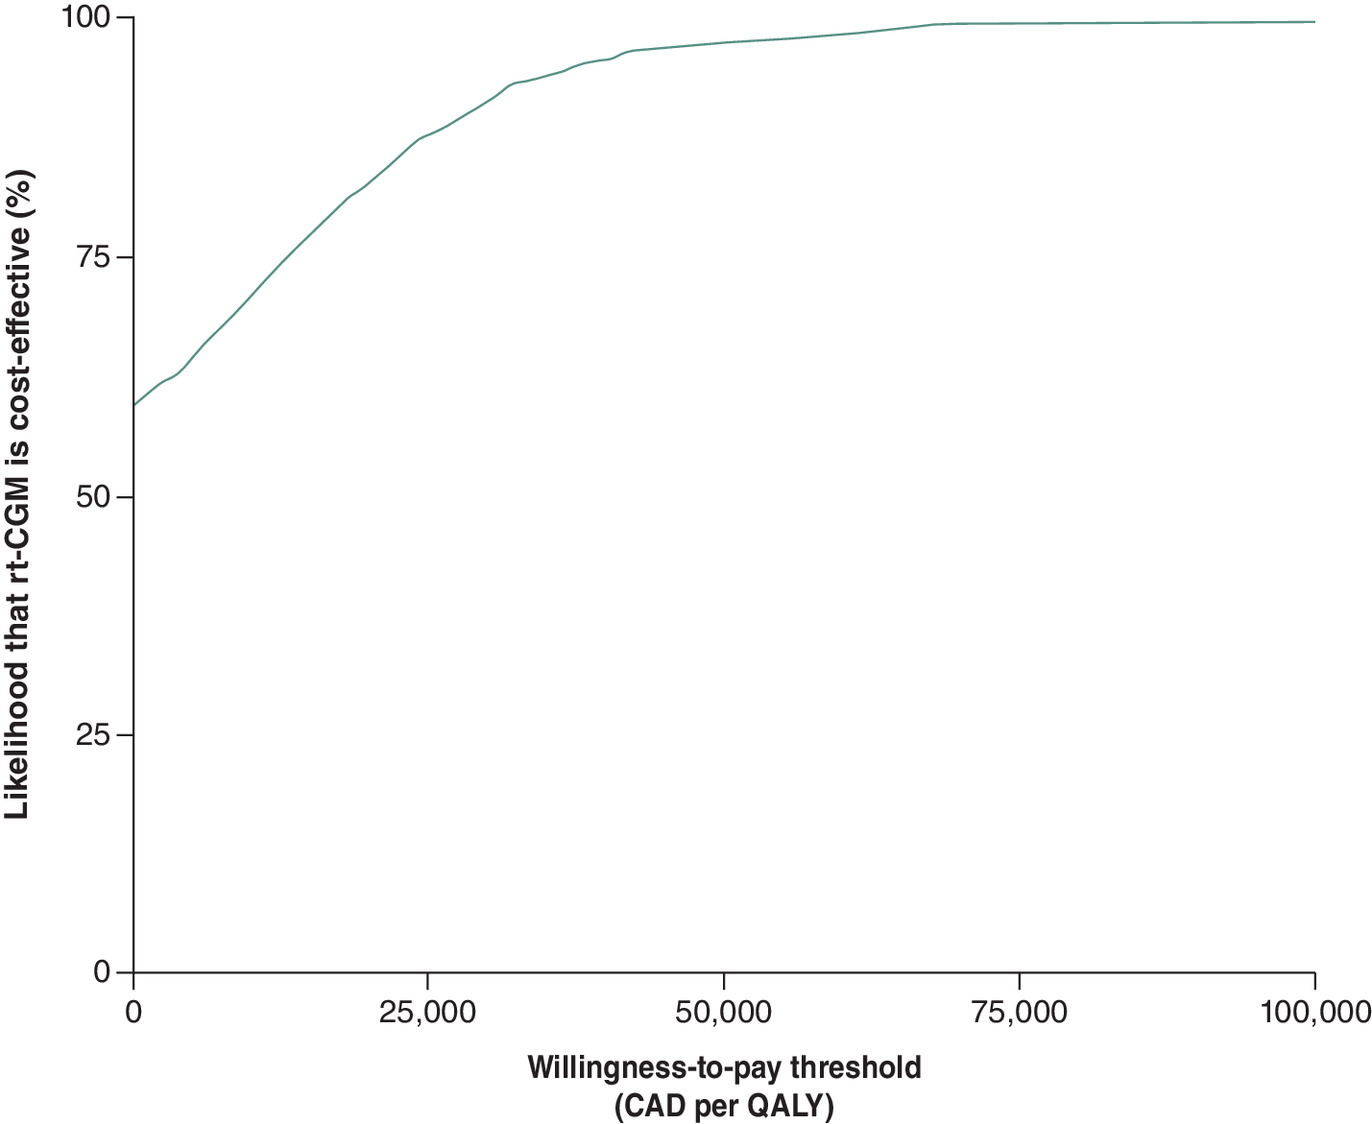
Figure 2. Cost-effectiveness acceptability curve for real-time continuous glucose monitoring.
CAD: Canadian Dollar; QALY: Quality-adjusted life year.
Sensitivity analysis
Consistent with the base case, rt-CGM dominated is-CGM in 14 of the 18 sensitivity analyses, with ICERs below conventional willingness-to-pay thresholds in the remaining four scenarios and iNMB ranging from CAD 4659 when assuming no FoH utility for rt-CGM to CAD 37,936 when assuming a 65% rebate rt-CGM list price (Figure 3 and Supplementary Table A8). Assumptions about treatment effects had a notable impact on both cost offsets and QALY gains, accounting for three of the four scenarios in which rt-CGM switched from dominance to having positive ICERs, which ranged from CAD 861 to CAD 17,684 per QALY gained (iNMB ranging from CAD 6803 to CAD 16,893). When the risk of severe hyperglycemia was removed entirely (SA2), QALY gains decreased slightly, but the removal of severe hyperglycemic risk reversed cost savings, resulting in a cost increase of CAD 3723 and an ICER of CAD 10,387 per QALY gained (iNMB of CAD 14,198). In contrast, a 50% risk reduction (SA1) led to near cost neutrality (CAD 296) and a much lower ICER of CAD 861 (iNMB of CAD 16,893). When both severe hyperglycemic effects and the benefit from reduced FoH were removed (SA3), QALY gains dropped further (0.211 vs 0.346 in the base case) and the ICER increased to CAD 17,684 (iNMB of CAD 6803).
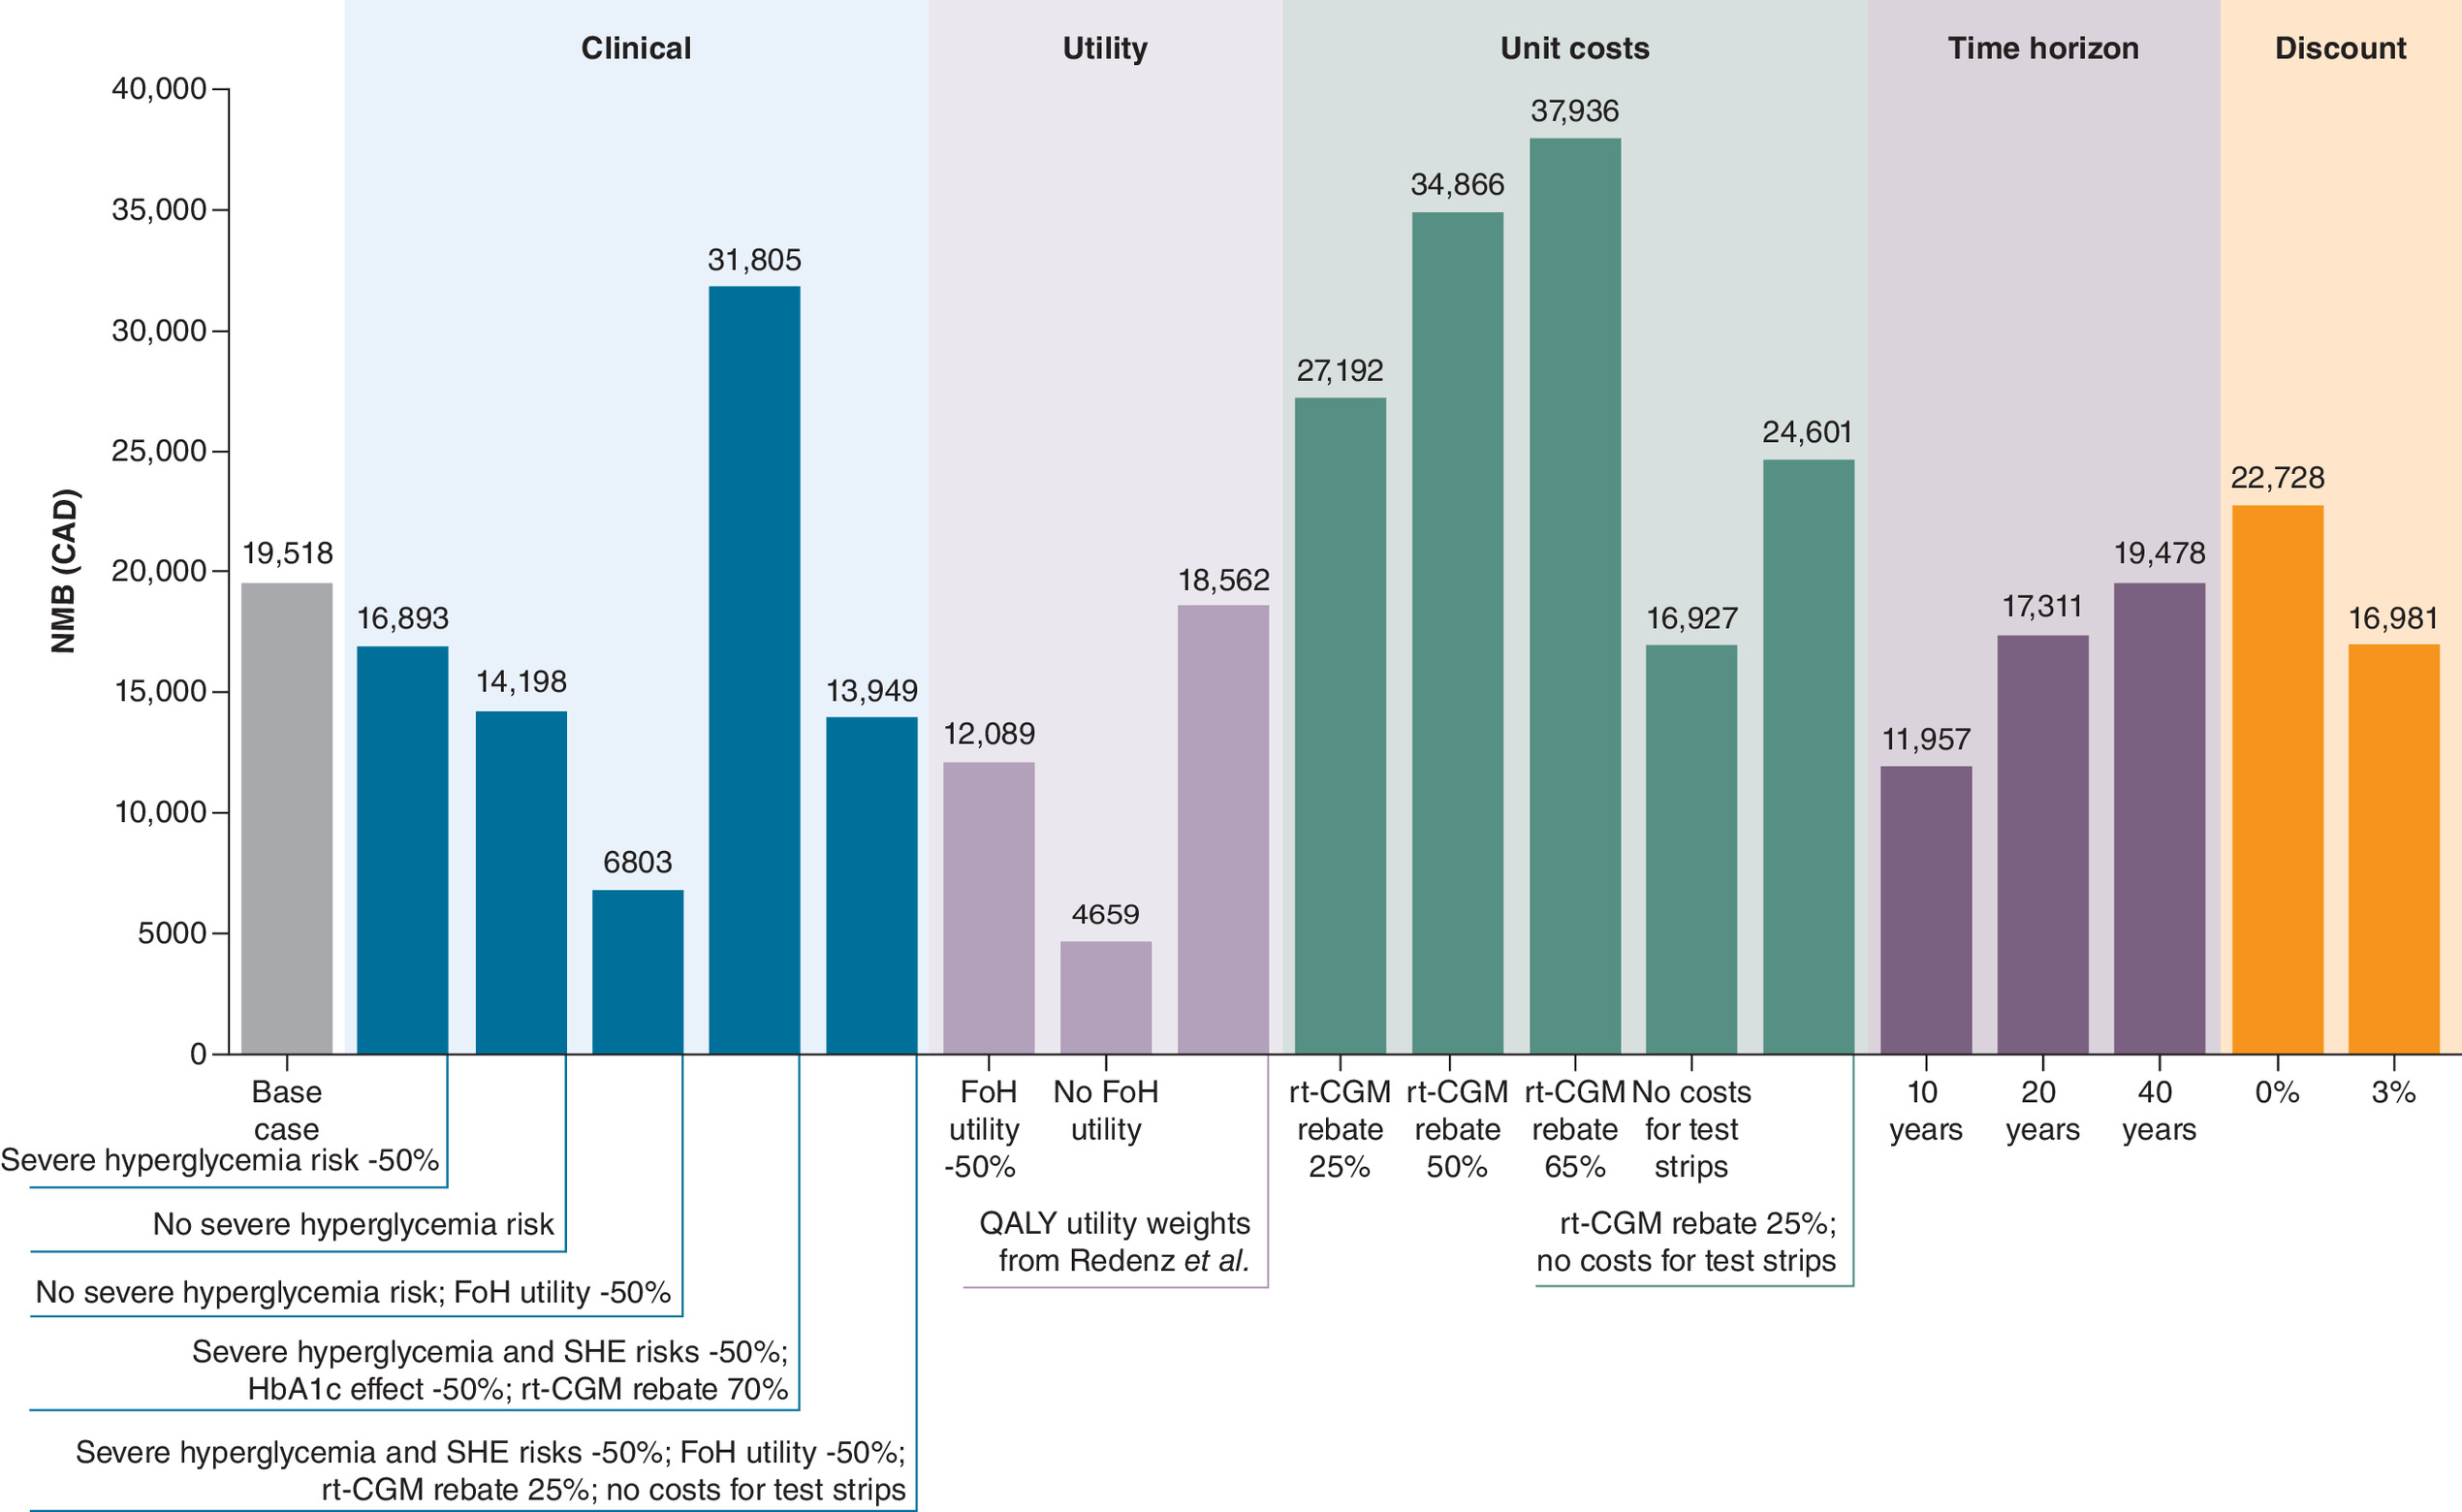
Figure 3. Incremental net monetary benefit of sensitivity analysis comparing real-time continuous glucose monitoring with intermittently scanned continuous glucose monitoringin people with Type 2 diabetes mellitus*.
*One-way sensitivity analysis presented first for each category.
CAD: Canadian Dollar; FoH: Fear of hypoglycemia; iNMB: Incremental net monetary benefit; SHE: Severe hypoglycemic event; QALY: Quality-adjusted life-year.
The assumed utility benefits of reducing FoH was a key driver of QALY gains. Removing FoH benefits entirely (SA7) reduced QALY gains from 0.346 to 0.048, but cost offsets remained similar, and rt-CGM continued to dominate. Reducing FoH benefits by 50% (SA6) resulted in lower QALY gains (0.197 vs 0.346), though cost savings remained stable, preserving dominance.
Cost-effectiveness was also influenced by device acquisition costs and testing supplies. When a 25% rebate on rt-CGM was assumed (SA9), cost savings increased from CAD 2,237 in the base case to CAD 9911. Increasing the rebate to 50% (SA10) and 65% (SA11) further increased savings to CAD 17,585 and CAD 20,654, respectively. A scenario combining an even more aggressive 70% rebate with a 50% reduction in treatment effects (SA4) led to CAD 21,533 in cost savings while still yielding a QALY gain of 0.205. Additionally, a scenario reflecting both reduced device pricing and lower monitoring costs (SA13), combining a 25% rebate with the exclusion of test strip costs resulted in CAD 7319 in cost savings. However, excluding test strip costs without a rebate (SA12) led to higher total costs for rt-CGM (CAD 355 higher) and an ICER of CAD 1026 (iNMB of CAD 16,927).
As expected, shortening the time horizon reduced both cost savings and QALY gains. Shortening the time horizon to 10 years (SA14) reduced both cost savings (CAD 1309) and QALY gains (0.213 vs 0.346). A 20-year time horizon (SA15) yielded slightly higher QALY gains (0.315), with cost savings remaining similar to the base case. In contrast, extending the time horizon to 40 years (SA16) resulted in greater QALY gains (0.369), although cost offsets were smaller (CAD 1016 in cost savings).
Assuming a 0% discount increased both cost-savings (CAD 2610) and QALY gains (to 0.402 from 0.346), while discounting by 3% reduced both cost-savings (CAD 1939) and QALY gains (to 0.301 from 0.346).
Discussion
The model-based microsimulation results suggest that rt-CGM dominates is-CGM – that is, provides better outcomes at lower total cost – for insulin-treated individuals with T2DM from a healthcare payer perspective in Canada. In the base case analysis, rt-CGM was associated with an additional 0.346 QALYs and a cost savings of CAD 2237. In probabilistic sensitivity analysis, rt-CGM dominated is-CGM in the majority of cohort replications and was cost-effective at the commonly accepted threshold of CAD 50,000 per QALY gained in 98% of the replications.
The improved health and cost outcomes were primarily driven by QALY gains from reduced FoH, fewer SHE and severe hyperglycemic events, and improved glycemic control resulting in fewer micro- and macrovascular complications. These benefits are consistent with known technological differences between rt-CGM and is-CGM – such as automated real-time data transmission, predictive alerts and passive glucose monitoring – which may support more timely decision-making and improved treatment adherence. In contrast, is-CGM requires manual scanning and lacks alert functions, which may limit its effectiveness in some user populations. These advantages may be especially relevant in subgroups such as individuals with impaired hypoglycemia awareness or children and adolescents, where caregiver access to real-time data can facilitate safer and more responsive diabetes management [8].
Deterministic sensitivity analyses further supported the robustness of the base case, with rt-CGM continuing to dominate is-CGM under most scenarios and iNMB is positive for all scenarios. Even in extreme cases – such as when the risk of hyperglycemia with is-CGM was assumed to be zero and the utility value for FoH was reduced by 50% – rt-CGM maintained an ICER of CAD 17,684, well below the commonly accepted willingness-to-pay threshold of CAD 50,000, and an iNMB of CAD 6803.
To our knowledge, this is the first study to evaluate the cost-effectiveness of rt-CGM relative to is-CGM in insulin-treated individuals with T2DM, several studies have examined the cost-effectiveness of rt-CGM relative to SMBG in both T1DM and T2DM settings in Canada. For example, Roze et al. [24] found rt-CGM to be cost-effective versus SMBG in people with T1DM, while Alshannaq et al. [14] reached a similar conclusion for individuals with T2DM on insulin therapy. The cost-effectiveness of rt-CGM versus SMBG has also been demonstrated in an array of other settings for both T1DM and T2DM [15,17,19–23,25], including the US [17], France [15,25], UK [19,23], Denmark [21], Australia [22] and South Korea [20]. Our findings suggest that rt-CGM may also represent a cost-effective, and potentially cost-saving, alternative to is-CGM in the Canadian setting. These results provide additional insight to inform resource allocation decisions regarding CGM technologies.
As with all model-based economic evaluations, the results are dependent on the structure of the model and quality of input data. This study was conducted using the ECHO-T2DM model, which has undergone extensive validation [48,49]. This analysis used the best available macrovascular and mortality risk equations (UKPDS-OM2 [50]), which account for the complex, multi-organ nature of T2DM and were derived from more than 89,000 patient-years of data. Additionally, QALY disutility weights were sourced from a comprehensive review by Beaudet et al. [39], which included a wide range of T2DM populations in Europe and North America, ensuring that the disutility values are applicable to the Canadian context. Many modeling assumptions were intentionally conservative; for instance, efficacy inputs for rt-CGM were drawn from the DIAMOND T2D trial, which evaluated an older version of the rt-CGM device (Dexcom G4), potentially underestimating the performance of current technologies such as the Dexcom G7.
However, some limitations must be acknowledged. The absence of head-to-head clinical trials comparing rt-CGM with is-CGM in insulin-treated individuals with T2DM prompted the use of indirect treatment comparisons, which introduces uncertainty despite their methodological validity [32,33] and acceptance when direct comparisons are unavailable [32,51,52]. In addition, the DIAMOND T2D (n = 158) and REPLACE (n = 224) trials were modest in size and only 6 months in duration, which introduces additional uncertainty when extrapolating outcomes over a lifetime horizon. The assumption of a differential effect on glycemic control between rt-CGM and is-CGM is supported, however, by observational data from the Canadian LMC Diabetes Registry [13] and a study reporting improved adherence and usability with rt-CGM [53]. The model simplified treatment regimens by not explicitly modeling insulin dose adjustments or intensification, as these details were not available from the source trials. This limitation means that potential differences in insulin use between rt-CGM and is-CGM could not be captured. Another limitation is that the utility gain for reduced FoH was taken from a Type 1 diabetes population (ALERTT-1), as no published data were available for insulin-treated T2DM. Although this assumption may differ from the true effect in T2DM, sensitivity analyses showed that even when the benefit was halved or removed entirely, rt-CGM remained either dominant or cost-effective. A further limitation relates to the modeling of glycemic outcomes: the model did not explicitly incorporate the important TAR and TBR indicators of glycemic control, which have only recently become measurable in continuous time at scale and are yet to be incorporated into the risk equations that economic modelers use. Instead, these factors were used as proxies for SHE and severe hyperglycemia. Although assigning zero risk to rt-CGM may underestimate absolute event rates, sensitivity analyses that reduced or eliminated risk for the is-CGM arm showed that the conclusions were preserved, indicating that the results are not driven by this assumption. This analysis implicitly assumed equal access to rt-CGM across eligible patients, whereas in practice, uptake may be influenced by insurance coverage, socioeconomic status and regional differences in reimbursement. These factors could affect generalizability and the extent to which the modeled results are realized in practice. Finally, several cost inputs, particularly for diabetes-related complications, were drawn from older Canadian sources and inflated to current dollars. While consistent with prior evaluations, this approach underscores the need for updated Canadian cost data to strengthen future analyses. Additionally, the model simplifies treatment regimens and assumes full adherence, which may not reflect real-world variation in behavior. While this could limit generalizability, model-based analysis remains a standard approach for cost-effectiveness analysis in the absence of direct long-term clinical trial data. Lastly, differences in healthcare delivery, costs and patient populations may also limit the generalizability of results beyond the Canadian setting.
Future research can increase the precision of estimates and improve their relevance for decision-making. Important areas include the generation of comparative clinical evidence – ideally through head-to-head trials with longer follow-up or real-world comparative effectiveness studies of rt-CGM versus is-CGM in insulin-treated individuals with T2DM – and greater attention to the patient-specific factors such as adherence and comorbidities. Evaluating cost-effectiveness across patient subgroups, updating cost data to reflect evolving device pricing and healthcare utilization, and developing T2DM-specific utility data for outcomes such as FoH will further strengthen analyses. Additional work is also needed to generate evidence suitable for integrating biomarkers such as time above range and time below range directly into long-term complication modeling.
Conclusion
A validated economic model was used to simulate 30-year costs and health outcomes for rt-CGM and is-CGM. While uncertainty stemming from indirect comparisons and necessary model assumptions should be taken into account when interpreting the results, findings suggest that rt-CGM is likely to be a cost-effective – and potentially cost-saving – treatment option for insulin-treated individuals with T2DM in Canada.
Summary points
•
Nearly one Canadian in three is affected by diabetes or prediabetes, contributing to high complication rates and escalating healthcare costs – projected to reach CAD 39 billion by 2028 – placing a major and growing strain on the healthcare system and underscoring the need for effective, efficient interventions.
•
While both real-time continuous glucose monitoring (rt-CGM) and intermittently scanned CGM (is-CGM) improve glycemic outcomes relative to self-monitoring of blood glucose, no prior study in Type 2 diabetes has directly estimated the cost-effectiveness of rt-CGM versus is-CGM. This analysis addresses that gap by evaluating the value-for-money of rt-CGM in insulin-treated individuals with Type 2 diabetes in Canada.
•
We conducted a model-based cost-utility analysis using the validated ECHO-T2DM microsimulation model, simulating lifetime clinical and economic outcomes for insulin-treated individuals with Type 2 diabetes mellitus (T2DM) from the Canadian public healthcare payer perspective.
•
Rt-CGM provided better lifetime health outcomes at lower overall cost than is-CGM, yielding CAD 2237 in cost savings and 0.346 additional quality-adjusted life-years in the base-case analysis, making it a dominant strategy.
•
Health and economic gains were driven by three key mechanisms: fewer glycemic events (severe hypo and hyperglycemia), reduced fear of hypoglycemia and greater glucose reductions leading to lower rates of long-term micro- and macrovascular complications.
•
Findings were robust across 18 sensitivity analyses, with rt-CGM remaining cost-saving or cost-effective at conventional willingness-to-pay thresholds in Canada in all scenarios. In uncertainty analysis, the probability that rt-CGM is cost-effective versus is-GCM reached 98% at a willingness-to-pay threshold of CAD 50,000 per quality-adjusted life-year.
•
These results support coverage of rt-CGM for eligible insulin-treated individuals with T2DM in Canada, offering both improved health outcomes and more efficient use of healthcare resources.
Author contributions
H Alshannaq, J Matuoka and G Norman conceived the study. M Willis and A Nilsson designed and conducted the analyses. M Willis and A Nilsson drafted the manuscript. All authors contributed to data interpretation and all authors reviewed and edited the manuscript. All authors approved the final version of the manuscript.
Acknowledgments
Medical writing support and editorial assistance was provided by Karin Wahlberg of the Swedish Institute for Health Economics.
Data availability
All model inputs used in this study are described or included in this article and the Electronic Supplementary Material. The economic model used in this study is proprietary intellectual property. For access, please contact Michael Willis ([email protected]).
Financial disclosure
Dexcom, Inc. financed the study
Competing interests disclosure
M Willis and A Nilsson are employees of the Swedish Institute for Health Economics, which provides consulting services for governmental bodies, academic institutions and commercial life science enterprises (including Dexcom). The authors had independent control of the manuscript. H Alshannaq is a former employee at Dexcom, Inc. J Matuoka and G Norman are employees at Dexcom, Inc. The authors have no other competing interests or relevant affiliations with any organization or entity with the subject matter or materials discussed in the manuscript apart from those disclosed.
Writing disclosure
No funded writing assistance was utilized in the production of this manuscript.
Open access
This work is licensed under the Attribution-NonCommercial-NoDerivatives 4.0 Unported License. To view a copy of this license, visit https://creativecommons.org/licenses/by-nc-nd/4.0/
Supplementary Material
References
Papers of special note have been highlighted as: • of interest; •• of considerable interest
1.
Diabetes Canada. Type 2 diabetes. Available from: https://www.diabetes.ca/en-CA/about-diabetes-(3)/type-2 (Accessed: 5 May 2024).
2.
Diabetes Canada. Diabetes rates continue to climb in Canada. (2022). Available from: https://www.diabetes.ca/media-room/press-releases/diabetes-rates-continue-to-climb-in-canada (Accessed: 5 May 2024).
3.
Diabetes Canada. Diabetes in Canada. Available from: https://www.diabetes.ca/advocacy---policies/advocacy-reports/national-and-provincial-backgrounders/diabetes-in-canada (Accessed: 5 May 2024).
4.
Public Health Agency of Canada. Economic burden of illness in Canada, 2005–2008. (2014). Available from: https://www.phac-aspc.gc.ca/publicat/ebic-femc/2005-2008/assets/pdf/ebic-femc-2005-2008-eng.pdf (Accessed: February 2025).
5.
Government of Canada. Universal access to diabetes medications, and diabetes device fund for devices and supplies. (2024). Available from: https://www.canada.ca/en/health-canada/news/2024/02/universal-access-to-diabetes-medications-and-diabetes-device-fund-for-devices-and-supplies.html (Accessed: 20 May 2024).
6.
Shah BR, Bajaj HS, Butalia S et al. Pharmacologic glycemic management of Type 2 diabetes in adults – 2024 update. Can. J. Diabetes 48(7), 415–424 (2024).
7.
Diabetes Canada Clinical Practice Guidelines Expert Committee. Diabetes Canada 2018 clinical practice guidelines for the prevention and management of diabetes in Canada. Can. J. Diabetes 42(Suppl. 1), S1–S325 (2018).
8.
Edelman SV, Argento NB, Pettus J, Hirsch IB. Clinical implications of real-time and intermittently scanned continuous glucose monitoring. Diabetes Care 41(11), 2265–2274 (2018).
9.
Reddy M, Oliver N. The role of real-time continuous glucose monitoring in diabetes management and how it should link to integrated personalized diabetes management. Diabetes Obes. Metab. 26(Suppl. 1), 46–56 (2024).
10.
Jancev M, Vissers T, Visseren FLJ et al. Continuous glucose monitoring in adults with type 2 diabetes: a systematic review and meta-analysis. Diabetologia 67(5), 798–810 (2024).
11.
Manfredo J, Lin T, Gupta R et al. Short-term use of CGM in youth onset type 2 diabetes is associated with behavioral modifications. Front. Endocrinol. (Lausanne) 14, 1182260 (2023).
12.
Reddy M, Jugnee N, El Laboudi A et al. A randomized controlled pilot study of continuous glucose monitoring and flash glucose monitoring in people with Type 1 diabetes and impaired awareness of hypoglycaemia. Diabet. Med. 35(4), 483–490 (2018).
13.
Brown RE, Chu L, Norman GJ, Abitbol A. Real-world glycaemic outcomes in adult persons with type 1 diabetes using a real-time continuous glucose monitor compared to an intermittently scanned glucose monitor: a retrospective observational study from the Canadian LMC diabetes registry (REAL-CGM-T1D). Diabet. Med. 39(11), e14937 (2022).
14.
Alshannaq H, Isitt JJ, Pollock RF et al. Cost-utility of real-time continuous glucose monitoring versus self-monitoring of blood glucose in people with insulin-treated Type 2 diabetes in Canada. J. Comp. Eff. Res. 12(10), e230075 (2023).
• This J. Comp. Eff. Res. publication evaluated the cost-utility of real-time continuous glucose monitoring (rt-CGM) versus self-monitoring of blood glucose (SMBG) in insulin-treated Type 2 diabetes mellitus (T2DM) in Canada, providing important context for the present analysis.
15.
Alshannaq H, Pollock RF, Joubert M et al. Cost-utility of real-time continuous glucose monitoring versus self-monitoring of blood glucose in people with insulin-treated Type II diabetes in France. J. Comp. Eff. Res. 13(3), e230174 (2024).
16.
Del Prato S, Giorgino F, Szafranski K, Poon Y. Cost-utility analysis of a flash continuous glucose monitoring system in the management of people with Type 2 diabetes mellitus on basal insulin therapy-An Italian healthcare system perspective. Diabetes Obes. Metab. 26(9), 3633–3641 (2024).
17.
Fonda SJ, Graham C, Munakata J et al. The cost-effectiveness of real-time continuous glucose monitoring (rt-CGM) in Type 2 diabetes. J. Diabetes Sci. Technol. 10(4), 898–904 (2016).
18.
Frank J, Son D, Szafranski K, Poon Y. Continuous glucose monitoring for self-management of diabetes in people living with Type 2 diabetes mellitus on basal insulin therapy: a microsimulation model and cost-effectiveness analysis from a US perspective with relevance to Medicaid. J. Manag. Care Spec. Pharm. 30(9), 917–928 (2024).
19.
Isitt JJ, Roze S, Sharland H et al. Cost-effectiveness of a real-time continuous glucose monitoring system versus self-monitoring of blood glucose in people with Type 2 diabetes on insulin therapy in the UK. Diabetes Ther. 13(11–12), 1875–1890 (2022).
20.
Kim JY, Ilham S, Alshannaq H et al. Real-time continuous glucose monitoring vs. self-monitoring of blood glucose: cost-utility in South Korean Type 2 diabetes patients on intensive insulin. J. Med. Econ. 27(1), 1245–1252 (2024).
21.
Alshannaq H, Cogswell G, Pollock RF et al. Cost-utility of real-time continuous glucose monitoring versus self-monitoring of blood glucose and intermittently scanned continuous glucose monitoring in people with type 1 diabetes receiving multiple daily insulin injections in Denmark. Diabetes Obes. Metab. 25(9), 2704–2713 (2023).
22.
Isitt JJ, Roze S, Tilden D et al. Long-term cost-effectiveness of Dexcom G6 real-time continuous glucose monitoring system in people with Type 1 diabetes in Australia. Diabet. Med. 39(7), e14831 (2022).
23.
Roze S, Isitt J, Smith-Palmer J, Javanbakht M, Lynch P. Long-term cost-effectiveness of Dexcom G6 real-time continuous glucose monitoring versus self-monitoring of blood glucose in patients with Type 1 diabetes in the U.K. Diabetes Care 43(10), 2411–2417 (2020).
24.
Roze S, Isitt JJ, Smith-Palmer J, Lynch P. Evaluation of the long-term cost-effectiveness of the Dexcom G6 continuous glucose monitor versus self-monitoring of blood glucose in people with Type 1 diabetes in Canada. Clinicoecon. Outcomes Res. 13, 717–725 (2021).
25.
Roze S, Isitt JJ, Smith-Palmer J et al. Long-term cost-effectiveness the Dexcom G6 real-time continuous glucose monitoring system compared with self-monitoring of blood glucose in people with Type 1 diabetes in France. Diabetes Ther. 12(1), 235–246 (2021).
26.
Griffiths EA, Vadlamudi NK. Cadths's $50,000 cost-effectiveness threshold: fact or fiction? Value Health 19(7), A488–A489 (2016).
27.
Baharnoori M, Bhan V, Clift F et al. Cost-effectiveness analysis of ofatumumab for the treatment of relapsing-remitting multiple sclerosis in Canada. Pharmacoecon. Open 6(6), 859–870 (2022).
28.
Palmer AJ, Si L, Tew M et al. Computer modeling of diabetes and its transparency: a report on the eighth mount hood challenge. Value Health 21(6), 724–731 (2018).
29.
Husereau D, Drummond M, Augustovski F et al. Consolidated Health Economic Evaluation Reporting Standards 2022 (CHEERS 2022) statement: updated reporting guidance for health economic evaluations. Value Health 25(1), 3–9 (2022).
30.
CADTH. New drugs for Type 2 diabetes: second-line therapy – Science Report. CADTH Therapeutic Review (2017).
31.
Karter AJ, Parker MM, Moffet HH, Gilliam LK, Dlott R. Association of real-time continuous glucose monitoring with glycemic control and acute metabolic events among patients with insulin-treated diabetes. JAMA 325(22), 2273–2284 (2021).
32.
Wells G, Sultan S, Chen L, Khan M, Coyle D. Indirect evidence: indirect treatment comparisons in meta-analysis. Canadian Agency for Drugs and Technologies in Health, Ottawa, Canada 1–94 (2009).
33.
Bucher HC, Guyatt GH, Griffith LE, Walter SD. The results of direct and indirect treatment comparisons in meta-analysis of randomized controlled trials. J. Clin. Epidemiol. 50(6), 683–691 (1997).
34.
Beck RW, Riddlesworth TD, Ruedy K et al. Continuous glucose monitoring versus usual care in patients with Type 2 diabetes receiving multiple daily insulin injections: a randomized trial. Ann. Intern. Med. 167(6), 365–374 (2017).
•• This randomized trial compared rt-CGM with SMBG in insulin-treated T2DM and provided efficacy data for the indirect comparison in this analysis.
35.
Haak T, Hanaire H, Ajjan R et al. Flash glucose-sensing technology as a replacement for blood glucose monitoring for the management of insulin-treated Type 2 diabetes: a multicenter, open-label randomized controlled trial. Diabetes Ther. 8(1), 55–73 (2017).
•• This multicenter randomized trial compared intermittently scanned CGM (is-CGM) with SMBG in insulin-treated T2DM and informed the indirect comparison with rt-CGM.
36.
UKPDS Study Group. Intensive blood-glucose control with sulphonylureas or insulin compared with conventional treatment and risk of complications in patients with Type 2 diabetes (UKPDS 33). UK Prospective Diabetes Study (UKPDS) Group. Lancet 352(9131), 837–853 (1998).
37.
CADTH. Second-Line Pharmacotherapy for Type 2 Diabetes (2013).
• This CADTH report provided Canadian cost data for diabetes-related complications, used in our unit cost inputs.
38.
Goguen J, Gilbert J. Hyperglycemic emergencies in adults. Can. J. Diabetes 42, S109–S114 (2018).
39.
Beaudet A, Clegg J, Thuresson PO, Lloyd A, McEwan P. Review of utility values for economic modeling in Type 2 diabetes. Value Health 17(4), 462–470 (2014).
• This systematic review summarized disutility values for T2DM complications and served as the primary source for quality-adjusted life-year decrements in our analysis.
40.
Hoerger TJ, Wittenborn JS, Segel JE et al. A health policy model of CKD: 2. The cost-effectiveness of microalbuminuria screening. Am. J. Kidney Dis. 55(3), 463–473 (2010).
41.
Stafford S, Bech PG, Fridhammar A et al. Cost-effectiveness of once-weekly semaglutide 1 mg versus canagliflozin 300 mg in patients with Type 2 diabetes mellitus in a Canadian setting. App. Health Econ. Health Pol. 20(4), 543–555 (2022).
42.
Evans M, Khunti K, Mamdani M et al. Health-related quality of life associated with daytime and nocturnal hypoglycaemic events: a time trade-off survey in five countries. Health Qual. Life Outcomes 11, 90 (2013).
43.
Lauridsen JT, Lonborg J, Gundgaard J, Jensen HH. Diminishing marginal disutility of hypoglycaemic events: results from a time trade-off survey in five countries. Qual. Life Res. 23(9), 2645–2650 (2014).
44.
Visser MM, Charleer S, Fieuws S et al. Comparing real-time and intermittently scanned continuous glucose monitoring in adults with type 1 diabetes (ALERTT1): a 6-month, prospective, multicentre, randomised controlled trial. Lancet 397(10291), 2275–2283 (2021).
• This randomized trial (ALERTT1) compared rt-CGM and is-CGM in adults with T1DM and reported reductions in HbA1c and fear of hypoglycemia (FoH), informing disutility assumptions in our analysis.
45.
Visser MM, Charleer S, Fieuws S et al. Effect of switching from intermittently scanned to real-time continuous glucose monitoring in adults with type 1 diabetes: 24-month results from the randomised ALERTT1 trial. Lancet Diabetes Endocrinol. 11(2), 96–108 (2023).
• This randomized trial (ALERTT1) compared rt-CGM and is-CGM in adults with T1DM and reported reductions in HbA1c and FoH, informing disutility assumptions in our analysis.
46.
Stinnett AA, Mullahy J. Net health benefits: a new framework for the analysis of uncertainty in cost-effectiveness analysis. Med. Decis. Making 18(Suppl. 2), S68–S80 (1998).
47.
Redenz G, Ibaceta MC, Aceituno D, Balmaceda C, Espinoza MA. Health state utility values of Type 2 diabetes mellitus and related complications: a systematic review and meta-analysis. Value Health Reg. Issues 34, 14–22 (2023).
48.
Willis M, Asseburg C, He J. Validation of economic and health outcomes simulation model of Type 2 diabetes mellitus (ECHO-T2DM). J. Med. Econ. 16(8), 1007–1021 (2013).
•• Reported the validation of the ECHO-T2DM model, supporting its use in long-term simulation of clinical and economic outcomes in T2DM.
49.
Willis M, Johansen P, Nilsson A, Asseburg C. Validation of the Economic and Health Outcomes Model of Type 2 diabetes mellitus (ECHO-T2DM). Pharmacoeconomics 35(3), 375–396 (2017).
50.
Hayes AJ, Leal J, Gray AM, Holman RR, Clarke PM. UKPDS outcomes model 2: a new version of a model to simulate lifetime health outcomes of patients with type 2 diabetes mellitus using data from the 30 year United Kingdom Prospective Diabetes Study: UKPDS 82. Diabetologia 56(9), 1925–1933 (2013).
51.
Tanaka S, Igarashi A, De Moor R et al. A targeted review of worldwide indirect treatment comparison guidelines and best practices. Value Health 27(9), 1179–1190 (2024).
52.
Macabeo B, Quenéchdu A, Aballéa S et al. Methods for indirect treatment comparison: results from a systematic literature review. J. Mark. Access Health Pol. 12(2), 58–80 (2024).
53.
Nemlekar PM, Hannah KL, Green CR, Norman GJ. Association between adherence, A1C improvement, and type of continuous glucose monitoring system in people with Type 1 diabetes or Type 2 diabetes treated with intensive insulin therapy. Diabetes Ther. 15(3), 639–648 (2024).
Information & Authors
Information
Published In
Copyright
© 2025 The authors. This work is licensed under the Attribution-NonCommercial-NoDerivatives 4.0 Unported License
History
Received: 4 August 2025
Accepted: 10 September 2025
Published online: 24 September 2025
Keywords:
Topics
Authors
Metrics & Citations
Metrics
Article Usage
Article usage data only available from February 2023. Historical article usage data, showing the number of article downloads, is available upon request.
Citations
How to Cite
The cost-effectiveness of real-time continuous glucose monitoring versus intermittently scanned continuous glucose monitoring in individuals with insulin-treated Type 2 diabetes mellitus in Canada. (2025) Journal of Comparative Effectiveness Research. DOI: 10.57264/cer-2025-0125
Export citation
Select the citation format you wish to export for this article or chapter.
Citing Literature
- Jinghao He, Boyu Chen, Jianjun Wang, Qingqing Wang, A brief description of electrochemical glucose biosensors and their future challenges, Nano Biomedicine and Engineering, 10.1016/j.nbe.2025.100020, 18, 3, (100020), (2026).
- Maria Apostolopoulou, Grigorios Effraimidis, Advances in diabetes technology: clinical implications, limitations, and future perspectives, Hormones, 10.1007/s42000-026-00797-w, (2026).
- Xiaoxiao Chen, Gyeong Eon Kim, Nam Ah Kim, Kwang Joon Kim, Integrating Pharmacists into CGM-Enabled Digital Diabetes Care: Advancing Personalized and Data-Driven Management, Healthcare, 10.3390/healthcare14081019, 14, 8, (1019), (2026).