Healthcare cost comparison between first-line ibrutinib and acalabrutinib in chronic lymphocytic leukemia patients in the Veterans Affairs
Publication: Journal of Comparative Effectiveness Research
Abstract
Aim: Bruton’s tyrosine kinase inhibitors (BTKis), including ibrutinib and acalabrutinib, transformed the treatment landscape of chronic lymphocytic leukemia (CLL) and small lymphocytic lymphoma (SLL) by improving outcomes compared with chemoimmunotherapy. Real-world economic comparisons between BTKis are needed in diverse populations. This study aimed to compare healthcare costs in the Veterans Health Administration (VHA) among patients with CLL/SLL treated with, and remaining persistent on, first-line (1L) ibrutinib versus acalabrutinib monotherapy for 12 months. Materials & methods: This retrospective study used VHA electronic medical record data from January 2006 to July 2024. Eligible patients initiated 1L ibrutinib or acalabrutinib monotherapy on or after November 2019 and remained on continuous treatment for ≥12 months. All-cause and CLL/SLL-related costs were assessed over 12 months of follow-up. Generalized linear models were used to estimate adjusted costs and compare differences between treatment cohorts. Results: A total of 1059 patients were included (ibrutinib: n = 732; acalabrutinib: n = 327). During the 12-month follow-up of continuous 1L treatment, the annual adjusted all-cause total healthcare cost difference between ibrutinib and acalabrutinib was -$2422 (p = 0.46) (adjusted medical cost difference: $5259, p = 0.03; adjusted pharmacy cost difference: -$5886, p = 0.02). The annual adjusted CLL/SLL-related total healthcare cost difference between ibrutinib and acalabrutinib was -$3793 (p = 0.15) (adjusted medical cost difference: $2085, p = 0.05; adjusted pharmacy cost difference: -$5860, p = 0.02). Conclusion: Among VHA patients with CLL/SLL who initiated and remained on treatment with 1L BTKi monotherapy for 12 months, annual all-cause and CLL/SLL-related total healthcare costs were similar between ibrutinib and acalabrutinib. Pharmacy costs were lower for ibrutinib, while medical costs were lower for acalabrutinib, resulting in overall comparable total costs.
Plain language summary
What is this summary about?
Chronic lymphocytic leukemia (CLL) and small lymphocytic lymphoma (SLL) are common blood cancers in the US, especially among veterans. Two oral medications, ibrutinib and acalabrutinib, are commonly used as the first treatment for CLL/SLL. While both drugs are effective at improving disease outcomes, less is known about how much their use impacts healthcare cost in real-world settings, especially in the Veterans Health Administration, the largest US healthcare system for veterans. This study compared healthcare costs for patients with CLL/SLL who took either ibrutinib or acalabrutinib as their first treatment. It looked at 12 months of data after patients started, and remained on, treatment.
What were the results?
Results showed that total healthcare costs were similar between the two groups. Most costs came from the medications themselves. Although ibrutinib had slightly lower total healthcare costs, mainly because its pharmacy costs were lower, patients taking ibrutinib had higher outpatient care costs.
What do the results mean?
Patients taking ibrutinib had generally similar total healthcare costs compared with those taking acalabrutinib during the first year while on treatment, though medication costs were lower. These insights are important for understanding how these drugs impact healthcare spending, especially as drug pricing policies evolve.
Chronic lymphocytic leukemia (CLL) and small lymphocytic lymphoma (SLL) are the most common leukemias in the US, with a combined annual age-adjusted incidence of 4.5 per 100,000 and an estimated 5-year survival of 88.1% [1,2]. The CLL treatment landscape has significantly evolved from chemoimmunotherapy (CIT) to targeted agents, particularly Bruton’s tyrosine kinase inhibitors (BTKis), which disrupt B-cell receptor signaling, a critical pathway for malignant B-cell survival [3]. BTKi treatments have been a major breakthrough, improving survival outcomes and treatment tolerability compared with conventional CIT [4–6] and have become a recommended treatment option in patients with treatment-naive and relapsed/refractory CLL/SLL [7].
Ibrutinib, the first-in-class covalent BTKi, received US FDA approval in 2014 for previously-treated CLL, later expanding to frontline therapy [4,8]. In phase III clinical trials in both first-line (1L) and relapsed/refractory CLL/SLL, treatment with ibrutinib demonstrated improved progression-free survival (PFS) and overall survival (OS) compared with immunotherapy and/or chemotherapy (CT) treatments [5,9–12]. A second covalent BTKi, acalabrutinib, received FDA approval in November 2019 for treatment-naive and relapsed/refractory CLL. The phase III trial showed acalabrutinib with or without obinutuzumab significantly improved PFS over CIT [6]. In a phase III head-to-head trial for previously-treated CLL, acalabrutinib was noninferior to ibrutinib in terms of PFS [13]. However, a real-world study found that patients treated with ibrutinib were less likely to initiate next treatment than patients on acalabrutinib, suggesting the need for careful consideration of 1L treatment selection for CLL/SLL in relation to available BTKis [14].
Despite extensive clinical data, the literature is limited on real-world economic comparisons among patients who were treated long term with ibrutinib or acalabrutinib. The impact of long-term treatment with BTKi on total cost of care can vary among patients with CLL depending on healthcare access, reimbursement structures and care settings [15–17]. For example, a study elsewhere found that patients with hematologic malignancies incurred higher total costs, including drug and administration costs, when treated in hospital outpatient settings compared with physician offices or community clinics [16]. In addition, geographic variations in healthcare access have also been found to impact cost and healthcare resource use (HRU). One study found that among Medicare beneficiaries with CLL, compared with residency in a metropolitan area, living in a nonmetropolitan area was associated with higher ED visits and higher hospital outpatient costs [17]. Furthermore, evolving policy changes, such as the Inflation Reduction Act (IRA) may impact future cost dynamics of BTKis [18]. As there is limited literature on healthcare cost among patients treated with BTKis, it is important to quantify costs of BTKis in a diverse CLL population during this pre-IRA period, adding to the body of evidence on economic comparisons as benchmark before policy-driven pricing changes.
The Veterans Health Administration (VHA) uses electronic medical records (EMRs) to collect clinical and administrative data, offering a unique opportunity for economic burden analysis in a large, diverse population of patients treated with BTKis with long-term medical care. Specifically, veterans are a geographically widespread population, with a significant proportion of veterans residing in rural areas [19]. In addition, prior exposure to chemicals such as Agent Orange and pesticides are risk factors for CLL/SLL, which are more prevalent in a veteran population [20–22]. Given that the VHA is comprised of a population with diverse characteristics that may impact healthcare costs, this study aimed to describe and compare patient characteristics and total cost of care in the VHA population for patients treated with, and remaining on, 1L ibrutinib versus acalabrutinib monotherapy for CLL/SLL during the first year following initiation.
Materials & methods
Data source
This retrospective, observational study used real-world EMR data from the VHA database from 1 January 2006 to 31 July 2024. The VHA is the largest integrated healthcare system in the US, serving over 9 million veterans annually. The VHA Corporate Data Warehouse includes medical encounter data across VHA facilities, including medical centers, outpatient clinics and long-term care settings. The Corporate Data Warehouse stores clinical data in separate databases, (e.g., medications, inpatient admissions, outpatient visits and lab results), and includes demographics and a range of services from primary and specialty care to rehabilitation and home care.
In this study, costs of care were identified using patient-level data from the VHA Decision Support System cost database. The Decision Support System uses an approach similar to microcosting, where expenditures are linked to each patient's resource use captured through automated tracking. Costs for personnel, medical supplies and equipment are assessed within each department, while indirect costs, such as facility maintenance or janitorial services, are proportionally distributed based on factors such as space usage. Patient-specific resource use, such as laboratory work, imaging and specialty consultation, is extracted from the EMR. These services are quantified using relative resource units, which account for variations in resource intensity. By dividing total departmental costs by total relative resource units, a unit cost is derived which is then multiplied by each patient’s resource usage. As a result, two patients undergoing the same procedure may have different cost estimates due to variations in the specific resources used during their care [23,24].
Study design
This study used a retrospective cohort design to compare patients with CLL/SLL who initiated 1L treatment with ibrutinib monotherapy to patients who initiated 1L acalabrutinib monotherapy and remained on treatment for ≥12 months. The index date was defined as the date of initiation of ibrutinib monotherapy or acalabrutinib monotherapy in 1L based on structured VHA data, on or after 21 November 2019. This date corresponds to the FDA approval of acalabrutinib for 1L CLL/SLL and was selected to ensure comparable time windows for evaluating both treatments. The baseline period was defined as the 12-month period prior to the index date, during which patient characteristics were assessed. Historical data starting from 2006 were available in the VHA data and were used to identify prior diagnoses of CLL/SLL, historical antineoplastic exposure, and other long-term comorbidities for sample selection.
The follow-up period spanned from the index date to 12 months post-index. The study focused on a treatment-persistent cohort who remained on 1L monotherapy for ≥12 months following the index date. The 1L treatment period was defined as the period from the initiation of 1L treatment until the earliest of treatment discontinuation (defined as a gap in treatment by 90 days or more) or initiation of a subsequent treatment. A duration of 12 months was selected since the first year following BTKi initiation is a clinically meaningful window, where patients may undergo close monitoring.
The study design was determined to be exempt from Institutional Review Board review by the Southeast Louisiana Veterans Health Care System Institutional Review Board in September 2023.
Study population
Patients were included in the study if they were ≥18 years of age as of the index date, had ≥1 medication record for ibrutinib or acalabrutinib between 1 January 2006 through 31 July 2024, and had ≥2 diagnoses of CLL/SLL ≥30 days apart, including ≥1 CLL/SLL diagnosis prior to the index date, based on International Classification of Diseases, Ninth Revision, Clinical Modification (ICD-9-CM) codes 204.1 and International Classification of Diseases, Tenth Revision, Clinical Modification (ICD-10-CM) code C91.1 for CLL and ICD-10-CM code C83.0 for SLL (Supplementary Table 1). Patients were also required to be continuously enrolled in the VHA for ≥12 months before the index date and for ≥28 days after the index date, have an index date on or after 21 November 2019 (i.e., the FDA approval date for acalabrutinib) to allow the sample to have a comparable index window, initiate treatment on or below the FDA recommended daily dose of 420 mg/day for ibrutinib and 200 mg/day for acalabrutinib, and have ≥12 months follow-up during which they were continuously on 1L treatment.
Patients were excluded from the study if they received treatment with any antineoplastic agents any time prior to the index date and within 28 days after the index date (to help ensure that BTKi monotherapy was initiated as 1L therapy), had a diagnosis for end-stage kidney disease prior to the index date, or if they had ≥2 diagnoses of other blood cancers ≥30 days apart during the time period ≥6 months prior to the index date.
Patients were classified into two different cohorts based on the 1L treatment received: ibrutinib monotherapy (ibrutinib cohort) or acalabrutinib monotherapy (acalabrutinib cohort).
Patient characteristics & outcome measures
Patient demographic and clinical characteristics during the baseline period were described. Geographic region was determined based on the state of residence documented during the index year and was categorized as Midwest, Northeast, South and West based on the US census bureau divisions [25]. Rural–urban classification was based on the Rural–Urban Commuting Area codes [26]. Patient ZIP codes at the index date were linked to Rural–Urban Commuting Area codes and categorized as either urban (metropolitan areas) or rural (including micropolitan, small town and rural areas). The Quan-Charlson comorbidity index (CCI) was calculated based on the presence of comorbidities and weighted based on their severity based on the algorithm detailed by Quan et al. [27].
During the 12-month follow-up period while patients were on continuous treatment with ibrutinib or acalabrutinib, the mean daily dose for each of the 12 months while on treatment was summarized for ibrutinib and acalabrutinib.
In addition, during the follow-up period, annual all-cause and CLL/SLL-related HRU were assessed. Inpatient visits consisted of visits where patients were admitted to a hospital for at least one overnight stay under a physician’s care. Outpatient visits included healthcare services where the patient received medical care without being admitted to a hospital. These included community-based outpatient clinics (CBOCs) and VA medical center (VAMC) hospital outpatient visits, where the patient does not need overnight care. CBOCs primarily provide outpatient services related to primary care, with limited specialty services, whereas hospital outpatient visits at VAMCs may comprise of more specialty and comprehensive services [28]. Emergency department (ED) visits include visits to a VAMC where a patient seeks immediate care for an acute illness, injury, or other urgent health condition that requires prompt evaluation and treatment. Patients may subsequently be admitted to the hospital for an overnight stay or may be discharged on the same day.
Annual all-cause and CLL/SLL-related healthcare costs, including medical costs and pharmacy costs, were evaluated during the 12-month follow-up period and by quarter (i.e., month 1–3, 4–6, 7–9 and 10–12). Medical costs were further stratified by inpatient, outpatient and ED costs. CLL/SLL-related HRU and healthcare costs were defined as medical records with a diagnosis for CLL/SLL. CLL/SLL-related pharmacy costs were defined as costs of CLL/SLL-related treatments, including BTKis and antineoplastic agents.
Statistical analysis
Patient demographic and clinical characteristics were summarized descriptively using means and standard deviations (SDs) for continuous variables, and frequencies and proportions for categorical variables. Characteristics were also compared between the two treatment cohorts using Wilcoxon rank-sum tests for continuous variables and Chi-square or Fisher’s exact tests for categorical variables.
During the 12-month follow-up period of continuous 1L treatment, annual all-cause and CLL/SLL-related HRU and healthcare costs were summarized descriptively and compared between the ibrutinib and acalabrutinib cohorts. HRU comparisons were made using Wilcoxon rank-sum tests. Addressing the study objective, cost comparisons included adjusted analyses, with mean differences and predicted mean costs estimated using generalized linear models with a Tweedie distribution. The associated 95% confidence intervals (CIs) and p-values were estimated using non-parametric bootstrap procedures. Covariates in adjusted models were selected based on balance between cohorts at baseline and clinical significance and included age category (<65 or ≥65 years), sex, CCI categories (≤2, 3–4 or ≥5), baseline inpatient or ED visits, baseline outpatient visits and baseline COVID-19 diagnosis (Table 1). All costs were reported as annualized costs and inflated to mid-year 2024 using medical care service component of Consumer Price Index (CPI).
| Demographics at index date | Ibrutinib (n = 732) | Acalabrutinib (n = 327) | p-value |
|---|---|---|---|
| Age in years, mean ± SD | 72.5 ± 8.3 | 74.3 ± 8.5 | <0.01† |
| <65, n (%) | 120 (16.4) | 43 (13.1) | 0.18 |
| ≥65, n (%) | 612 (83.6) | 284 (86.9) | 0.18 |
| Male, n (%) | 722 (98.6) | 321 (98.2) | 0.59 |
| Race‡, n (%) | |||
| White, non-Hispanic | 559 (76.4) | 253 (77.4) | 0.72 |
| Black | 97 (13.3) | 39 (11.9) | 0.55 |
| Hispanic | 10 (1.4) | 7 (2.1) | 0.35 |
| Other§ | 15 (2.0) | 3 (0.9) | 0.19 |
| Unknown | 51 (7.0) | 25 (7.6) | 0.69 |
| Geographic regions¶, n (%) | |||
| South | 233 (31.8) | 115 (35.2) | 0.29 |
| Midwest | 242 (33.1) | 89 (27.2) | 0.06 |
| West | 154 (21.0) | 67 (20.5) | 0.84 |
| Northeast | 103 (14.1) | 56 (17.1) | 0.20 |
| Residential area#, n (%) | |||
| Urban | 624 (85.2%) | 290 (88.7%) | 0.13 |
| Rural | 107 (14.6%) | 36 (11.0%) | 0.11 |
| Unknown | 1 (0.1%) | 1 (0.3%) | 0.52 |
| Index year distribution, n (%) | |||
| 2019 | 35 (4.8) | 2 (0.6) | <0.01† |
| 2020 | 278 (38.0) | 31 (9.5) | <0.01† |
| 2021 | 225 (30.7) | 58 (17.7) | <0.01† |
| 2022 | 155 (21.2) | 130 (39.8) | <0.01† |
| 2023 | 39 (5.3) | 106 (32.4) | <0.01† |
| Time from earliest observed CLL/SLL diagnosis to index date in months, mean ± SD | 52.1 ± 46.9 | 56.1 ± 49.3 | 0.20 |
| Comorbidities, n (%) | |||
| Hypertension | 474 (64.8) | 224 (68.5) | 0.24 |
| Endocrine disorders (other than diabetes) | 322 (44.0) | 132 (40.4) | 0.27 |
| Psychiatric disease | 293 (40.0) | 120 (36.7) | 0.31 |
| Diabetes mellitus | 230 (31.4) | 114 (34.9) | 0.27 |
| Chronic pulmonary disease | 140 (19.1) | 59 (18.0) | 0.68 |
| CAD | 107 (14.6) | 71 (21.7) | <0.01† |
| Coagulopathy (clotting disorder) | 91 (12.4) | 40 (12.2) | 0.93 |
| Renal disease | 88 (12.0) | 62 (19.0) | <0.01† |
| Peripheral vascular disease | 64 (8.7) | 29 (8.9) | 0.95 |
| Autoimmune disorders | 55 (7.5) | 23 (7.0) | 0.78 |
| Atrial fibrillation | 47 (6.4) | 52 (15.9) | <0.01† |
| Mild liver disease | 37 (5.1) | 18 (5.5) | 0.76 |
| CHF | 35 (4.8) | 35 (10.7) | <0.01† |
| Cerebrovascular disease | 31 (4.2) | 25 (7.6) | 0.02† |
| COVID-19 | 26 (3.6) | 25 (7.6) | <0.01† |
| Charlson comorbidity index, mean ± SD | 2.7 ± 1.2 (2.0) | 3.0 ± 1.7 | 0.09 |
| All-cause healthcare resource use during baseline | |||
| Evidence of IP or ED visit, n (%) | 234 (32.0) | 92 (28.1) | 0.21 |
| Evidence of outpatient visit, n (%) | 732 (100.0) | 326 (99.7) | 0.31 |
†
Denotes p-value < 0.05.
‡
The race/ethnicity reported during the index year was used.
§
Other race includes Asian, Native Hawaiian or Pacific Islander and American Indian or Alaskan Native.
¶
The region documented during the index year was used.
#
Residential area was based on Rural-Urban Commuting Area Codes.
CAD: Coronary artery disease; CHF: Congestive heart failure; CKD: Chronic kidney disease; CLL: Chronic lymphocytic leukemia; ED: Emergency department; IP: Inpatient; SLL: Small lymphocytic lymphoma; SD: Standard deviation.
Results
Sample identification
Of 1059 eligible patients with CLL/SLL who remained on 1L BTKi treatment for ≥12 months, 732 were treated with ibrutinib monotherapy and 327 patients were treated with acalabrutinib monotherapy (Figure 1).
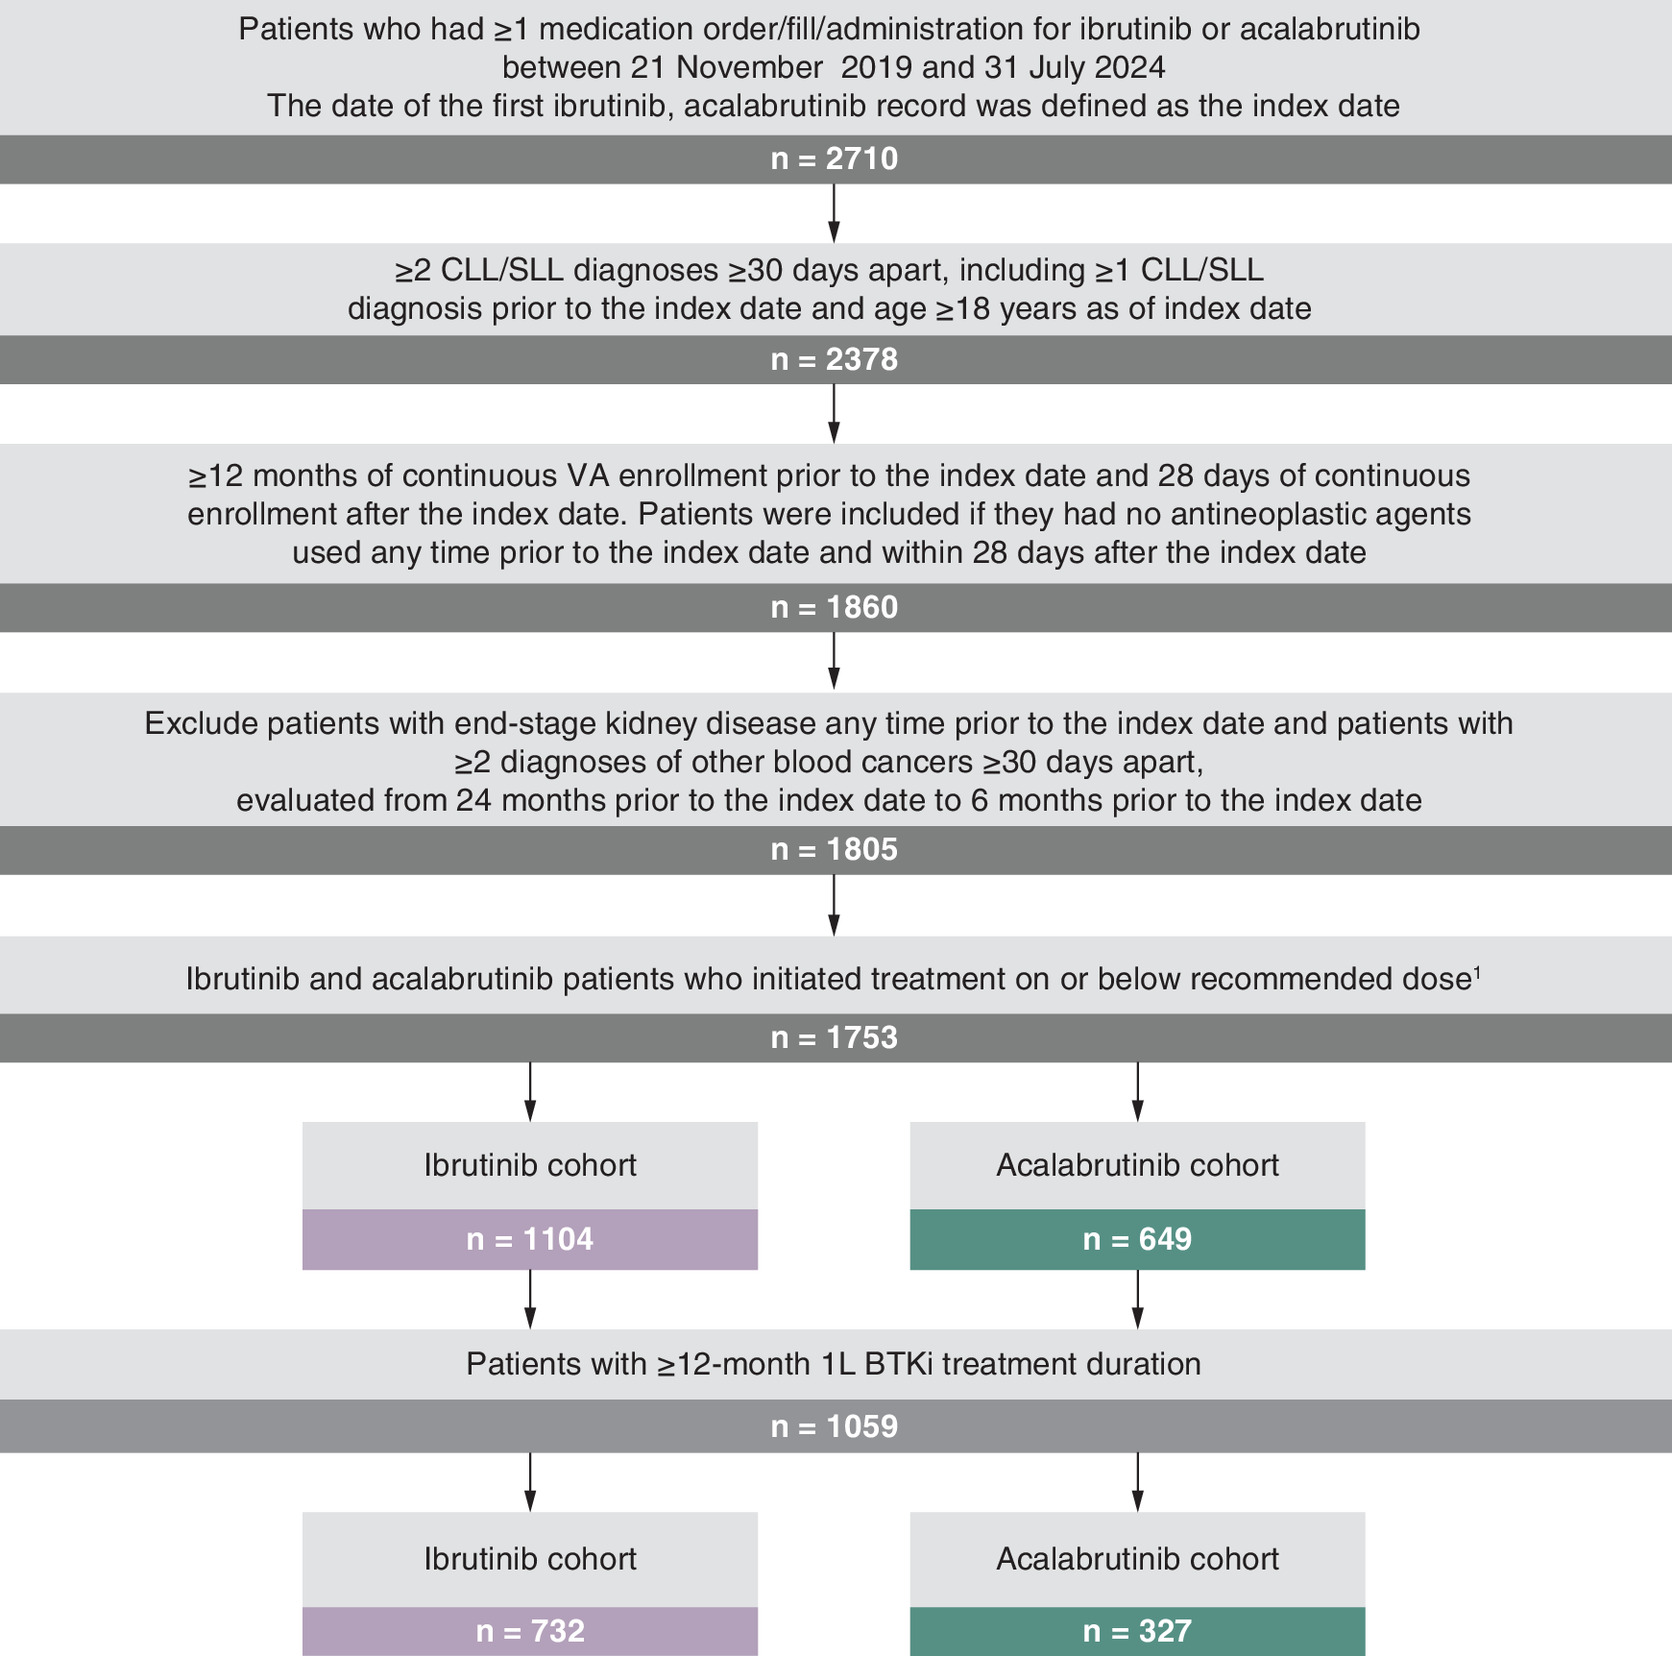
Figure 1. Chronic lymphocytic leukemia/small lymphocytic lymphoma sample selection flowchart among Veterans Affairs patients.
1L: First-line; CLL: Chronic lymphocytic leukemia; SLL: Small lymphocytic lymphoma; VA: Veterans Affairs.
The recommended daily doses according to US FDA label are 420 mg for ibrutinib and 200 mg for acalabrutinib.
Baseline demographic & clinical characteristics
Demographic and clinical characteristics of the two treatment cohorts are shown in Table 1. The mean ± SD age of patients in the acalabrutinib cohort was 74.3 ± 8.5 years compared with 72.5 ± 8.3 years in the ibrutinib cohort (p < 0.01). No significant differences were observed between the ibrutinib and acalabrutinib cohorts in terms of sex (98.6 vs 98.2% male, respectively) and race/ethnicity (76.4 vs 77.4% White, non-Hispanic, respectively). Although not significant, a higher proportion of ibrutinib patients lived in rural areas compared with acalabrutinib patients (14.6 vs 11.0%; p = 0.11). The ibrutinib cohort initiated treatment in earlier index years compared with the acalabrutinib cohort (2019: 4.8 vs 0.6%, 2020: 38.0 vs 9.5%, 2021: 30.7 vs 17.7%, 2022: 21.2 vs 39.8%, 2023: 5.3 vs 32.4%; p < 0.01 across all years). The mean ± SD time from the earliest observed CLL/SLL diagnosis to index date was 52.1 ± 46.9 months among patients treated with ibrutinib and 56.1 ± 49.3 months among patients treated with acalabrutinib (p = 0.20). Across the ibrutinib and acalabrutinib cohorts, the most frequent comorbidities identified were hypertension (64.8 and 68.5%), endocrine disorders (44.0 and 40.4%), psychiatric disease (40.0 and 36.7%), diabetes mellitus (31.4 and 34.9%) and chronic pulmonary disease (19.1 and 18.0%). Among the less frequently occurring comorbidities across the cohorts, patients on ibrutinib compared with acalabrutinib had lower coronary artery disease (14.6 vs 21.7%, p < 0.01), renal disease (12.0 vs 19.0%, p < 0.01), atrial fibrillation (6.4 vs 15.9%, p < 0.01), congestive heart failure (4.8 vs 10.7%, p < 0.01), cerebrovascular disease (4.2 vs 7.6%, p = 0.02) and COVID-19 (3.6 vs 7.6%, p < 0.01). Overall, the ibrutinib cohort had numerically lower mean ± SD CCI (2.7 ± 1.2 vs 3.0 ± 1.7, p = 0.09), and fewer patients with CCI ≥5 than the acalabrutinib cohort (8.3 vs 14.1%, p < 0.01). During the baseline period, 32.0% of patients in the ibrutinib cohort and 28.1% of patients in the acalabrutinib cohort had ≥1 inpatient or ED visit, and nearly all patients had ≥1 outpatient visit (100.0% in ibrutinib and 99.7% in acalabrutinib).
Mean daily dose
The mean daily dose during the 12-month follow-up period for patients treated with ibrutinib ranged from 394 mg (month 3) to 379 mg (month 12), and for patients treated with acalabrutinib, it ranged from 196 mg (month 2) to 192 mg (month 12).
HRU outcomes
Annual all-cause and CLL/SLL-related HRU during the 12-month follow-up period of 1L continuous treatment is summarized in Table 2. For all-cause HRU, the mean annual number of inpatient admissions was comparable between the ibrutinib and acalabrutinib cohorts (0.22 vs 0.19, p = 0.05), as were the mean length of stay per admission (6.59 vs 8.55 days, p = 0.40) and the mean annual number of ED visits (0.75 vs 0.63, p = 0.60). However, the ibrutinib cohort had a higher mean annual number of outpatient visits compared with the acalabrutinib cohort (25.97 vs 22.73, p < 0.01). A similar pattern was observed for CLL/SLL-related HRU. The mean number of CLL/SLL-related inpatient admissions (0.18 vs 0.15, p = 0.27) and length of stay per admission (7.02 vs 9.77, p = 0.31) were similar between the two cohorts, while the mean number of CLL/SLL-related ED (0.13 vs 0.07, p < 0.05) and CLL/SLL-related outpatient visits (7.38 vs 5.89, p < 0.01) per year were higher in the ibrutinib cohort compared with the acalabrutinib cohort.
| Ibrutinib (n = 732) | Acalabrutinib (n = 327) | p-value | |
|---|---|---|---|
| All-cause HRU, mean ± SD | |||
| Inpatient admissions, n | 0.22 ± 0.64 | 0.19 ± 0.64 | 0.05 |
| Length of stay per admission | 6.59 ± 9.21 | 8.55 ± 12.57 | 0.40 |
| ED visits, n | 0.75 ± 1.57 | 0.63 ± 1.63 | 0.06 |
| Outpatient visits, n | 25.97 ± 18.04 | 22.73 ± 17.77 | <0.01* |
| CLL/SLL-related HRU, mean ± SD | |||
| Inpatient admissions, n | 0.18 ± 0.57 | 0.15 ± 0.53 | 0.27 |
| Length of stay per admission | 7.02 ± 10.12 | 9.77 ± 13.72 | 0.31 |
| ED visits, n | 0.13 ± 0.46 | 0.07 ± 0.34 | 0.01* |
| Outpatient visits, n | 7.38 ± 6.38 | 5.89 ± 5.88 | <0.01* |
CLL: Chronic lymphocytic leukemia; ED: Emergency department; HRU: Healthcare resource use; SLL: Small lymphocytic lymphoma; SD: Standard deviation.
Healthcare cost outcomes
The descriptive analyses of all-cause medical and pharmacy costs by quarter are reported in Figure 2. The medical costs for both ibrutinib and acalabrutinib cohorts were highest in the first 3 months ($8453 for ibrutinib and $7499 for acalabrutinib), then remained relatively stable over time with minor variations ($5600–6156 for ibrutinib and $4879–5629 for acalabrutinib). Pharmacy costs made up the majority of the total cost burden. Mean pharmacy costs were highest during the first 3 months ($38,081 for ibrutinib and $41,819 for acalabrutinib), and decreased over time for both ibrutinib and acalabrutinib. During the 12-month follow-up period, the unadjusted annual all-cause total healthcare costs were $139,589 for the ibrutinib cohort and $142,749 for the acalabrutinib cohort, with most costs being CLL/SLL-related ($117,301 and $121,069, respectively) (Table 3). Annual all-cause total healthcare costs were primarily driven by pharmacy costs ($113,229 for ibrutinib cohort and $119,465 and for acalabrutinib cohort), with a smaller portion related to medical costs ($26,360 and $23,284, respectively; Table 3). Outpatient cost was the largest component of all-cause medical costs ($17,574 for the ibrutinib cohort and $14,234 for the acalabrutinib cohort), accounting for 61.1–66.7% of all-cause total medical costs. The unadjusted total costs were slightly lower for the ibrutinib cohort compared with the acalabrutinib cohort; however, the differences were not statistically significant (all-cause: -$3160, p = 0.34; CLL/SLL-related: -$3768, p = 0.15).
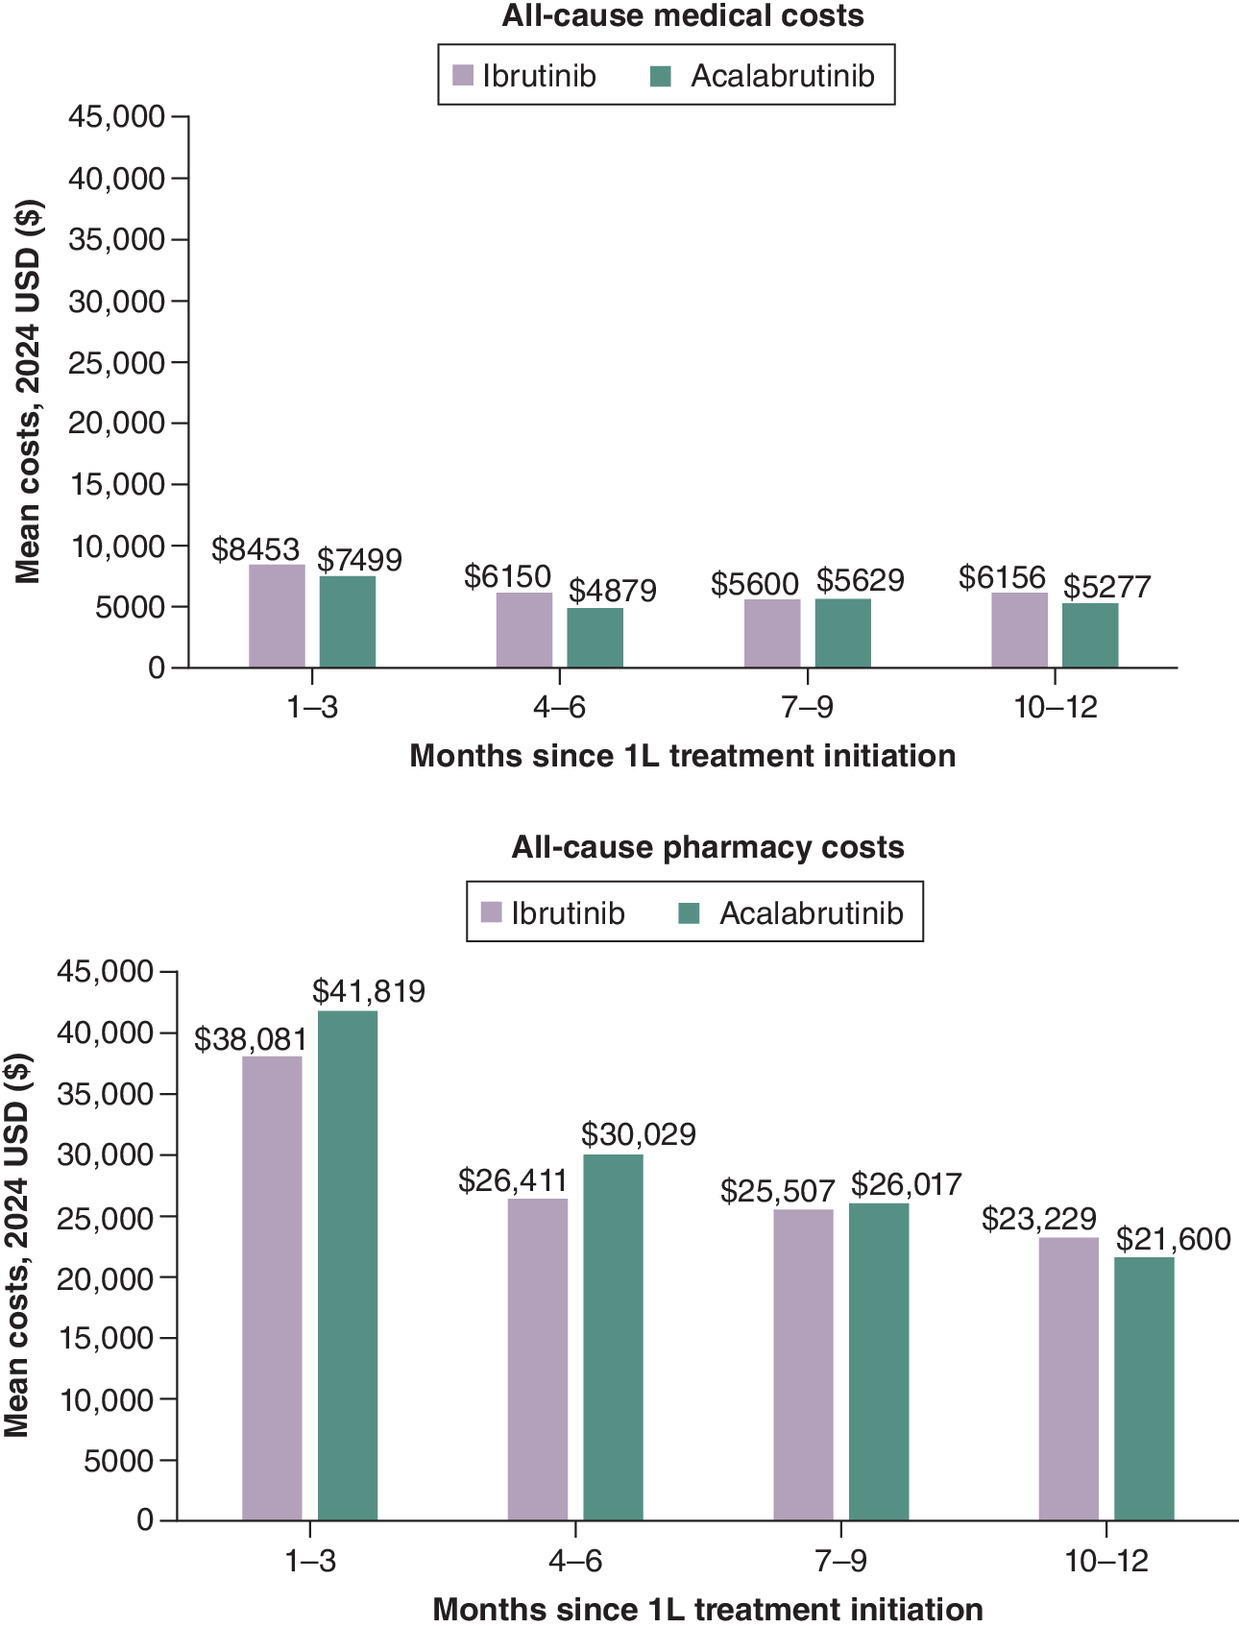
Figure 2. Unadjusted all-cause medical and pharmacy costs during the 12-month follow-up, by quarter.
CLL: Chronic lymphocytic leukemia; SLL: Small lymphocytic lymphoma; USD: US dollar.
| Ibrutinib (n = 732) | Acalabrutinib (n = 327) | Unadjusted mean cost difference | p-value | |
|---|---|---|---|---|
| All-cause costs (2024 USD), mean ± SD [median] | ||||
| Total costs | 139,589 ± 72,270 [133,176] | 142,749 ± 72,530 [138,152] | -3160 | 0.34 |
| Total medical costs | 26,360 ± 48,116 [14,095] | 23,284 ± 49,021 [11,110] | 3076 | 0.18 |
| Inpatient | 7008 ± 41,229[0] | 7640 ± 40,935 [0] | – | – |
| ED | 1778 ± 5699[0] | 1410 ± 4,138 [0] | – | – |
| Outpatient | 17,574 ± 19,374 [12,652] | 14,234 ± 15,126 [9,928] | – | – |
| Pharmacy costs | 113,229 ± 53,752 [114,392] | 119,465 ± 51,318 [122,148] | -6236 | 0.01* |
| CLL/SLL-related costs (2024 USD), mean ± SD [median] | ||||
| Total costs | 117,301 ± 57,817 [117,505] | 121,069 ± 54,562 [123,495] | -3768 | 0.15 |
| Total medical costs | 6878 ± 21,535 [3,059] | 4599 ± 18,425 [1396] | 2278 | 0.02* |
| Inpatient | 1338 ± 19,528 [0] | 1338 ± 17,081 [0] | – | – |
| ED | 217 ± 1,223 [0] | 106 ± 592 [0] | – | – |
| Outpatient | 5323 ± 8,103 [2,781] | 3156 ± 5204 [1396] | – | – |
| Pharmacy costs | 110,423 ± 53,292 [112,481] | 116,469 ± 50,899 [120,193] | -6046 | 0.02* |
CLL: Chronic lymphocytic leukemia; ED: Emergency department; SLL: Small lymphocytic lymphoma; SD: Standard deviation; USD: US dollar.
After adjusting for baseline characteristics (age, sex, CCI, baseline inpatient or ED visits, baseline outpatient visits and baseline COVID-19 diagnosis), predicted total annual all-cause costs were $139,814 for the ibrutinib cohort and $142,236 for the acalabrutinib cohort, with most costs being CLL/SLL-related ($117,293 and $121,086, respectively; Figure 3). Annual all-cause and CLL/SLL-related total costs remained numerically lower for the ibrutinib cohort compared with the acalabrutinib cohort (adjusted cost difference: -$2422, p = 0.46 and -$3793, p = 0.15, respectively). While total medical costs were statistically significantly higher for the ibrutinib cohort compared with the acalabrutinib cohort (adjusted cost differences: all-cause: +$5259, p < 0.05; CLL/SLL-related: +$2085, p = 0.05), the pharmacy costs were significantly lower for the ibrutinib cohort than the acalabrutinib cohort (all-cause: -$5886, p < 0.05; CLL/SLL-related: -$5860, p < 0.05).
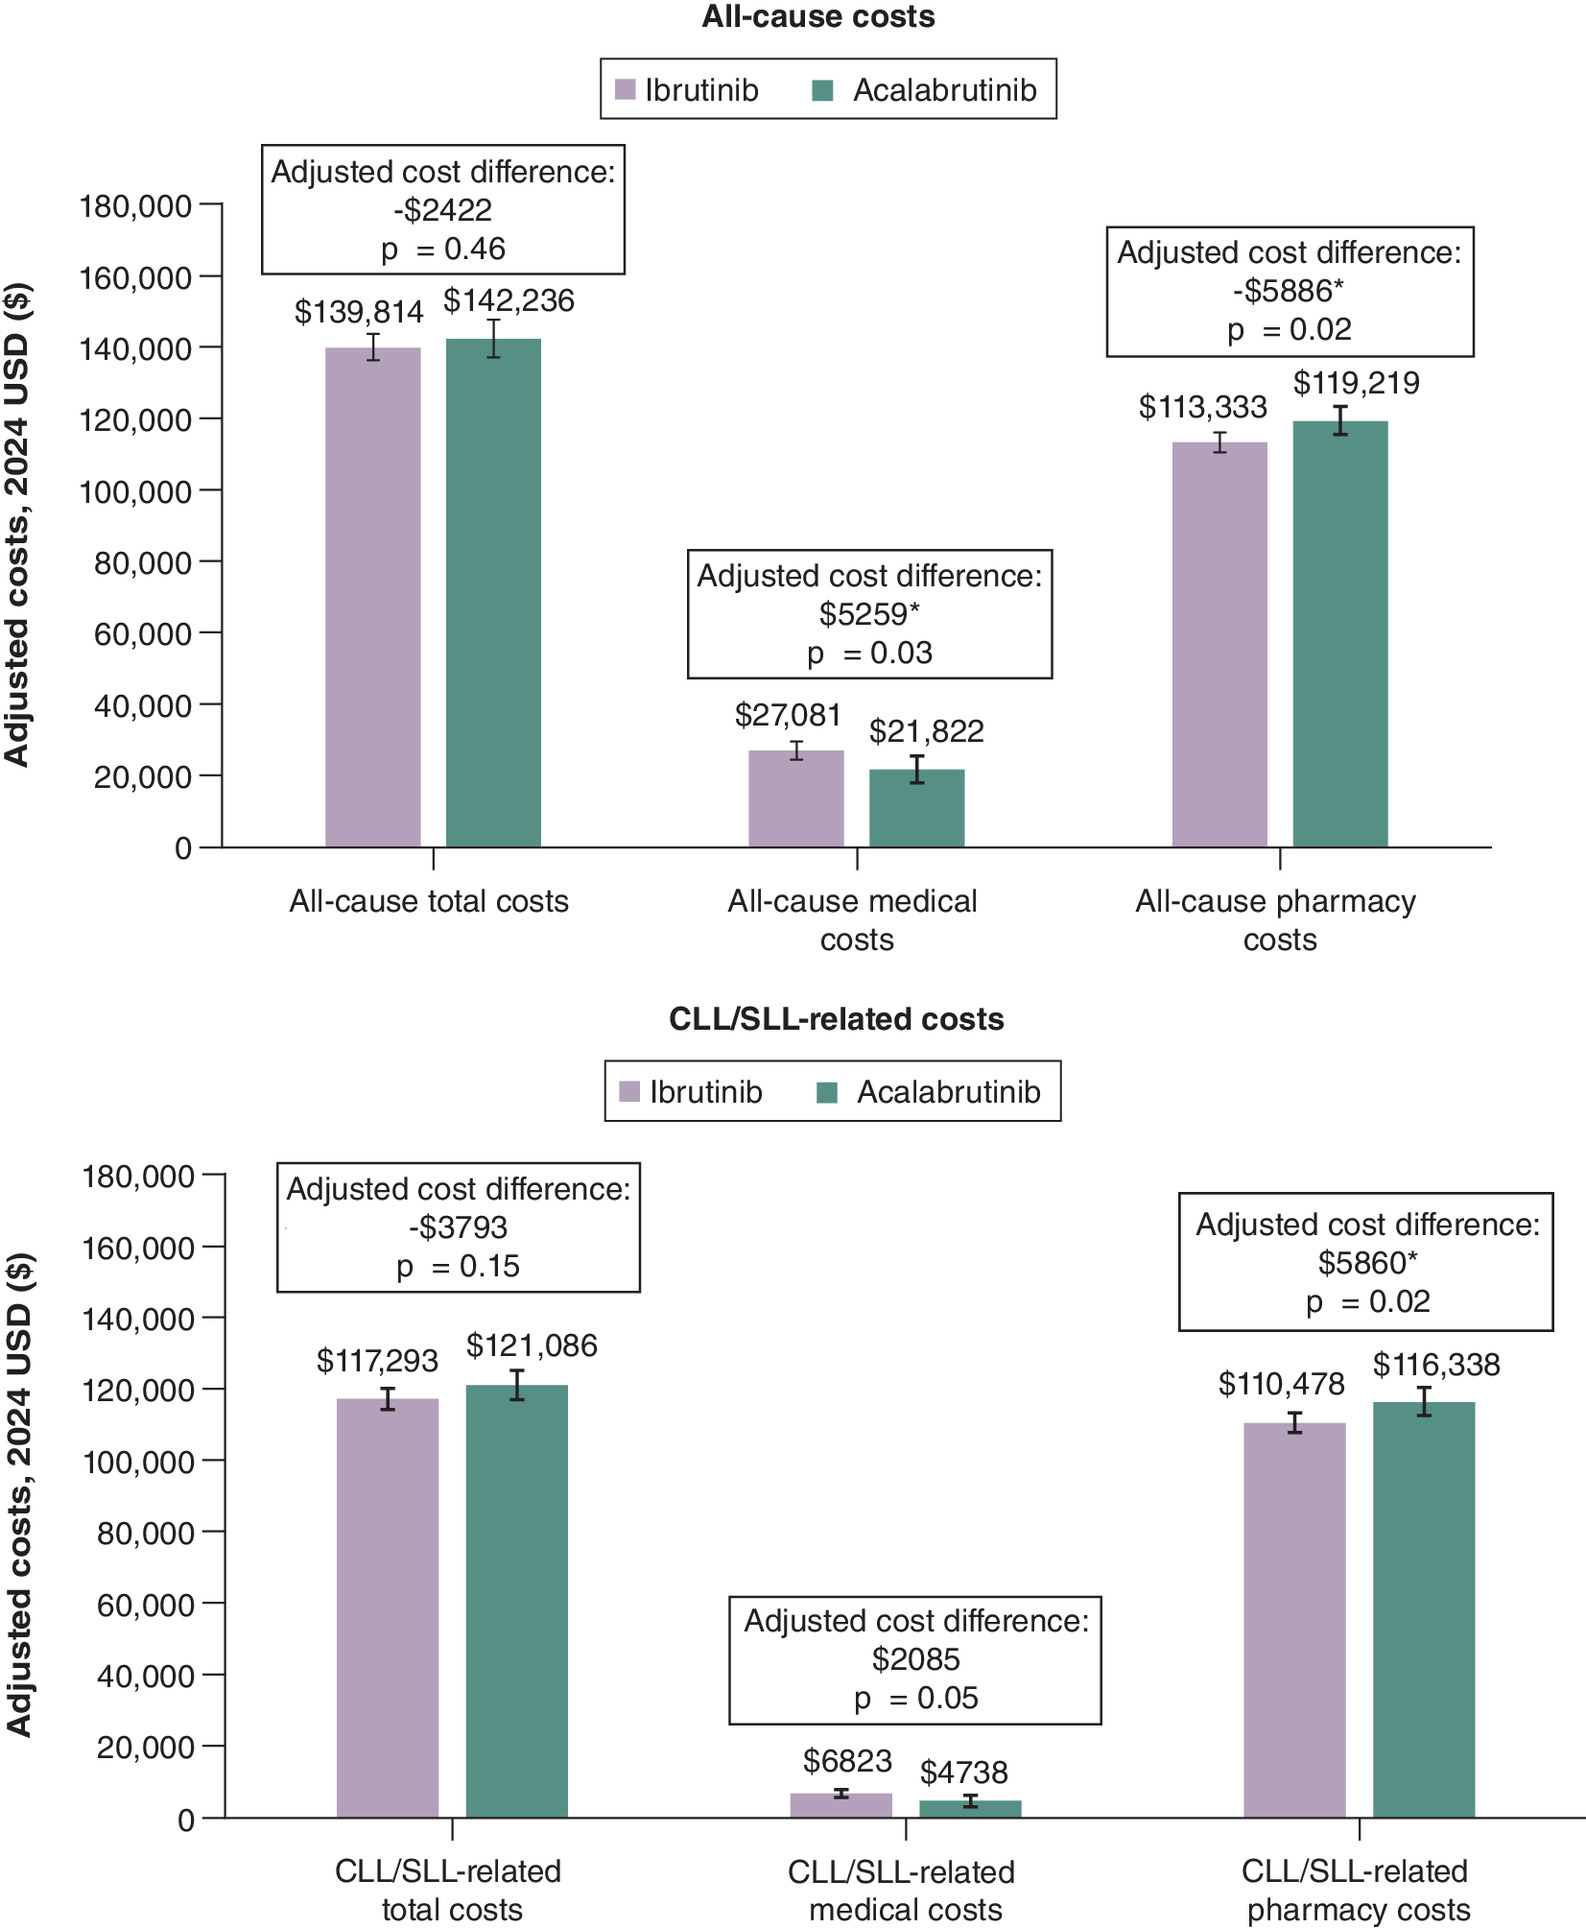
Figure 3. Adjusted all-cause and chronic lymphocytic leukemia/small lymphocytic lymphoma-related costs during the 12-month follow-up period.
*p < 0.05; error bars show 95% confidence interval.
CLL: Chronic lymphocytic leukemia; SLL: Small lymphocytic lymphoma; USD: US dollar.
Discussion
This is one of the largest studies evaluating healthcare costs of 1L ibrutinib monotherapy versus 1L acalabrutinib monotherapy using VHA data, the largest integrated healthcare system in the US. Adjusted comparisons of healthcare costs during the 12 months of continuous 1L treatment showed that both annual all-cause and CLL/SLL related total healthcare costs were similar between patients initiating ibrutinib versus acalabrutinib. The similar total healthcare cost was driven by lower pharmacy costs for ibrutinib balanced by lower medical costs for acalabrutinib. Notably, pharmacy costs were highest in the first 3 months of treatment and gradually declined over time for both ibrutinib and acalabrutinib.
The all-cause medical cost for patients taking ibrutinib was statistically higher than for patients taking acalabrutinib; however, CLL/SLL-related medical cost was similar between the cohorts, indicating non-CLL/SLL-related medical visits, specifically outpatient visits, contributed significantly to all-cause medical cost differences. While not examined directly in this study, it is possible that differential access to care may have led to these differences. For example, a numerically higher proportion of ibrutinib patients lived in rural areas compared with acalabrutinib (14.6 vs 11.0%), and patients in rural areas could have less access to regular monitoring and care, resulting higher rates of hospital outpatient and ED visits and associated costs [17].
The CLL/SLL-related pharmacy costs were the majority of the all-cause pharmacy costs, and both were significantly lower for ibrutinib. Across both cohorts, we observed that pharmacy costs were higher in the first 3 months than the following months, which could be due to nonadherence, prescription quantity (e.g., 30- vs 90-day supply), or dose adjustment. However, our results showed that the mean monthly dose remained relatively steady for all 12 months while patients were on treatment with ibrutinib and acalabrutinib, indicating that dose adjustment and non-adherence were likely not the main reason for pharmacy cost differences. That said, pharmacy costs, contributing to the total healthcare cost, may be impacted by the VHA-specific pricing contracts, formulary structures or utilization management. Future research examining patterns of treatment use and treatment costs would be meaningful.
Prior real-world analyses of BTKis in CLL have reported similar cost differences between ibrutinib and acalabrutinib. A study using IQVIA claims data by Muluneh et al. reported lower total CLL/SLL-related costs among patients who received 1L treatment with ibrutinib compared with acalabrutinib [29]. The study by Rogers et al. using Acentrus data, found statistically significantly lower all-cause and CLL/SLL-related costs for ibrutinib relative to acalabrutinib [30]. Both studies found that compared with acalabrutinib, ibrutinib was associated with a mean number of inpatient admissions and length of inpatient stay during 1L treatment similar to the findings reported in the current study. Interestingly, the studies by Muluneh et al. and Rogers et al. found that ibrutinib was associated with significantly fewer CLL/SLL physician office visits and/or significantly fewer outpatient visits than acalabrutinib, while our current study found that ibrutinib was associated with higher CLL/SLL-related outpatient visits than acalabrutinib. This discrepancy may be explained by differences in population characteristics between the VHA population and the Acentrus and IQVIA populations. The IQVIA study analyzed a younger, commercially insured population (mean age 64 years), whereas the VHA population in the current analysis includes older patients (mean age 73–74 years), who may have different comorbidity burdens, healthcare access patterns or monitoring needs. Additionally, the VHA population has been documented to represent a more rural population [19], which may differ from IQVIA or Acentrus.
Both studies also found that pharmacy costs contributed to the majority of total healthcare costs, and they also found lower pharmacy costs among those treated with ibrutinib compared with acalabrutinib, though the difference did not reach statistical significance in those studies. The differences in statistical significance between studies could be attributed to factors including the data source (the Acentrus study included pharmacy data drawn from medication orders and refills, whereas VHA data reflect a fully integrated healthcare system with distinct cost structures), as well as cost estimation methods (the Acentrus study estimated costs based on HRU data and literature-derived cost estimates, whereas the VHA data uses an activity-based costing approach, which captures direct and indirect costs associated with healthcare). Further, all-cause costs were not reported in the IQVIA study, limiting comparisons to this study of broader cost estimates. In addition, the IQVIA study employed a variable follow-up period, limiting the ability to draw direct comparisons with findings in this study. Though Muluneh et al. evaluated HRU and costs while on 1L treatment, there was a difference in follow-up between the ibrutinib cohort (1.2 years) and the acalabrutinib cohort (0.8 years). In contrast, the current study utilized a fixed 12-month follow-up period to assess costs specifically incurred while on treatment with BTKis among patients who were on treatment for an equivalent amount of time. This approach excludes patients who discontinued early, had inconsistent adherence or persistence, or initiated new or additional therapies. As a result, the current analysis provides a more direct comparison of HRU and cost outcomes between the two BTKi cohorts during 1L monotherapy, without the confounding influence of post-treatment events.
The economic impact of BTKis has also been evaluated in studies of broader treatment comparisons. One recent study used IQVIA claims to evaluate costs among patient initiating 1L therapy with ibrutinib, acalabrutinib and venetoclax + Obinutuzumab [31]. The authors found that, during the first 12 months of treatment, costs were higher for combination venetoclax + obinutuzumab (PPPM: $17,839) compared with ibrutinib ($15,066) and acalabrutinib ($15,219), suggesting that while on-treatment, BTKis are more cost saving. A claims-based study that compared ibrutinib to CT or CIT found that patients treated with ibrutinib as 1L treatment had significantly lower HRU costs and costs compared with patients receiving CT or CIT for office and outpatient visits (p < 0.0001) [32]. Additionally, ED visits were significantly higher for both CT- and CIT-treated patients (p < 0.05), while ED costs were slightly higher for ibrutinib patients, but the difference was not statistically significant. Another claims study that assessed HRU and costs among patients initiating front-line ibrutinib or CIT found that higher pharmacy costs for ibrutinib (mean monthly cost difference [MMCD] = $6849) were offset by lower medical costs (MMCD = -$10,615), yielding net savings (MMCD = -$3766) versus CIT (all p < 0.0001).
More recent studies using VHA data [20] and Medicare claims data [33] further support the cost-saving potential of ibrutinib compared with CIT. In a VHA study, ibrutinib was associated with higher pharmacy costs (MMCD = $5204, p < 0.05) but significantly lower medical costs (MMCD = -$7308, p < 0.05), resulting in net monthly all-cause cost savings of -$2160, though not statistically different [20]. A Medicare study found a similar pattern, whereby patients treated with ibrutinib incurred significantly higher monthly pharmacy costs during 1L duration (MMCD = $4892, p < 0.001) that were fully offset by lower monthly medical costs (MMCD = -$5888, p < 0.001), yielding a monthly lower total healthcare cost reduction (MMCD = -$996, p < 0.001) [33]. While there is more research evaluating the cost of ibrutinib compared with other treatments (potentially due to its earlier approval), these studies demonstrate the potential for BTKis to reduce overall healthcare costs compared with the traditional treatments.
Policies that address drug pricing should consider the substantial pharmacy cost burden associated with BTKis. This study, in line with the Acentrus and IQVIA studies, found that costs of BTKis contribute to the majority of CLL/SLL-related total costs (81–96%), indicating that pharmacy expenditures are the primary driver of budget impact for these patients in the VHA system. For the VHA, which is a single-payer system with centralized drug procurement and negotiation authority, these findings have important implications for formulary decision-making, contract structuring, and long-term financial planning. To address high drug costs, recent policy changes such as the IRA aim to enhance pricing negotiations [34]. In this context, understanding the budget impact, cost–effectiveness and overall economic and clinical value of a drug will be critical in supporting these negotiations and evaluating the impact of these policies in the future.
As more BTKis become available, including agents with potentially distinct safety profiles, dosing schedules and prices, it will become increasingly important to assess the total cost of care and the comparative value of each option. Nonetheless, once the Medicare IRA is implemented in 2026, the cost data reported here can potentially be used as a benchmark in maximizing the value of BTKi in the management of patient care. Budget impact analyses that incorporate both drug acquisition costs and downstream medical utilization can guide not only treatment decisions from a clinical standpoint but also inform sustainable resource allocation within the VHA.
Limitations
Results from this study are subject to limitations. First, the unique structure of the VHA system, including its comprehensive healthcare coverage, may limit generalizability to other settings. However, the comprehensiveness and geographical reach of VHA data makes this real-world study one of the largest of its kind, providing valuable insights into the treatment experiences of patients with CLL/SLL. Second, the costs used in the VHA were derived using an activity-based costing approach, which captures both direct and indirect patient-specific costs. Therefore, these cost estimates may not be generalizable to other healthcare systems that use different costing methodologies, such as claims-based or imputed cost calculations. Despite this, patterns of cost between treatment arms should remain consistent. Third, as this was a retrospective analysis based on structured EMR data from the VHA, the data may be subject to omissions or inaccuracies. However, these are expected to be random and affect all patients equally, minimizing the impact on the conclusions presented here. Fourth, in order to mitigate potential time-related selection bias due to the later approval of acalabrutinib, this study required patients in both the ibrutinib and acalabrutinib cohorts to initiate therapy within same time window, when patients would have both BTKi options (i.e., index dates on or after the approval of acalabrutinib, 21 November 2019).
In addition, this study population was restricted to patients who remained on 1L BTKi therapy for ≥12 months, to ensure that differences in cost outcomes were not confounded by variations such as early treatment discontinuation, differences in drug adherence/persistence, or new/add-on treatment initiation. This design strengthens the comparability of the two treatment groups and allows for a more accurate assessment of cost differences driven by treatment choice rather than different persistence patterns. However, this study design comes with inherent limitations related to external validity. First, the findings may not reflect the full spectrum of patients with CLL/SLL, particularly those who discontinued therapy early due to adverse events, disease progression, or other factors, and those with <12 months of follow-up, and as a result, generalizability to all treatment initiators may be limited. In addition, though the first year following treatment with BTKi therapy is often characterized by close monitoring, and as such, is a clinically relevant time period to assess HRU and costs, restricting the sample to patients with ≥12 months of continuous treatment may reduce generalizability, as individuals who discontinued treatment earlier were excluded.
Despite the use of adjusted models for cost comparisons, potential unmeasured confounding may remain. Clinical parameters such as genetic mutation, or patient performance status were not available in the structured EMR data and could influence treatment selection and healthcare utilization patterns. Residual confounding from these or other unobserved clinical factors may have affected cost estimates. Additionally, differences in monitoring practices between ibrutinib and acalabrutinib may have contributed to differences in outpatient utilization and associated medical costs.
Further, this study highlights opportunities for future investigation. Zanubrutinib was not included in the analysis, due to limited sample size and short follow-up time available at the time of data analysis. As zanubrutinib becomes more widely used in clinical practice, future research will be important to evaluate its cost implications in real-world settings. In addition, longer follow-up would be valuable to assess evolving clinical complications, treatment sequences, and long-term cost trajectories beyond the first year of therapy. Finally, because this study did not include data on clinical outcomes such as disease progression, adverse events, or treatment response, which are factors that could influence healthcare utilization and cost patterns, future research incorporating these outcomes could provide important clinical context for interpreting cost differences.
Conclusion
To our knowledge, this is the first study to evaluate costs among patients with CLL/SLL in the VHA population who initiated and remained on treatment with 1L BTKi monotherapy for 12 months. Annual all-cause and CLL/SLL-related total healthcare costs were similar between patients initiating ibrutinib or acalabrutinib. Pharmacy costs were lower for ibrutinib, while medical costs were lower for acalabrutinib, resulting in overall comparable total costs. While costs in this study may be different than those outside the VHA, these results can add to the body of evidence for future research on cost of care with BTKis following implementation of IRA policies.
Summary points
•
Chronic lymphocytic leukemia (CLL) and small lymphocytic lymphoma (SLL) are common blood cancers in the US, with recommended first-line (1L) treatment with targeted therapies like BTK inhibitors (BTKis), which have improved outcomes.
•
This retrospective study compared healthcare costs between two 1L BTKis, ibrutinib and acalabrutinib, among patients in the Veterans Health Administration (VHA) with CLL/SLL.
•
Real-world data were captured from the VHA database between January 2006 and July 2024, and the study included patients who initiated treatment on or after November 2019 (ibrutinib: n = 732, acalabrutinib: n = 327).
•
During the one-year follow-up period while patients were on continuous treatment, patients treated with ibrutinib and patients treated with acalabrutinib had similar overall healthcare costs, with ibrutinib showing numerically lower total healthcare costs.
•
Specifically, annual all-cause total healthcare costs were $139,589 for the ibrutinib cohort and $142,749 for the acalabrutinib cohort, with most costs being CLL/SLL-related ($117,301 and $121,069, respectively).
•
After adjustment for age, sex, Charlson comorbidity index, baseline inpatient or emergency department visits, baseline outpatient visits, and baseline COVID-19 diagnosis, the annual all-cause total healthcare cost difference of ibrutinib compared with acalabrutinib was -$2422 (p = 0.46) and CLL/SLL-related total healthcare cost difference was -$3793 (p = 0.15).
•
Pharmacy costs made up the majority of total costs (81–96%) for both treatment groups, particularly in the first 3 months of therapy, and were significantly lower in the ibrutinib cohort (all-cause: -$5886, p < 0.05; CLL/SLL-related: -$5860, p < 0.05).
•
These findings establish a pre-Inflation Reduction Act benchmark for future cost research and healthcare planning related to BTKi therapies in CLL/SLL.
Author contributions
Authors F Mu, ZP Qureshi, A Bokun, SA Graf and L Fitzgerald were responsible for study conception and design. Authors A Lax, F Mu, E Wu, ZP Qureshi and S Ghosh were responsible for study methodology. Authors A Lax, F Mu, E Wu, S Ghosh, Y Lin and L Shi were responsible for formal analysis and investigation. Authors A Lax, F Mu, S Ghosh, ZP Qureshi, SA Graf, L Fitzgerald and A Bokun were responsible for manuscript writing including original draft preparation, review and editing. Authors A Lax, F Mu, E Wu, S Ghosh and ZP Qureshi were responsible for supervision.
Acknowledgments
Medical writing support was provided by Cody Patton, a contractor working on behalf of Analysis Group, Inc. The authors acknowledge the contributions of Erin Cook, Jingyi Chen and Grace Chen of Analysis Group, Inc. for their assistance with manuscript preparation and statistical analysis.
Financial disclosure
This study was funded by Janssen Scientific Affairs, a Johnson & Johnson Company. S Ghosh, A Bokun and ZP Qureshi are employees of Janssen Scientific Affairs, a Johnson & Johnson Company. SA Graf has received Institutional Research Funding from Janssen Pharmaceuticals, TG Therapeutics, Acerta Pharma/AstraZeneca, BeiGene, Loxo/Lilly, Genentech. A Lax, F Mu and E Wu are employees of Analysis Group, a paid consultant to the sponsors in connection with the development of this manuscript.
Competing interests disclosure
The authors have no competing interests or relevant affiliations with any organization or entity with the subject matter or materials discussed in the manuscript. This includes employment, consultancies, honoraria, stock ownership or options, expert testimony, grants or patents received or pending, or royalties. The contents do not represent the views of the US Department of Veterans Affairs or the US Government.
Writing disclosure
Medical writing and editorial support were provided by Cody Patton, a contractor working on behalf of Analysis Group, Inc., and were funded by Janssen Scientific Affairs, a Johnson & Johnson Company.
Ethical conduct of research
The study design was determined to be exempt from Institutional Review Board review by the Southeast Louisiana Veterans Health Care System Institutional Review Board in September 2023.
Data sharing statement
As the data supporting the findings of this study were used under license for the current study, restrictions apply to the authors’ ability to make data publicly available. The data are available from the Veterans Health Administration. For more information, please contact the corresponding author, ZP Qureshi.
Open access
This work is licensed under the Attribution-NonCommercial-NoDerivatives 4.0 Unported License. To view a copy of this license, visit https://creativecommons.org/licenses/by-nc-nd/4.0/
Supplementary Material
File (supplementary data.docx)
- Download
- 47.35 KB
References
Papers of special note have been highlighted as: • of interest; •• of considerable interest
1.
Siegel RL, Miller KD, Jemal A. Cancer statistics, 2020. CA Cancer J. Clin. 70(1), 7–30 (2020).
2.
National Cancer Institute. Cancer stat facts: NHL — chronic lymphocytic leukemia/small lymphocytic lymphoma (CLL/SLL). (2021). Available from: https://seer.cancer.gov/statfacts/html/cllsll.html
3.
Palma M, Mulder TA, Österborg A. BTK Inhibitors in chronic lymphocytic leukemia: biological activity and immune effects. Front. Immunol. 12, 686768 (2021).
4.
Raedler LA. Imbruvica (Ibrutinib), first-in-class Bruton's tyrosine kinase inhibitor, receives expanded indications for patients with relapsed chronic lymphocytic leukemia. Am. Health Drug Benefits 8(Spec. Feature), 66–69 (2015).
5.
Burger JA, Tedeschi A, Barr PM et al. Ibrutinib as initial therapy for patients with chronic lymphocytic leukemia. N. Engl. J. Med. 373(25), 2425–2437 (2015).
•• Summarizes the results of the phase III RESONATE-2 trial and shows that ibrutinib was superior to chlorambucil in previously untreated patients with chronic lymphocytic leukemia/small lymphocytic lymphoma (CLL/SLL).
6.
Sharman JP, Egyed M, Jurczak W et al. Acalabrutinib with or without obinutuzumab versus chlorambucil and obinutuzmab for treatment-naive chronic lymphocytic leukaemia (ELEVATE TN): a randomised, controlled, Phase III trial. Lancet 395(10232), 1278–1291 (2020).
•• Summarizes the results of the phase III ELEVATE-TN trial and shows that acalabrutinib improved progression-free survival over traditional chemoimmunotherapy (CIT).
7.
Referenced with permission from the NCCN Clinical Practice Guidelines in Oncology (NCCN Guidelines®) for Chronic Lymphocytic Leukemia/Small Lymphocytic Lymphoma V.1.2025. © National Comprehensive Cancer Network, Inc. (2024). All rights reserved. Accessed [November 28, 2024]. To view the most recent and complete version of the guideline, go online to NCCN.org. NCCN makes no warranties of any kind whatsoever regarding their content, use or application and disclaims any responsibility for their application or use in any way.
•• Guidelines for the treatment of CLL/SLL are provided.
8.
IMBRUVICA (ibrutinib). Prescribing Information. Janssen Biotech, Inc, Horsham, PA (2020).
9.
Fraser G, Cramer P, Demirkan F et al. Updated results from the Phase III HELIOS study of ibrutinib, bendamustine, and rituximab in relapsed chronic lymphocytic leukemia/small lymphocytic lymphoma. Leukemia 33(4), 969–980 (2019).
10.
Moreno C, Greil R, Demirkan F et al. Ibrutinib plus obinutuzumab versus chlorambucil plus obinutuzumab in first-line treatment of chronic lymphocytic leukaemia (iLLUMINATE): a multicentre, randomised, open-label, Phase III trial. Lancet Oncol. 20(1), 43–56 (2019).
11.
Shanafelt TD, Wang XV, Kay NE et al. Ibrutinib-rituximab or chemoimmunotherapy for chronic lymphocytic leukemia. N. Engl. J. Med. 381(5), 432–443 (2019).
12.
Woyach JA, Ruppert AS, Heerema NA et al. Ibrutinib regimens versus chemoimmunotherapy in older patients with untreated CLL. N. Engl. J. Med. 379(26), 2517–2528 (2018).
13.
Byrd JC, Hillmen P, Ghia P et al. Acalabrutinib versus ibrutinib in previously treated chronic lymphocytic leukemia: results of the first randomized Phase III trial. J. Clin. Oncol. 39(31), 3441–3452 (2021).
14.
Jacobs R, Lu X, Emond B et al. Time to next treatment in patients with chronic lymphocytic leukemia initiating first-line ibrutinib or acalabrutinib. Future Oncol. 20(1), 39–53 (2024).
15.
Huntington SF, Manzoor BS, Jawaid D et al. Real-world comparison of health care costs of venetoclax-obinutuzumab vs Bruton's tyrosine kinase inhibitor use among US Medicare beneficiaries with chronic lymphocytic leukemia in the frontline setting. J. Manag. Care Spec. Pharm. 30(10), 1106–1116 (2024).
16.
Byfield SD, Small A, Becker LK et al. Differences in treatment patterns and health care costs among non-Hodgkin's lymphoma and chronic lymphocytic leukemia patients receiving rituximab in the hospital outpatient setting versus the office/clinic setting. J. Cancer Ther. 5(2), 208–216 (2014).
17.
Lee T-Y, Johnson A, Cooke CE et al. Costs and health care resource utilization among Medicare beneficiaries diagnosed with chronic lymphocytic leukemia. J. Manag. Care Spec. Pharm. 30(5), 430–440 (2024).
• This real-world study using Medicare data highlighted different factors, including geographic variations, that may impact cost and healthcare resource use (HRU).
18.
Raymakers AJN, Kesselheim AS, Rome BN. Medicare price negotiation: the example of ibrutinib. (2023). Available from: https://www.healthaffairs.org/content/forefront/medicare-price-negotiation-under-inflation-reduction-act-example-ibrutinib
19.
US Department of Veterans Affairs. Ways Veterans differ from the general population April 15, 2025. Available from: https://www.mentalhealth.va.gov/suicide_prevention/docs/FSTP-Ways-Veterans-Differ-from-the-General-Population.pdf
20.
Huang Q, Borra S, Li J et al. Time to next treatment, health care resource utilization, and costs associated with ibrutinib use among U.S. veterans with chronic lymphocytic leukemia/small lymphocytic lymphoma: a real-world retrospective analysis. J. Manag. Care Spec. Pharm. 26(10), 1266–1275 (2020).
• This real-world study demonstrates that among US veterans, 1L ibrutinib was associated with lower HRU and medical costs compared with 1L CIT.
21.
US Department of Veterans Affairs. Chronic B-cell Leukemias and Agent Orange [November 28, 2023]. Available from: https://www.publichealth.va.gov/exposures/agentorange/conditions/bcell-leukemia.asp
22.
American Cancer Society. Chronic lymphocytic leukemia causes, risk factors, and prevention [November 28, 2023]. Available from: https://www.cancer.org/content/dam/CRC/PDF/Public/8680.00.pdf
23.
Vaughan-Sarrazin M, Bayman L, Rosenthal G et al. The business case for the reduction of surgical complications in VA hospitals. Surgery 149(4), 474–483 (2011).
24.
Schweizer ML, Cullen JJ, Perencevich EN et al. Costs associated with surgical site infections in veterans affairs hospitals. JAMA Surg. 149(6), 575–581 (2014).
25.
US Census Bureau. Census regions and divisions of the United States [April 23, 2025]. Available from: https://www2.census.gov/geo/pdfs/maps-data/maps/reference/us_regdiv.pdf
26.
US Department of Agriculture Economic Research Service. Rural-urban commuting area codes [April 23, 2025]. Available from: https://www.ers.usda.gov/data-products/rural-urban-commuting-area-codes
27.
Quan H, Li B, Couris CM et al. Updating and validating the Charlson comorbidity index and score for risk adjustment in hospital discharge abstracts using data from 6 countries. Am. J. Epidemiol. 173(6), 676–682 (2011).
28.
Fortney JC, Borowsky SJ, Hedeen AN et al. VA community-based outpatient clinics: access and utilization performance measures. Med. Care 40(7), 561–569 (2002).
29.
Muluneh B, He J, Ding Z et al. EE694 Evaluation of healthcare resource utilization and cost among first-line patients receiving ibrutinib vs acalabrutinib for chronic lymphocytic leukemia/small lymphocytic lymphoma (CLL/SLL): a commercial claims database analysis. Value Health 26(12), S188 (2023).
• This study using commercial claims data shows that 1L ibrutinib was associated with fewer CLL/SLL-related outpatient visits and lower total cost compared with 1L acalabrutinib.
30.
Rogers KA, Muluneh B, Qureshi ZP et al. A comparison of healthcare resource utilization and costs between patients with chronic lymphocytic leukemia treated with first-line ibrutinib or acalabrutinib using two large US real-world databases. J. Comp. Eff. Res. 14(6), e240210 (2025).
• This study using EHR data shows that 1L ibrutinib was associated with a lower outpatient visits and lower all-cause and CLL/SLL-related costs compared with acalabrutinib.
31.
Ravelo A, Patel A, To TM. Real-world healthcare costs among patients with chronic lymphocytic leukemia receiving first-line treatment with venetoclax+ obinutuzumab versus bruton's tyrosine kinase inhibitors. Presented at the 12Th Annual Meeting of the Society of Hematologic Oncology (SOHO 2024). TX, USA, 4-7 September 2024 (2024).
32.
Nabhan C, Nero D, Lee CH et al. Cost-effectiveness comparison between ibrutinib, chemotherapy, and chemoimmunotherapy in front-line treatment of chronic lymphocytic leukemia (CLL). Blood 132(Suppl. 1), 4757 (2018).
33.
Huang Q, Emond B, Lafeuille MH et al. Healthcare resource utilization and costs associated with first-line ibrutinib compared to chemoimmunotherapy treatment among Medicare beneficiaries with chronic lymphocytic leukemia. Curr. Med. Res. Opin. 36(12), 2009–2018 (2020).
34.
Shih Y-CT, Yabroff KR, Bradley CJ. Prescription drug provisions in the Inflation Reduction Act: any relief of financial hardship for patients with cancer? JAMA Oncol. 9(2), 165–167 (2023).
Information & Authors
Information
Published In
Copyright
© 2025 Janssen Scientific Affairs, a Johnson & Johnson Company. This work is licensed under the Attribution-NonCommercial-NoDerivatives 4.0 Unported License
History
Received: 19 June 2025
Accepted: 9 September 2025
Published online: 14 October 2025
Keywords:
Topics
Authors
Metrics & Citations
Metrics
Article Usage
Article usage data only available from February 2023. Historical article usage data, showing the number of article downloads, is available upon request.
Citations
How to Cite
Healthcare cost comparison between first-line ibrutinib and acalabrutinib in chronic lymphocytic leukemia patients in the Veterans Affairs. (2025) Journal of Comparative Effectiveness Research. DOI: 10.57264/cer-2025-0084
Export citation
Select the citation format you wish to export for this article or chapter.