

Mortality and inpatient hospitalizations by anti-plasma cell dyscrasia treatment patterns among patients with cardiac light chain amyloidosis: results from a US administrative claims database
Publication: Journal of Comparative Effectiveness Research
Abstract
Aim: To gain insights into real-world mortality and hospitalization among newly diagnosed patients with light chain (AL) amyloidosis initiating anti-plasma cell dyscrasia treatment. Materials & methods: This retrospective, noninterventional, observational study evaluated real-world mortality by treatment patterns and hospitalization among adult patients newly diagnosed with AL amyloidosis with cardiomyopathy in the US IQVIA PharMetrics claims database. Data from treatment initiation (index date) to 365 days postindex were evaluated. Patients receiving treatments for AL amyloidosis in the year prior to the index date were excluded. AL-, cardiac-, and cardiac/renal-related healthcare resource utilization were assigned using the International Classification of Diseases, Tenth Revision. Summary statistics are reported by cardiac or cardiac/renal involvement. Results: A total of 198 patients with cardiac AL amyloidosis were included in this study (mean age, 64.8 years; 70.7% male). The 1-year mortality and condition-related hospitalization rates among all patients were 9.1% (18 of 198) and 65.7% (130 of 198), respectively. Daratumumab was prescribed for 138 (69.7%) patients, with 1-year mortality and condition-related hospitalization rates of 7.2% (10 of 138) and 67.4% (93 of 138), respectively. Daratumumab was not prescribed for 60 (30.3%) patients, with 1-year mortality and condition-related hospitalization rates of 13.3% (8 of 60) and 61.7% (37 of 60), respectively. One-year mortality and condition-related hospitalization rates among patients with only cardiac involvement (n = 66) were 7.6% (5 of 66) and 45.5% (30 of 66), respectively, and 9.8% (13 of 132) and 75.8% (100 of 132), respectively, among patients with cardiac and renal involvement (n = 132). Conclusion: Treatment patterns varied considerably among patients with AL amyloidosis. Mortality and hospitalizations were higher among patients with both cardiac and renal involvement than among those with only cardiac involvement.
Plain language summary
What is this article about?
Light chain (AL) amyloidosis is a progressive, debilitating and devastating rare disease often characterized by heart and/or kidney deterioration that may lead to hospitalization and death. Current treatment is aimed at reducing the production of amyloid fibrils. In clinical trials, recent advances in chemotherapy have improved survival among patients, especially those diagnosed in early stages of the disease. However, these benefits are not observed in patients diagnosed with severe heart disease. There is very little information on the real-world impact of these treatments. In this study, we evaluated mortality and hospitalization among patients with cardiac AL amyloidosis in the PharMetrics claims database during 12 months from the start of their treatment.
What were the results?
We found that almost two-thirds of the patients were hospitalized and almost 1 in 10 died in the year after diagnosis and starting treatment. Patients with both heart and kidney involvement (three-fourths hospitalized and almost 1 in 10 dead) fared worse than those with only heart disease (less than half hospitalized; less than 1 in 10 dead).
What do the results mean?
Our data show that even with the advent of new chemotherapeutic drugs, a significant unmet need remains, especially among patients with AL amyloidosis diagnosed with both cardiac and renal involvement, for treatments that improve key patient outcomes of survival and hospitalization.
Light chain (AL) amyloidosis is a rare, progressive, severe and often fatal systemic disease of protein deposition caused by plasma cell dyscrasia (PCD) overproducing abnormal light chains [1,2]. AL amyloidosis is characterized by misfolding of light chains that combine to form insoluble amyloid fibrils, which then deposit in organs and cause dysfunction, damage and eventually death [1,2]. Fibril deposition can occur in multiple sites, with more than 75% of patients with AL amyloidosis having cardiac involvement, more than 60% having renal involvement, and 59% having neurologic symptoms [1,3]. The extent of cardiac involvement determines disease severity and stage at diagnosis, which informs treatment regimen and probability of survival [1]. The significant morbidity and mortality observed in AL amyloidosis are driven by restrictive cardiomyopathy and congestive heart failure that occur due to fibril deposition in the heart [4,5]. More than half of patients exhibit comorbidities in three or more systems [3]. Among patients with advanced disease (Mayo stage IIIb) median survival is less than 1 year, with early mortality observed in 40% of patients [1].
Current standard of care (SoC) is focused on eliminating the plasma cell clone generating the amyloidogenic fibrils, i.e., anti-PCD therapy. It includes daratumumab in combination with cyclophosphamide, bortezomib, and dexamethasone (CyBorD) for treating AL amyloidosis with an aim to target the PCD and stop the production of amyloidogenic light chains [6–9]. Other combinations of drugs are also recommended when access to current SoC is difficult or if patients relapse or are refractory to initial treatment [9]. At present, daratumumab is the only agent approved for treating AL amyloidosis [6]. Advances in treatment have improved survival rates in patients with AL amyloidosis [10]. However, these improvements in survival are disproportionately observed in patients diagnosed with early stages of the disease, with an unmet therapeutic need still remaining among patients with more clinically advanced AL amyloidosis with cardiomyopathy [1,10].
Limited real-world data exist on clinical outcomes for patients with AL amyloidosis with cardiac involvement, especially when stratified by additional organ involvement, specifically the kidney, following the shift in treatment paradigm after the approval of daratumumab in early 2021 [6]. In particular, there is limited descriptive evidence on treatment patterns, recorded mortality, and inpatient hospitalizations in this patient group. In this paper, we aim to evaluate data from a claims database for mortality and condition-related hospitalization rates among patients diagnosed with AL amyloidosis with cardiomyopathy who have newly initiated anti-PCD treatment.
Materials & methods
Study design & patient population
This was a retrospective, noninterventional, observational study of adults in the US IQVIA PharMetrics claims database diagnosed with AL amyloidosis with cardiac involvement, with or without renal involvement, who newly initiated anti-PCD treatment between 1 January 2021 and 31 March 2023 (index date). The full study period was 1 January 2020 to 31 March 2024, which included 12 months prior to the earliest index date and 12 months after the last included index date.
Adult (aged ≥18 years) patients with International Classification of Diseases, Tenth Revision (ICD-10) diagnosis codes for AL amyloidosis (E85.81) in any position during the 365 days prior to the index date who had newly initiated treatment with an anti-PCD, bortezomib-, or daratumumab-containing regimen between 1 January 2021 and 31 March 2023, and continuous medical and prescription insurance enrollment from 365 days preindex through 365 days postindex with a 30-day gap, or until death, were included in this study. Also included were patients with a verified diagnosis, i.e., two separate claims on different days, of AL amyloidosis, other amyloidosis or amyloidosis unspecified during the full study period with ICD-10 codes E85.81, E85.4, E85.89 or E85.9 in any position. Patients who died within the study period, except when death occurred in the same month as the index date, were included. Patients with any diagnosis of familial Mediterranean fever, nonmyeloma or nonlymphoma malignancy during the 365 days prior to index date, or secondary, transthyretin, or hereditary amyloidosis (E85.0, E85.1, E85.2, E85.3, E85.82) at any time during the study period were excluded. Also excluded were patients with any claim indicating treatment with bendamustine, bortezomib, carfilzomib, cyclophosphamide, daratumumab, ixazomib, lenalidomide, melphalan, pomalidomide, venetoclax or stem cell transplant during the 365 days prior to the index date.
Cardiac involvement was based on reported ICD-10 code families I42, I43 and I50 and specified Current Procedural Terminology (CPT) codes for heart replacement, heart or heart-to-lung transplantation, and ventricular-assist-device procedures. Renal involvement was based on reported N18 and N19, I12.0, selected I13.1, N03, and N05 codes, N25.0, selected Z49 codes, Z94.0, and Z99.2, together with specified CPT codes for renal transplantation and dialysis.
As this was a secondary analysis of an existing Health Insurance Portability and Accountability Act (HIPAA)-compliant claims database with no new data being collected, ethics approval of the protocol was not needed in accordance with guidelines from the Office of Human Subject Research Protections, National Institutes of Health, USA.
Assessments
All patients were assessed for all-cause mortality and condition-related inpatient hospitalization rates during the 1-year period following anti-PCD treatment initiation (index date). Condition-related inpatient hospitalization rates included those related to AL, cardiac or renal involvement, based on the following ICD-10 codes: AL (E85.4*, E85.81, E85.89, E85.9*), cardiac (I42.*, I43.*, I50.*) and renal (N18.*, N19.*, I12.0*, N03.*, N05.*). Assessments were stratified by use of daratumumab in the treatment regimen. Subset analyses were performed for patients with cardiac involvement alone or with combined cardiac and renal involvement.
Statistics
Data were summarized descriptively. Categorical variables are reported as counts and percentages, and continuous variables as means with standard deviations and medians with interquartile ranges. Recorded mortality within 365 days after the index date was summarized using counts and proportions. Time to death was summarized descriptively among patients with a recorded death within 365 days. Kaplan–Meier curves were used to display survival over the 365-day follow-up period. No formal between-group hypothesis tests or adjusted analyses were performed.
Results
Patients & treatment patterns
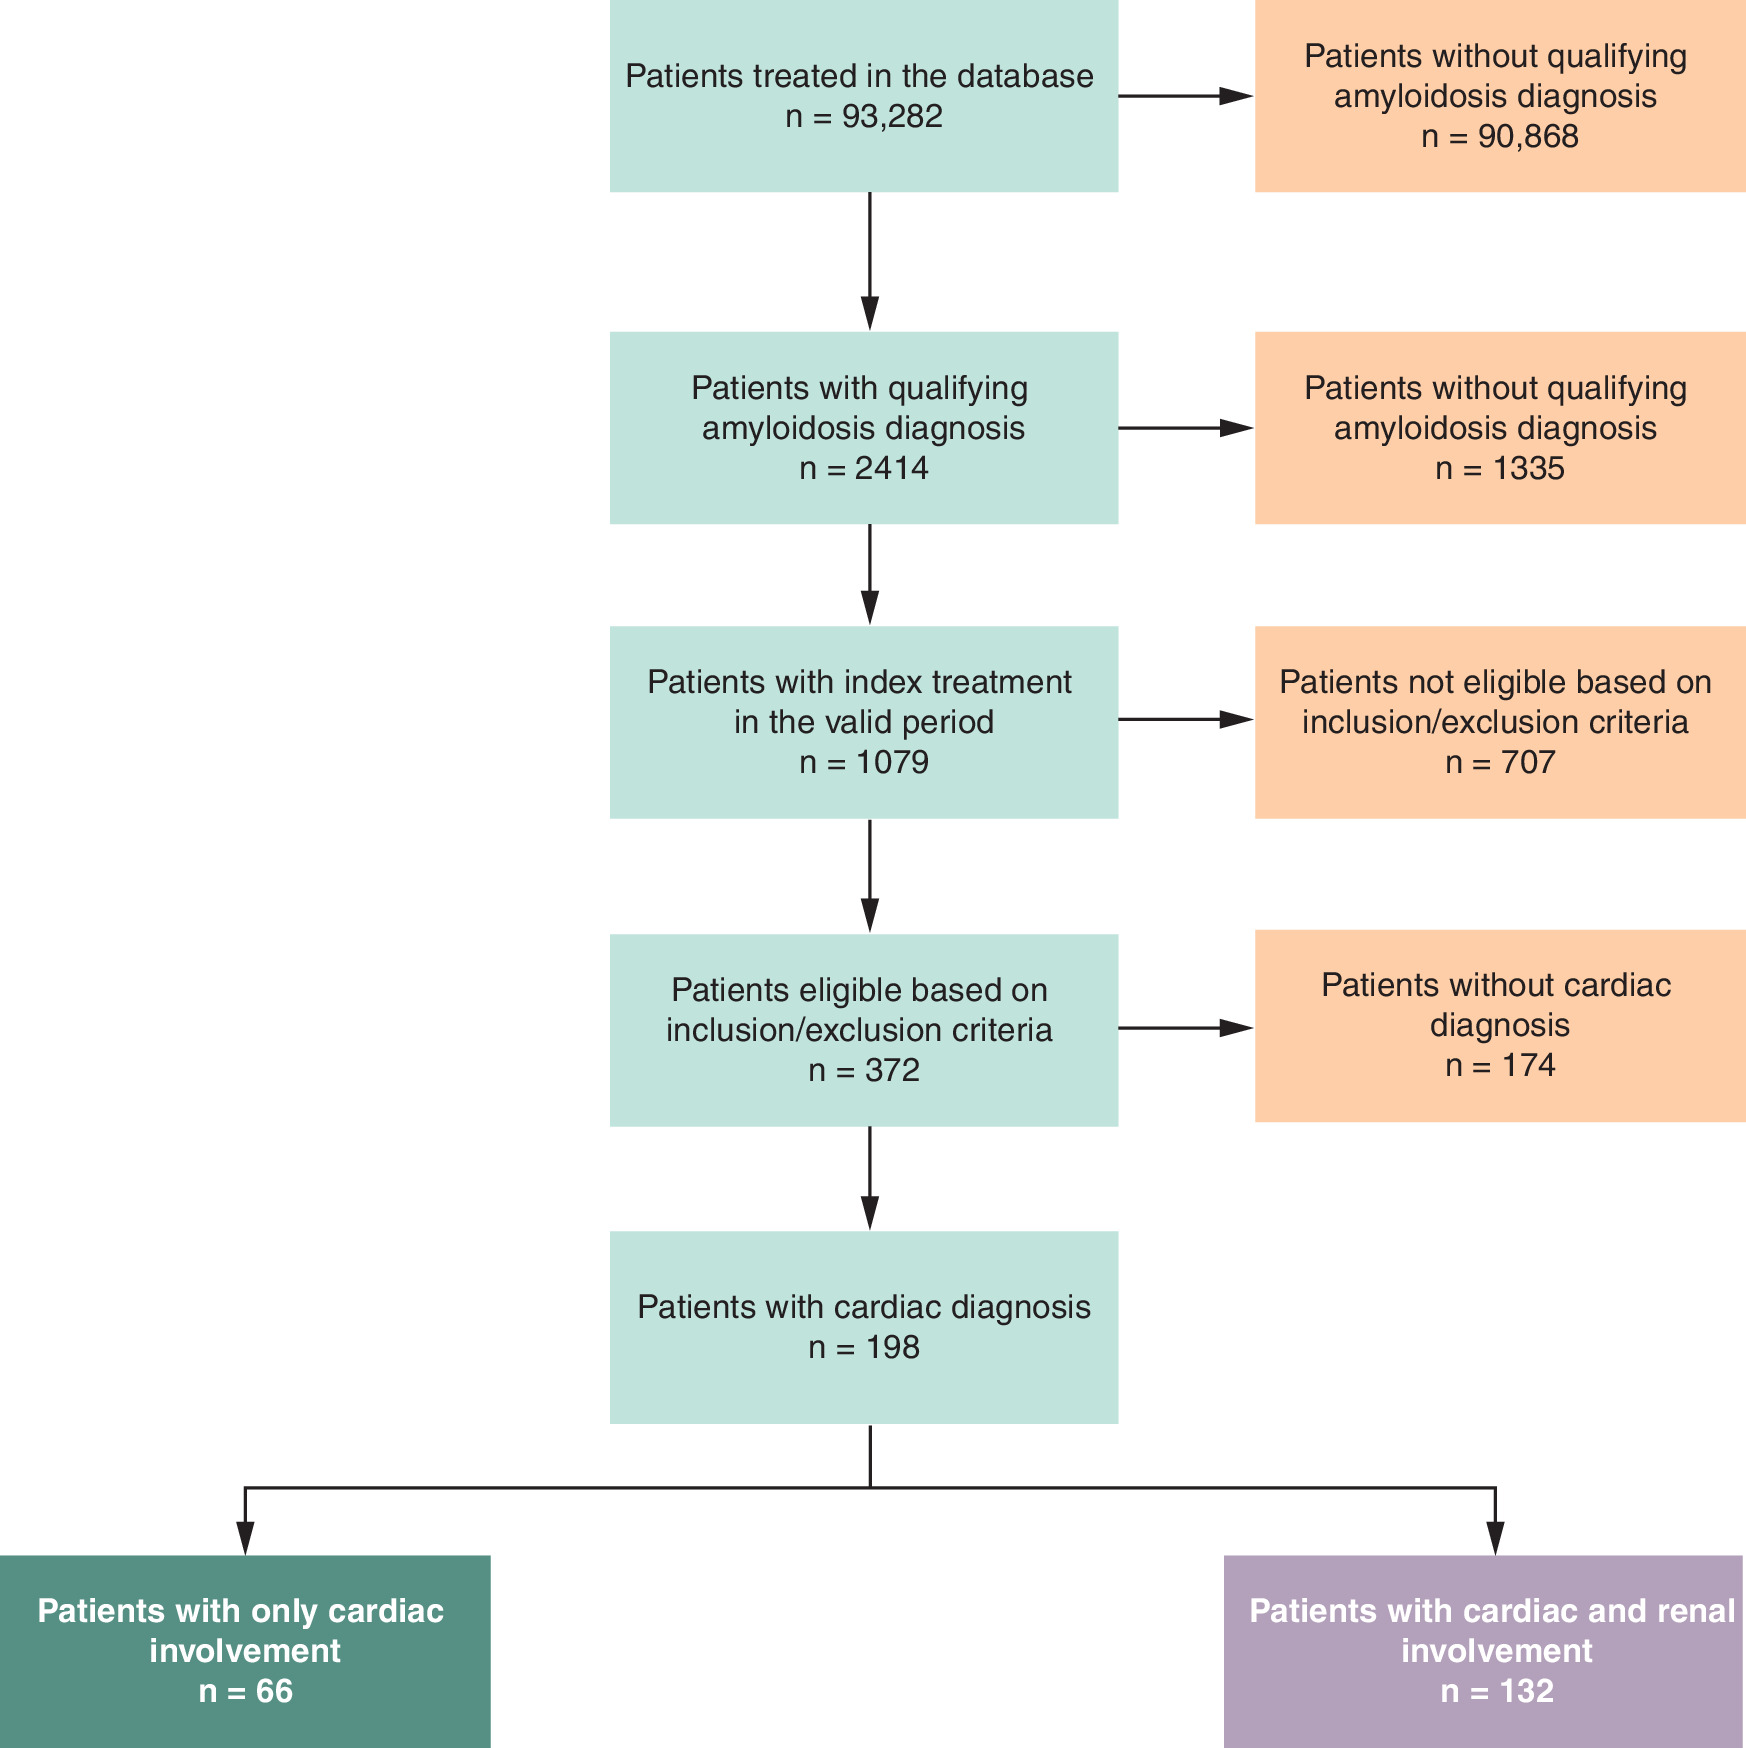
Of the 93,282 patients in the database, 198 patients met all the criteria for inclusion in this study (Figure 1). The majority (>70%) of the 198 patients with AL amyloidosis identified in the database were male, with a mean age of 65 years (Table 1). All patients had cardiac disease, with 66 (33.3%) having only cardiac involvement and 132 (66.7%) having both cardiac and renal involvement at the index date. Overall, 138 (69.7%) received daratumumab as part of their treatment. Among patients with only cardiac involvement, 48 (72.7%) received daratumumab. Among patients with both cardiac and renal involvement, 90 (68.2%) received daratumumab. Approximately two-thirds of patients had commercial insurance.
| All patients | Cardiac involvement only | Cardiac + renal involvement | |||||||
|---|---|---|---|---|---|---|---|---|---|
| All | Treated with daratumumab | Not treated with daratumumab | All | Treated with daratumumab | Not treated with daratumumab | All | Treated with daratumumab | Not treated with daratumumab | |
| N | 198 | 138 | 60 | 66 | 48 | 18 | 132 | 90 | 42 |
| Age, mean (SD), years | |||||||||
| All patients | 64.83 (10.27) | 64.49 (9.84) | 65.62 (11.23) | 63.85 (10.06) | 61.85 (9.27) | 69.17 (10.38) | 65.32 (10.37) | 65.89 (9.90) | 64.10 (11.35) |
| 18–25 years | 0 (0.0%) | 0 (0.0%) | 0 (0.0%) | 0 (0.0%) | 0 (0.0%) | 0 (0.0%) | 0 (0.0%) | 0 (0.0%) | 0 (0.0%) |
| 26–44 years | 6 (3.0%) | 5 (3.6%) | 1 (1.7%) | 2 (3.0%) | 2 (4.2%) | 0 (0.0%) | 4 (3.0%) | 3 (3.3%) | 1 (2.4%) |
| 45–64 years | 99 (50.0%) | 69 (50.0%) | 30 (50.0%) | 38 (57.6%) | 30 (62.5%) | 8 (44.4%) | 61 (46.2%) | 39 (43.3%) | 22 (52.4%) |
| ≥65 years | 93 (47.0%) | 64 (46.4%) | 29 (48.3%) | 26 (39.4%) | 16 (33.3%) | 10 (55.6%) | 67 (50.8%) | 48 (53.3%) | 19 (45.2%) |
| Male | 140 (70.7%) | 100 (72.5%) | 40 (66.7%) | 47 (71.2%) | 35 (72.9%) | 12 (66.7%) | 93 (70.5%) | 65 (72.2%) | 28 (66.7%) |
| Insurance | |||||||||
| Commercial | 133 (67.2%) | 96 (69.6%) | 37 (61.7%) | 52 (78.8%) | 40 (83.3%) | 12 (66.7%) | 81 (61.4%) | 56 (62.2%) | 25 (59.5%) |
| Medicare Advantage | 62 (31.3%) | 40 (29.0%) | 22 (36.7%) | 14 (21.2%) | 8 (16.7%) | 6 (33.3%) | 48 (36.4%) | 32 (35.6%) | 16 (38.1%) |
| Medicaid managed care | 0 (0.0%) | 0 (0.0%) | 0 (0.0%) | 0 (0.0%) | 0 (0.0%) | 0 (0.0%) | 0 (0.0%) | 0 (0.0%) | 0 (0.0%) |
| Dual | 0 (0.0%) | 0 (0.0%) | 0 (0.0%) | 0 (0.0%) | 0 (0.0%) | 0 (0.0%) | 0 (0.0%) | 0 (0.0%) | 0 (0.0%) |
| Other | 3 (1.5%) | 2 (1.4%) | 1 (1.7%) | 0 (0.0%) | 0 (0.0%) | 0 (0.0%) | 3 (2.3%) | 2 (2.2%) | 1 (2.4%) |
| Region | |||||||||
| Northeast | 37 (18.7%) | 20 (14.5%) | 17 (28.3%) | 17 (25.8%) | 7 (14.6%) | 10 (55.6%) | 20 (15.2%) | 13 (14.4%) | 7 (16.7%) |
| Midwest | 52 (26.3%) | 37 (26.8%) | 15 (25.0%) | 17 (25.8%) | 13 (27.1%) | 4 (22.2%) | 35 (26.5%) | 24 (26.7%) | 11 (26.2%) |
| South | 76 (38.4%) | 59 (42.8%) | 17 (28.3%) | 23 (34.8%) | 20 (41.7%) | 3 (16.7%) | 53 (40.2%) | 39 (43.3%) | 14 (33.3%) |
| West | 30 (15.2%) | 21 (15.2%) | 9 (15.0%) | 9 (13.6%) | 8 (16.7%) | 1 (5.6%) | 21 (15.9%) | 13 (14.4%) | 8 (19.0%) |
SD: Standard deviation.
Overall, patients received 33 different drug combinations, including monotherapy, as their index regimen (within 30 days of the index date) or second regimen (30 days after the index regimen; Table 2). Patients received 23 different drug combinations as their index regimen, the most common of which were CyBorD-daratumumab (n = 58; 29.3%), CyBor-daratumumab (n = 34; 17.2%), daratumumab monotherapy (n = 19; 9.6%) and CyBorD (n = 11; 5.6%). Patients with only cardiac involvement received 17 different drug combinations as their index regimen, the most common of which were CyBorD-daratumumab (n = 22; 33.3%), CyBor-daratumumab (n = 10; 15.2%) and daratumumab monotherapy (n = 7; 10.6%). Patients with both cardiac and renal involvement received 19 different drug combinations as their index regimen, the most common of which were CyBorD-daratumumab (n = 36; 27.3%), CyBor-daratumumab (n = 24; 18.2%), daratumumab monotherapy (n = 12; 9.1%) and CyBorD (n = 10; 7.6%).
| Treatment | All patients (n = 198) | Cardiac involvement only (n = 66) | Cardiac + renal involvement (n = 132) | |||
|---|---|---|---|---|---|---|
| Index regimen | Second regimen | Index regimen | Second regimen | Index regimen | Second regimen | |
| Bendamustine monotherapy | 1 | – | – | – | 1 | – |
| Bendamustine, bortezomib, cyclophosphamide, dexamethasone | 1 | 0 | 1 | – | – | – |
| Bendamustine, dexamethasone | 6 | 1 | 2 | 1 | 4 | – |
| Bortezomib monotherapy | – | 4 | – | – | – | 4 |
| Bortezomib, cyclophosphamide | 9 | 4 | 1 | 1 | 8 | 3 |
| Bortezomib, cyclophosphamide, dexamethasone, lenalidomide | 1 | 1 | – | – | 1 | 1 |
| Bortezomib, dexamethasone | – | 6 | – | 1 | – | 5 |
| Bortezomib, dexamethasone, daratumumab | – | 11 | – | 6 | – | 5 |
| Bortezomib, lenalidomide | 5 | 2 | 1 | – | 4 | 2 |
| Bortezomib, lenalidomide, dexamethasone | 14 | 4 | 6 | 1 | 8 | 3 |
| Carfilzomib monotherapy | 4 | 0 | 1 | – | 3 | – |
| Carfilzomib, cyclophosphamide | – | 1 | – | 1 | – | – |
| Carfilzomib, dexamethasone | 2 | 2 | 2 | – | – | 2 |
| Carfilzomib, dexamethasone, lenalidomide | 1 | 0 | – | – | 1 | 0 |
| Carfilzomib, dexamethasone, pomalidomide | – | 1 | – | – | – | 1 |
| Cyclophosphamide monotherapy | 9 | 3 | 3 | 2 | 6 | 1 |
| Cyclophosphamide, bortezomib, daratumumab | 34 | 12 | 10 | 6 | 24 | 6 |
| Cyclophosphamide, bortezomib, dexamethasone | 11 | 6 | 1 | – | 10 | 6 |
| Cyclophosphamide, bortezomib, dexamethasone, daratumumab | 58 | 7 | 22 | 3 | 36 | 4 |
| Cyclophosphamide, dexamethasone | 12 | 1 | 4 | – | 8 | 1 |
| Daratumumab monotherapy | 19 | 44 | 7 | 14 | 12 | 30 |
| Dexamethasone monotherapy | – | 17 | – | 6 | – | 11 |
| Dexamethasone, daratumumab | – | 7 | – | 3 | – | 4 |
| Ixazomib, lenalidomide | 1 | – | 1 | 0 | – | – |
| Ixazomib, lenalidomide, dexamethasone | – | 1 | – | 1 | – | – |
| Lenalidomide monotherapy | 3 | 7 | 2 | 2 | 1 | 5 |
| Lenalidomide, dexamethasone | 2 | 5 | 1 | 3 | 1 | 2 |
| Melphalan monotherapy | 1 | 1 | 1 | – | – | 1 |
| Melphalan, dexamethasone | – | 1 | – | – | – | 1 |
| Pomalidomide monotherapy | – | 1 | – | – | – | 1 |
| Pomalidomide, dexamethasone | 2 | – | – | – | 2 | – |
| Venetoclax monotherapy | 1 | 1 | – | – | 1 | 1 |
| Venetoclax, dexamethasone | 1 | – | – | – | 1 | – |
| N/A | – | 47 | – | 15 | – | 32 |
N/A: Not allocated.
Index and second treatment regimens varied considerably in this cohort of patients (Figure 2A). Treatment patterns also varied considerably among patients with only cardiac involvement (Figure 2B) or with both cardiac and renal involvement (Figure 2C).
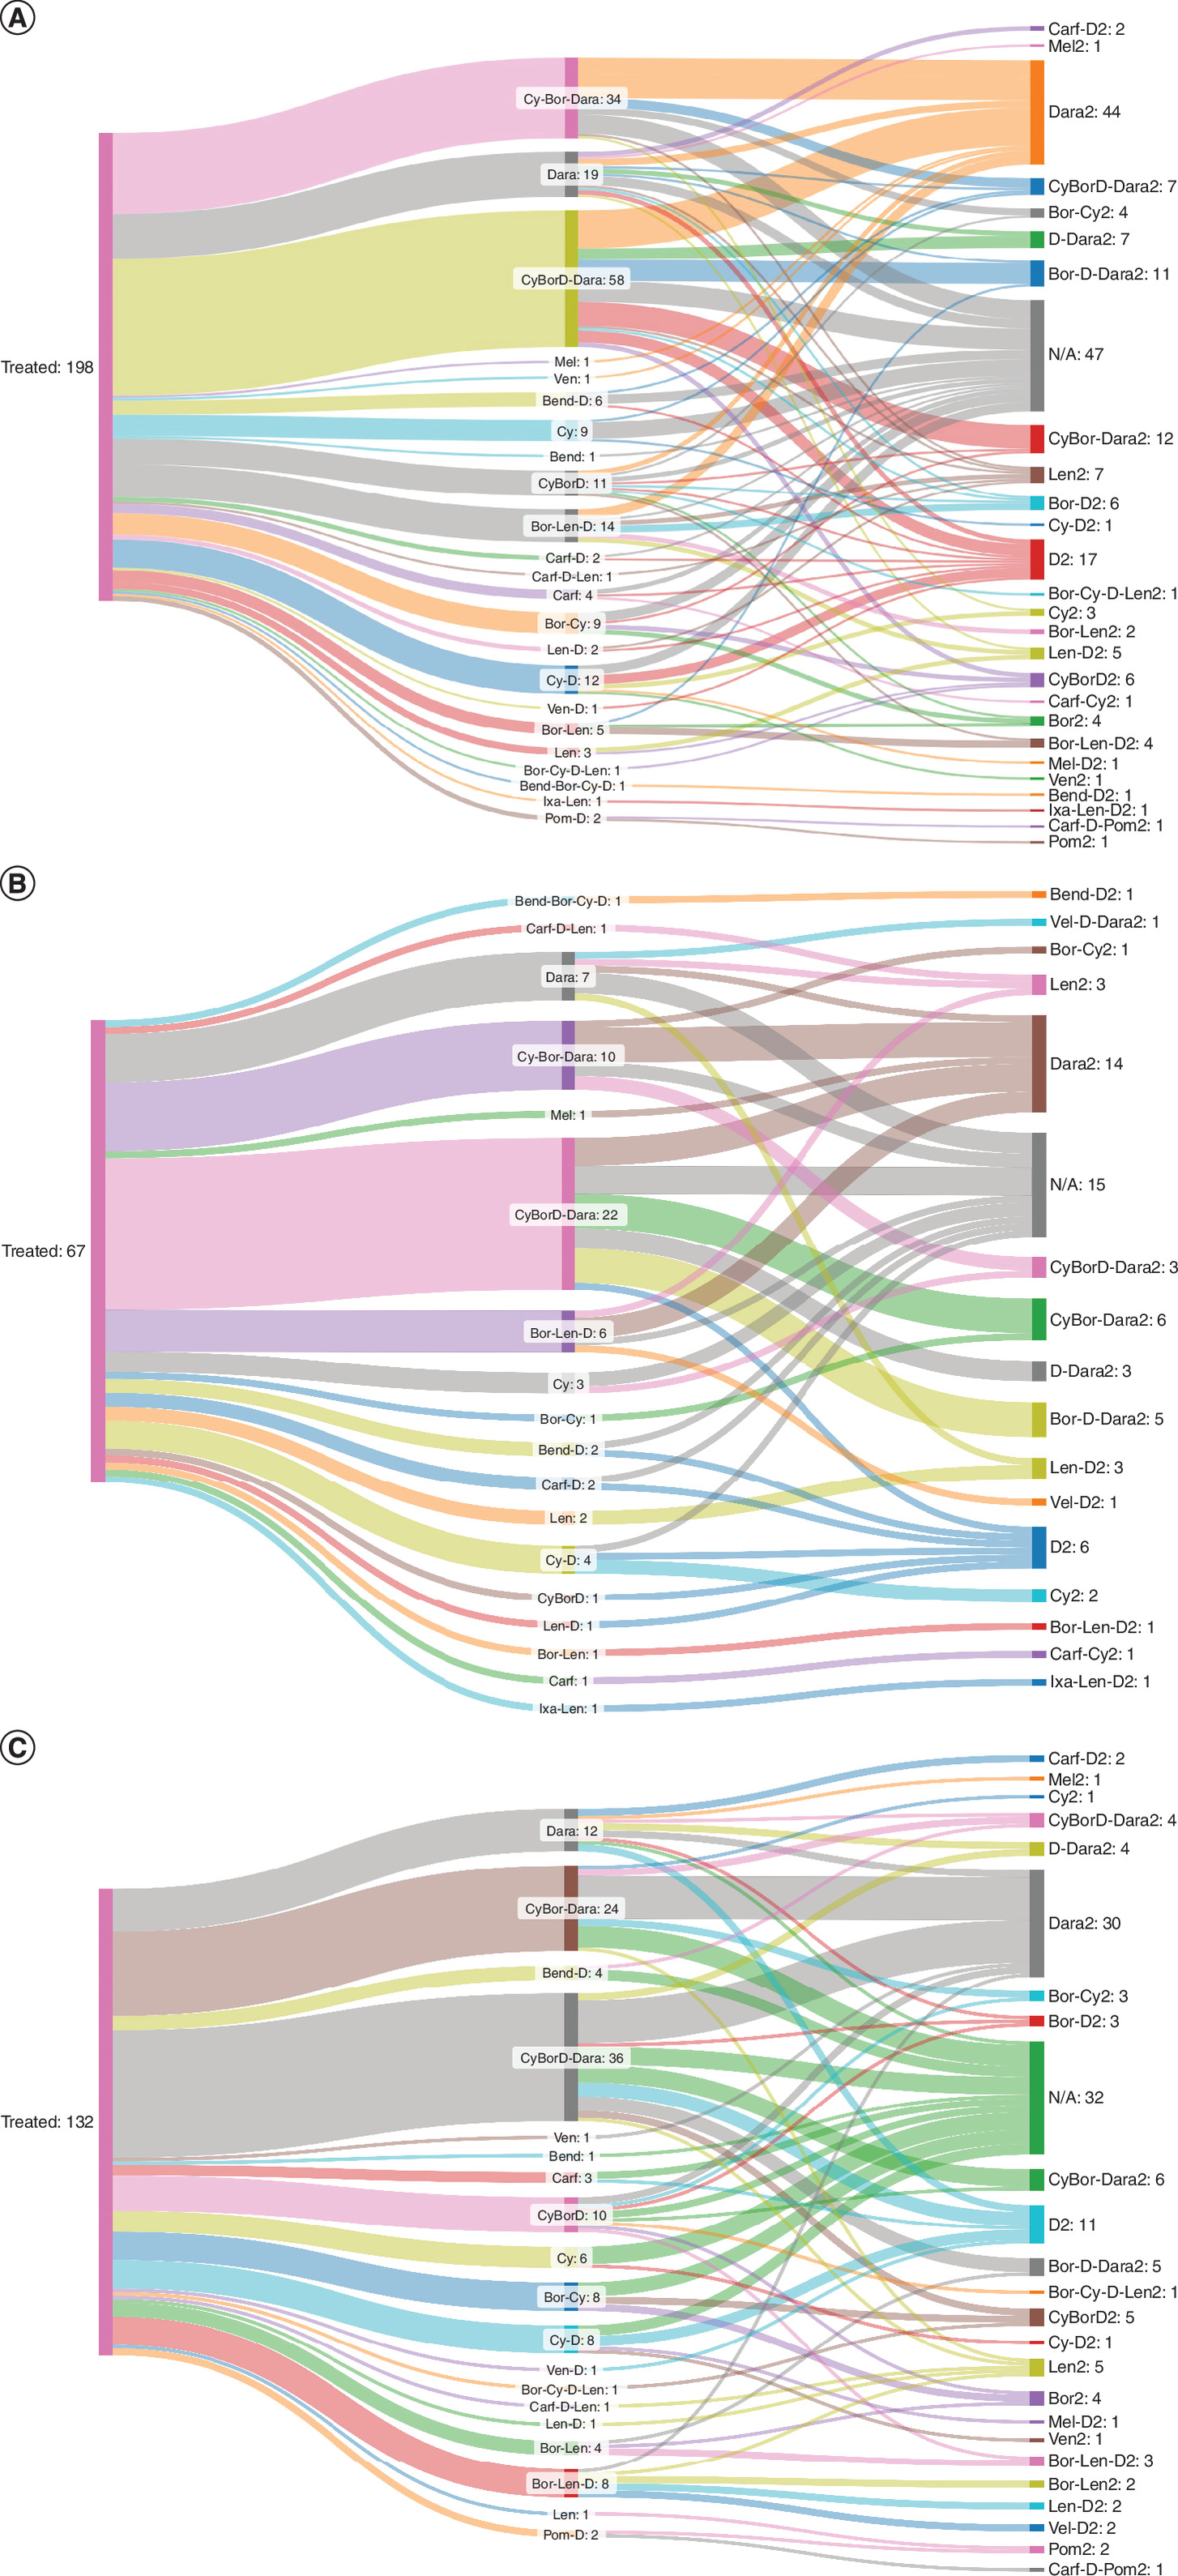
Figure 2. Treatment patterns at initiation and change during the first year.
(A) The overall population, (B) the subpopulation with only cardiac involvement and (C) the subpopulation with both cardiac and renal involvement.
Bend: Bendamustine; Bor: Bortezomib; Carf: Carfilzomib; Cy: Cyclophosphamide; D: Dexamethasone; Dara: Daratumumab; Ixa: Ixazomib; Len: Lenalidomide; Mel: Melphalan; Pom: Pomalidomide; Ven: Venetoclax.
Overall, 138 (69.7%) patients received daratumumab as part of their first- or second-line treatment. In this cohort, 111 (80.4%) patients received daratumumab as part of their first-line treatment, either as monotherapy (n = 19; 13.8%) or in combination with cyclophosphamide and bortezomib (n = 34; 24.6%) or cyclophosphamide, bortezomib, and dexamethasone (CyBorD; n = 58; 42.0%). Among patients who received daratumumab as part of their first-line therapy (n = 111), 68 (61.3%) continued to receive daratumumab as part of their second-line treatment. Among patients who did not receive daratumumab as part of their first-line therapy (n = 87), only 12 (13.8%) were switched to receive daratumumab as part of their second-line treatment. There did not appear to be any clear distinction in treatment patterns between patients who received daratumumab as part of their initial treatment regimen and those who did not in the overall cohort or the two subpopulations (Figure 2A–C).
Mortality
The database recorded 18 (9.1%) deaths in the total cohort (Table 3). The proportion of deaths within 1 year of the index date was lower among patients who received daratumumab (7.2%) than among those who did not (13.3%). The corresponding death incidence rates per 1000 patients were 72.46 for patients who received daratumumab and 133.33 for patients who did not. Similarly, in the subpopulation with only cardiac involvement, the proportion of deaths and incidence rates per 1000 patients were lower among patients who received daratumumab (4.2% and 41.67, respectively) than among patients who did not (16.7% and 166.67, respectively). In the subpopulation with both cardiac and renal involvement, although the proportion of deaths and incidence rates per 1000 patients were numerically lower among patients who received daratumumab (8.9% and 88.89, respectively) than among patients who did not (11.9% and 119.05, respectively), the differences were small.
| All patients | Treated with daratumumab | Not treated with daratumumab | |
|---|---|---|---|
| All patients | |||
| N | 198 | 138 | 60 |
| Deaths within 365 days | 18 | 10 | 8 |
| Incidence rate (per 1000) | 90.91 | 72.46 | 133.33 |
| Proportion of deaths | 9.1% | 7.2% | 13.3% |
| Mean time to death (days) | 96.67 (94.14) | 62.80 (38.50) | 139.00 (126.21) |
| Median time to death (days) | 54.00 (37.00–112.00) | 44.50 (35.25–92.75) | 91.00 (53.00–191.75) |
| Patients with cardiac involvement | |||
| N | 66 | 48 | 18 |
| Deaths within 365 days | 5 | 2 | 3 |
| Incidence rate (per 1000) | 75.76 | 41.67 | 166.67 |
| Proportion of deaths | 7.6% | 4.2% | 16.7% |
| Mean time to death (days) | 114.00 (135.52) | 83.00 (67.88) | 134.67 (181.17) |
| Median time to death (days) | 47.00 (35.00–131.00) | 83.00 (59.00–107.00) | 47.00 (30.50–195.00) |
| Patients with cardiac and renal involvement | |||
| N | 132 | 90 | 42 |
| Deaths within 365 days | 13 | 8 | 5 |
| Incidence rate (per 1000) | 98.48 | 88.89 | 119.05 |
| Proportion of deaths | 9.8% | 8.9% | 11.9% |
| Mean time to death (days) | 90.00 (79.12) | 57.75 (33.20) | 141.60 (106.97) |
| Median time to death (days) | 55.00 (40.00–106.00) | 44.50 (35.50–66.25) | 101.00 (81.00–148.00) |
The mean (standard deviation [SD]) time to death was 96.7 (94.1) days in the total cohort of patients (Table 3 & Figure 3A). The mean (SD) time to death was longer among patients with only cardiac involvement (114.0 [135.5] days; Table 3 & Figure 3B) than among patients with both cardiac and renal involvement (90 [79.1] days; Table 3 & Figure 3C).
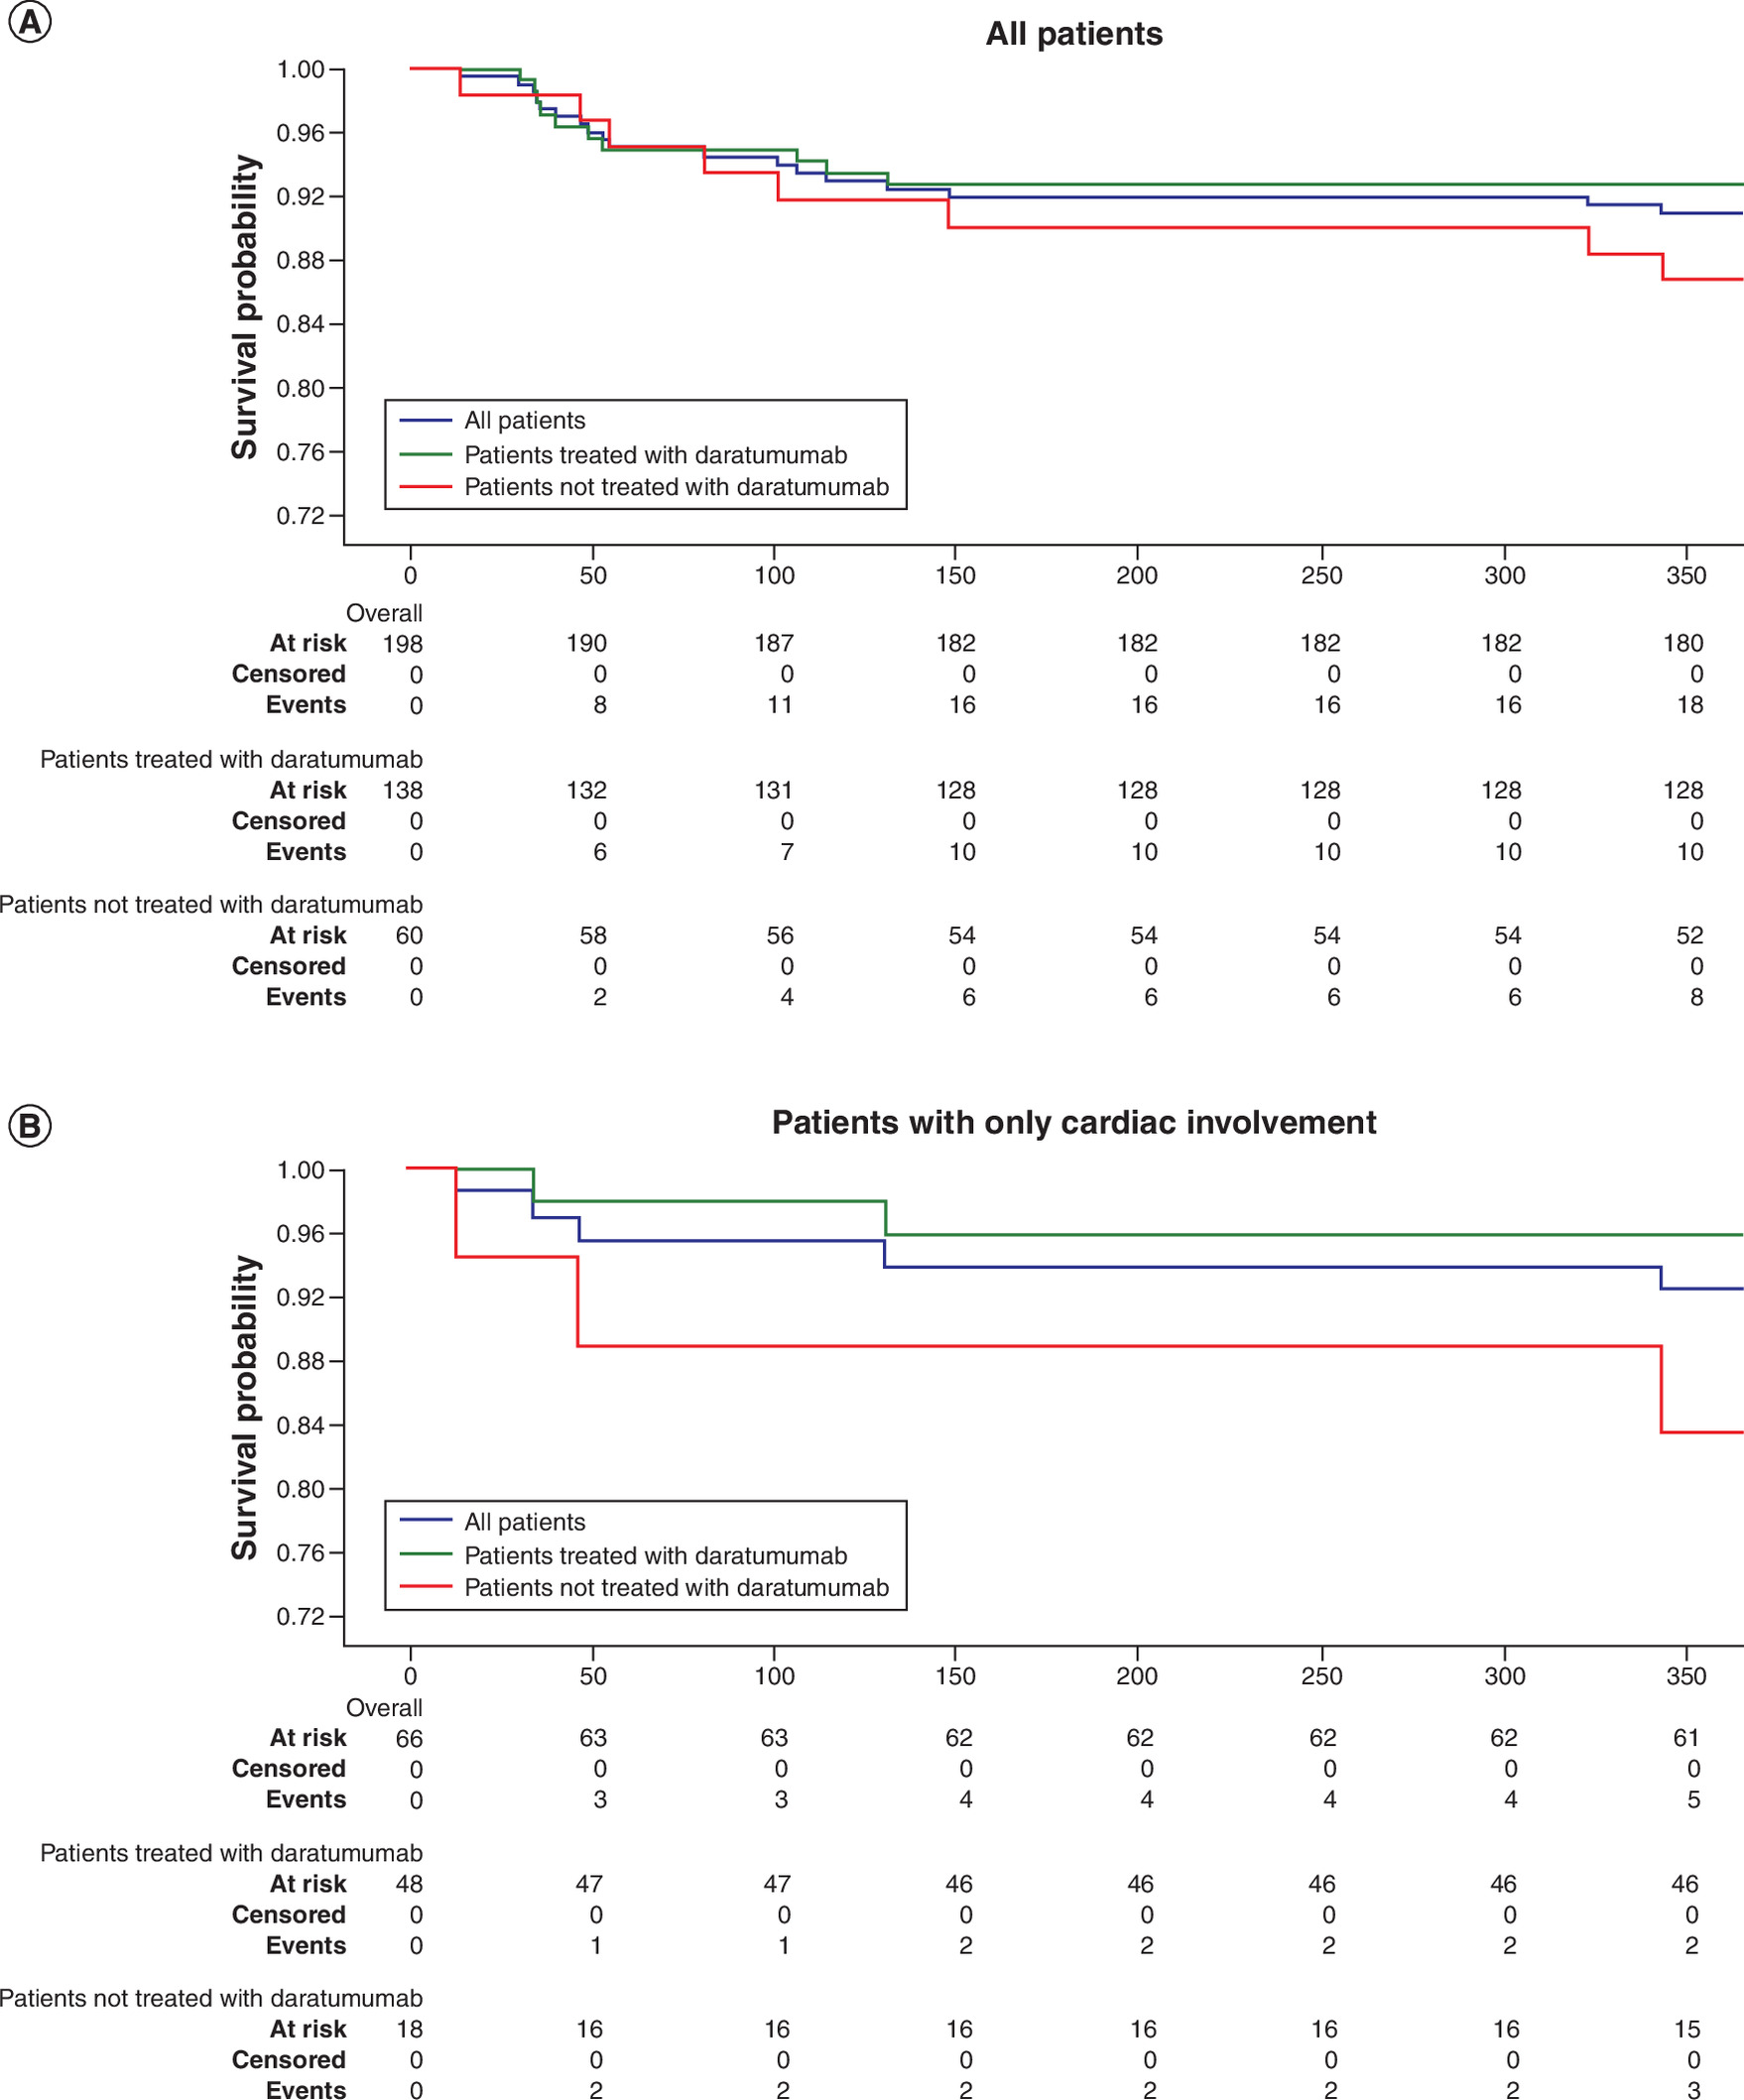
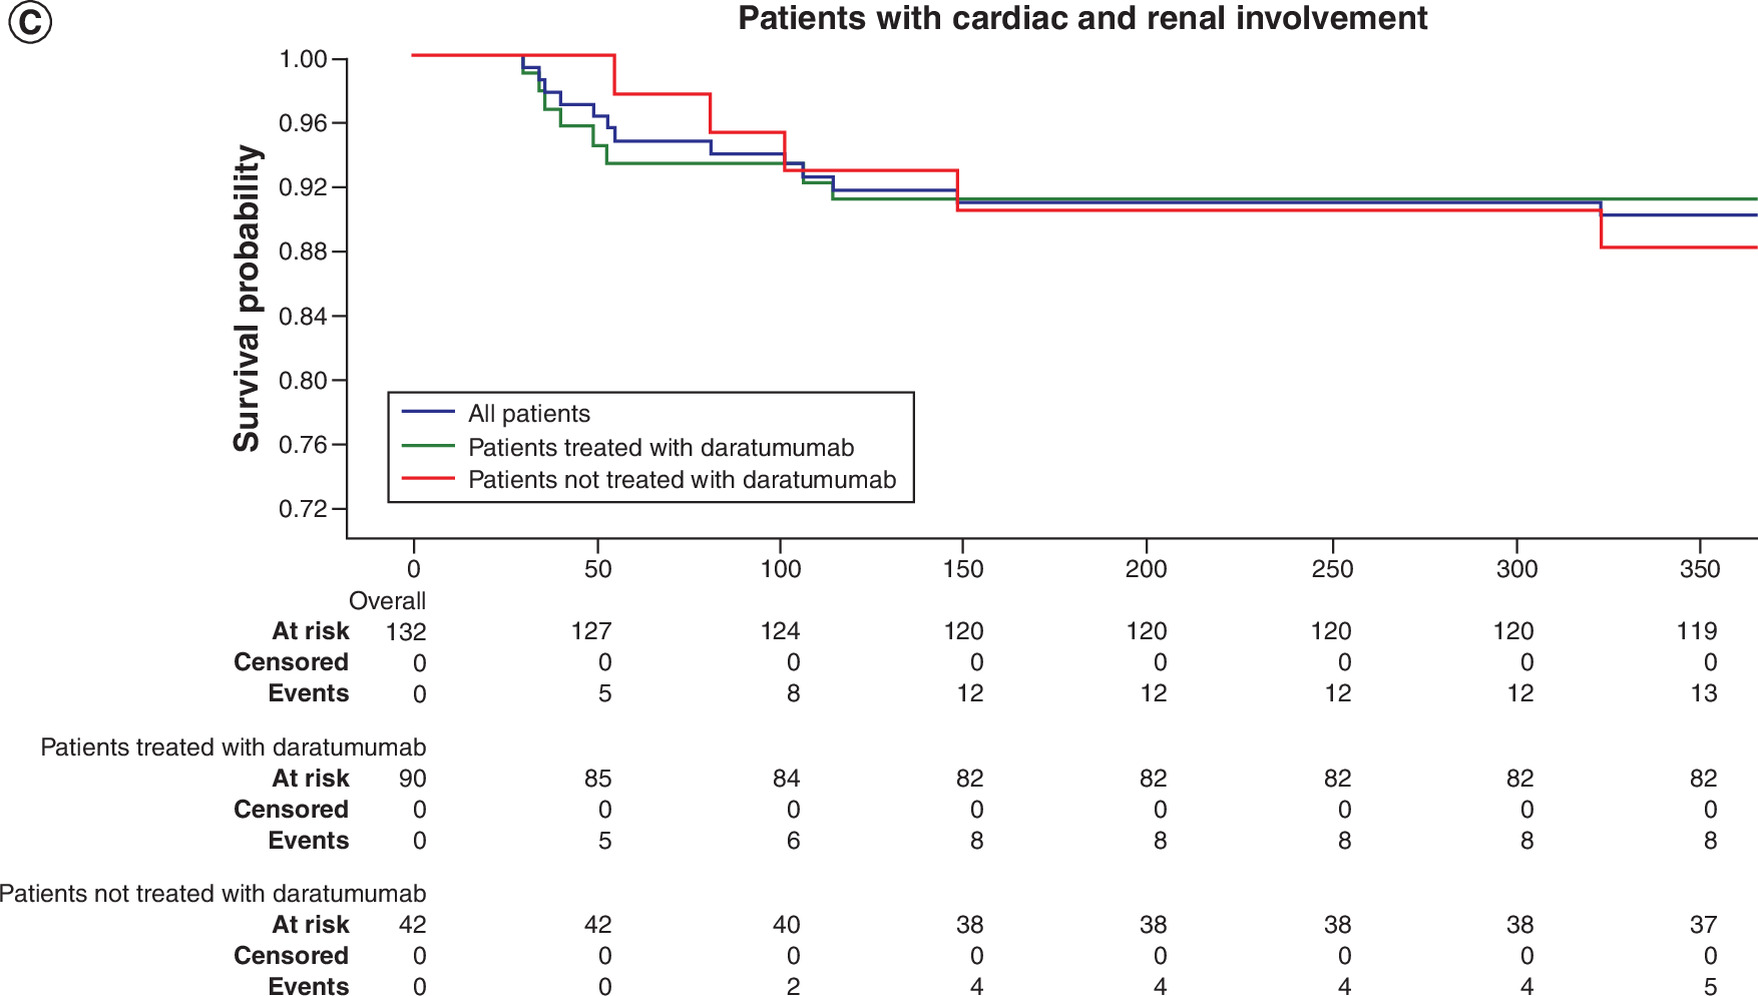
Figure 3. Kaplan–Meier curves showing time to death.
(A) All patients, (B) patients with only cardiac involvement, and (C) patients with cardiac and renal involvement.
Within 365 days after the index date, a recorded death was observed for 10 of 138 patients classified as having an observed daratumumab claim in the available preindex or postindex claims window and 8 of 60 patients without such a claim. Among patients with a recorded death within 365 days, mean time to death was 62.8 days in the stratum with an observed daratumumab claim in the available preindex or postindex claims window and 139.0 days in the stratum without such a claim. No formal between-group statistical comparison was conducted, and the mixed-window classification precludes treatment-effect interpretation. This difference was also observed among patients with both cardiac and renal involvement (141.6 days for patients not receiving daratumumab vs 57.75 days for patients receiving daratumumab). There was no significant difference in the mean time to death with respect to daratumumab treatment among patients with only cardiac involvement (134.7 days for patients not receiving daratumumab vs 83.0 days for patients receiving daratumumab).
Hospitalizations
Overall, 144 (72.7%) patients in this cohort experienced at least one condition-related, i.e., for any cause, inpatient hospitalization during the 365-day post-treatment initiation period (postindex). Among these, 102 (70.8%), 110 (76.4%) and 77 (53.5%) patients experienced at least one AL-, cardiomyopathy- and renal-related inpatient hospitalizations, respectively (Table 4). Among patients with only cardiac involvement (n = 66), 39 (59.1%) experienced at least one condition-related inpatient hospitalization during the 365-day post-treatment initiation period with 26 (39.4%) and 27 (40.9%) patients experiencing at least one AL- and cardiomyopathy-related inpatient hospitalizations, respectively. Among patients with both cardiac and renal involvement (n = 132), 105 (79.5%) experienced at least one condition-related inpatient hospitalization during the 365-day post-treatment initiation period. In this subgroup, 76 (57.6%), 83 (62.9%) and 77 (58.3%) experienced at least one AL-, cardiomyopathy- and renal-related inpatient hospitalizations, respectively.
| ≥1 Inpatient hospitalizations | |||||
|---|---|---|---|---|---|
| All-cause | AL-related | Cardiomyopathy-related | Renal-related | Condition-related | |
| All patients | |||||
| Any event (N) | 144 | 102 | 110 | 77 | 130 |
| Patients with event, % | 72.7% | 51.5% | 55.6% | 38.9% | 65.7% |
| 12-month follow-up events, n | |||||
| Mean (SD) | 2.58 (1.70) | 2.07 (1.35) | 1.99 (1.47) | 2.18 (1.60) | 2.45 (1.67) |
| Median (range) | 2.00 (1.00–3.00) | 2.00 (1.00–3.00) | 1.00 (1.00–2.00) | 2.00 (1.00–2.00) | 2.00 (1.00–3.00) |
| PPPM, n | |||||
| Mean (SD) | 1.38 (3.83) | 1.59 (4.46) | 1.55 (4.33) | 0.90 (1.59) | 1.42 (4.01) |
| Median (range) | 0.43 (0.23–0.83) | 0.47 (0.22–0.85) | 0.45 (0.20–0.95) | 0.42 (0.20–0.79) | 0.41 (0.23–0.86) |
| LoS, mean (SD), days | 5.89 (8.61) | 5.88 (7.39) | 5.26 (6.68) | 3.80 (6.97) | 5.77 (7.91) |
| LoS, median (range), days | 3.00 (0.00–7.00) | 4.00 (0.00–8.00) | 3.00 (0.00–7.00) | 1.00 (0.00–5.00) | 3.00 (0.00–7.00) |
| Patients with only cardiac involvement | |||||
| Any event (N) | 39 | 26 | 27 | 30 | |
| Patients with event, % | 59.1% | 39.4% | 40.9% | 45.5% | |
| 12-month follow-up events, n | |||||
| Mean (SD) | 2.44 (1.62) | 2.35 (1.67) | 2.00 (1.54) | 2.23 (1.61) | |
| Median (range) | 2.00 (1.00–3.00) | 2.00 (1.00–2.75) | 1.00 (1.00–2.00) | 2.00 (1.00–2.75) | |
| PPPM, n | |||||
| Mean (SD) | 0.90 (1.44) | 1.02 (1.62) | 0.96 (1.62) | 0.91 (1.53) | |
| Median (range) | 0.37 (0.21–0.67) | 0.48 (0.20–1.12) | 0.34 (0.15–1.15) | 0.36 (0.19–1.03) | |
| LoS, mean (SD), days | 5.00 (7.97) | 4.29 (4.75) | 3.95 (3.87) | 4.26 (4.54) | |
| LoS, median (range), days | 3.00 (0.75–6.00) | 3.00 (0.25–7.00) | 3.00 (2.00–6.00) | 3.00 (1.00–6.25) | |
| Patients with cardiac and renal involvement | |||||
| Any event (N) | 105 | 76 | 83 | 77 | 100 |
| Patients with event, % | 79.5% | 57.6% | 62.9% | 58.3% | 75.8% |
| 12-month follow-up events, n | |||||
| Mean (SD) | 2.63 (1.73) | 1.97 (1.22) | 1.99 (1.46) | 2.18 (1.60) | 2.52 (1.68) |
| Median (range) | 2.00 (1.00–3.00) | 2.00 (1.00–3.00) | 1.00 (1.00–2.00) | 2.00 (1.00–2.00) | 2.00 (1.00–3.00) |
| PPPM, n | |||||
| Mean (SD) | 1.56 (4.39) | 1.79 (5.08) | 1.74 (4.89) | 0.90 (1.59) | 1.58 (4.49) |
| Median (range) | 0.46 (0.26–0.83) | 0.47 (0.25–0.75) | 0.49 (0.22–0.89) | 0.42 (0.20–0.79) | 0.43 (0.26–0.84) |
| LoS, mean (SD), days | 6.20 (8.81) | 6.54 (8.16) | 5.69 (7.34) | 3.80 (6.97) | 6.17 (8.56) |
| LoS, median (range), days | 4.00 (0.00–8.00) | 4.00 (0.00–9.50) | 4.00 (0.00–8.00) | 1.00 (0.00–5.00) | 4.00 (0.00–8.25) |
| Patients treated with daratumumab | |||||
| All patients | |||||
| Any event (N) | 100 | 80 | 77 | 55 | 93 |
| Patients with event, % | 50.5 | 40.4 | 38.9 | 27.8 | 47.0 |
| 12-month follow-up events, n | |||||
| Mean (SD) | 2.53 (1.64) | 2.16 (1.44) | 1.95 (1.33) | 2.05 (1.53) | 2.41 (1.62) |
| Median (range) | 2.00 (1.00–3.00) | 2.00 (1.00–3.00) | 2.00 (1.00–2.00) | 2.00 (1.00–2.00) | 2.00 (1.00–3.00) |
| PPPM, n | |||||
| Mean (SD) | 1.59 (4.48) | 1.82 (4.99) | 1.70 (4.99) | 0.97 (1.74) | 1.64 (4.64) |
| Median (range) | 0.45 (0.26–0.89) | 0.50 (0.25–0.90) | 0.40 (0.21–0.91) | 0.43 (0.21–0.80) | 0.49 (0.26–0.91) |
| LoS, mean (SD), days | 5.54 (9.13) | 5.41 (7.48) | 4.82 (6.94) | 4.07 (7.90) | 5.59 (8.66) |
| LoS, median (range), days | 3.00 (0.00–7.00) | 3.00 (0.00–7.00) | 3.00 (0.00–7.00) | 1.00 (0.00–5.00) | 3.00 (0.00–7.00) |
| Patients with only cardiac involvement | |||||
| Any event (N) | 28 | 23 | 21 | 24 | |
| Patients with event, % | 42.4 | 34.8 | 31.8 | 36.4 | |
| 12-month follow-up events, n | |||||
| Mean (SD) | 2.54 (1.71) | 2.48 (1.73) | 2.19 (1.66) | 2.42 (1.72) | |
| Median (range) | 2.00 (1.00–3.00) | 2.00 (1.00–3.00) | 2.00 (1.00–2.00) | 2.00 (1.00–3.00) | |
| PPPM, n | |||||
| Mean (SD) | 1.05 (1.60) | 1.13 (1.69) | 1.11 (1.79) | 1.10 (1.67) | |
| Median (range) | 0.43 (0.24–1.15) | 0.51 (0.27–1.17) | 0.45 (0.18–1.17) | 0.51 (0.22–1.18) | |
| LoS, mean (SD), days | 4.56 (6.91) | 4.24 (4.80) | 4.13 (3.88) | 4.46 (4.66) | |
| LoS, median (range), days | 3.00 (1.00–6.00) | 3.00 (0.25–7.00) | 3.00 (2.00–6.50) | 3.00 (2.00–7.00) | |
| Patients with cardiac and renal involvement | |||||
| Any event (N) | 72 | 57 | 56 | 55 | 69 |
| Patients with event, % | 54.5 | 43.2 | 42.4 | 41.7 | 52.3 |
| 12-month follow-up events, n | |||||
| Mean (SD) | 2.53 (1.63) | 2.04 (1.30) | 1.86 (1.18) | 2.05 (1.53) | 2.41 (1.60) |
| Median (range) | 2.00 (1.00–3.00) | 2.00 (1.00–3.00) | 1.50 (1.00–2.00) | 2.00 (1.00–2.00) | 2.00 (1.00–3.00) |
| PPPM, n | |||||
| Mean (SD) | 1.80 (5.19) | 2.10 (5.80) | 1.93 (5.74) | 0.97 (1.74) | 1.83 (5.29) |
| Median (range) | 0.45 (0.27–0.83) | 0.45 (0.26–0.74) | 0.39 (0.22–0.76) | 0.43 (0.21–0.80) | 0.44 (0.27–0.87) |
| LoS, mean (SD), days | 5.93 (9.86) | 5.99 (8.46) | 5.13 (7.94) | 4.07 (7.90) | 5.99 (9.67) |
| LoS, median (range), days | 3.00 (0.00–7.00) | 4.00 (0.00–8.00) | 3.00 (0.00–7.00) | 1.00 (0.00–5.00) | 3.00 (0.00–7.00) |
| Patients not treated with daratumumab | |||||
| All patients | |||||
| Any event (N) | 44 | 22 | 33 | 22 | 37 |
| Patients with event, % | 22.2 | 11.1 | 16.7 | 11.1 | 18.7 |
| 12-month follow-up events, n | |||||
| Mean (SD) | 2.68 (1.83) | 1.73 (0.94) | 2.09 (1.79) | 2.50 (1.77) | 2.57 (1.79) |
| Median (range) | 2.00 (1.00–3.25) | 1.00 (1.00–2.00) | 1.00 (1.00–3.00) | 2.00 (1.00–3.75) | 2.00 (1.00–3.00) |
| PPPM, n | |||||
| Mean (SD) | 0.89 (1.48) | 0.74 (1.07) | 1.19 (2.14) | 0.75 (1.15) | 0.88 (1.53) |
| Median (range) | 0.36 (0.21–0.76) | 0.38 (0.17–0.63) | 0.52 (0.18–0.97) | 0.35 (0.19–0.75) | 0.35 (0.19–0.73) |
| LoS, mean (SD), days | 6.64 (7.34) | 8.05 (6.64) | 6.22 (6.02) | 3.24 (4.53) | 6.20 (8.78) |
| LoS, median (range), days | 4.00 (1.00–9.75) | 6.00 (3.00–13.25) | 5.00 (1.00–10.00) | 1.00 (0.00–6.00) | 5.00 (2.00–9.00) |
| Patients with only cardiac involvement | |||||
| Any event (N) | 11 | 3 | 6 | 6 | |
| Patients with event, % | 16.7 | 4.5 | 9.4 | 9.1 | |
| 12-month follow-up events, n | |||||
| Mean (SD) | 2.18 (1.40) | 1.33 (0.58) | 1.33 (0.82) | 1.50 (0.84) | |
| Median (range) | 2.00 (1.00–3.00) | 1.00 (1.00–1.50) | 1.00 (1.00–1.00) | 1.00 (1.00–1.75) | |
| PPPM, n | |||||
| Mean (SD) | 0.51 (0.85) | 0.13 (0.08) | 0.45 (0.72) | 0.17 (0.08) | |
| Median (range) | 0.23 (0.21–0.34) | 0.09 (0.09–0.16) | 0.16 (0.10–0.26) | 0.16 (0.10–0.22) | |
| LoS, mean (SD), days | 6.33 (10.61) | 5.00 (4.55) | 2.88 (3.87) | 3.00 (3.64) | |
| LoS, median (range), days | 3.50 (0.00–7.25) | 4.50 (3.00–6.50) | 1.50 (0.00–4.25) | 3.00 (0.00–4.00) | |
| Patients with cardiac and renal involvement | |||||
| Any event (N) | 33 | 19 | 27 | 22 | 31 |
| Patients with event, % | 25.0 | 14.4 | 20.5 | 16.7 | 23.5 |
| 12-month follow-up events, n | |||||
| Mean (SD) | 2.85 (1.94) | 1.79 (0.98) | 2.26 (1.91) | 2.50 (1.77) | 2.77 (1.86) |
| Median (range) | 2.00 (1.00–4.00) | 1.00 (1.00–2.50) | 1.00 (1.00–3.00) | 2.00 (1.00–3.75) | 2.00 (1.00–4.00) |
| PPPM, n | |||||
| Mean (SD) | 1.02 (1.63) | 0.83 (1.12) | 1.35 (2.32) | 0.75 (1.15) | 1.01 (1.64) |
| Median (range) | 0.51 (0.22–0.83) | 0.52 (0.25–0.76) | 0.60 (0.23–1.03) | 0.35 (0.19–0.75) | 0.42 (0.21–0.81) |
| LoS, mean (SD), days | 6.72 (6.31) | 8.41 (6.81) | 6.66 (6.13) | 3.24 (4.53) | 6.53 (5.88) |
| LoS, median (range), days | 5.50 (2.00–9.75) | 6.00 (3.00–14.75) | 6.00 (1.00–10.00) | 1.00 (0.00–6.00) | 5.50 (2.00–9.00) |
AL: Light chain; LoS: Length of stay; PPPM: Per patient per month; SD: Standard deviation.
The proportions of patients hospitalized for any cause were similar between those who received daratumumab (72.5%) and those who did not (73.3%). Cardiomyopathy-, renal- and condition-related hospitalizations were similar between patients who received daratumumab and those who did not (Table 4). However, AL-related hospitalizations were numerically lower among patients not receiving daratumumab (36.7%) compared with those who received daratumumab (58.0%). Lower AL-related hospitalization rates were also observed among patients not receiving daratumumab versus those who did in the subpopulation with only cardiac involvement (4.5% vs 34.8%) and the subpopulation with both cardiac and renal involvement (14.4% vs 43.2%).
The mean (SD) all-cause length of stay (LoS) for all patients was 5.9 (8.6) days, with AL-, cardiomyopathy-, renal- and all condition-related LoS being 5.9 (7.4) days, 5.3 (6.7) days, 3.8 (7.0) days, and 5.8 (7.9) days, respectively (Table 4). In the subpopulation with only cardiac involvement, the mean (SD) for all-cause, AL-, and cardiomyopathy-related LoS was 5.0 (8.0) days, 4.3 (4.8) days and 4.0 (3.9) days, respectively. In the subpopulation with both cardiac and renal involvement, the mean (SD) for all-cause, AL-, cardiomyopathy- and renal-related LoS was 6.2 (8.8) days, 6.5 (8.2) days, 5.7 (7.3) days and 3.8 (7.0) days, respectively. The LoS was consistently lower among patients who received daratumumab compared with those who did not (Table 4).
Discussion
The systemic nature of AL amyloidosis and the spectrum of nonspecific symptoms make it a difficult disease to diagnose [1–3]. The heart and kidneys are the most common organs affected in patients with AL amyloidosis [1,3]. More than 70% of patients with AL amyloidosis present with cardiac disease, more than 60% with renal disease, and more than 30% with both cardiac and renal disease [1,3,11]. Prognosis depends on the stage, mainly driven by cardiac biomarkers, at which patients are diagnosed with patients in early stages of disease faring better than those with more advanced disease [12]. The current guidelines recommend CyBorD-daratumumab as the best option for first-line therapy [9]. The proportions of patients exhibiting a 2-year event-free survival by disease stage were 80.0% (stage I), 77.1% (stage II), 62.2% (stage IIIa) and 12.5% (stage IIIb) [13]. Patients diagnosed with stage IIIb AL amyloidosis, i.e., with very advanced cardiac disease, have the poorest survival, of approximately 4 months [12]. Over the course of their disease, almost 40% of patients with kidney involvement progress to end-stage renal disease requiring kidney transplant [14]. Advances in treatment, including approval of daratumumab for AL amyloidosis, have changed treatment paradigms as well as patient outcomes by enabling more patients to achieve a favorable hematologic response [13]. Nevertheless, there is a dearth of published data on mortality and disease-related hospitalizations based on real-world evidence [5,7].
The sheer number of first- and second-line regimens identified in our study indicates that, in the real world, many approaches are used to treat disease to obtain a favorable hematologic response. Approximately two-thirds of patients received daratumumab at some point in the year following treatment initiation. A recent article analyzing data from a different claims database reported about the same proportion of patients receiving bortezomib-containing treatment as the most common regimen [15]. In our study, there were no consistent treatment patterns observed in the full study cohort or the two subpopulations analyzed. The myriad treatments used may reflect the varied constellations of symptoms with which patients present [1,2]. The varied treatment patterns also may suggest that clinicians are treating patients on an individualized basis according to their disease severity and/or comorbidities to obtain the best hematologic response, the main criterion used to determine treatment efficacy. These data underscore the complexity of the disease and the difficulties in both diagnosing and treating the disease.
Our data showed a higher incident rate of death within 1 year of treatment initiation among patients with both cardiac and renal involvement than among those who had only cardiac involvement. However, our estimate may be lower than the actual mortality because patients who died in the same month as the index date were excluded from this analysis as their inclusion could make the mortality estimates unstable due to the lack of follow-up data. Our data are similar to those of a study reporting that median survival among patients with cardiac (19.3 months) or renal (11.7 months) involvement at diagnosis was significantly shorter compared with patients without cardiac (51.8 months) or renal (42.9 months) involvement, respectively [16]. Furthermore, the same study reported a significant decrease in median survival when more than one organ was involved at diagnosis: 62.7 months with one organ involved compared with 21.1 months with two organs involved and 7.1 months with three organs involved [16]. Consistent with previously reported results, the proportion of deaths and incidence rates per 1000 patients were substantially higher among patients not receiving daratumumab than among those receiving daratumumab [13]. These results were reflected in both the subpopulation with only cardiac involvement and that with both cardiac and renal involvement.
However, in this real-world analysis, the mean time to death was shorter among patients receiving daratumumab than among patients who did not receive the drug. These results were observed in the total patient population included in our study, as well as in the subpopulation with both cardiac and renal involvement. Numerically similar results were observed for the subpopulation of patients with only cardiac involvement. Another finding was that the proportion of patients with AL-related hospitalizations was lower among patients not receiving daratumumab than among those who received the drug. These results were also observed in both subpopulations analyzed. One possible explanation for these results may be that patients treated with daratumumab may have had more advanced disease than those who did not receive this drug; however, this cannot be verified and is a limitation of this study. Given that more than twice the patients in our cohort were treated with daratumumab than not, any comparison between these two groups needs to be interpreted with caution. The 365-day period defines the recorded mortality outcome, not the treatment-classification window. These are unadjusted descriptive estimates from a temporally mixed classification and should not be interpreted as treatment effects. Nevertheless, the short mean time to death in our study, regardless of the treatment received, identified the continuing unmet need for therapies that can improve cardiac function quickly.
The shorter time to death and the higher proportion of AL-related hospitalizations among patients receiving daratumumab may be an artifact of the study period, which spans only 1 year after initiation of treatment. It is also possible that the patients receiving daratumumab were those with the most advanced disease, resulting in these outcomes in our analysis. A limitation of this study is that disease stage was not included in the analysis, thus making it difficult to determine potential causality for our results. Our study is also limited by the number of patients identified in a single database.
Our study evaluated data from the US IQVIA PharMetrics claims database, a source that collects data for reimbursement rather than research, an inherent limitation of this study. Claims databases are a rich source of untapped real-world data. However, they are also susceptible to coding errors and misclassification of disease, which can introduce confounding and make interpretation of the results more difficult [17–19]. Furthermore, most claims databases often lack disease stage, biomarkers, performance status and organ severity measures, which further complicate analyses [20–22]. One study showed that even including biomarker data in the claims database did not improve its predictive capabilities, although the authors provided ways to improve the outcomes of such analyses [22].
Conclusion
Our study describes heterogeneous treatment patterns and a substantial recorded mortality and inpatient hospitalization burden in this claims-identified cohort. Our analysis of real-world data substantiates that, despite advances in therapy, patients with both cardiac and renal involvement have worse outcomes than those with only cardiac involvement. These data underscore the urgent medical need for more effective treatments, especially for patients with advanced disease and multiple organ involvement. The complexity of treatment patterns also highlights the need for personalized treatment regimens to optimize outcomes for patients. Additional long-term studies by stage and isotype are needed to better identify treatment needs and understand the therapeutic efficacy of the multitude of treatment regimens being used in real-world clinical practice.
Summary points
•
Light chain (AL) amyloidosis is a progressive, debilitating, devastating and often fatal rare disease caused by plasma cell dyscrasia.
•
Treatments for AL amyloidosis have been co-opted from those approved for multiple myeloma, another plasma cell dyscrasia.
•
Although there are guidelines, data on the real-world treatment patterns and impact are scant.
•
This real-word study showed that several different drugs were used either as monotherapy or in combination with other drugs as both first- or second-line treatments in this population.
•
This real-world study also showed that almost two-third of the patients were hospitalized within the first year of diagnosis, and almost 1 in 10 died.
•
Patients with both cardiac and renal involvement fared worse than those with only cardiac involvement.
•
This study underscores the continuing unmet need for therapies, especially for patients with multiple organ involvement.
Author contributions
J Thompson was responsible for study conception and design. J Thompson and C Chow were responsible for acquisition of data. J Thompson and J Catini were responsible for data analysis and interpretation. All authors contributed to manuscript development, review, revision and final approval.
Financial disclosure
The authors received no financial and/or material support for this research or the creation of this work.
Competing interests disclosure
J Thompson and J Catini are employees of Alexion, AstraZeneca Rare Disease and own stock in the company. C Chow was under contract with Alexion, AstraZeneca Rare Disease for this study. The authors have no other competing interests or relevant affiliations with any organization or entity with the subject matter or materials discussed in the manuscript apart from those disclosed.
Writing disclosure
Medical writing support was provided by Mukund Nori, PhD, MBA, CMPP of rareLife solutions (CT, USA), and funded by Alexion, AstraZeneca Rare Disease.
Data sharing statement
Alexion, AstraZeneca Rare Disease will consider requests for disclosure of clinical study patient-level data provided that patient privacy is assured through methods like data de-identification, pseudonymization, or anonymization (as required by applicable law), and if such disclosure was included in the relevant study informed consent form or similar documentation. Qualified academic investigators may request patient-level clinical data and supporting documents (statistical analysis plan and protocol) pertaining to Alexion-sponsored studies. Further details regarding data availability and instructions for requesting information are available in the Alexion Clinical Trials Disclosure and Transparency Policy at https://www.alexionclinicaltrialtransparency.com/data-requests/.
Open access
This work is licensed under the Creative Commons Attribution 4.0 License. To view a copy of this license, visit https://creativecommons.org/licenses/by/4.0/
References
1.
Wechalekar AD, Fontana M, Quarta CC, Liedtke M. AL amyloidosis for cardiologists: awareness, diagnosis, and future prospects. JACC: CardioOncol. 4(4), 427–441 (2022).
2.
Witteles RM, Liedtke M. AL amyloidosis for the cardiologist and oncologist. JACC: CardioOncol. 1(1), 117–130 (2019).
3.
Hester LL, Gifkins DM, Bellew KM et al. Diagnostic delay and characterization of the clinical prodrome in AL amyloidosis among 1523 US adults diagnosed between 2001 and 2019. Eur. J. Haematol. 107(4), 428–435 (2021).
4.
Baker KR. Light chain amyloidosis: epidemiology, staging, and prognostication. Methodist. Debakey Cardiovasc. J. 18(2), 27–35 (2022).
5.
Minnema MC, Dispenzieri A, Merlini G et al. Outcomes by cardiac stage in patients with newly diagnosed AL amyloidosis: Phase III andromeda trial. JACC: CardioOncol. 4(4), 474–487 (2022).
6.
Janssen Biotech Inc. Daralex faspro® (daratumumab and hyaluronidase-fihj). Janssen Biotech, Inc, PA, USA (2021).
7.
Kastritis E, Palladini G, Minnema MC et al. Daratumumab-based treatment for immunoglobulin light-chain amyloidosis. N. Engl. J. Med. 385(1), 46–58 (2021).
8.
Palladini G, Milani P, Malavasi F, Merlini G. Daratumumab in the treatment of light-chain (AL) amyloidosis. Cells 10(3), 545 (2021).
9.
National Comprehensive Cancer Network. Systemic light chain amyloidosis, v2.2026. NCCN.org, Plymouth Meeting, PA, USA (2026). (Accessed 16 March 2026). https://www.nccn.org/professionals/physician_gls/pdf/amyloidosis.pdf
10.
Staron A, Zheng L, Doros G et al. Marked progress in AL amyloidosis survival: a 40-year longitudinal natural history study. Blood Cancer J. 11(8), 139 (2021).
11.
Gertz MA. Cardiac amyloidosis. Heart Fail. Clin. 18(3), 479–488 (2022).
12.
Dittrich T, Kimmich C, Hegenbart U, Schonland SO. Prognosis and staging of AL amyloidosis. Acta Haematol. 143(4), 388–400 (2020).
13.
Yohannan B, Rees M, Gertz MA et al. Improved survival with daratumumab-CyBorD compared with CyBorD as frontline therapy for AL amyloidosis. Blood Neoplasia 2(2), 100092 (2025).
14.
Havasi A, Heybeli C, Leung N et al. Outcomes of renal transplantation in patients with AL amyloidosis: an international collaboration through the International Kidney and Monoclonal Gammopathy Research Group. Blood Cancer J. 12(8), 119 (2022).
15.
Dispenzieri A, Zonder J, Hoffman J et al. Real-world treatment patterns, costs, and outcomes in patients with AL amyloidosis: analysis of the Optum EHR and commercial claims databases. Amyloid 30(2), 161–168 (2023).
16.
Huang X, Wang Q, Jiang S, Chen W, Zeng C, Liu Z. The clinical features and outcomes of systemic AL amyloidosis: a cohort of 231 Chinese patients. Clin. Kidney J. 8(1), 120–126 (2015).
17.
Newcomer SR, Xu S, Kulldorff M, Daley MF, Fireman B, Glanz JM. A primer on quantitative bias analysis with positive predictive values in research using electronic health data. J. Am. Med. Inform. Assoc. 26(12), 1664–1674 (2019).
18.
Desai RJ, Levin R, Lin KJ, Patorno E. Bias implications of outcome misclassification in observational studies evaluating association between treatments and all-cause or cardiovascular mortality using administrative claims. J. Am. Heart Assoc. 9(17), e016906 (2020).
19.
Funk MJ, Landi SN. Misclassification in administrative claims data: quantifying the impact on treatment effect estimates. Curr. Epidemiol. Rep. 1(4), 175–185 (2014).
20.
Chawla N, Yabroff KR, Mariotto A et al. Limited validity of diagnosis codes in Medicare claims for identifying cancer metastases and inferring stage. Ann. Epidemiol. 24(9), 666–672 672.e1–2 (2014).
21.
Nguyen C, Zheng H, Grabner M et al. Integration of administrative claims and clinical data to advance real-world evidence generation in oncology. Curr. Med. Res. Opin. 41(4), 671–681 (2025).
22.
Rizzo A, Jing B, Boscardin WJ, Shah SJ, Steinman MA. Can markers of disease severity improve the predictive power of claims-based multimorbidity indices? J. Am. Geriatr. Soc. 71(3), 845–857 (2023).
Information & Authors
Information
Published In
Copyright
© 2026 Alexion AstraZeneca Rare Disease. This work is licensed under the Creative Commons Attribution 4.0 License
History
Received: 20 May 2026
Accepted: 28 October 2026
Published online: 17 November 2026
Keywords:
Topics
Authors
Metrics & Citations
Metrics
Article Usage
Article usage data only available from February 2023. Historical article usage data, showing the number of article downloads, is available upon request.
Citations
How to Cite
Mortality and inpatient hospitalizations by anti-plasma cell dyscrasia treatment patterns among patients with cardiac light chain amyloidosis: results from a US administrative claims database. (2026) Journal of Comparative Effectiveness Research. DOI: 10.57264/cer-2026-0104
Export citation
Select the citation format you wish to export for this article or chapter.