

Understanding the economic and healthcare burden of metabolic dysfunction-associated steatohepatitis: a real-world claims data analysis from Germany
Publication: Journal of Comparative Effectiveness Research
Abstract
Aim: Metabolic dysfunction-associated steatohepatitis (MASH) is a progressive form of metabolic dysfunction-associated steatotic liver disease, linked to hepatic and extra-hepatic complications and substantial healthcare costs. Despite its clinical and economic impact, real-world evidence on disease progression and costs in Germany is limited. Materials & methods: We conducted a retrospective cohort study using statutory health insurance claims from the InGef database (2016–2023), covering 4.7% of the German population. Patients with MASH were identified using ICD-10-GM code K75.8, in absence of the more specific code in the German coding system. Baseline characteristics and comorbidities were assessed over 2 years prior to index diagnosis. Progression was defined by transitions through end-stage liver disease (ESLD) stages: compensated cirrhosis, decompensated cirrhosis, hepatocellular carcinoma and liver transplantation. Healthcare costs were analyzed descriptively and via regression models. Results: Among 4710 patients with MASH (prevalence: 0.15%), 39.4% had documented ESLD during follow-up (mean follow-up in days 1530). Disease progression to ESLD occurred in 26.0% of patients without baseline ESLD (n = 922/3490), whereas 4.0% of patients with baseline ESLD (n = 48/1188) progressed to a more severe ESLD stage during follow-up, with a mean time to first progression of approximately 25.3 months. Patients with ESLD incurred annual costs of €12,737 versus €4928 for those without ESLD. Progression to hepatocellular carcinoma and liver transplantation resulted in predicted costs of €12,948 and €75,719 per patient-year, respectively. Mortality was significantly higher among patients with ESLD (incidence rate ratio: 4.65; 95% CI: 3.76–5.79). Discussion: Over a quarter of identified patients with MASH already had advanced liver disease at baseline, suggesting potential underdiagnosis or late recognition in routine clinical practice. Early detection, proactive management and targeted therapies are essential to reduce progression and economic burden.
Plain language summary: Disease progression, healthcare use & costs in people with MASH in Germany
What is this article about?
This article looks at how metabolic dysfunction-associated steatohepatitis (MASH), a serious form of fatty liver disease, affects people in Germany. Using German health insurance claims data from 2016 to 2023, the study examined how often people with MASH developed advanced liver disease, what other health problems they had, and how much their healthcare cost.
What were the results?
Among 4710 identified patients with MASH, many already had advanced liver disease or developed it during follow-up. Patients with end-stage liver disease had much higher healthcare costs than those without it. Costs increased further in more severe stages such as liver cancer or liver transplantation. Patients with advanced liver disease also had a much higher risk of death and major cardiovascular events.
What do the results mean?
The findings show that MASH places a substantial burden on patients and the healthcare system in Germany, especially when the disease progresses to advanced liver stages. Earlier detection and better management may help reduce complications, improve outcomes and lower costs. The results also suggest that MASH may often be diagnosed late in routine care.
Metabolic dysfunction-associated steatohepatitis (MASH) is a progressive form of metabolic dysfunction-associated steatotic liver disease (MASLD), and characterized by hepatic steatosis, inflammation and varying degrees of fibrosis [1,2]. The terminology shift, introduced by international consensus, reflects the central role of metabolic dysfunction and aims to improve disease recognition [3,4]. The definition of MASLD requires the presence of hepatic steatosis along with at least one cardiometabolic risk factor [5] emphasizing the association with cardiometabolic syndrome, including obesity, Type 2 diabetes mellitus (T2D), dyslipidemia, hypertension and insulin resistance [6,7].
Worldwide, MASLD affects up to 40% of adults, while the prevalence of MASH is estimated at about 5–7% [1,5,6,8]. In Germany, recent epidemiological data estimate that approximately 4–5% of the adult population is affected by MASH [8]. MASH presents a substantial burden on patients and a challenge to healthcare systems worldwide due to its association with an increased risk of hepatic and extra-hepatic complications, such as cirrhosis, decompensated cirrhosis (DCC), hepatocellular carcinoma (HCC), as well as cardiovascular disease (CVD) [8–12]. The increased risk of developing major adverse cardiovascular events (MACE) among patients with hepatic steatosis was recently shown by Huber and colleagues [9] resulting in an increased risk of 62.3% (hazard ratio [HR] 1.623, 95% CI: 1.31–2.01; p < 0.0001).
The majority of healthcare costs is attributed to the progressive disease stages of MASH [13] with an estimated 20% of people with MASH progressing to end-stage liver disease (ESLD) [7].
A 1-year cycle Markov model [8] analyzing MASH progression from 2021 to 2040, referring to a 2020 baseline cohort with prevalent MASH cases, estimated that direct medical expenses would more than double over this period. The model predicted an increase in annual costs from $34.97 billion to $78.59 billion in the US and $0.83 billion to $1.82 billion in Germany [8]. Despite these projections, there remains a notable gap in real-world evidence on progression rates, healthcare resource utilization (HCRU), such as comedication, and direct medical costs of MASH in Germany.
Existing evidence on the burden of MASH has been derived largely from economic modeling studies and real-world analyses conducted in non-German settings. Although these studies consistently suggest a substantial clinical and economic burden, their findings may not be directly transferable to the German healthcare system because of differences in case definitions, coding practices, patient populations and care pathways. Real-world evidence is therefore essential to complement modeling approaches by characterizing disease progression, healthcare utilization, medication use and direct medical costs in routine German clinical practice.
However, addressing this evidence gap is further complicated by the fact that identifying MASH in German administrative claims data is inherently challenging due to the absence of a specific ICD-10-GM code [14], known underdiagnosis in routine clinical practice [15], and variation in documentation and coding practices across healthcare settings. These factors may result in a claims-based MASH cohort that disproportionately represents clinically recognized or advanced disease.
Against this backdrop, this study aims to generate evidence on the economic burden of MASH in Germany, with a particular focus on disease progression and its implications for healthcare utilization and costs.
Materials & methods
This retrospective cohort study analyzed anonymized statutory health insurance (SHI) claims data from the Institute for Applied Health Research Berlin (InGef) representative sample research database, spanning January 2016 to December 2023. The InGef database aggregates claims data from over 50 SHIs [16]. As of 2023, the sample covers approximately 4.7% of the German population [17] and 5.4% of the SHI-insured population [18], encompassing data from around 4 million insured individuals. The database provides detailed information on patient demographics, diagnoses, HCRU and associated costs, offering a comprehensive and reliable source for real-world evidence on disease burden within the German healthcare system. Preliminary findings from this research were presented at ISPOR Europe 2025 [19]. The present manuscript extends the conference analysis by revised cohort definitions with an extended baseline period of 2 years. The difference in cohort size (N = 4710 in the current study vs N = 5060 in the conference abstract) reflects a 2-year versus 1-year baseline period requirement.
Study population & identification
At the time of this retrospective study, no MASH-specific approved treatments were available, and the identification of patients with MASH referred to the former nomenclature [8].
Patients with MASH were identified between January 2018 and December 2022 using the ICD-10-GM (the International Classification of Diseases, Tenth Revision, German Modification) code ‘K75.8’ Other specified inflammatory liver diseases, nonalcoholic steatohepatitis (NASH) (‘Sonstige näher bezeichnete entzündliche Leberkrankheiten; Nicht alkoholische Steatohepatitis [NASH]’). The more specific four-digit code ‘K75.81’ is not available in the German ICD-10 catalogue. To enhance diagnostic validity in the claims data, inclusion required evidence of NASH via at least one inpatient diagnosis or at least two outpatient diagnoses recorded in distinct quarters, consistent with commonly used claims-based algorithms intended to reduce misclassification from provisional or rule-out coding [20]. The first documented MASH diagnosis in the enrollment period defined the index quarter, which served as the starting point for follow-up and was required to be at least 1 year. A 2-year baseline period preceding the index quarter was applied to assess exclusion diagnoses such as other liver diseases (Supplementary Table 8), comorbidities and pre-existing ESLD diagnoses (Figure 1). To evaluate the robustness of this approach, a sensitivity analysis using a 1-year baseline period was conducted and is reported in the Supplementary Material (Supplementary Tables 2 & 3).
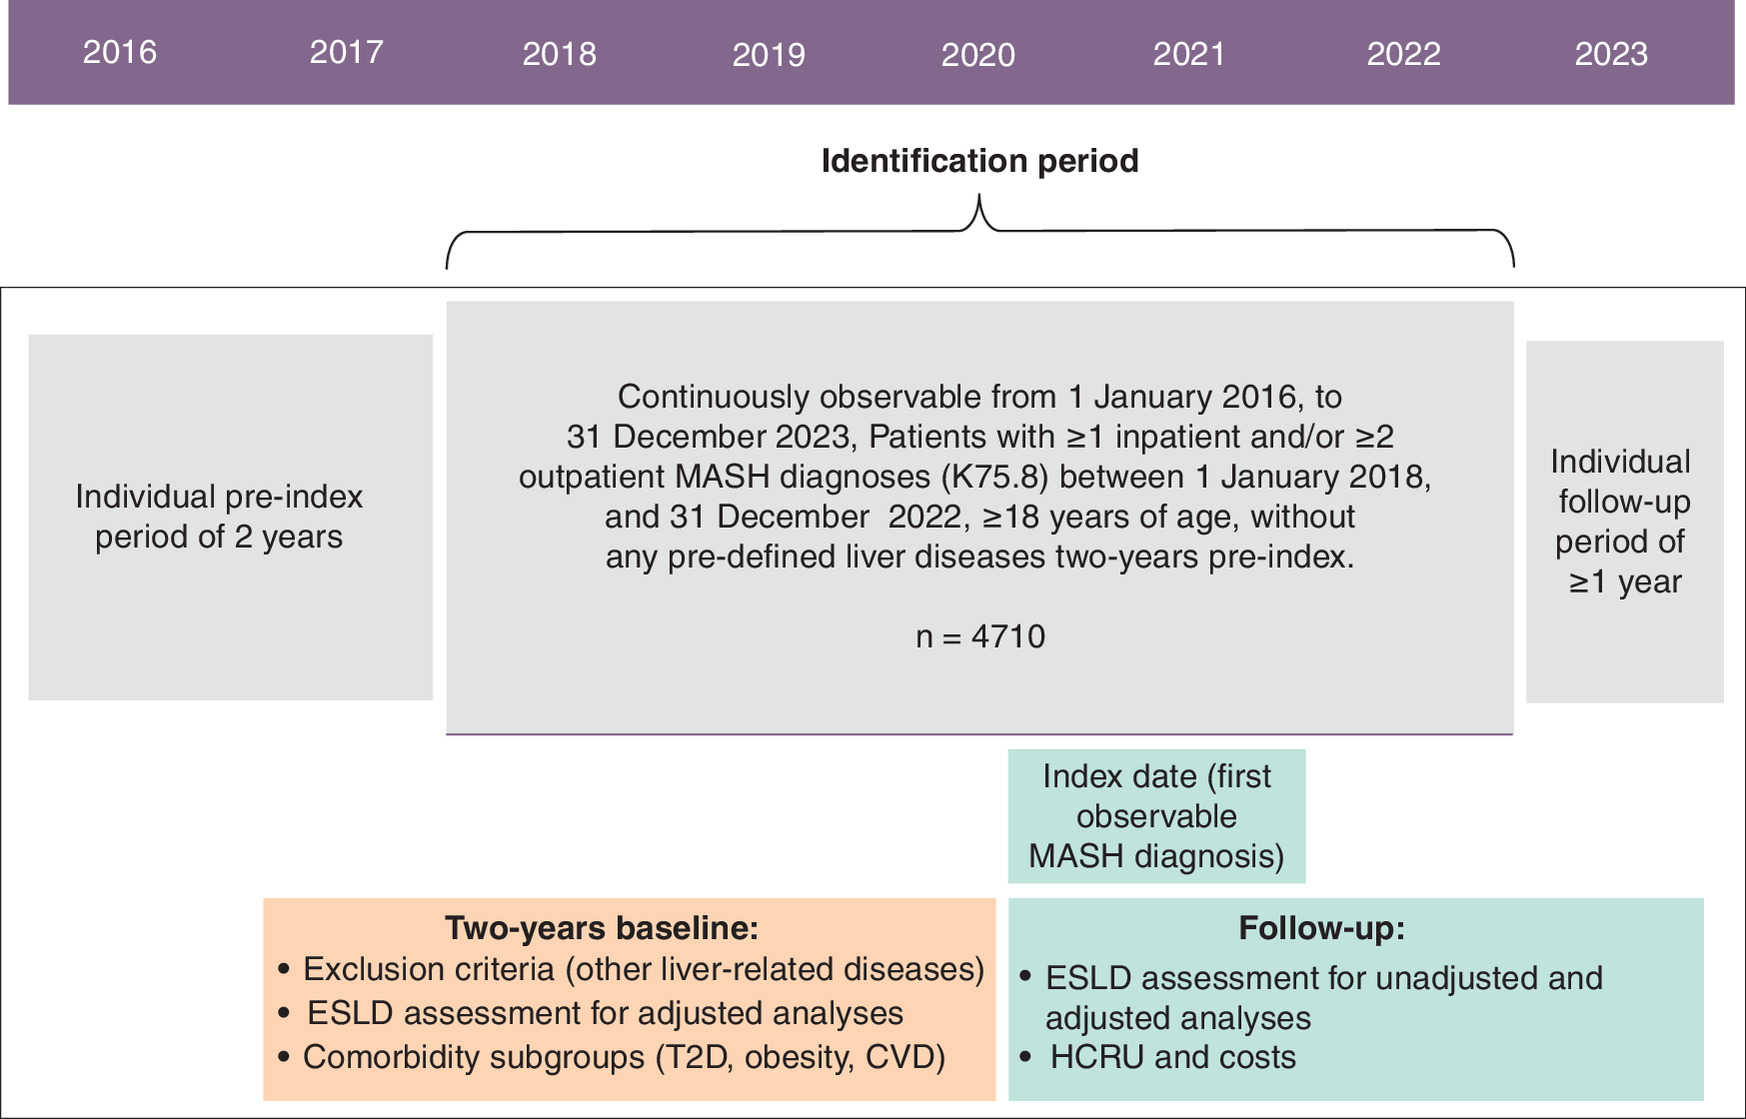
Figure 1. Study design diagram showing the individual pre-index period of 2 years, identification period and follow-up.
CVD: Cardiovascular disease; ESLD: End-stage liver disease; HCRU: Healthcare resource utilization; MASH: Metabolic dysfunction-associated steatohepatitis; T2D: Type 2 diabetes mellitus.
Baseline characteristics & comorbidities
Baseline characteristics included age, sex, comedications, ESLD, the most frequently coded comorbidities overall, and the presence of key cardiometabolic comorbidities (T2D, obesity and CVD), each defined by ≥1 ICD-10-GM diagnosis code during baseline. CVD was broadly defined using multiple ICD-10-GM codes encompassing hypertension, stroke, atrial fibrillation and myocardial infarction (code lists reported in the Supplementary Tables 9–11).
Follow-up & cohort definitions
Patients were followed from the MASH index quarter until the earliest occurrence of death, insurance disenrollment, or the end of the observation period (31 December 2023). For all analyses, the MASH index diagnosis served as the time zero. Baseline ESLD status was assessed during the 2-year pre-index period. During follow-up, disease progression was defined as advancement to a more severe ESLD stage in the following order: compensated cirrhosis (CC) → decompensated cirrhosis (DCC) → hepatocellular carcinoma (HCC) → liver transplantation (LT).
Unadjusted cohorts were defined solely according to whether any ESLD diagnosis was observed after the MASH index diagnosis:
•
With ≥1 ESLD diagnosis during follow-up: patients with ≥1 ESLD diagnosis after index.
•
Without any ESLD diagnosis during follow-up: patients with no ESLD diagnosis after index.
Adjusted cohorts incorporated baseline ESLD stage to distinguish incident ESLD from progression beyond pre-existing disease severity:
•
Progression (P): patients without baseline ESLD who developed any ESLD during follow-up, or patients with baseline ESLD who advanced to a higher ESLD stage during follow-up.
•
Nonprogression (NP): patients without baseline ESLD who remained free of ESLD during follow-up, or patients with baseline ESLD who did not progress to a higher ESLD stage during follow-up.
Thus, adjusted analyses accounted for baseline ESLD severity while preserving the MASH index diagnosis as the common starting point for follow-up. The adjusted cohort excluded patients who showed evidence of ESLD regression during follow-up, to focus the analysis on unidirectional disease progression.
Outcomes & statistical analysis
Primary outcomes were healthcare costs, comorbidities, mortality and disease progression. The database captures inpatient, outpatient and pharmacy sectors, with detailed resource use and reimbursed costs. Costs were reported as unadjusted per patient per year (PPPY) and stratified by ESLD status (with/without ESLD in follow-up) and comorbidity subgroups.
Among patients without a history of MACE at the MASH index date, incident MACE were assessed as an expanded composite end point comprising myocardial infarction, stroke, and all-cause death, hereafter referred to as Expanded MACE. This definition departs from the conventional 3-point MACE (myocardial infarction, stroke and cardiovascular death) because German administrative claims data do not distinguish cardiovascular from noncardiovascular cause of death; only all-cause mortality is recorded. Consequently, the mortality component was defined as all-cause death, which may broaden the end point to include noncardiovascular deaths and should be considered when interpreting MACE rates in this cohort. Time to first Expanded MACE was evaluated using Kaplan–Meier methods.
Disease progression was defined as the first recorded diagnosis of an ESLD stage (CC, DCC, HCC or LT) during follow-up among patients without the respective condition at baseline. Time to progression from the MASH index date to each ESLD stage was assessed using Kaplan–Meier survival methods, with diagnosis dates standardized to the first day of the corresponding quarter due to quarterly outpatient data availability. To account for disease progression and death among patients with MASH without ESLD at baseline, a cumulative incidence model was additionally applied, estimating the cumulative incidence function (CIF) for death across the ESLD groups. Patients were censored at the end of the study period (31 December 2023) if they remained alive or if they never experienced an ESLD event. Between-stratum differences in cumulative incidence were assessed using Gray’s test.
Cost skewness was addressed using GLMs with a log link function and gamma-distributed errors for all-cause and MASH/ESLD-related costs. with Covariates were selected a priori based on clinical relevance and established associations with healthcare costs in MASH populations: ESLD stage, age, sex and baseline comorbidities (T2D, CVD, obesity). Costs and HCRU were assessed quarterly to align with German outpatient claims reporting. All costs were analyzed in euros (EUR) and reflect the actual reimbursed expenditures recorded in the InGef claims database during the observation period (2016–2023). Costs were assigned to the year in which they were incurred and were not adjusted to a common price year because the primary comparisons are cross-sectional between disease strata within overlapping calendar periods. Predicted annual costs derived from the GLM models therefore represent cost levels as observed across the study period and are not inflation-standardized. No currency conversions or inflation adjustments were applied.
Sensitivity analyses
Sensitivity analyses included an alternative baseline period (1 and 2 years) and additional cohorts to address potential underdiagnosis of MASH. Results of these analyses are presented in Figure 1 & Supplementary Tables 2 & 3.
Results
Study population
A total of 4710 patients with MASH were identified within the InGef population (prevalence 0.15%, Supplementary Table 1). The (unadjusted) assessment of ESLD in the follow-up (after MASH index diagnosis) without controlling for ESLD stage at baseline yielded n = 1854 (39.4%) with any ESLD stage during follow-up. Figure 2 illustrates the study population flow.
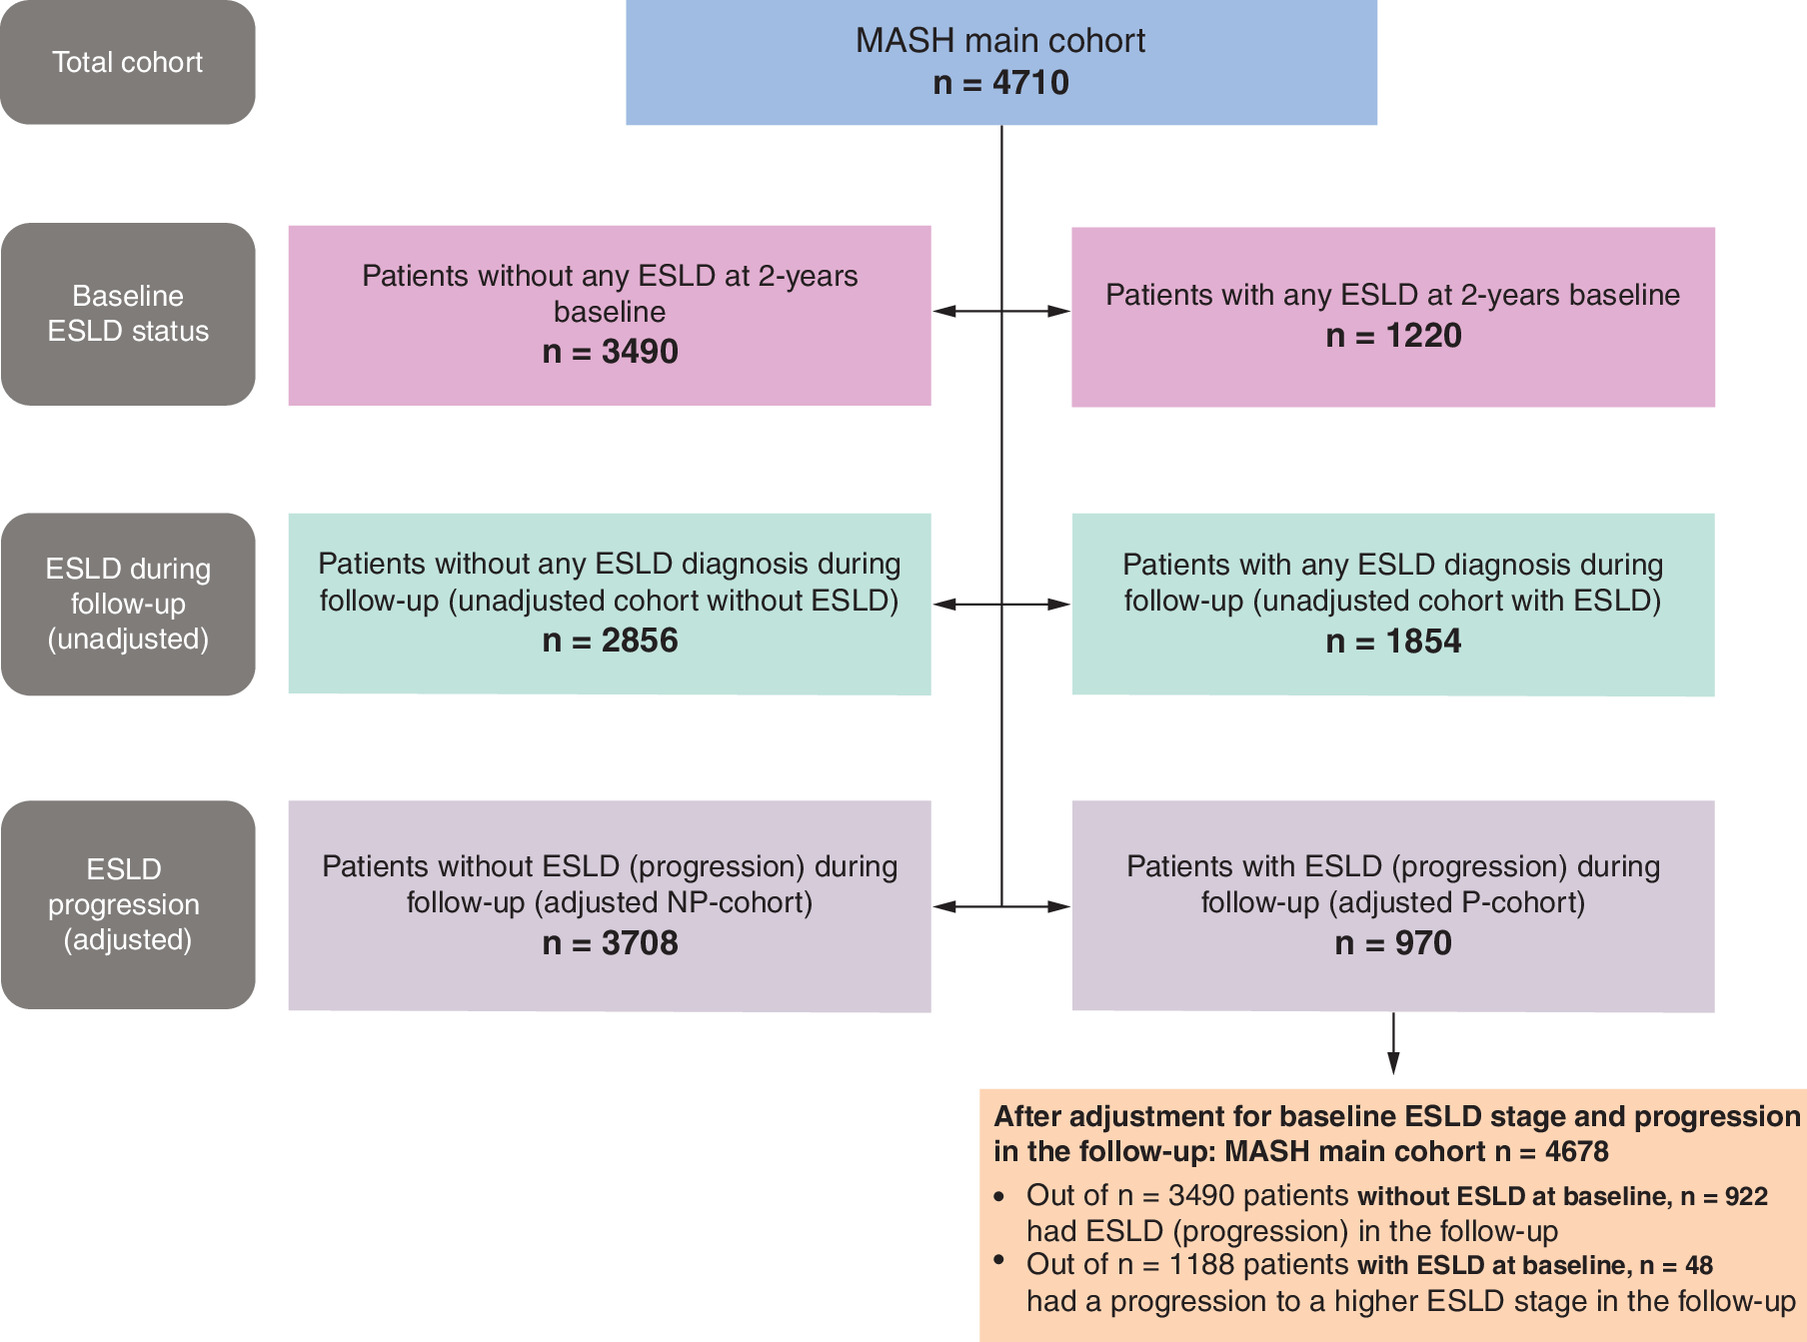
Figure 2. Flow diagram showing the MASH main cohort stratified accross three analytical layers – baseline end-stage liver disease (ESLD) status, ESLD diagnosis during follow-up (unadjusted), and ESLD progression in the follow-up (adjusted).
ESLD: End-stage liver disease; MASH: Metabolic dysfunction-associated steatohepatitis.
Demographic & clinical characteristics (unadjusted)
The main MASH cohort (n = 4710) was 52.7% male, with similar sex distributions across ESLD and non-ESLD subgroups. Liver fibrosis was coded in 1.1% of patients without ESLD (Supplementary Table 3).
Baseline comorbidities were assessed in the 2 years before the MASH index date in the unadjusted cohort and subgroups. Overall comorbidities were common, including hypertension (ICD-10-GM I10), T2D and obesity (Table 1).
| MASH main cohort (n = 4710) | MASH main cohort without ESLD during follow-up (n = 2856) | MASH main cohort with ESLD during follow-up (n = 1854) | ||||
|---|---|---|---|---|---|---|
| Summary statistics, n | % | Summary statistics, n | % | Summary statistics, n | % | |
| Male | 2484 | 52.7% | 1528 | 53.5% | 956 | 51.6% |
| All-cause mortality | 426 | 9.0% | 114 | 4.0% | 312 | 16.8% |
| Average follow-up in days (years) | 1396 (3.8) | 1407 (3.9) | 1337 (3.8) | |||
| Liver fibrosis and/or sclerosis (baseline) | 114 | 2.4% | 30 | 1.1% | 84 | 4.5% |
| Most common comorbidities baseline | ||||||
| Arterial (primary) hypertension | 3108 | 66.0% | 1812 | 63.5% | 1296 | 69.9% |
| Obesity | 1986 | 42.2% | 1182 | 41.4% | 804 | 43.4% |
| T2D | 1625 | 34.5% | 899 | 31.5% | 726 | 39.2% |
| Comedications baseline | ||||||
| Proton pump inhibitors | 1923 | 40.8% | 1049 | 36.7% | 874 | 47.1% |
| Propionic acid derivatives | 1854 | 39.4% | 1117 | 39.1% | 737 | 39.8% |
| Pyrazolones | 1536 | 32.6% | 843 | 29.5% | 693 | 37.4% |
| Beta blocking agents, selective | 1358 | 28.8% | 744 | 26.1% | 614 | 33.1% |
| Statins - lipid lowering | 1319 | 28.0% | 756 | 26,5% | 563 | 30.4% |
| Antihypertonics (incl. ACE inhibitors) | 2934 | 62.3% | 1696 | 59.4% | 1238 | 66.8% |
| Metformin | 1063 | 22.6% | 595 | 20.8% | 468 | 25.2% |
| Gliptin | 495 | 10.5% | 259 | 9.1% | 236 | 12.7% |
| Insulin | 489 | 10.4% | 242 | 8.5% | 247 | 13.3% |
| GLP-1R agonists | 172 | 3.7% | 90 | 3.2% | 82 | 4.4% |
| SGLT2 inhibitors | 272 | 5.8% | 146 | 5.1% | 126 | 6.8% |
| Fibrate | 54 | 1.2% | 435 | 1.0% | 26 | 1.4% |
| Comedications follow-up | ||||||
| Proton pump inhibitors | 2711 | 57.6% | 1496 | 52.4% | 1216 | 65.6% |
| Propionic acid derivatives | 2529 | 53.7% | 1558 | 54.6% | 971 | 52.4% |
| Pyrazolones | 2556 | 54.3% | 1434 | 50.2% | 1122 | 60.5% |
| Beta blocking agents, selective | 1669 | 35.4% | 942 | 33.0% | 727 | 39.2% |
| Statins – lipid lowering | 1866 | 39,6% | 1095 | 38,3% | 771 | 41.6% |
| Antihypertonics (incl. ACE inhibitors) | 3413 | 72.5% | 2010 | 70.4% | 1403 | 75,7% |
| Metformin | 1359 | 28.9% | 803 | 28.1% | 556 | 30.0% |
| Gliptin | 608 | 12.9% | 322 | 11.3% | 286 | 15.4% |
| Insulin | 666 | 14.1% | 320 | 11.2% | 346 | 18.7% |
| GLP-1R agonists | 455 | 9.7% | 265 | 9.3% | 190 | 10.3% |
| SGLT2 inhibitors | 774 | 16.4% | 435 | 15.2% | 339 | 18.3% |
| Fibrate | 70 | 1.5% | 44 | 1.5% | 26 | 1.4% |
ACE: Angiotensin-converting enzyme inhibitor; ESLD: End-stage liver disease; GLP-1R agonists: Glucagon-like peptide-1 receptor agonist; MASH: Metabolic dysfunction-associated steatohepatitis; SGLT2 inhibitor: Sodium-glucose cotransporter-2 inhibitor; T2D: Type 2 diabetes mellitus.
Medication use was assessed using ATC codes over the 2-year baseline and 1-year follow-up periods requiring ≥1 prescription (Table 1). Proton pump inhibitors (A02BC) were most frequently prescribed (40.8% at baseline; 57.6% during follow-up), with use of 47.1% and 65.6% in the ESLD subgroup and 36.7% and 52.4% in the non-ESLD subgroup.
Cardiometabolic medications (Supplementary Table 11) captured included statins, antihypertensives, metformin, gliptins, insulin, GLP-1 receptor agonists, SGLT2 inhibitors and fibrates. Statin use was 30.4% and 41.6% (ESLD) and 26.4% and 38.3% (non-ESLD); antihypertensive use was 66.8% and 75.7% and 59.4% and 70.4%. Metformin use was 25.2% and 30.0% and 20.8% and 28.1%; gliptin use was 12.7% and 15.4% and 9.1% and 11.3%; insulin use was 13.3% and 18.7% and 8.5% and 11.2%. GLP-1 receptor agonist use was 4.4% and 10.3% and 3.2% and 9.3%; SGLT2 inhibitor use was 6.8% and 18.3% and 5.1% and 15.2%. Fibrate use remained low. Medication use was assessed descriptively at baseline and during follow-up. The use of cardiometabolic medications such as GLP-1 receptor agonists and SGLT2 inhibitors should not be interpreted as MASH-specific treatment, but rather as use of medications closely linked to comorbid conditions such as diabetes, which may be more difficult to manage in patients with ESLD.
All-cause healthcare costs (unadjusted)
All-cause healthcare costs covered each patient's full observable follow-up from MASH index diagnosis to end of follow-up, including ESLD and subsequent costs when available (Figure 3). Total costs PPPY were €12,737 in the ESLD subgroup (median €5091, IQR €10,697) and €4928 in the non-ESLD subgroup (median €2346, IQR €4470). Total all-cause costs were €37,687,788 for the MASH main cohort; €23,614,824 (62.7%) accrued to patients with ESLD during follow-up.
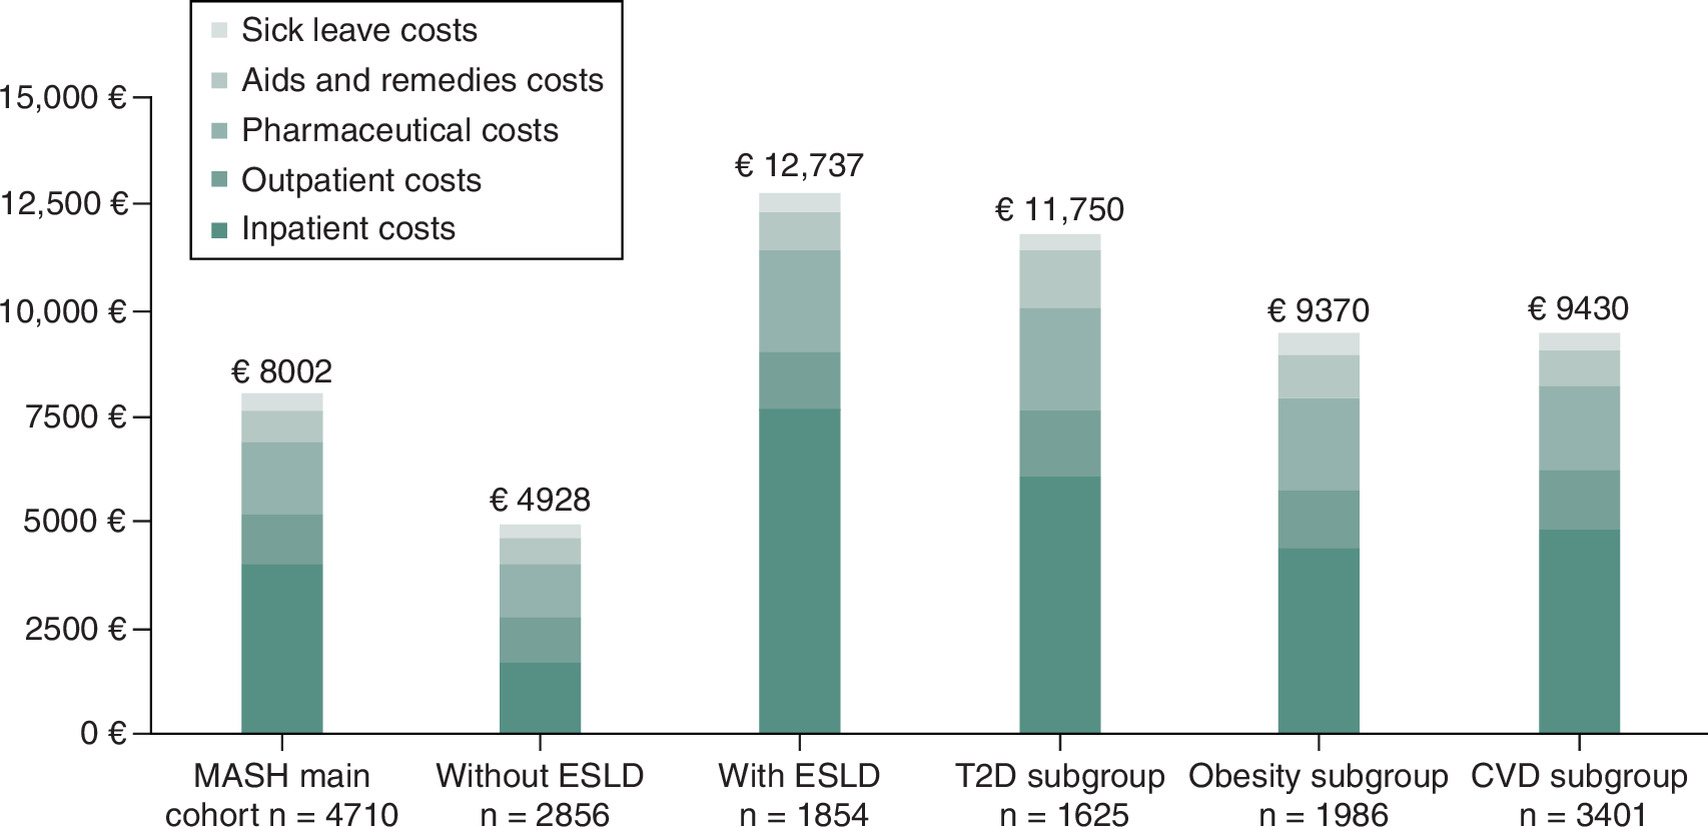
Figure 3. Bar graph showing unadjusted average healthcare costs for patients with MASH, with higher costs in the end-stage liver disease subgroup.
CVD: Cardiovascular disease; ESLD: End-stage liver disease; MASH: Metabolic dysfunction-associated steatohepatitis; T2D: Type 2 diabetes mellitus.
Inpatient costs were a major cost component (ESLD: mean €7592 PPPY; median €1537, IQR €5566; non-ESLD: mean €1641 PPPY; median €250, IQR €1600; overall: mean €3984 PPPY; median €624, IQR €2750). MASH/ESLD-related costs averaged €2233 PPPY (median €400, IQR €641) in the ESLD subgroup and €377 PPPY (median €252, IQR €289) in the non-ESLD subgroup.
Outpatient costs were €1388 PPPY (median €1025, IQR €979) in the ESLD subgroup and €1084 PPPY (median €787, IQR €783) in the non-ESLD subgroup; pharmaceutical costs were €2398 PPPY (median €575, IQR €1734) and €1245 PPPY (median €276, IQR €896), respectively. Aids and remedies costs were €911 PPPY (median €282, IQR €773) and €631 PPPY (median €145, IQR €476). Sick leave costs were infrequent and averaged €449 PPPY and €327 PPPY (both median €0, IQR €0); in Germany, payments are available from week 7 onward for the same cause.
Incidence of MACE
The incidence of Expanded MACE (composite end point comprising MI, stroke and all-cause death) was assessed among patients without prior Expanded MACE at their MASH index event. To evaluate the impact of comorbid conditions, particularly ESLD, incidence rate ratios (IRRs) were calculated comparing Expanded MACE rates in patients with and without ESLD during follow-up.
In the overall cohort of 4710 patients, 11.6% (n = 547) experienced an incident Expanded MACE. MI occurred in 3.3% (n = 157), stroke in 6.9% (n = 324) and 9.0% (n = 426) died. In total, 16.4% (n = 771) experienced at least one Expanded MACE over 32,803.4 person-years, corresponding to 2.4 events per 100 person-years (95% CI: 2.2–2.5) (Table 2).
| Cohort | Incident Expanded MACE patients | Patients with events, n (%) | Person-years of follow-up | Rate per 100 person-years (95% CI) | Incidence rate ratio (IRR) (95% CI) |
|---|---|---|---|---|---|
| MASH main cohort (n = 4710) | 547 (11.6%) | MI: 157 (3.3%) Stroke: 324 (6.9%) Mortality: 426 (9.0%) Total (distinct): 771 (16.4%) | 35,692.69 | MI: 0.44 (0.37–0.51) Stroke: 0.93 (0.84–1.04) Mortality: 1.21 (1.10–1.33) Total: 2.35 (2.19–2.52) | — |
| MASH without ESLD in the follow-up (n = 2856) | 208 (7.28%) | MI: 83 (2.9%) Stroke: 163 (5.7%) Mortality: 114 (4.0%) Total (distinct): 323 (11.3%) | 22,030.52 | MI: 0.38 (0.30–0.47) Stroke: 0.76 (0.65–0.88) Mortality: 0.51 (0.42–0.62) Total: 1.55 (1.39–1.73) | MI: 0.70 (0.51–0.95) Stroke: 0.62 (0.50–0.77) Mortality: 0.22 (0.17–0.27) Total: 0.42 (0.36–0.48) |
| MASH with ESLD in the follow-up (n = 1854) | 339 (18.28%) | MI: 74 (3.99%) Stroke: 161 (8.68%) Mortality: 312 (16.83%) Total (distinct): 448 (24.16%) | 13,662.17 | MI: 0.54 (0.43–0.68) Stroke: 1.23 (1.04–1.43) Mortality: 2.39 (2.13–2.67) Total: 3.73 (3.39–4.09) | MI: 1.44 (1.05–1.97) Stroke: 1.62 (1.30–2.01) Mortality: 4.65 (3.76–5.79) Total: 2.40 (2.08–2.77) |
CI: Confidence interval; ESLD: End-stage liver disease; IRR: Incidence rate ratio; MACE: Major adverse cardiovascular event; MASH: Metabolic dysfunction-associated steatohepatitis; MI: Myocardial infarction.
Marked differences emerged by ESLD status. Among patients without ESLD (n = 2856), 7.3% (n = 208) experienced an Expanded MACE, with an overall incidence rate of 1.6 per 100 person-years (95% CI: 1.4–1.7). Compared with patients with ESLD, this subgroup had substantially lower risk: Expanded MACE (IRR 0.42), MI (IRR 0.70), stroke (IRR 0.62) and mortality (IRR 0.22) (Table 2).
Patients with ESLD (n = 1854) showed higher Expanded MACE incidence (18.3%; n = 339). MI occurred in 4.0%, stroke in 8.7%, and mortality in 16.8%. Overall Expanded MACE incidence was 3.7 per 100 person-years (95% CI: 3.4–4.1), with risk increases of 140% for Expanded MACE, 44% for MI, 62% for stroke and 365% for mortality compared with non-ESLD patients (Table 2).
Median time to Expanded MACE was 15 months (Figure 4), extending to 24 months when excluding baseline Expanded MACE. Across analyses, patients with ESLD consistently showed higher event rates, while those without ESLD demonstrated longer event-free survival (log-rank p < 0.001).
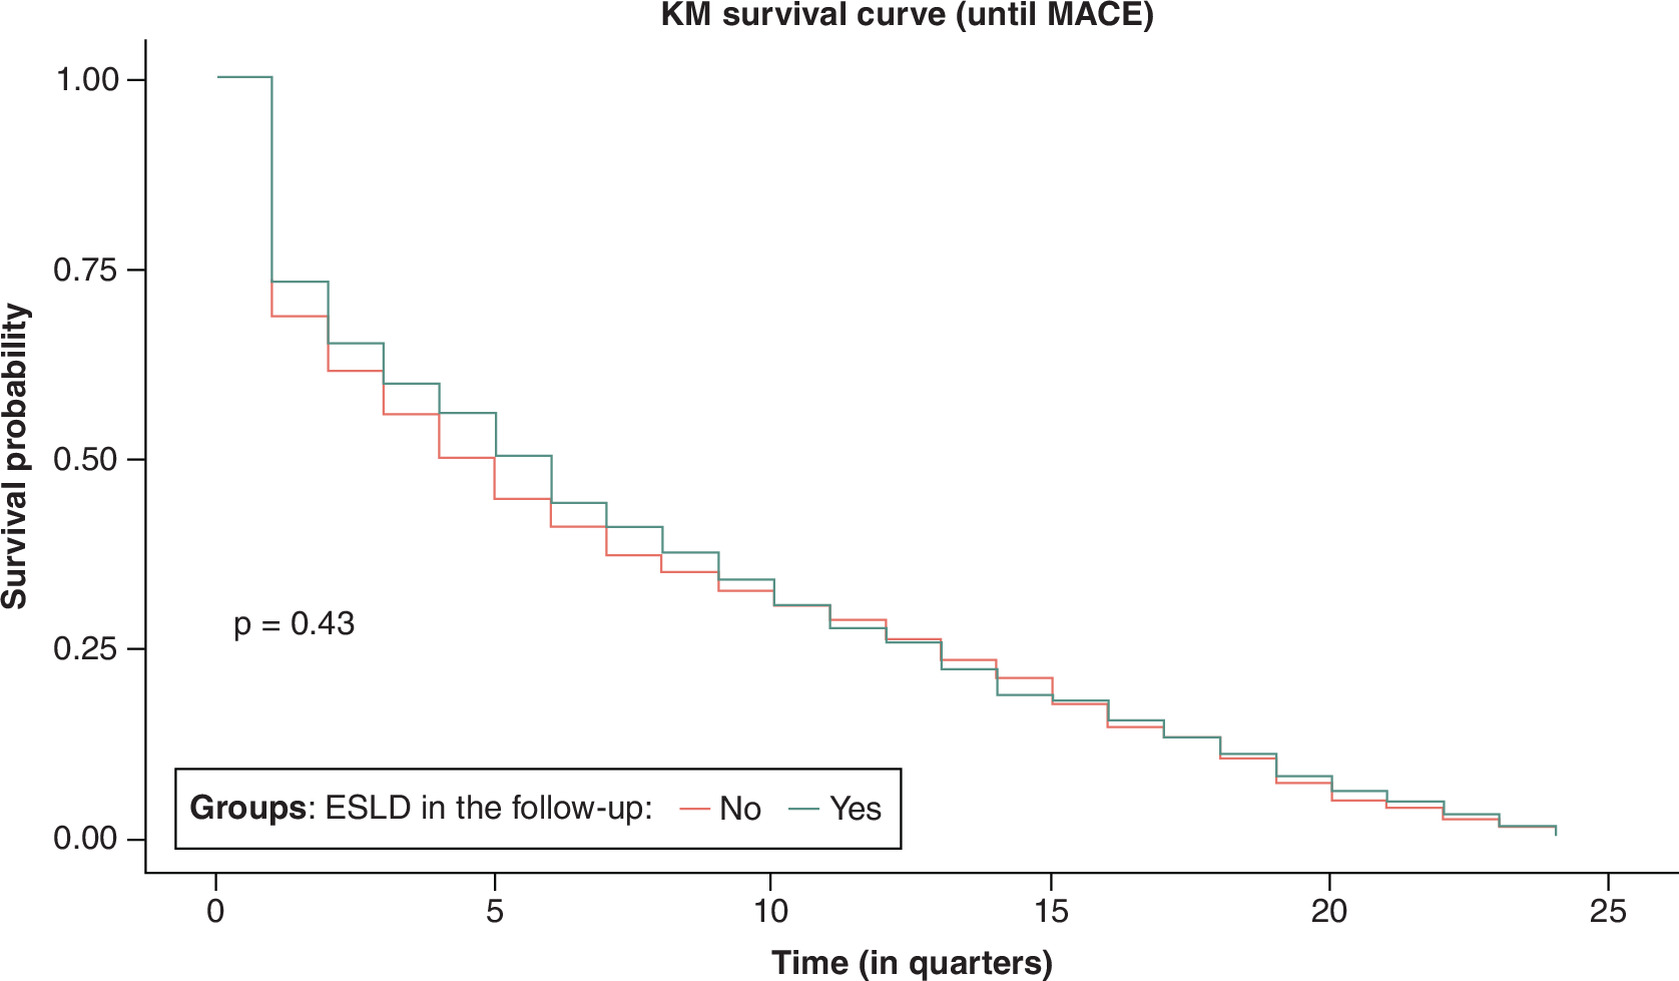
Figure 4. Graph showing Kaplan-Meier survival curve for Expanded MACE for patients with and without end-stage liver disease in the follow-up period.
ESLD: End-stage liver disease; KM: Kaplan–Meier; MACE: Major adverse cardiovascular events.
Liver disease progression (adjusted)
In the adjusted analysis, disease progression was defined as either the occurrence of any ESLD diagnosis during follow-up for patients with MASH and without ESLD at baseline or progression to a higher ESLD stage during follow-up for patients with MASH and with ESLD at baseline. Among patients with ESLD at baseline, the highest baseline ESLD stage was taken into account for the assessment of disease progression in the follow-up. Among patients with ESLD at baseline (n = 1188), 48 patients (4.0%) progressed to a more severe ESLD stage during follow-up, with an average time to first progression of approximately 25.3 months (Tables 3 & 4). In comparison, among patients without ESLD at baseline (n = 3490), 922 patients (26.0%) progressed to ESLD during follow-up (Table 3), with an average time to first progression of approximately 18.4 months (log-rank p = 0.04) (Table 4). For patients who experienced further progression to a more severe disease state, the average time to the next higher progression stage was approximately 31.7 months in comparison to 21.8 months among patients with ESLD at baseline (log-rank p = 0.28) (Table 4).
| ESLD states | ESLD subgroup: patients with ESLD at baseline (n = 1220) | ESLD subgroup: patients without ESLD at baseline (n = 3490) | ||||||||
|---|---|---|---|---|---|---|---|---|---|---|
| Patients with events, n | Person-years of follow-up | Rate per 100 person-years | Number of patients with events | Person-years of follow-up | Rate per 100 person-years | |||||
| Rate | 95% CI lower limit | 95% CI upper limit | Rate | 95% CI lower limit | 95% CI upper limit | |||||
| Patients without any progression | 1172 | 9011.48 | – | – | – | 2,568 | 20,287.52 | – | – | – |
| CC | 0 | – | – | – | – | 77 | 78.97 | 98 | 76.95 | 121.86 |
| DCC | 22 | 34.74 | 63 | 39.69 | 95.88 | 849 | 1130.45 | 75 | 70.14 | 80.33 |
| HCC | 24 | 53.22 | 45 | 28.89 | 67.09 | 25 | 22.97 | 109 | 70.42 | 160.64 |
| LT | <5 | – | – | – | – | <5 | – | – | – | – |
| ESLD progression (total distinct) | 48 | 89.21 | 54 | 39.67 | 71.34 | 922 | 1182.39 | 78 | 73.02 | 83.18 |
Due to data protection regulations sample sizes <5 cannot be reported.
CC: Compensated cirrhosis; CI: Confidence interval; DCC: Decompensated cirrhosis; ESLD: End-stage liver disease; HCC: Hepatocellular carcinoma; LT: Liver transplant.
| Time to progression | Patients with ESLD at baseline (n = 1188†) | Patients without ESLD at baseline (n = 3490†) | p-value of log-rank test | |||
|---|---|---|---|---|---|---|
| Summary statistics, n | % | Summary statistics, n | % | |||
| Patients at risk, n | n, % | 1188 | 100.00 | 3490 | 100.00 | |
| Patients without progression, n | n, % | 1140 | 95.96 | 2568 | 73.6 | |
| Patients with progression, n | n, % | 48 | 4.0 | 922 | 26.4 | |
| Average length of observation time until progression (in months) | Mean | 25.2 | 18.3 | 0.04 | ||
| SD | 23.1 | 19.5 | ||||
| Min | 3 | 3 | ||||
| Q1 | 3 | 3 | ||||
| Median | 15 | 9 | ||||
| Q3 | 45 | 30 | ||||
| Max | 72 | 72 | ||||
| Average length of observation time until progression or presence of any censoring event (whichever comes first) (in months) | Mean | 50.7 | 42.6 | 0.00 | ||
| SD | 21.3 | 24.6 | ||||
| Min | 3 | 3 | ||||
| Q1 | 36 | 21 | ||||
| Median | 57 | 45 | ||||
| Q3 | 72 | 69 | ||||
| Max | 72 | 72 | ||||
| For patients with progression: average length of observation time until next higher progression state or any censoring event (in months) | Mean | 21.9 | 31.8 | 0.28 | ||
| SD | 16.8 | 21.3 | ||||
| Min | 3 | 3 | ||||
| Q1 | 6 | 12 | ||||
| Median | 18 | 30 | ||||
| Q3 | 33 | 51 | ||||
| Max | 60 | 72 | ||||
†
Patients with regressions have been removed for this analysis.
ESLD: End-stage liver disease; Max: Maximum; Min: Minimum; Q1: 25th percentile; Q3: 75th percentile.
Cumulative incidence of mortality accounting for disease progression
In the cumulative risk analysis, where death was assessed among the highest respective ESLD stages in the follow-up, the cumulative incidence of death was low across all ESLD strata (n = 269 deaths among 3489 patients) (reported as proportions, 0–1 scale, where 0.06 represents a 6% cumulative probability) but demonstrated a clear severity gradient (Figure 2 & Supplementary Tables 6 & 7). Among patients progressing to DCC, the cumulative incidence of death rose steadily from 0.01 (95% CI: 0.006–0.012) at 4 quarters to 0.03 (0.021–0.032) at 12 quarters and 0.06 (0.059–0.069) at 24 quarters, representing the highest mortality burden across ESLD strata. In contrast, patients with CC as the most severe ESLD-state, had a near-zero cumulative incidence of death throughout the observation period (≤0.00 at 24 quarters), suggesting that disease progression to decompensation was the predominant reason for death in this group. Estimates for patients with progression to HCC remained below 0.01 at 24 quarters; however, these estimates should be interpreted with caution due to the small number of patients and events in this stratum (n = 18 deaths among 25 patients with progression to HCC). Gray’s test confirmed significant differences in the cumulative incidence of death across follow-up ESLD strata (p < 0.001).
Cost regression analyses (adjusted)
To account for skewed cost data, multivariable GLM analyses with a log link and gamma distribution were used to estimate all-cause and MASH/ESLD-related healthcare costs. Predicted annual costs increased substantially with disease severity, underscoring the financial burden of advancing ESLD.
Compared with nonprogressors, average PPPY costs were higher among patients with progression and rose with more severe ESLD states. Predicted costs were €6694 for CC (95% CI: €3884–11,538), €7224 for DCC (€5839–8938) and €12,948 for HCC (€6343–26,431). Liver transplantation generated the highest expenditures (€75,719; 95% CI: €2964–1,934,032), reflecting substantial variability in pre- and post-transplant care (Table 5). These associated cost estimates should be interpreted with caution given the small sample size and resulting wide CIs.
| Regression analysis of all-cause healthcare costs PPPY – MASH main cohort (2-years baseline) | |||||
|---|---|---|---|---|---|
| All-cause total costs | MASH main cohort, n = 4678 | ||||
| Pr > t | Predicted costs† | 95% CI lower limit | 95% CI upper limit | ||
| Disease state (reference: non-progressing) | CC (n = 77) | 0.02 | €6694* | €3884 | €11,538 |
| DCC (n = 847) | 0.00 | €7224* | €5839 | €8938 | |
| HCC (n = 44) | 0.00 | €12,948* | €6343 | €26,431 | |
| LT (<5) | 0.07 | €75,719 | €2964 | €1,934,032 | |
| Regression analysis of all-cause healthcare costs per patient per year – metabolic dysfunction-associated steatohepatitis patients with progression during follow-up (2-years baseline) | |||||
| All-cause total costs | MASH main cohort, n = 970 with progression | ||||
| Pr > t | Predicted costs† | 95% CI lower limit | 95% CI upper limit | ||
| Disease state (reference: CC) | DCC (n = 847) | 0.88 | €9853 | €7144 | €13,590 |
| HCC (n = 44) | 0.09 | €18,250 | €9088 | €36,647 | |
| LT (n <5) | 0.10 | €102,381 | €5911 | €1,773,215 | |
†
Assuming the average age of the patients, and reference values for gender and comorbidities. The intercept refers to the baseline value of the outcome (in this case, costs) when all predictors in the model are set to zero.
Pr > t = Probability t-statistic, represents the p-value associated with a t-test. Significant values are indicated by * (p < 0.05).
Due to data protection regulations sample sizes <5 cannot be reported.
CC: Compensated cirrhosis; DCC: Decompensated cirrhosis; ESLD: End-stage liver disease; HCC: Hepatocellular carcinoma; LT: Liver transplant; PPPY: Per patient per year.
Baseline comorbidities also increased costs: T2D by 44% (95% CI: 23–69%), CVD by 51% (26–80%) and obesity by 20% (3–39%). Age was positively associated with costs, while sex was not a significant predictor (Table 5).
Among patients who progressed to more severe ESLD (n = 970), predicted costs increased markedly relative to CC: DCC €9853 (95% CI: €7144–13,590) and HCC €18,250 (€9088–€36,647). Liver transplantation remained the most costly stage (€102,381; 95% CI: €5911–1,773,215). In this subgroup, T2D was the only comorbidity associated with significantly higher costs (52%; 95% CI: 12–105%), while CVD and obesity showed no significant effects. Age again predicted higher expenditures, and sex was not significant (Table 5).
Discussion
Overall, the findings of our study highlight the substantial disease burden related to MASH with a high risk for disease progression as well as the healthcare costs associated with MASH, driven not only by disease progression but also by the considerable comorbidity and comedication burden observed in these patients. Claims-based analyses in Germany provide robust real-world evidence to quantify healthcare utilization patterns and associated costs across care settings, supporting reliable estimates of burden in routine clinical practice.
Underdiagnosis
MASH is a major contributor to the global burden of chronic liver disease, with current prevalence estimates exceeding 5% among adults and significant implications for HCRU [2,8,21]. Despite this, our study revealed a markedly low prevalence of 0.15% in administrative claims data, indicating substantial underdiagnosis and under coding. The identified patients likely represent disproportionately clinically recognized or advanced disease, potentially leading to overestimation of progression rates and healthcare burden relative to the true MASH population.
The reliance on ICD-10-GM code K75.8 for MASH identification represents a key limitation, as this code encompasses other inflammatory liver diseases beyond MASH. Potential misclassification may have introduced both false positives (non-MASH conditions coded as K75.8) and differential case capture favoring clinically apparent disease. Future studies incorporating laboratory data or linked clinical registries could improve diagnostic accuracy. This discrepancy likely reflects the asymptomatic nature of early-stage disease, limited awareness and reliance on ICD-10-GM coding for case identification. Restricting inclusion to confirmed diagnoses may have further underestimated the true disease burden. In addition, physicians may omit the specific code for steatohepatitis (ICD-10-GM: K75.8) because of a lack of specific therapies at this time (i.e. no immediate consequence for pharmacotherapy) and because a definitive diagnosis strictly taken requires an invasive liver biopsy to prove active tissue inflammation.
However, these findings align with recent expert consensus in Germany, which estimated that approximately 75% of individuals with MASH remain undiagnosed [22]. The study period (2016–2023) preceded the availability of approved MASH-specific therapies in Germany, with management limited to lifestyle interventions and treatment of metabolic comorbidities [5]. The recent accelerated approval of resmetirom in the US (2024) and conditional approval in the EU (2025), as well as semaglutide for noncirrhotic MASH with advanced fibrosis in the US (2025) and in the EU (2026), represents a paradigm shift in treatment [23]. Broader adoption of these therapies may improve diagnostic coding and patient identification in administrative datasets.
Disease progression
Against this background of underdiagnosis and delayed clinical recognition, our analysis confirmed the progressive nature of MASH, with approximately 20% of patients advancing to ESLD or a higher ESLD stage than baseline during follow-up. Progression patterns varied by baseline ESLD status: patients without ESLD at baseline exhibited higher overall progression rates, while those with ESLD progressed more rapidly to severe stages such as DCC and HCC. These findings may reflect delayed detection among patients initially classified as non-ESLD, consistent with the nonspecific clinical presentation of early disease [24]. Accordingly, some observed progression among patients without recorded ESLD at baseline may represent delayed recognition or documentation of pre-existing advanced disease rather than true de novo progression. These progression rates should therefore be interpreted with caution, as some patients classified as non-ESLD may already have had at-risk MASH with relevant fibrosis or more advanced underlying disease.
The cumulative risk analysis showed that after accounting for highest progression in the follow-up, the cumulative incidence of death was low across all ESLD strata – highest among patients with DCC (6% [95% CI: 0.05–0.07] at 6 years) and near zero for CC. This suggests that the mortality risk concentrates among those with decompensation. These CIF-based estimates may provide more appropriate transition probability inputs for Markov models than standard KM-derived probabilities. However, low event rates underscore the need for larger datasets or longer follow-up to generate stable mortality estimates.
Time-to-progression analysis further demonstrated that initial progression occurred sooner in patients without baseline ESLD, whereas subsequent progression was accelerated in those with advanced disease at baseline. These data indicate that patients without recorded ESLD may nonetheless have shown features of at-risk MASH with relevant fibrosis. In the randomized controlled STELLAR-3 trial, about 16% of patients with stage F3 fibrosis progressed to cirrhosis within 1 year [25].
These findings also have implications for health economic modeling. Many published Markov models of MASH assume constant transition probabilities that do not vary with time spent in a given disease state, whereas our results suggest more dynamic progression patterns. This supports the use of time-dependent transitions or semi-Markov structures to better reflect real-world disease trajectories and improve long-term cost-effectiveness projections.
Overall, these comparisons suggest that transition inputs derived from published MASH models may not uniformly apply to real-world claims populations. While our cohort likely overrepresents clinically recognized and more advanced disease and ICD-10-GM coding does not capture fibrosis stages, the observed progression patterns and time-to-progression distributions provide useful empirical benchmarks for model calibration and validation. Future modeling studies should therefore consider CIF-based transition inputs in scenario or sensitivity analyses and explore approaches that better accommodate time-varying hazards.
Our observed progression rates should be interpreted in the context of existing evidence from clinical trials, observational studies and published modeling analyses. Placebo arms of recent large MASH randomized controlled trials have reported fibrosis progression rates of approximately 34% at 52 weeks in MAESTRO-NASH and 35.6% at 72 weeks in ESSENCE [26,27], indicating that a substantial proportion of patients with histologically confirmed MASH experience measurable worsening over relatively short time horizons. Our claims-based findings are broadly consistent with these trial observations in directional terms, though direct numerical comparisons are complicated by differences in population selection and ascertainment method. In contrast, paired-biopsy observational studies in unselected NAFLD/NASH populations have historically reported slower progression – approximately one fibrosis stage over 7 years in NAFLD and 14 months in NASH [28] – suggesting that the more rapid progression observed here and in trial placebo arms reflects the characteristics of clinically recognized cohorts. Patients reaching clinical identification, whether through trial eligibility or diagnostic coding in claims data, are disproportionately those presenting with more advanced or symptomatic disease, such that progression events are observed earlier in the follow-up window than would be expected in a population-representative sample inclusive of the large undiagnosed majority. These comparisons reinforce the complementary value of real-world claims data alongside trial and cohort evidence, while underscoring that ascertainment method, population severity and follow-up duration are critical determinants of observed progression rates across study designs.
Economic burden & comorbidities
Progression patterns translated directly into a substantial economic burden, with advancement to higher ESLD stages associated with marked increases in healthcare costs driven primarily by inpatient care. Patients undergoing liver transplantation incurred predicted annual costs exceeding €75,000, consistent with prior analyses of MASLD populations [29]. While cost estimates for HCC differed between studies, methodological variations and cohort composition likely explain these discrepancies. Importantly, comorbid conditions such as T2D, CVD and obesity significantly amplified costs, increasing predicted expenditures by up to 57%. These comorbidities not only complicate disease management but also contribute to resource intensity [12,13,30,31]. Higher healthcare costs highlight the importance of incorporating cost heterogeneity by comorbidity status into economic models. Standard models that apply uniform cost estimates – regardless of comorbidity profile – may underestimate the true economic burden in populations with high comorbidity prevalence. Furthermore, failing to account for comorbidity status may overlook the subset of individuals who are not considered candidates for LT, potentially compounding this underestimation. Of note, the recent change in the therapeutic landscape for HCC with the broad implementation of immune checkpoint inhibition as the first-line systemic treatment option will likely lead to significantly higher costs for HCC [32].
The cardiovascular dimension of this burden warrants equally explicit consideration. Overall, 16.4% of patients experienced at least one Expanded MACE event over follow-up, corresponding to an incidence rate of 2.35 per 100 person-years. For comparison, a recent observational study in histologically confirmed MASLD patients reported a 5-year cumulative cardiovascular event incidence of 5.3% over a median follow-up of 6.3 years [33]. The observed MI incidence of 0.44 per 100 person-years in our MASH cohort is approximately twice the age-standardized general population rate of 0.22 per 100 person-years reported in Germany in 2023 [34], highlighting the incremental cardiovascular burden attributable to MASH and its associated metabolic comorbidities. The markedly elevated rates among patients with ESLD – 3.73 per 100 person-years, representing a 140% increase relative to non-ESLD patients – demonstrate that cardiovascular risk in MASH is not static but escalates substantially with hepatic disease severity, consistent with evidence that MASLD constitutes a systemic metabolic disorder with disproportionate cardiovascular and extrahepatic complications [31]. This gradient likely reflects shared pathophysiological pathways including systemic inflammation, insulin resistance and endothelial dysfunction. These findings support the inclusion of MACE as a distinct health state in economic models of MASH, rather than subsuming cardiovascular events within generic mortality or comorbidity cost inputs.
These real-world assume particular relevance in the context of projections suggesting a growing economic burden at the population level. A recent Markov model estimated that direct medical expenses for MASH would more than double between 2021 and 2040, increasing from $34.97 billion to $78.59 billion in the US and from €0.83 billion to €1.82 billion in Germany [8]. Despite the well-recognized challenges of identifying MASH patients in administrative data – including reliance on non-specific ICD codes and the predominant capture of clinically apparent disease – our claims-based analysis contributes directly observed annual cost estimates from the SHI perspective. Unlike modeled frameworks, which must construct expenditures from reimbursement tariffs, estimated utilization profiles and assumed payer mixes [8], SHI claims data capture actual healthcare utilization and reimbursed costs across outpatient, inpatient and pharmaceutical sectors as incurred in routine clinical practice. The longitudinal structure of these data provides yearly per-patient cost trajectories that can serve as external benchmarks to validate or calibrate model-based projections, thereby strengthening the evidence base for the direct economic impact of MASH – and, importantly, for the subgroups in which that impact is greatest.
Limitations
This study has several limitations. MASH was ascertained using ICD-10-GM codes rather than guideline-based clinical criteria, which may result in misclassification and incomplete capture due to heterogeneity in coding practices. This limitation is particularly relevant when potentially nonspecific codes (e.g., K75.8) are used, as such codes may capture heterogeneous liver conditions and may not uniquely identify MASH, which could overestimate or underestimate the true MASH cohort. In addition, obesity is known to be under-recorded in administrative claims because diagnosis codes may be entered selectively (e.g., when obesity is the primary reason for an encounter or affects reimbursement). Consequently, the observed prevalence of obesity among patients with coded MASH is likely underestimated, and obesity-related subgroup definitions may not fully represent the underlying clinical population.
CC and early-stage disease are frequently asymptomatic and may be under-coded, which may contribute to higher observed rates of DCC than compensated stages and an imprecise representation of progression stages. Liver fibrosis, an important prognostic factor [12,24,35,36], could not be evaluated because fibrosis stages are not coded in ICD-10-GM.
Accordingly, the observed progression rates, mortality estimates, and healthcare costs reported in this study may not be fully generalizable to the broader MASH population, including patients with earlier-stage or subclinical disease who may not be captured in administrative data. Disease regression and stability rates were not systematically assessed in the current analysis, as the study design focused primarily on forward progression and did not aim to look at regression in the context of any intervention or pharmacotherapies, as we wanted to understand the burden of disease, particularly among those who progressed. These metrics represent a valuable area for future research
Some advanced ESLD stages (e.g., liver transplantation) had very small sample sizes (<5), resulting in wide CIs and limiting precision of cost estimates. In addition, attributing all follow-up costs to the first observed ESLD stage in adjusted analyses may understate costs for patients who later progressed.
Costs were not adjusted for inflation, which may marginally affect comparisons across calendar years within the study period.
Claims data also lack clinical detail (laboratory values, imaging, histology), limiting validation and severity assessment. As with all observational claims-based studies, residual confounding from unmeasured factors (e.g., lifestyle factors, disease severity, fibrosis stage and treatment adherence) cannot be excluded. Furthermore, coding practices may vary across healthcare providers, regions and over time, introducing heterogeneity in disease identification and outcome ascertainment. Future research should use larger datasets, improved coding and linkage to clinical data to better define MASH burden and trajectory.
Conclusion
This study highlights the outcomes and costs from MASH in Germany. Disease progression was associated with markedly higher healthcare costs, underscoring the substantial burden on the healthcare systems. These findings support the potential importance of early detection and proactive management, and highlight the need for emerging targeted therapies in MASH. Future research should focus on improving risk stratification, enhancing coding practices – particularly for fibrosis in steatotic liver disease – and optimizing resource allocation for MASH care.
Summary points
•
Metabolic dysfunction-associated steatohepatitis is both common and underdiagnosed in Germany, despite being associated with metabolic risk factors and serious liver- and heart-related complications. This gap between expected and observed prevalence suggests many patients remain unidentified in routine care.
•
Disease progression is frequent and rapid, with more than one in four patients presenting with end-stage liver disease and those affected experiencing markedly higher cardiovascular risks, reinforcing the need for earlier detection and risk-stratified management.
•
Healthcare costs are higher with disease severity, driven largely by inpatient care and substantially amplified by common comorbidities such as Type 2 diabetes and cardiovascular disease – highlighting significant economic benefits of slowing or preventing progression.
Acknowledgments
The data analysis was performed in collaboration with Prof. Dr. Wolfgang Greiner (Department of Health Economics and Health Care Management, Bielefeld School of Public Health, Bielefeld University, Universitätsstraße 25, 33,615, Bielefeld, Germany) and the “InGef – Institut für angewandte Gesundheitsforschung Berlin” (Otto-Ostrowski-Str. 5, 10249 Berlin, Germany).
Financial disclosure
This study was funded by Madrigal Pharmaceuticals. Employees of Madrigal Pharmaceuticals contributed to study design, participated in data analysis oversight and reviewed the manuscript. The academic authors had full access to all study data, led the data interpretation and made the final decision regarding manuscript content and submission. The sponsor did not have the right to veto publication. PharmaLex GmbH (part of Cencora) received consulting fees related to the conduct of this study. F Tacke is supported by the German Research Foundation (DFG CRC/TR 412, Project-ID 535081457; SFB1382, Project-ID 403224013) and Germany’s Excellence Strategy (EXC 3118/1, Project-ID 533770413) (PA, USA). No study-specific funding was provided.
Competing interests disclosure
F Tacke’s lab has received research grants (funding to the institution) from AstraZeneca, MSD, Gilead, Agomab. F Tacke has received honoraria for consulting or lectures from Gilead, Abbvie, Falk, AstraZeneca, Boehringer, Madrigal, MSD, GSK, Ipsen, Pfizer, Novartis, Novo Nordisk, Sanofi. Y Kim, MJ Daumont and J O'Donnell are employees of Madrigal Pharmaceuticals Inc. and own stock. JS Haas and C Maas are employees of PharmaLex GmbH, part of Cencora. PharmaLex GmbH received consulting fees for the execution of the study and for the manuscript preparation from Madrigal Pharmaceuticals Inc. JM Schattenberg receives consultancy fees from Akero, Alentis, Alexion, Altimmune, Astra Zeneca, 89Bio, Bionorica, Boehringer Ingelheim, Gilead Sciences, GSK, HistoIndex, Ipsen, Inventiva Pharma, Madrigal Pharmaceuticals, Kríya Therapeutics, Lilly, MSD Sharp & Dohme GmbH, Novartis, Novo Nordisk, Pfizer, Roche, Sanofi, Siemens Healthineers; speaker honorarium from AbbVie, Boehringer Ingelheim, Gilead Sciences, Ipsen Novo Nordisk, Madrigal Pharmaceuticals, Stockholder options: Hepta Bio. The authors have no other competing interests or relevant affiliations with any organization or entity with the subject matter or materials discussed in the manuscript apart from those disclosed.
Writing disclosure
No funded writing assistance was utilized in the production of this manuscript.
Ethical conduct of research
This retrospective study used anonymized administrative claims data from the InGef database. Under German law, research using anonymized claims data does not require ethics committee approval. No identifiable personal data were accessed. Patient consent was not required, as the analysis used anonymized claims data in accordance with German data protection regulations. Individual patients cannot be identified directly or indirectly.
Data availability statement
This study is based on anonymized statutory health insurance claims from the InGef research database (2016–2023). Due to German data protection regulations, these data cannot be made publicly available. Access to the InGef database requires a data-sharing agreement with the data holder. Researchers may contact the Institute for Applied Health Research Berlin (InGef) to request access under comparable conditions.
Open access
This work is licensed under the Attribution-NonCommercial-NoDerivatives 4.0 Unported License. To view a copy of this license, visit https://creativecommons.org/licenses/by-nc-nd/4.0/
Supplementary Material
File (supplementary materials.docx)
References
Papers of special note have been highlighted as: • of interest; •• of considerable interest
1.
Chan WK, Chuah KH, Rajaram RB et al. Metabolic dysfunction-associated steatotic liver disease (MASLD): a state-of-the-art review. J. Obes. Metab. Syndr. 32(3), 197–213 (2023).
2.
Tilg H, Petta S, Stefan N et al. Metabolic dysfunction-associated steatotic liver disease in adults: a review. JAMA 335(2), 163–174 (2026).
3.
Rinella ME, Lazarus JV, Ratziu V et al. A multisociety Delphi consensus statement on new fatty liver disease nomenclature. J. Hepatol. 79(6), 1542–1556 (2023).
• Establishes the updated metabolic dysfunction-associated steatotic liver disease/metabolic dysfunction-associated steatohepatitis (MASLD/MASH) terminology used throughout the manuscript and explains the rationale for the terminology shift.
4.
Cheemerla S, Balakrishnan M. Global epidemiology of chronic liver disease. Clin. Liver Dis. (Hoboken) 17(5), 365–370 (2021).
5.
Tacke F, Horn P, Wai-Sun Wong V et al. EASL–EASD–EASO clinical practice guidelines on the management of metabolic dysfunction-associated steatotic liver disease (MASLD). J. Hepatol. 81, 492–542 (2024).
•• This is a cornerstone clinical guideline that provides the contemporary framework for MASLD/MASH diagnosis and management and anchors the manuscript in current European standards of care.
6.
Gancheva S, Roden M, Castera L. Diabetes as a risk factor for MASH progression. Diabetes Res. Clin. Pract. 217, 111846 (2024).
7.
Younossi ZM, Henry L. Understanding the burden of nonalcoholic fatty liver disease: time for action. Diabetes Spectr. 37(1), 9–19 (2024).
8.
Younossi ZM, Paik JM, Lazarus JV et al. Projected global clinical, humanistic, and economic impact of metabolic dysfunction-associated steatohepatitis (MASH): the cost of inaction based on data from nine countries. Clin. Gastroenterol. Hepatol. 24(4), 1016–1034 (2025).
•• This is highly relevant because it provides the multinational economic modeling context to which the present German real-world cost estimates can be compared.
9.
Huber Y, Hofmann L, Prochaska JH et al. Incidence of major cardiovascular events in patients with metabolic dysfunction-associated steatotic liver disease in the general population. Eur. J. Heart Fail. 27, 2490–2500 (2025).
• Provides contemporary evidence on cardiovascular risk in steatotic liver disease, complementing the manuscript’s findings on Expanded MACE.
10.
Estes C, Anstee QM, Arias-Loste MT et al. Modeling NAFLD disease burden in China, France, Germany, Italy, Japan, Spain, United Kingdom, and United States for the period 2016–2030. J. Hepatol. 69(4), 896–904 (2018).
11.
Powell EE, Wong VW, Rinella M. Non-alcoholic fatty liver disease. Lancet 397(10290), 2212–2224 (2021).
12.
Roeb E, Canbay A, Bantel H et al. Aktualisierte S2k-Leitlinie nicht-alkoholische Fettlebererkrankung der Deutschen Gesellschaft für Gastroenterologie, Verdauungs- und Stoffwechselkrankheiten (DGVS) – April 2022 – AWMF-Registernummer: 021–025. Z. Gastroenterol. 60(9), 1346–1421 (2022).
13.
Schattenberg JM, Lazarus JV, Newsome PN et al. Disease burden and economic impact of diagnosed non-alcoholic steatohepatitis in five European countries in 2018: a cost-of-illness analysis. Liver Int. 41(6), 1227–1242 (2021).
•• Offers directly comparable European burden estimates and supports the interpretation of the healthcare cost findings reported here.
14.
Bundesinstitut für Arzneimittel und Medizinprodukte. Internationale statistische Klassifikation der Krankheiten und verwandter Gesundheitsprobleme, 10. Revision, German Modification, Version 2025. (2024). (Access date: 16 June 2026). https://klassifikationen.bfarm.de/icd-10-gm/kode-suche/htmlgm2025/index.htm
15.
Stahmeyer JT, Hemmerling M, Burger B et al. Frequency of diagnosed non-alcoholic fatty liver disease (NAFLD) in the German population - an analysis based on health insurance data. Z. Gastroenterol. 59(8), 851–858 (2021).
16.
GKV Spitzenverband. Die gesetzlichen Krankenkassen Veränderungen bei der Anzahl der Krankenkassen (Angaben am Stichtag 1.1.). (2024). (Access date: 6 June 2024). https://www.gkv-spitzenverband.de/krankenversicherung/kv_grundprinzipien/alle_gesetzlichen_krankenkassen/alle_gesetzlichen_krankenkassen.jsp
17.
Statistisches Bundesamt (DESTATIS). Bevölkerungsstand: Bevölkerung nach Nationalität und Geschlecht (Quartalszahlen). (2024). (Access date: 6 June 2024). https://www.destatis.de/DE/Themen/Gesellschaft-Umwelt/Bevoelkerung/Bevoelkerungsstand/Tabellen/liste-zensus-geschlecht-staatsangehoerigkeit.html
18.
Bundesministerium für Gesundheit. Kennzahlen der Gesetzlichen Krankenversicherung 2011 bis 2024: Kennzahlen und Faustformeln. (2024). (Access date: 20 September 2024). https://www.bundesgesundheitsministerium.de/fileadmin/Dateien/3_Downloads/Statistiken/GKV/Kennzahlen_Daten/KF2024Bund_August_2024
19.
Kim Y, Ramezani T, Maas C et al. HSD38 Economic burden and healthcare resource utilization of metabolic dysfunction-associated steatohepatitis (MASH) in Germany: a claims data analysis. Value in Health 28(1 Suppl. 12), S380 (2025).
20.
Epping J, Stahmeyer JT, Tetzlaff F et al. M2Q or something else? The impact of varying case selection criteria on the prevalence estimation of chronic diseases based on outpatient diagnoses in German claims data. Gesundheitswesen 86(Suppl. 3), S188–S195 (2024).
21.
Witkowski M, Moreno SI, Fernandes J et al. The economic burden of non-alcoholic steatohepatitis: a systematic review. Pharmacoeconomics 40(8), 751–776 (2022).
22.
Kim Y, Rydqvist P, Ramezani T et al. Metabolic dysfunction-associated steatohepatitis diagnosis and management in Germany: insights from an expert consensus panel. Liver Int. 45(8), e70225 (2025).
•• This is especially important for this manuscript because it provides Germany-specific expert context on underdiagnosis and management gaps, directly supporting interpretation of the very low coded prevalence observed in claims data.
23.
US Food & Drug Administration. FDA approves treatment for serious liver disease known as ‘MASH’. (2025). (Access date: 13 November 2025). https://www.fda.gov/drugs/news-events-human-drugs/fda-approves-treatment-serious-liver-disease-known-mash
24.
Luthra R, Sheth A. Understanding MASH: an examination of progression and clinical outcomes by disease severity in the TARGET-NASH Database. Adv. Ther. 42(2), 1165–1195 (2025).
25.
Harrison SA, Wong VW, Okanoue T et al. Selonsertib for patients with bridging fibrosis or compensated cirrhosis due to NASH: results from randomized Phase III STELLAR trials. J. Hepatol. 73(1), 26–39 (2020).
26.
Harrison SA, Bedossa P, Guy CD et al. A Phase III, randomized, controlled trial of resmetirom in NASH with liver fibrosis. N. Engl. J. Med. 390(6), 497–509 (2024).
27.
Sanyal AJ, Newsome PN, Kliers I et al. Phase III trial of semaglutide in metabolic dysfunction-associated steatohepatitis. N. Engl. J. Med. 392(21), 2089–2099 (2025).
28.
Singh S, Allen AM, Wang Z et al. Fibrosis progression in nonalcoholic fatty liver vs nonalcoholic steatohepatitis: a systematic review and meta-analysis of paired-biopsy studies. Clin. Gastroenterol. Hepatol. 13(4), 643–654; e649 (2015).
• Provides an important benchmark for fibrosis progression from biopsy-based cohorts, helping contextualize progression rates observed in administrative claims data.
29.
Canbay A, Kachru N, Haas JS et al. Healthcare resource utilization and costs among nonalcoholic fatty liver disease patients in Germany. Ann. Transl. Med. 9(8), 615 (2021).
• Provides prior Germany-specific real-world cost data in a related population, making it useful for interpreting the economic burden estimates in the current analysis.
30.
Stefan N, Cusi K. A global view of the interplay between non-alcoholic fatty liver disease and diabetes. Lancet Diabetes Endocrinol. 10(4), 284–296 (2022).
31.
Targher G, Byrne CD, Tilg H. MASLD: a systemic metabolic disorder with cardiovascular and malignant complications. Gut 73(4), 691–702 (2024).
32.
Chan SL, Lamarca A, Hsu C et al. New targets and new drugs for hepatobiliary cancers. J. Hepatol. 84(1), 213–228 (2026).
33.
Pekarska K, Rowe I, Parker R. Incidence of cardiovascular events and extrahepatic malignancies in steatotic liver disease subgroups. Dig. Dis. Sci. doi: (2026) (Epub ahead of print).
34.
Statistisches Bundesamt. Diagnosedaten der Krankenhäuser (Eckdaten der vollstationären Patienten und Patientinnen) 2000–2023. (2026). (Access date: 11 June 2026). https://www.gbe-bund.de:443/gbe/isgbe.archiv?p_indnr=550&p_archiv_id=10081766&p_sprache=D&p_action=A
35.
Sheka AC, Adeyi O, Thompson J et al. Nonalcoholic steatohepatitis: a review. JAMA 323(12), 1175–1183 (2020).
36.
Sanyal AJ, Husain M, Diab C et al. Cardiovascular disease in patients with metabolic dysfunction-associated steatohepatitis compared with metabolic dysfunction-associated steatotic liver disease and other liver diseases: a systematic review. Am. Heart J. Plus 41, 100386 (2024).
Information & Authors
Information
Published In
Copyright
© 2026 Madrigal Pharmaceuticals, Inc. This work is licensed under the Attribution-NonCommercial-NoDerivatives 4.0 Unported License
History
Received: 21 April 2026
Accepted: 10 July 2026
Published online: 22 July 2026
Keywords:
Topics
Authors
Metrics & Citations
Metrics
Article Usage
Article usage data only available from February 2023. Historical article usage data, showing the number of article downloads, is available upon request.
Citations
How to Cite
Understanding the economic and healthcare burden of metabolic dysfunction-associated steatohepatitis: a real-world claims data analysis from Germany. (2026) Journal of Comparative Effectiveness Research. DOI: 10.57264/cer-2026-0092
Export citation
Select the citation format you wish to export for this article or chapter.