Cost of disease progression among US patients with human epidermal growth factor receptor 2-positive metastatic breast cancer
Publication: Journal of Comparative Effectiveness Research
Abstract
Aim: The objectives were to investigate the differences in per patient per month (PPPM) healthcare resource utilization (HCRU) and costs among commercially insured and Medicare Advantage patients with human epidermal growth factor receptor 2 positive (HER2+) metastatic breast cancer (mBC) who experience disease progression in 12 months compared with those who don't investigate the impact of progression timing on cumulative healthcare costs. Patients & methods: This claims-based study included patients diagnosed with mBC between 1 January 2013 and 30 April 2020 and received HER2-targeted therapy. Patients were categorized as progressed or nonprogressed. For objective one, monthly HCRU and costs were assessed for up to two lines of therapy (LOTs). Data were summarized descriptively and compared using a generalized linear model (GLM). For objective two, patients with at least 6 months of follow-up were assessed and cumulative healthcare costs were estimated in the 3 years following the start of LOT1 or LOT2 using a GLM and Kaplan–Meier weighting. Results: Among the 4113 patients in the study sample, 3406 had at least 12 months of follow-up (or less if due to death). Compared with nonprogressed patients, progressed patients had higher mean PPPM healthcare costs (LOT1: $22,014 vs $18,372, p < 0.001; LOT2: $19,643 vs $16,863, p = 0.001), and HCRU, including number of emergency room visits and inpatient stays (both p < 0.001) in the 12 months following LOT start. Progressed patients had higher 3-year mean cumulative healthcare costs than nonprogressed patients following LOT1 and LOT2 and this difference was greater for patients who progressed earlier. Conclusion: Disease progression was associated with significant increases in HCRU and costs. Delays in progression were associated with lower cumulative healthcare costs. Earlier use of more clinically effective treatments to delay progression may reduce the economic burden among these patients.
Plain language summary
What is this article about?
Patients with breast cancer whose cancer cells have a high level of a protein called HER2 (known as HER2+ breast cancer) tend to have more aggressive disease. We performed this research to better understand how delaying the growth or spread of HER2+ metastatic breast cancer affects patients' healthcare resource utilization (HCRU) and costs. We used data from insurance claims to compare HCRU and costs between HER2+ metastatic breast cancer patients who did and did not progress within 12 months of starting therapy. We then investigated the impact of the timing of progression on healthcare costs. The groups were compared and analyzed using statistics and mathematical modeling.
What were the results?
In the 12 months following the start of treatment, HCRU and costs were higher for progressed patients compared with nonprogressed patients. Additionally, patients who progressed had higher total healthcare costs over the next 3 years than nonprogressed patients. The difference was bigger for patients who progressed earlier in treatment.
What do the results of the study mean?
Patients who progressed used more healthcare and had higher costs compared with those who did not. Treatments that delay disease progression could lead to less healthcare utilization and lower costs for these patients.
Breast cancer is the most commonly diagnosed cancer among women, with an estimated 297,790 new cases of invasive breast cancer and about 43,720 attributable deaths anticipated in the US in 2023 [1]. The cost burden of breast cancer in the US is substantial, and costs are higher for patients whose cancer is more advanced at diagnosis [2]. Total medical and productivity costs for metastatic breast cancer (mBC) have been projected to reach $152.4 billion in 2030 [3].
Approximately 15–30% of invasive breast cancers overexpress human epidermal growth factor receptor 2 (HER2), which is associated with more aggressive disease and a worse prognosis [4,5]. Before the introduction of HER2-targeted therapies, patients with HER2+ breast cancer survived for a median of only about 1 year after diagnosis [6]; however, treatment with HER2-targeted agents has been shown to improve overall survival (OS) in this population [5].
The first HER2-targeted therapy was the monoclonal antibody trastuzumab, which was approved for HER2+ unresectable mBC in 1998. The addition of other HER2-targeted therapies to the treatment arsenal, including pertuzumab and ado-trastuzumab emtansine (T-DM1), has since helped bring median OS for patients with HER2+ mBC to nearly 5 years [7]. T-DM1 became the National Comprehensive Cancer Network (NCCN)-preferred second-line treatment for HER2+ mBC during the study period in 2013 [8]. Trastuzumab deruxtecan (T-DXd) was initially approved in the US in December 2019 for patients with HER2+ mBC who received two or more prior anti-HER2-based regimens [9]. The DESTINY-Breast03 clinical trial compared the efficacy of T-DXd and trastuzumab emtansine in patients previously treated with trastuzumab and a taxane and found that median progression-free survival (PFS) was 28.8 months for the T-DXd group versus 6.8 months for the trastuzumab emtansine group. This study led to further approval of T-DXd for the treatment of patients previously treated with one anti-HER2 regimen [10,11].
Other HER2-targeted treatments approved in recent years include tucatinib and margetuximab. For previously treated patients with HER2+ mBC, including brain metastases, adding tucatinib to trastuzumab and capecitabine was shown to improve OS [12]. In the HER2CLIMB randomized trial, the median duration of PFS was 7.6 months for patients receiving tucatinib compared with 4.9 months for the control group [13]. Tucatinib was approved in the US in April 2020 and indicated for patients with HER2+ breast cancer, including brain metastases, who have received at least one anti-HER2 regimen. Margetuximab in combination with chemotherapy demonstrated PFS benefits in HER2+ mBC for patients who were treated with two or more prior treatments. The SOPHIA trial compared margetuximab plus chemotherapy versus trastuzumab plus chemotherapy and found that OS was 21.6 months with margetuximab versus 19.8 months with trastuzumab and those treated with margetuximab had a 29% relative risk reduction in PFS compared with the trastuzumab group [14]. In combination with chemotherapy, margetuximab is indicated for patients with HER2+ mBC who have received at least two anti-HER2 regimens, at least one of which was for metastatic disease.
Studies have highlighted the benefits of delayed disease progression in reducing clinical and economic burdens for patients with cancer and payers [15–17]. Reyes et al. examined progression in mBC patients and found that disease progression resulted in significantly higher PPPM healthcare costs [15]. However, with the advent of newer anti-HER2 treatments, there is a gap in understanding the cost of disease progression in patients with HER2+ mBC following multiple lines of therapy using more contemporary US data prior to widespread use of newer anti-HER2 treatments.
The objectives of this study are twofold. Objective one investigates differences in per patient per month (PPPM) healthcare resource utilization (HCRU) and costs (combined patient paid and health-plan paid) between patients who experience disease progression in 12 months compared with those who do not. Objective two assesses the impact of disease progression timing on cumulative healthcare costs among patients with HER2+ mBC.
Methods
Study design & data source
This was a retrospective observational cohort study conducted using data from the Optum Research Database (ORD), which includes administrative claims data from nearly 8% of US commercial health plan enrollees and 18% of Medicare Advantage enrollees. This database has been used widely in claims research [15,16]. The US healthcare system is a combination of publicly financed Medicare and Medicaid coverage as well as privately financed commercial coverage. Healthcare costs are paid by a combination of the health plan and patient out-of-pocket payments. Medical claims in the ORD include diagnosis and procedure codes from the ICD-9-CM and ICD-10-CM; Current Procedural Terminology or Healthcare Common Procedure Coding System codes; site of service codes; paid amounts; and other information. Pharmacy claims in the ORD include drug name, National Drug Code, dosage form, drug strength, fill date and financial information for health plan–provided outpatient pharmacy services. Because no identifiable protected health information was accessed in the conduct of this study, institutional review board approval or waiver of approval was not required.
Study population
The study population (Figure 1) included adult patients who had a diagnosis of mBC between 1 January 2013 and 30 April 2020 (identification period) and initiated HER2-targeted therapy any time on or after the metastatic date. The date of the first claim for a systemic cancer agent after the metastatic diagnosis date was the index date. Included patients were required to have at least 6 months of continuous enrollment pre-index (baseline period) and post-index, or less if due to death (follow-up period). Patients were excluded if they had evidence of metastasis prior to first breast cancer diagnosis, were less than 18 years old as of the index date, had missing demographic information, had evidence of other cancer during the baseline period (excluding non-melanoma skin cancers) or had evidence of pregnancy or clinical trial participation during the baseline or follow-up period. Patients were followed until the end of continuous enrollment, death or the end of the study period (31 October 2020), whichever came earliest.

Figure 1. Patient identification and attrition.
(A) Breast cancer: ICD-9-CM 174.*, 175.8; ICD-10-CM C50.*. (B) Metastasis: ICD-9-CM 196.*-199.0*; ICD-10-CM C77-C80.0. (C) Non-melanoma skin cancers excluded.
HER2+: Human epidermal growth factor receptor 2 positive.
Objective one focused on the subset of patients who had at least 12 months of follow-up (or less if due to death) after the start of their first or second line of therapy (LOT1 or LOT2), respectively. Patients with more than one LOT are included in all relevant analyses. For this subset, outcomes were measured in the 12 months after LOT start. Objective two focused on analyses that were conducted among the larger group of patients with at least 6 months of follow-up post index (or less if due to death), to assess the impact of timing of progression on cumulative costs with outcomes measured during a variable follow-up period of up to 36 months.
Study measures
Baseline patient characteristics were assessed during the 6-month baseline period. These included age, sex, US Census region, insurance type, Charlson comorbidity score, a measure that predicts 1-year mortality risk by weighting comorbid conditions [18] and comorbidities identified using Clinical Classifications Software from the Agency for Healthcare Research and Quality (AHRQ) [19].
For objective one, study outcomes (disease progression, monthly HCRU and monthly healthcare costs) were assessed for up to two LOTs and were captured in the 12 months following the start of LOT1 or LOT2. Analyses for objective two were also assessed for up to two LOTs and examined disease progression and cumulative healthcare costs during a variable follow-up period of up to 36 months. A LOT was defined as all agents received within 30 days of therapy start, continuing until the earliest of addition of or switch to a new HER2 agent or new class of systemic cancer agent (i.e., platinum-based alkylating agents, taxane mitotic inhibitors) or a treatment gap of ≥360 days. Hormone therapy could start the first LOT only if it was the only agent received within 30 days of therapy start. Additionally, hormone therapy, palbociclib, everolimus, abemaciclib or ribociclib could start subsequent LOTs only if received after a ≥360-day treatment gap.
Disease progression was defined as the start of a subsequent LOT or death of the patient. Patients with a progression event within 12 months were part of the progressed group while patients who did not have a progression event were part of the nonprogressed group. HCRU was calculated per patient per month (PPPM) for ambulatory visits (physician office and hospital outpatient visits), emergency department (ED) visits and inpatient admissions. Healthcare costs were calculated as combined patient-paid and health plan-paid amounts adjusted to 2020 US$ using the annual medical care component of the Consumer Price Index [20]. Costs were captured as total costs and subdivided into ambulatory costs (physician office and hospital outpatient costs), ED costs, inpatient costs, other medical costs and pharmacy costs.
Statistical analysis
In analyses for objective one, patients with at least 12 months of follow-up after the start of LOT1 or LOT2 were categorized into cohorts as progressed or nonprogressed based on evidence of disease progression within 12 months following the start of each LOT. Twelve-month HCRU and PPPM costs for this subset were summarized descriptively by progression status and compared using a generalized linear model adjusted for age, geographic region and baseline Charlson comorbidity score.
In analyses for objective two, among patients with at least 6 months of follow-up, cumulative healthcare costs were estimated in the 3 years following the start of LOT1 or LOT2 by analyzing monthly costs at the patient-month level using a generalized linear model with robust standard errors and Kaplan–Meier weighting to account for censoring due to differential follow-up. Covariates that fit the observed patterns of cost over time were added to the model, which was also adjusted for baseline patient characteristics. Predicted monthly costs generated by the model were summed to create predicted cumulative costs. All analyses were conducted using SAS software version 9.4.
Results
Study population
Of the 4113 patients who met the study eligibility criteria, 3406 had at least 12 months of follow-up (or less if due to death) (Figure 1). Clinical and demographic characteristics of these patients are shown in Table 1. Mean (SD) age was 60.1 (13.4) years; 99.3% of study patients were female; 58.5% had commercial insurance; and the geographic distribution was 46.4% South/other, 27.3% Midwest, 14.0% West and 12.2% Northeast. Mean (SD) Charlson comorbidity score was 6.4 (1.6). AHRQ comorbidities found among over a third of study patients included diseases of the heart (56.3%); hypertension (48.7%); lower respiratory disease (39.1%); disorders of lipid metabolism (38.3%); other nutritional, endocrine and metabolic disorders (34.2%); and non-traumatic joint disorders (31.2%). Differences between progressed and nonprogressed patients were observed in region with 43.2% of progressed patients residing in the southern US compared with 48.2% of nonprogressed patients and baseline Charlson comorbidity index score (6.6 progressed, 6.3 nonprogressed). Progressed and nonprogressed patients were similar in age (60.2 progressed, 60.0 nonprogressed).
| Characteristics | Total (n = 3406) | Progressed within 12 months† (n = 1161) | Nonprogressed within 12 months† (n = 2245) |
|---|---|---|---|
| Age, years, mean (SD) | 60.1 (13.4) | 60.2 (13.9) | 60 (13.1) |
| Female sex, n (%) | 3381 (99.3) | 1153 (99.3) | 2228 (99.2) |
| Insurance type, n (%) | |||
| Commercial | 1992 (58.5) | 660 (56.9) | 1332 (59.3) |
| Medicare | 1414 (41.5) | 501 (43.2) | 913 (40.7) |
| Region n (%) | |||
| South/other | 1583 (46.5) | 501 (43.2) | 1082 (48.2) |
| Midwest | 930 (27.3) | 331 (28.5) | 599 (26.7) |
| West | 478 (14.0) | 165 (14.2) | 313 (13.9) |
| Northeast | 415 (12.2) | 164 (14.1) | 251 (11.2) |
| Baseline Charlson comorbidity score, mean (SD) | 6.4 (1.6) | 6.6 (1.7) | 6.3 (1.6) |
| Baseline AHRQ comorbidities‡, n (%) | |||
| Diseases of the heart | 1918 (56.3) | 616 (53.1) | 1302 (58.0) |
| Hypertension | 1657 (48.7) | 575 (49.5) | 1082 (48.2) |
| Other lower respiratory disease | 1333 (39.1) | 498 (42.9) | 835 (37.2) |
| Disorders of lipid metabolism | 1303 (38.3) | 419 (36.1) | 884 (39.4) |
| Other nutritional; endocrine; and metabolic disorders | 1164 (34.2) | 393 (33.9) | 771 (34.3) |
| Non-traumatic joint disorders | 1061 (31.2) | 379 (32.6) | 682 (30.4) |
| Other connective tissue disease | 953 (28.0) | 354 (30.5) | 599 (26.7) |
| Diseases of the urinary system | 949 (27.9) | 337 (29.0) | 612 (27.3) |
| Other skin disorders | 880 (25.8) | 301 (25.9) | 579 (25.8) |
| Other nervous system disorders | 858 (25.2) | 320 (27.6) | 538 (24.0) |
†
Cohort assignments were based on evidence of disease progression within 12 months following the start of LOT1.
‡
Top 10 most common AHRQ comorbidities not including those related to metastatic breast cancer are shown.
AHRQ: Agency for Healthcare Research and Quality; SD: Standard deviation.
LOT characteristics
Of the 3406 patients who initiated LOT1, 34.1% (n = 1,161) progressed in the 12 months following LOT1 start. The most common LOT1 regimens were trastuzumab + pertuzumab (used by 45.6% of all patients, 32.4% of progressed patients and 52.4% of nonprogressed patients), trastuzumab (35.2% all, 20.5% progressed, 42.8% nonprogressed), chemotherapy ± hormonal therapy (10.8% all, 29.9% progressed, 0.9% nonprogressed) and hormonal monotherapy (4.1% all, 9.3% progressed, 1.4% nonprogressed) (Table 2). The remaining LOT1 therapies comprised more than five different regimens, each used by less than 5% of all patients.
| Regimen | Total | Progressed within 12 months† | nonprogressed within 12 months† |
|---|---|---|---|
| LOT1, n (%) | n = 3406 | n = 1161 | n = 2245 |
| Trastuzumab + pertuzumab‡ | 1552 (45.6) | 376 (32.4) | 1176 (52.4) |
| Trastuzumab‡ | 1198 (35.2) | 238 (20.5) | 960 (42.8) |
| Chemotherapy ± hormonal therapy§ | 367 (10.8) | 347 (29.9) | 20 (0.9) |
| Hormonal monotherapy | 140 (4.1) | 108 (9.3) | 32 (1.4) |
| T-DM1‡ | 83 (2.4) | 49 (4.2) | 34 (1.5) |
| Other anti-HER2 agents¶ | 35 (1.0) | 24 (2.1) | 11 (0.5) |
| Other regimens (IO, other targeted therapy#) | 31 (0.9) | 19 (1.6) | 12 (0.5) |
| LOT2, n (%) | n = 1119 | n = 473 | n = 646 |
|---|---|---|---|
| Trastuzumab‡ | 328 (29.3) | 99 (20.9) | 229 (35.5) |
| Trastuzumab + pertuzumab‡ | 317 (28.3) | 107 (22.6) | 210 (32.5) |
| T-DM1‡ | 173 (15.5) | 78 (16.5) | 95 (14.7) |
| Chemotherapy ± hormonal therapy§ | 157 (14.0) | 133 (28.1) | 24 (3.7) |
| Other anti-HER2 agents¶ | 56 (5.0) | 42 (8.9) | 14 (2.2) |
| Other regimens (IO, other targeted therapy#, hormonal therapy) | 88 (7.9) | 14 (3.0) | 74 (11.5) |
†
Cohort assignments were based on evidence of disease progression within 12 months following the start of LOT1 or LOT2.
‡
Without another anti-HER2 agent; with or without chemotherapy or hormonal therapy.
§
Without an anti-HER2 agent.
¶
Other anti-HER2 agents include Lapatanib, Pertuzumab, Trastuzumab + lapatinib and any other anti-HER2 agents not yet classified; with or without chemotherapy or hormonal therapy.
#
Other targeted therapy includes agents such as bevacizumab, osimertinib and neratinib.
IO: Immune-oncology; LOT: Line of therapy; T-DM1: Ado-trastuzumab emtansine.
A total of 1119 patients initiated LOT2. Of these, 42.3% (n = 473) progressed in the 12 months following LOT2 start. The most common LOT2 regimens were trastuzumab (used by 29.3% of all patients, 20.9% of progressed patients and 35.5% of nonprogressed patients), trastuzumab + pertuzumab (28.3% all, 22.6% progressed, 32.5% nonprogressed), T-DM1 (15.5% all, 16.5% progressed, 14.7% nonprogressed), and chemotherapy ± hormonal therapy (14.0% all, 28.1% progressed, 3.7% nonprogressed) (Table 2). The remaining LOT2 therapies comprised more than 5 different regimens, each used by less than 12% of all patients.
Twelve-month healthcare resource utilization
Among patients with at least 12 months of follow-up (or less if due to death), HCRU in the 12 months following the LOT start was generally higher for progressed versus nonprogressed patients (Table 3). The proportion of patients with emergency visits and inpatient stays was higher among progressed versus nonprogressed patients after LOT1 (emergency, 62.9 vs 51.3%; inpatient, 43.4 vs 28.7%) and LOT2 (emergency, 64.7 vs 45.7%; inpatient, 54.1 vs 21.5%) (all p < 0.001). Nearly all patients (97.0–100.0%) had ambulatory visits (including office and outpatient hospital visits) and pharmacy use within 12 months of each LOT start.
| Metric | Total | Progressed within 12 months† | Nonprogressed within 12 months† | p-value |
|---|---|---|---|---|
| LOT1 | n = 3406 | n = 1161 | n = 2245 | |
| Patients with utilization, n (%) | ||||
| Ambulatory | 3406 (100.0) | 1161 (100.0) | 2245 (100.0) | – |
| Office | 3367 (98.9) | 1137 (97.9) | 2230 (99.3) | <0.001 |
| Outpatient hospital | 3338 (98.0) | 1139 (98.1) | 2199 (98.0) | 0.761 |
| Emergency | 1882 (55.3) | 730 (62.9) | 1152 (51.3) | <0.001 |
| Inpatient | 1149 (33.7) | 504 (43.4) | 645 (28.7) | <0.001 |
| Pharmacy | 3326 (97.7) | 1134 (97.7) | 2192 (97.6) | 0.949 |
| PPPM counts, mean (SD) | ||||
| Ambulatory | 7.2 (3.2) | 7.7 (3.5) | 6.9 (3.0) | <0.001 |
| Office | 3.3 (2.3) | 3.5 (2.5) | 3.3 (2.2) | 0.003 |
| Outpatient hospital | 3.9 (3.0) | 4.3 (3.3) | 3.6 (2.9) | <0.001 |
| Emergency | 0.2 (0.4) | 0.3 (0.5) | 0.1 (0.3) | <0.001 |
| Inpatient | 0.1 (0.2) | 0.1 (0.2) | 0.0 (0.1) | <0.001 |
| Pharmacy | 3.3 (2.6) | 3.5 (2.8) | 3.1 (2.4) | <0.001 |
| LOT2 | n = 1119 | n = 473 | n = 646 | |
|---|---|---|---|---|
| Patients with utilization, n (%) | ||||
| Ambulatory | 1118 (99.9) | 472 (99.8) | 646 (100.0) | 0.242 |
| Office | 1096 (97.9) | 459 (97.0) | 637 (98.6) | 0.068 |
| Outpatient hospital | 1084 (96.9) | 457 (96.6) | 627 (97.1) | 0.675 |
| Emergency | 601 (53.7) | 306 (64.7) | 295 (45.7) | <0.001 |
| Inpatient | 395 (35.3) | 256 (54.1) | 139 (21.5) | <0.001 |
| Pharmacy | 1094 (97.8) | 459 (97.0) | 635 (98.3) | 0.160 |
| PPPM counts, mean (SD) | ||||
| Ambulatory | 6.7 (3.4) | 7.1 (3.7) | 6.3 (3.2) | <0.001 |
| Office | 3.0 (2.2) | 3.1 (2.2) | 3.0 (2.2) | 0.532 |
| Outpatient hospital | 3.7 (3.1) | 4.1 (3.4) | 3.4 (2.8) | <0.001 |
| Emergency | 0.2 (0.4) | 0.3 (0.5) | 0.1 (0.3) | <0.001 |
| Inpatient | 0.1 (0.2) | 0.2 (0.2) | 0.0 (0.1) | <0.001 |
| Pharmacy | 3.4 (2.9) | 3.9 (3.2) | 3.1 (2.6) | <0.001 |
†
Cohort assignments were based on evidence of disease progression within 12 months following the start of LOT1 or LOT2.
LOT: Line of therapy; PPPM: Per-patient per-month; SD: Standard deviation.
Mean PPPM counts of ambulatory visits, emergency visits, inpatient stays and pharmacy fills were higher among patients who progressed following LOT1 or LOT2 compared with patients who did not progress (all p < 0.001) (Table 3). After LOT1, mean (SD) PPPM utilization was higher among progressed versus nonprogressed patients for office visits (3.5 [2.5] vs 3.3 [2.2], p = 0.003), outpatient hospital visits (4.3 [3.3] vs 3.6 [2.9], p < 0.001) and pharmacy fills (3.5 [2.8] vs 3.1 [2.4], p < 0.001). After LOT2, outpatient hospital visits remained higher for progressed versus nonprogressed patients (4.1 [3.4] vs 3.4 [2.8], p < 0.001) and pharmacy fills (3.9 [3.2] vs 3.1 [2.6], p < 0.001), but office visits were not significantly different (3.1 [2.2] vs 3.0 [2.2], p = 0.532).
Twelve-month healthcare costs
Healthcare costs were higher for patients who progressed within 12 months following LOT1 or LOT2 compared with patients who did not progress (Figure 2).
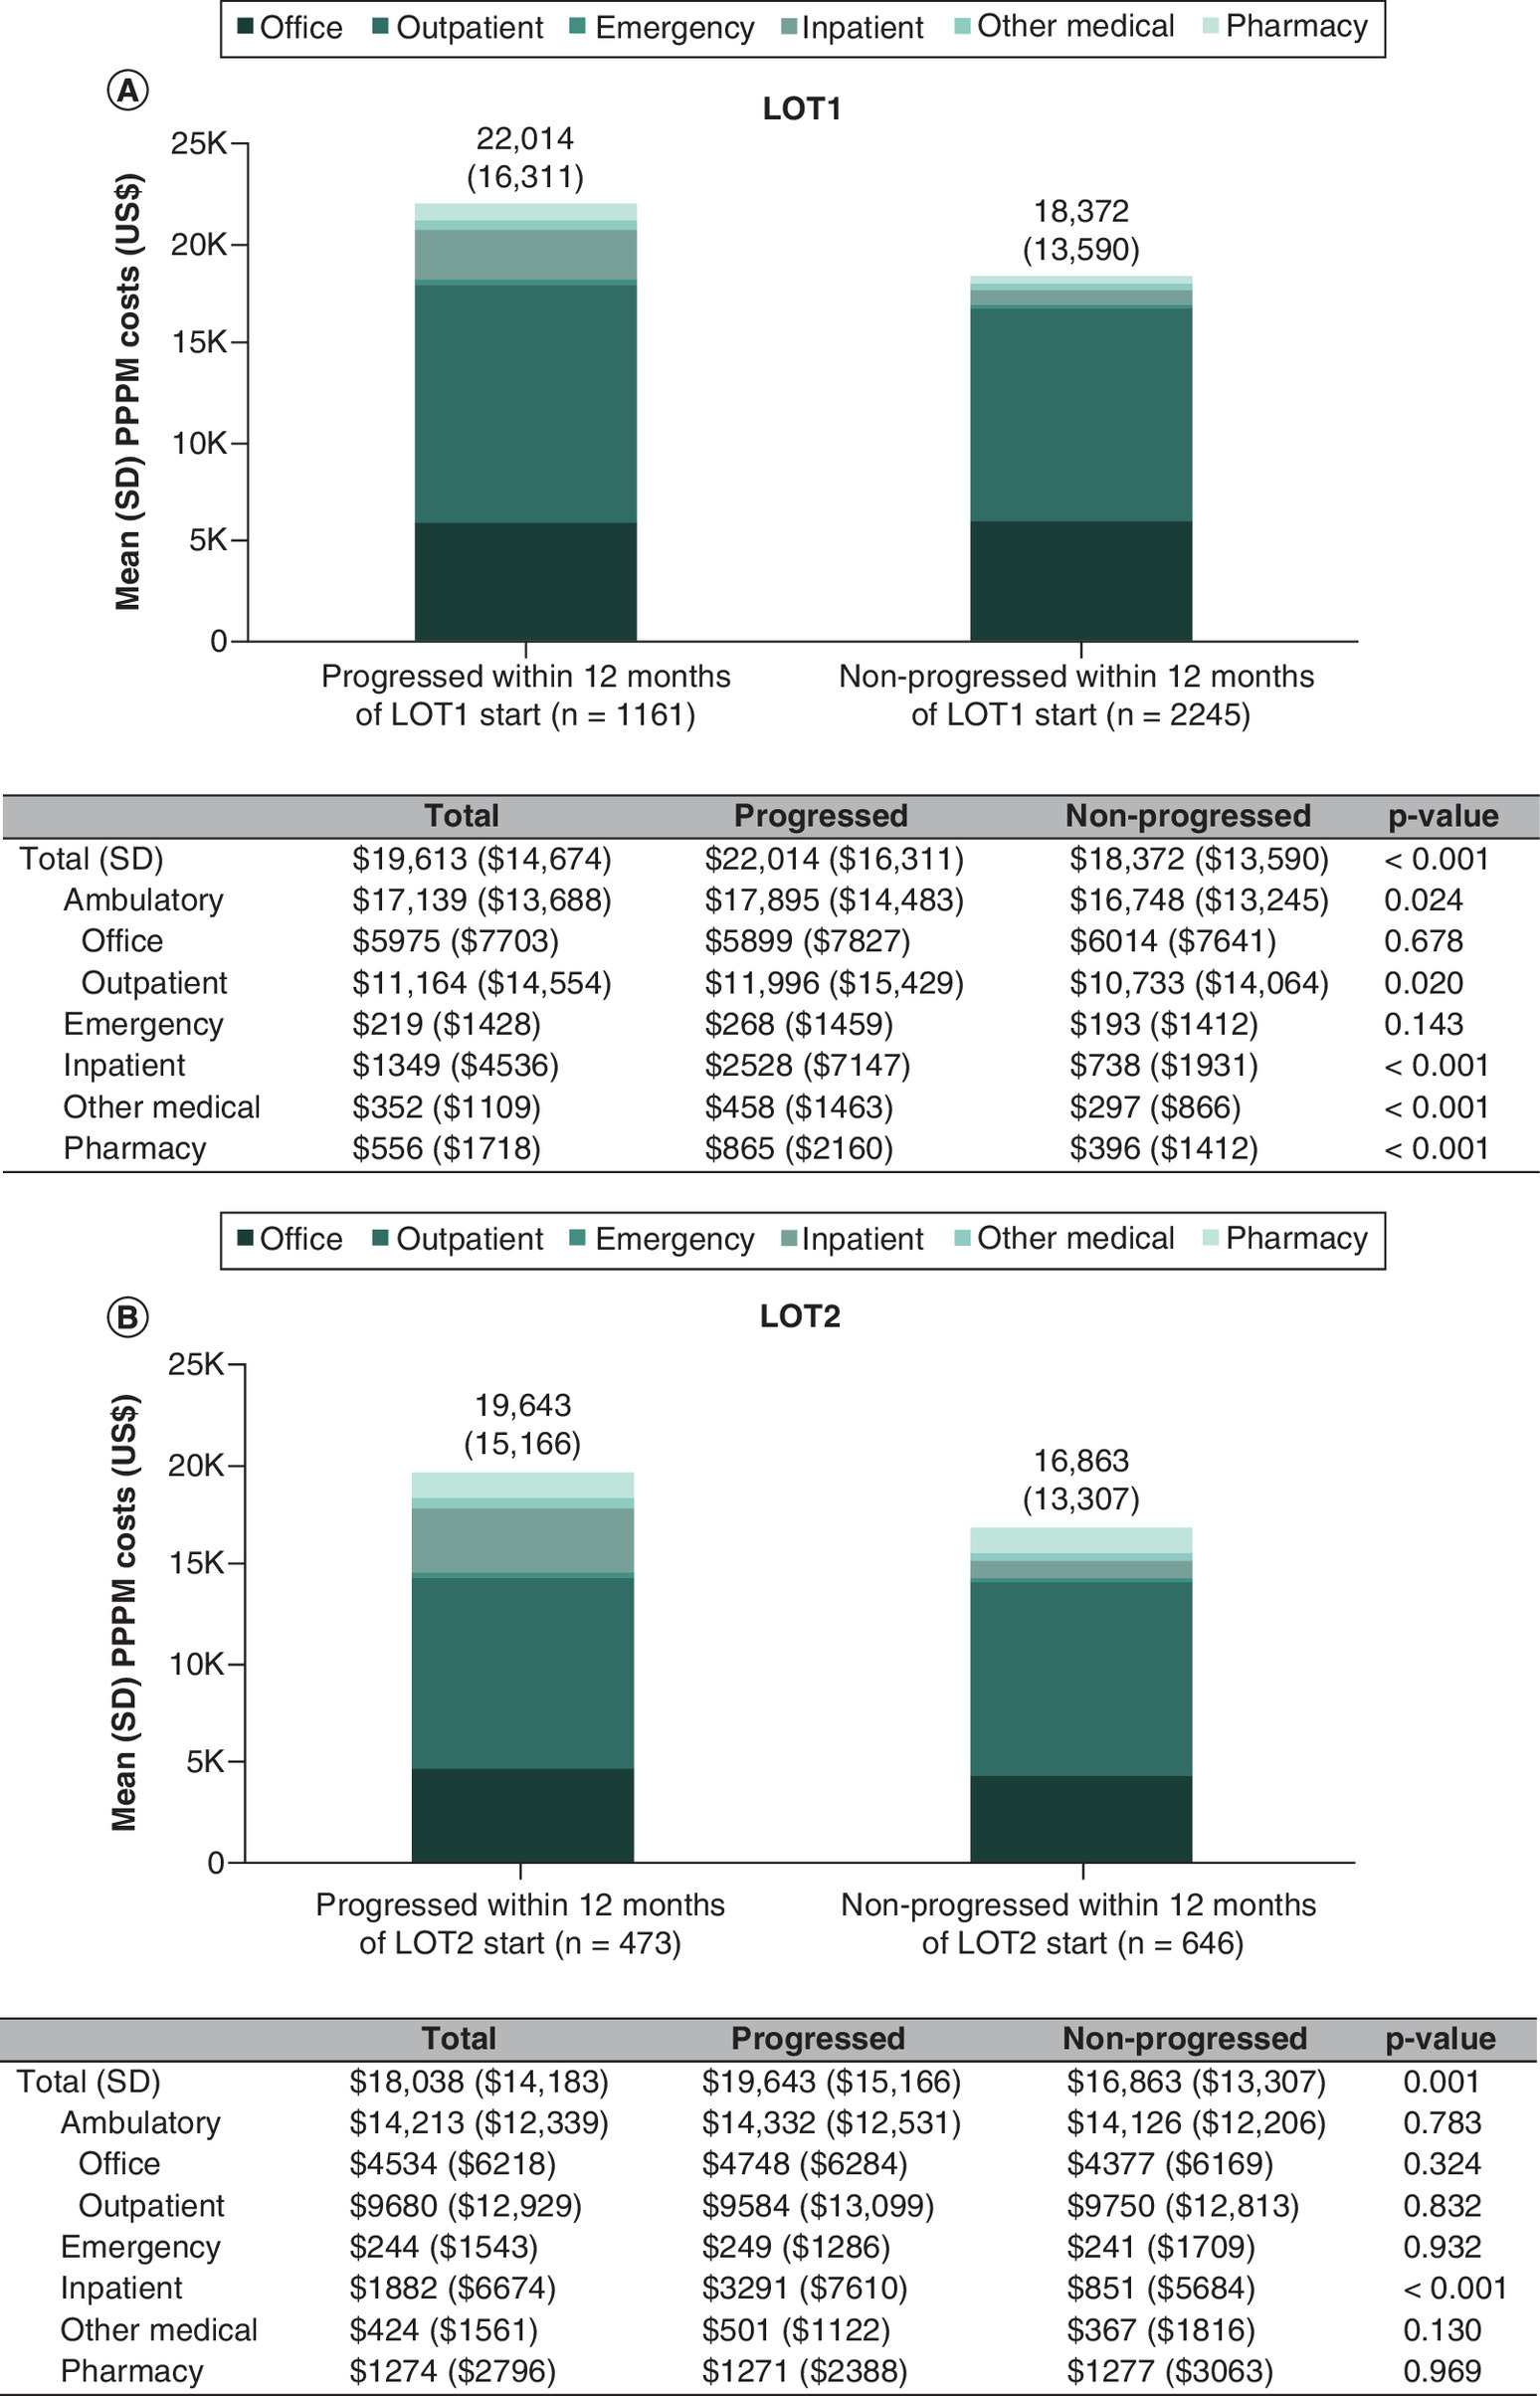
Figure 2. Twelve-month per-patient per-month all-cause healthcare costs.
(A) LOT1. (B) LOT2.
LOT: Line of therapy; PPPM: Per-patient per-month; SD: Standard deviation.
After LOT1, mean (SD) PPPM total costs were $19,613 ($14,674) for all patients and were $22,014 ($16,311) versus $18,372 ($13,590) (p < 0.001) for progressed versus nonprogressed patients, with ambulatory, inpatient, other medical, and pharmacy costs all significantly higher for patients who progressed (Figure 2A). The cost differential between progressed and nonprogressed patients following LOT1 was primarily attributable to inpatient costs ($2528 [$7147] vs $738 [$1931], p < 0.001) (Figure 2A). After LOT2, mean (SD) PPPM total costs were $18,038 ($14,183) for all patients and were $19,643 ($15,166) versus $16,863 ($13,307) (p = 0.001) for progressed versus nonprogressed patients (Figure 2B). Similar to LOT1, the cost differential following LOT2 was attributable primarily to inpatient costs, which were $3291 ($7610) for progressed patients versus $851 ($5684) for nonprogressed patients (p < 0.001); however, ambulatory, emergency, other medical and pharmacy costs were not significantly different between cohorts following LOT2 (Figure 2B).
Healthcare costs among patients with at least 12 months of follow-up (or less if due to death) were primarily driven by ambulatory visits (including office and outpatient hospital visits), which comprised 82–91% of total per patient per month (PPPM) costs in LOT1 and 73–84% of total costs in LOT2 for progressed and nonprogressed patients, respectively (Figure 2). Outpatient hospital visits contributed the highest proportion of PPPM costs following both LOTs, with mean (SD) costs of $11,164 ($14,554) total for all patients and $11,996 ($15,429) versus $10,733 ($14,064) for progressed versus nonprogressed patients after LOT1 (p = 0.020) and $9,680 ($12,929) total for all patients and $9584 ($13,099) versus $9750 ($12,813) for progressed versus nonprogressed patients after LOT2 (p = 0.832).
In unadjusted generalized linear models, the raw mean difference for the 12-month PPPM costs were $22,014 versus $18,372 following LOT1 and $19,643 versus $16,863 following LOT2 for progressed versus no-progressed patients, respectively (both p < 0.001). After adjustment for age, geographic region and Charlson comorbidity score, predicted 12-month costs remained higher for progressed versus nonprogressed patients following LOT1 ($21,921 vs $18,415, p < 0.001) and LOT2 ($20,132 vs $16,488, p < 0.001) (Table 4).
| Unadjusted model | Adjusted model† | |||||
|---|---|---|---|---|---|---|
| Independent variables | Cost ratio (95% CI) | p-value | Predicted value | Cost ratio (95% CI) | p-value | Predicted value |
| LOT 1 | ||||||
| Progression status | ||||||
| Progressed | 1.20 (1.14–1.26) | <0.001 | $22,014 | 1.19 (1.14–1.25) | <0.001 | $21,921 |
| Nonprogressed | Reference | – | $18,372 | Reference | – | $18,415 |
| LOT 2 | ||||||
| Progression status | ||||||
| Progressed | 1.17 (1.06–1.28) | 0.001 | $19,643 | 1.22 (1.13–1.32) | <0.001 | $20,132 |
| Nonprogressed | Reference | – | $16,863 | Reference | – | $16,488 |
†
Adjusted for age, region and Charlson comorbidity score.
CI: Confidence interval; LOT: Line of therapy; PPPM: Per patient per month.
Three-year cumulative healthcare costs
Overall, progressed patients had higher 3-year mean cumulative healthcare costs than nonprogressed patients following LOT1 and LOT2 (Figures 3 & 4). The difference in 3-year cumulative costs for progressed versus nonprogressed patients was greater for patients who progressed earlier after treatment start; for example, costs for progressed versus nonprogressed patients were 68% higher if progressed in month 6 after LOT1 start ($444,963 vs $265,559) (Figure 3A) and 17% higher if progressed in month 24 after LOT1 start ($311,328 vs $265,559) (Figure 3D). Similarly, costs for progressed versus nonprogressed patients were 61% higher if progressed in month 6 after LOT2 start ($454,294 vs $281,373) (Figure 4A) and 18% higher if progressed in month 24 after LOT2 start ($332,190 vs $281,373) (Figure 4D).

Figure 3. Three-year cumulative costs by timing of disease progression following LOT1 start.
(A) Progressed in months 1–6. (B) Progressed in months 7–12. (C) Progressed in months 13–18. (D) Progressed in months 19–24.
LOT: Line of therapy.
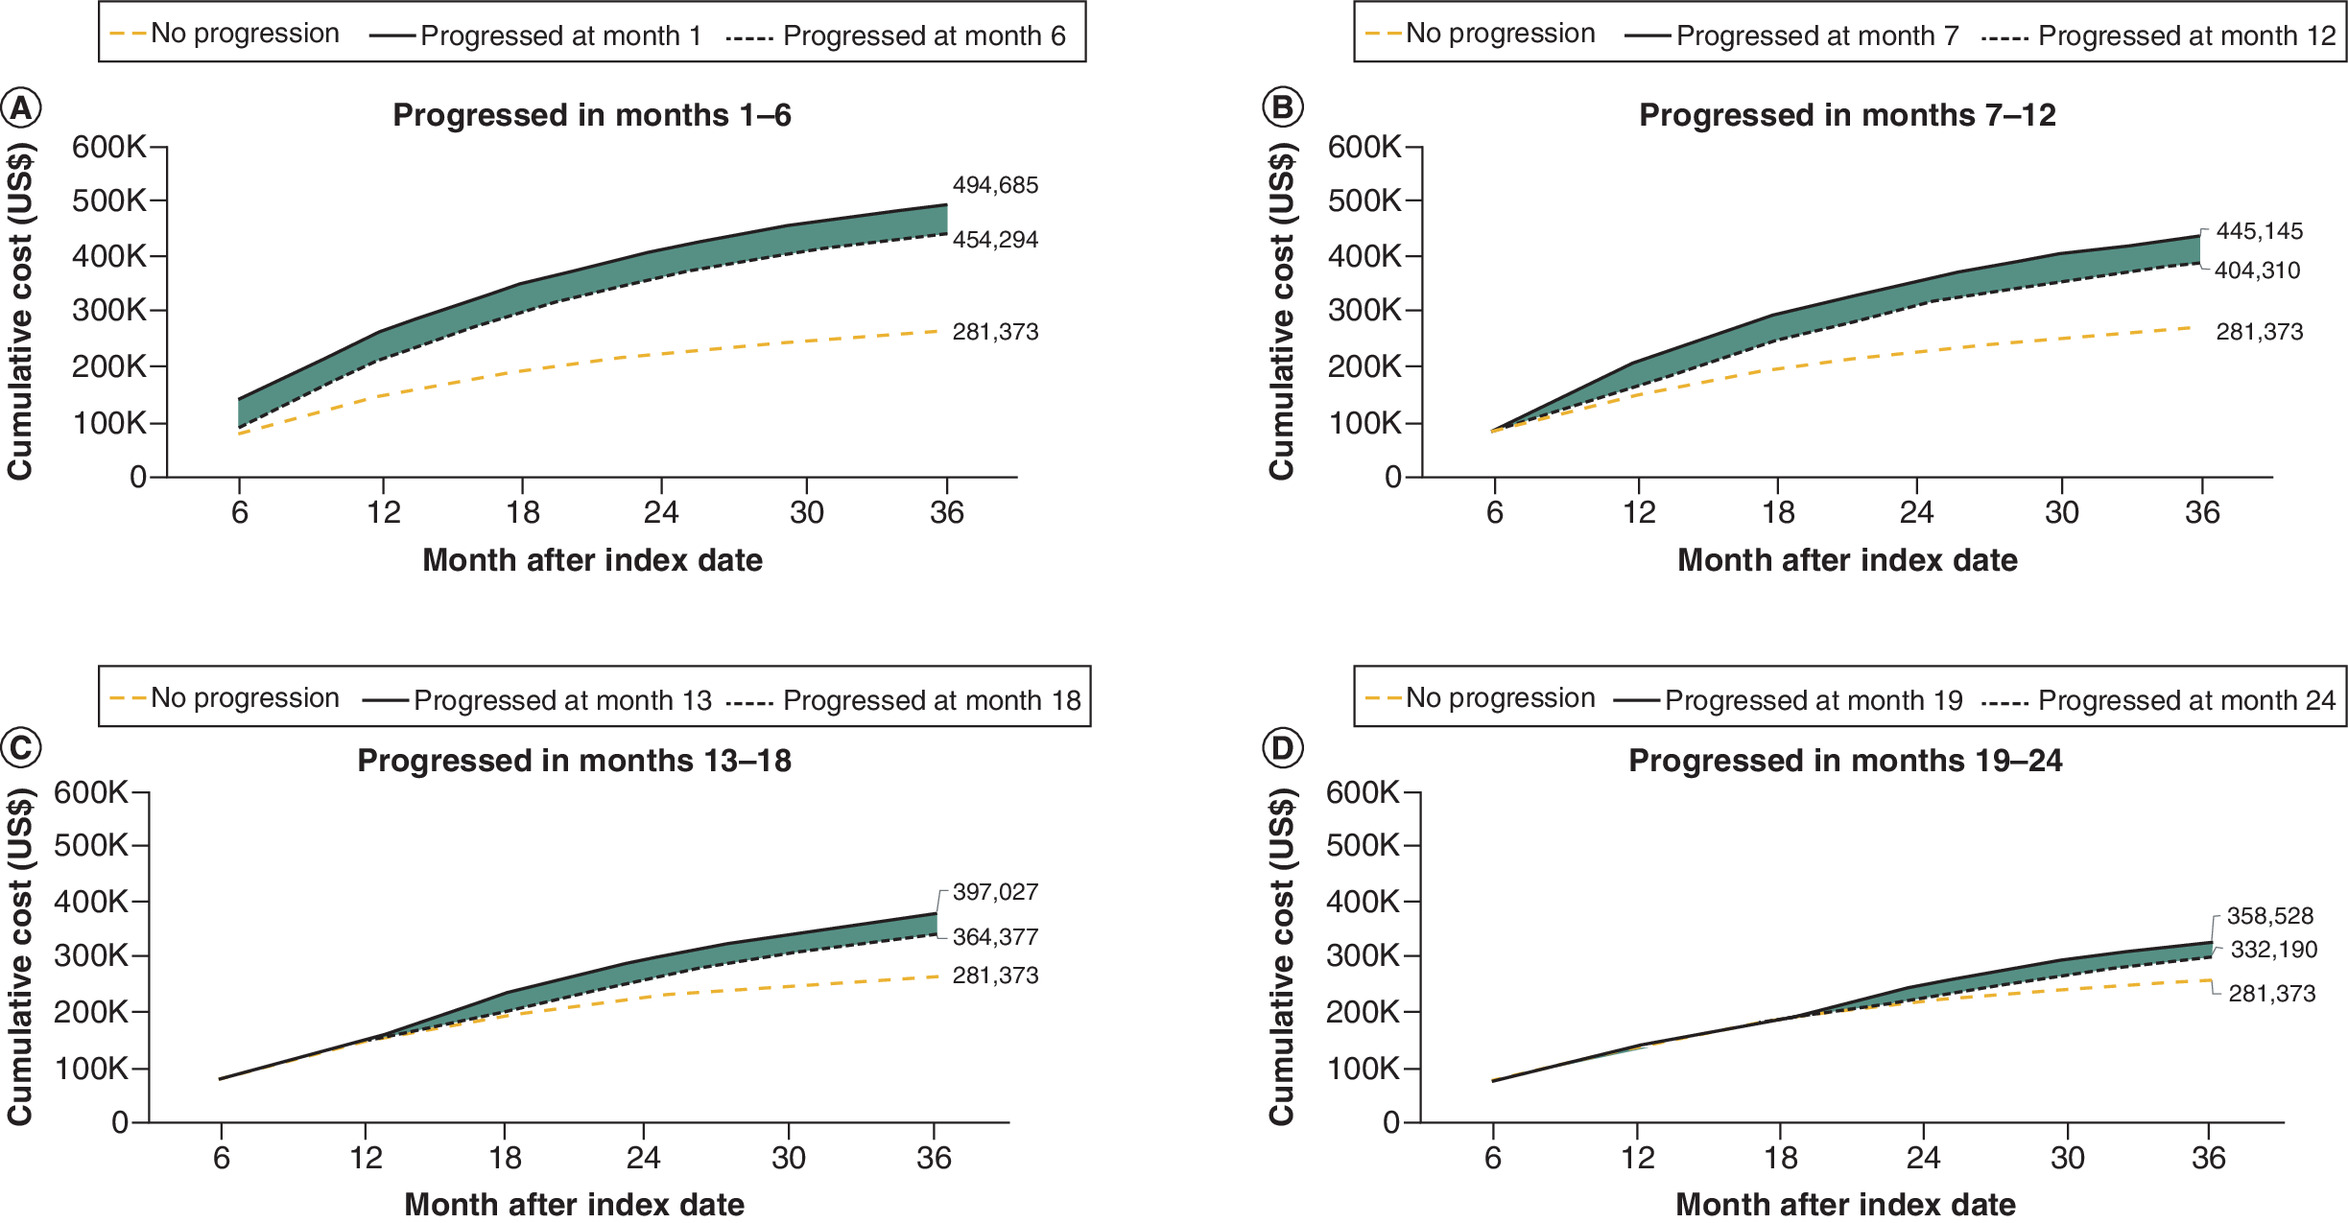
Figure 4. Three-year cumulative costs by timing of disease progression following LOT2 start.
(A) Progressed in months 1–6. (B) Progressed in months 7–12. (C) Progressed in months 13–18. (D) Progressed in months 19–24.
LOT: Line of therapy.
Discussion
To our knowledge, the present study is the first to quantify HCRU and costs associated with disease progression among patients with HER2+ mBC following multiple lines of therapy during a period of time when newer anti-HER2-targeted treatments were not widely used. Overall, more than one in three patients (34.1%) progressed within the 12 months following the start of LOT1 or LOT2. Results demonstrate that for patients with at least 12 months of follow-up (or less if due to death), HCRU and costs were generally higher for progressed versus nonprogressed patients. We also observed that timing of disease progression (earlier vs delayed) had an impact on cumulative costs. These findings highlight the substantial cost burden associated with disease progression among this patient population.
Overall healthcare costs in our study for both progressed and nonprogressed patients were driven mostly by ambulatory visits; particularly outpatient hospital visits, which contributed more than half of total costs following both LOT1 and LOT2. This finding is consistent with other published US-based studies that reported, for breast cancer, costs of ambulatory visits made up the largest proportion of the total costs of care [15,21]. This observation could be because regardless of progression status, patients with mBC have to receive ongoing care and monitoring and treatments are not completed after a set course of cycles of therapy. We also found that the PPPM cost differential for progressed versus nonprogressed patients was primarily attributable to inpatient costs which were $2528 versus $738 following LOT1 and $3291 versus $851 following LOT2. Relatedly, the PPPM costs for emergency department visits were $268 versus $193 for progressed versus nonprogressed patients following LOT1 and $249 versus $244 following LOT2. These findings align with prior US-based research, which found that patients who experience disease progression oftentimes need more frequent visits with more intensive care in hospitals [22]. It is also the case that patients with cancer in the last six months of life have increasing inpatient costs driven by acute care needs and hospice care [23]. These findings suggest that progressed patients require more costly and higher intensity care in inpatient settings, suggesting that more treatment options are needed to control disease progression and to decrease the burden of hospitalization.
Study results also showed the short-term and long-term economic burden associated with disease progression. Compared with nonprogressed patients, progressed patients had higher 3-year mean cumulative healthcare costs. We also found that timing of disease progression had substantial impact on healthcare burden. Among patients who had disease progression, patients who progressed later in the course of disease had lower cumulative healthcare costs than those who progressed earlier. We observed similar findings in both LOT1 and LOT2 treatments. These findings highlight the need for more effective treatment early in the course of disease to reduce healthcare burden over time [10,11,24,25]. The use of newer targeted therapies approved since the study period could contribute to addressing this gap.
Results from this study are comparable to those of a similar analysis conducted by Reyes et al. (2019) among US patients with mBC of any subtype [15]. As in the present study, Reyes found that disease progression resulted in significantly higher PPPM healthcare costs than patients who did not progress ($13,361 vs $ 6547) over 12 months – the cost differential being driven primarily by inpatient costs. Reyes reports a majority of patients (56.8%) with mBC experienced disease progression in the 12-month period, compared with 34.1% in the current study of patients with HER2+ mBC. It is documented in the literature that patients with HER2+ mBC typically progress later than patients with other subtypes such as triple-negative breast cancer [26]. This difference could be a factor contributing to this discrepancy. Though the progression rate was different, in both Reyes and the present study it was shown that patients with mBC who progressed later in the course of disease also had substantially lower cumulative healthcare costs [15].
Study findings demonstrated that, among the examined study sample, the most common regimens in LOT1 were trastuzumab ± pertuzumab, used by more than 80% of patients overall. These results generally reflect the use of taxane-based chemotherapy plus pertuzumab and trastuzumab as the standard of care for the first line therapy in the treatment of HER2+ mBC [27]. However, trastuzumab ± pertuzumab continued to be the most prevalent regimen in LOT2, used by about 57% of patients. In contrast, only about 15% of patients in LOT2 used T-DM1, which became the NCCN-preferred second-line treatment for HER2+ mBC during the study period in 2013 [8] after clinical trials among patients previously treated with trastuzumab showed later disease progression with T-DM1 versus other available regimens [28,29]. These findings suggest that real-world practice does not necessarily follow recommended clinical guidelines and this could potentially have an impact on the increasing economic burden associated with shorter PFS as a result. Recently, NCCN guidelines were updated to recommend T-DXd second-line treatment for HER2+ mBC [30] on the strength of phase III results showing substantial survival benefit for previously treated patients who receive T-DXd versus T-DM1, reporting the longest median PFS for HER2+ breast cancer thus far in the second-line setting (28.8 months, vs 6.8 months for T-DM1) [10,11]. Pending the outcomes of ongoing clinical trials to assess the efficacy of T-DXd as first-line therapy [31,32], future studies should examine the real-world clinical and economic impact of using newer anti-HER2 agents earlier in the treatment pathway.
This work has several limitations. First, because administrative claims are submitted for reimbursement purposes and not for research, claims data lack clinical details such as disease severity, disease progression and biomarker results. We were therefore unable to adjust for characteristics such as ECOG score, number of metastasis sites, etc., which may have impacted the study results. While death data is well characterized in the ORD, it is possible that some death data was incomplete, resulting in misclassification. Second, the definition of disease progression was based on a claims algorithm that included treatment regimen changes or death, which may have resulted in some misclassification of patients. Patients may have changed medication for reasons other than progression, which would not have been captured in this study. Patients were selected from individuals with commercial or Medicare Advantage insurance; therefore, study results may not be generalizable to other groups, such as patients with Medicare Fee-for-Service or Medicaid insurance plans, or those who are uninsured. In this study, lifetime costs were not assessed so end-of-life care was not included for censored patients. Additionally, costs accrued after end of follow-up were not included in analyses. This has the potential to exclude important costs for patients lifetime costs. Future work should expand on this work by examining longer time periods. Finally, this study took place before the widespread use of newer anti-HER2-targeted therapies and results may not be generalizable to populations utilizing newer treatments. Future work should examine populations receiving newer therapies.
Conclusion
During this study period among US patients with HER2+ mBC, disease progression was associated with significant increases in healthcare resource utilization and costs; moreover, longer delays in disease progression resulted in incrementally lower cumulative healthcare costs. These findings suggest that earlier use of more effective treatments to delay progression, such as newer HER2-targeted therapies, may reduce the economic burden among patients with HER2+ mBC in the US.
Summary points
•
Approximately 15–30% of invasive breast cancers overexpress human epidermal growth factor receptor 2 (HER2), which is associated with more aggressive disease.
•
Because new treatment options have become available, there is a gap in understanding the cost of disease progression in patients with HER2+ metastatic breast cancer (mBC). This study had two aims: to investigate differences in per patient per month (PPPM) healthcare resource utilization (HCRU) for HER2+ mBC patients who experience disease progression in 12 months compared with those who do not and to investigate the impact of disease progression timing on cumulative healthcare costs among these patients.
•
This retrospective claims-based study included patients in the Optum Research Database (ORD) who had a diagnosis of mBC during 1 January 2013 and 30 April 2020 and had evidence of receiving HER2-targeted therapy.
•
Of the 4113 patients, 3406 had at least 12 months of follow-up (or less if due to death).
•
In the 12 months following LOT start, mean PPPM healthcare costs and HCRU, including number of emergency room visits and inpatient stays, were significantly higher for progressed versus nonprogressed patients (both p < 0.001).
•
Progressed patients had higher 3-year mean cumulative healthcare costs than nonprogressed patients following LOT1 and LOT2.
•
Results of this study demonstrate that delays in disease progression were associated with lower cumulative healthcare costs and suggest treatments that delay progression may reduce the economic burden among these patients.
Author contributions
Conceptualization and study design was conducted by C Lam, F Lin, S Mehta, W Jackie Kwong, L Park, K Andrade and B Diessner. The study methodology was determined by C Lam, F Lin, S Mehta, W Jackie Kwong, L Park, K Andrade and B Diessner. Acquisition and analysis of the data were conducted by K Andrade, S Stackland and B Diessner. All authors interpreted the findings. All authors read and approved the final manuscript and reviewed and commented on all previous versions.
Acknowledgments
The authors thank Y Edmonds and G Hultman (both of Optum) for medical writing assistance, S Hershberg and L Dick (both of Optum) for project management as well as T Bancroft and L Brekke (both of Optum) for analytic support.
Financial disclosure
This work was funded by AstraZeneca and Daiichi-Sankyo, Inc. In March 2019, AstraZeneca entered into a global development and commercialization collaboration agreement with Daiichi-Sankyo for trastuzumab deruxtecan (T-DXd; DS-8201). C Lam and L Park are employees and stockholders of AstraZeneca. K Andrade and B Diessner are employees of Optum. S Stackland was an employee of Optum at the time of the study and is now an employee of Panalgo. S Mehta is an employee of Daiichi- Sankyo. W Jackie Kwong was an employee of Daiichi-Sankyo at the time of the study and is now an employee of Johnson and Johnson. F Lin was an employee of Daichi-Sankyo at the time of the study and is now an employee of Sanofi. The authors have no other relevant affiliations or financial involvement with any organization or entity with a financial interest in or financial conflict with the subject matter or materials discussed in the manuscript apart from those disclosed.
Competing interests disclosure
The authors have no competing interests or relevant affiliations with anyorganization or entity with the subject matter or materials discussed in the manuscript. This includes employment, consultancies, honoraria, stock ownership or options, expert testimony, grants or patents received or pending, or royalties.
Writing disclosure
Medical writing assistance was provided by Y Edmonds and G Hultman (both of Optum) and funded by AstraZeneca.
Ethical conduct of research
Institutional review board approval or waiver of approval was not required for this study because the study data were secondary and de-identified in accordance with the United States Department of Health and Human Services Privacy Rule's requirements for de-identification codified at 45 C.F.R. § 164.514(b). Throughout the process, patient privacy was preserved, and researchers complied strictly with all applicable Health Insurance Portability and Accountability Act data management rules and the 1964 Helsinki Declaration and its later amendments or comparable ethical standards. Patient consent was not required for this retrospective study.
Data sharing statement
The data contained in the Optum Research database contains proprietary elements owned by Optum and, therefore, cannot be broadly disclosed or made publicly available at this time. The disclosure of this data to third party clients assumes certain data security and privacy protocols are in place and that the third party client has executed our standard license agreement which includes restrictive covenants governing the use of the data.
Open access
This work is licensed under the Attribution-NonCommercial-NoDerivatives 4.0 Unported License. To view a copy of this license, visit https://creativecommons.org/licenses/by-nc-nd/4.0/
References
Papers of special note have been highlighted as: • of interest
1.
Breastcancer.org. Key Statistics for Breast Cancer (2023). (Accessed 13 March 2023). https://www.cancer.org/cancer/breast-cancer/about/how-common-is-breast-cancer
2.
Blumen H, Fitch K, Polkus V. Comparison of treatment costs for breast cancer, by tumor stage and type of service. Am. Health Drug Benefits 9(1), 23–32 (2016).
3.
Gogate A, Wheeler SB, Reeder-Hayes KE et al. Projecting the prevalence and costs of metastatic breast cancer from 2015 through 2030. JNCI Cancer Spectr. 5(4), pkab063 (2021).
• Provides estimates of total costs associated with metastatic breast cancer (mBC).
4.
Burstein HJ. The distinctive nature of HER2-positive breast cancers. N. Engl. J. Med. 353(16), 1652–1654 (2005).
5.
Martínez-Sáez O, Prat A. Current and future management of HER2-positive metastatic breast cancer. JCO Oncol. Pract. 17(10), 594–604 (2021).
6.
Kennecke H, Yerushalmi R, Woods R et al. Metastatic behavior of breast cancer subtypes. J. Clin. Oncol. 28(20), 3271–3277 (2010).
7.
Gobbini E, Ezzalfani M, Dieras V et al. Time trends of overall survival among metastatic breast cancer patients in the real-life ESME cohort. Eur. J. Cancer 96, 17–24 (2018).
• Provides analysis of overall survival trends among patients with mBC, including a subcohort of patients with HER2+ disease.
8.
Theriault RL, Carlson RW, Allred C et al. Breast cancer, Version 3.2013. J. Natl Compr. Canc. Netw. 11(7), 753–761 (2013).
9.
Narayan P, Osgood CL, Singh H et al. FDA approval summary: fam-trastuzumab deruxtecan-Nxki for the treatment of unresectable or metastatic HER2-positive breast cancer. Clin. Cancer Res. 27(16), 4478–4485 (2021).
10.
Cortés J, Kim SB, Chung WP et al. Trastuzumab deruxtecan versus trastuzumab emtansine for breast cancer. N. Engl. J. Med. 386(12), 1143–1154 (2022).
11.
Hurvitz SA, Hegg R, Chung WP et al. Trastuzumab deruxtecan versus trastuzumab emtansine in patients with HER2-positive metastatic breast cancer: updated results from DESTINY-Breast03, a randomised, open-label, phase III trial. Lancet 401(10371), 105–117 (2023).
12.
Murthy RK, Loi S, Okines A et al. Tucatinib, Trastuzumab, and capecitabine for HER2-positive metastatic breast cancer. N. Engl. J. Med. 382(7), 597–609 (2020).
13.
Curigliano G, Mueller V, Borges V et al. Tucatinib versus placebo added to trastuzumab and capecitabine for patients with pretreated HER2+ metastatic breast cancer with and without brain metastases (HER2CLIMB): final overall survival analysis. Ann. Oncol. 33(3), 321–329 (2022).
14.
Rugo HS, Im SA, Cardoso F et al. Margetuximab versus trastuzumab in patients with previously treated HER2-positive advanced breast cancer (SOPHIA): final overall survival results from a randomized phase III trial. J. Clin. Oncol. 41(2), 198–205 (2023).
15.
Reyes C, Engel-Nitz NM, DaCosta Byfield S et al. Cost of disease progression in patients with metastatic breast, lung, and colorectal cancer. Oncologist 24(9), 1209–1218 (2019).
• Compares the healthcare costs of patients with mBC who progressed with those who did not. This study did not include analysis of mBC by subtype.
16.
Reyes C, Engel-Nitz NM, DaCosta Byfield S et al. Cost of disease progression in patients with chronic lymphocytic leukemia, acute myeloid leukemia, and non-Hodgkin's lymphoma. Oncologist 24(9), 1219–1228 (2019).
• Provides estimates for the cost of disease progression among patients with certain types of cancer.
17.
Trinh QD, Chaves LP, Feng Q, Zhu J, Sandin R, Abbott T. The cost impact of disease progression to metastatic castration-sensitive prostate cancer. J. Manag. Care Spec. Pharm. 28(5), 544–554 (2022).
18.
Quan H, Li B, Couris CM, Fushimi K et al. Updating and validating the Charlson comorbidity index and score for risk adjustment in hospital discharge abstracts using data from 6 countries. Am. J. Epidemiol. 173(6), 676–682 (2011).
19.
Clinical Classifications Software (CCS) for ICD-9-CM/ICD-10-CM. Agency for Healthcare Research and Quality, MD, USA, Available from: http://www.hcup-us.ahrq.gov/toolssoftware/ccs/ccs.jsp
20.
US Department of Labor, Bureau of Labor Statistics. Consumer Price Index. Medical Care. Series ID: CUUR0000SAM (2020). Available from: http://data.bls.gov/cgi-bin/surveymost?cu
21.
Park J, Look KA. Health Care Expenditure Burden of Cancer Care in the United States. Inquiry. 56, 46958019880696 (2019).
• Compares healthcare expenditures between cancer patients and noncancer patients four patients with four common types of cancer.
22.
Oğuz G, Koçak N, Şenel G, Kadioğullari N. Characteristics of advanced cancer patients admitted to the palliative care unit from the Emergency Department. Indian J. Palliat. Care 27(1), 89–94 (2021).
23.
Chastek B, Harley C, Kallich J, Newcomer L, Paoli CJ, Teitelbaum AH. Health care costs for patients with cancer at the end of life. J. Oncology Pract. 8(6S), 75S–80S (2012).
• Provides estimates of end of life costs among cancer patients in the USA.
24.
Abdel-Rahman O, Koski S, Mulder K. Real-world patterns of chemotherapy administration and attrition among patients with metastatic colorectal cancer. Int. J. Colorectal Dis. 36(3), 493–499 (2021).
25.
Tsang ES, Lim HJ, Renouf DJ, Davies JM, Loree JM, Gill S. Real-world treatment attrition rates in advanced esophagogastric cancer. World J. Gastroenterol. 26(39), 6027–6036 (2020).
26.
Yin L, Duan JJ, Bian XW, Yu SC. Triple-negative breast cancer molecular subtyping and treatment progress. Breast Cancer Res. 22(1), 61 (2020).
27.
Martínez-Sáez O, Prat A. Current and future management of HER2-positive metastatic breast cancer. JCO Oncol. Pract. 17(10), 594–604 (2021).
28.
Verma S, Miles D, Gianni L et al. Trastuzumab emtansine for HER2-positive advanced breast cancer. N. Engl. J. Med. 367(19), 1783–1791 (2012).
29.
Krop IE, Kim SB, Gonzalez-Martin A et al. Trastuzumab emtansine versus treatment of physician's choice for pretreated HER2-positive advanced breast cancer (TH3RESA): a randomised, open-label, phase III trial. Lancet Oncol. 15(7), 689–699 (2014).
30.
Gradishar WJ, Moran MS, Abraham J et al. NCCN Guidelines® Insights: Breast Cancer, Version 4.2023: Featured Updates to the NCCN Guidelines. J. Natl Comp. Cancer Netwk 21(6), 594–608 (2023).
31.
ClinicalTrials.gov. Trastuzumab deruxtecan (T-DXd) with or without pertuzumab versus taxane, trastuzumab and pertuzumab in HER2-positive metastatic breast cancer (DESTINY-Breast09) (2023). Available from: https://clinicaltrials.gov/ct2/show/NCT04784715
32.
ClinicalTrials.gov. A phase Ib/II study of t-DXd combinations in HER2-positive metastatic breast cancer (DB-07) (2023). Available from: https://clinicaltrials.gov/ct2/show/NCT04538742
Information & Authors
Information
Published In
Copyright
© 2024 The Authors. This work is licensed under the Attribution-NonCommercial-NoDerivatives 4.0 Unported License
History
Received: 7 November 2023
Accepted: 18 March 2024
Published online: 22 April 2024
Keywords:
Topics
Authors
Metrics & Citations
Metrics
Article Usage
Article usage data only available from February 2023. Historical article usage data, showing the number of article downloads, is available upon request.
Citations
How to Cite
Cost of disease progression among US patients with human epidermal growth factor receptor 2-positive metastatic breast cancer. (2024) Journal of Comparative Effectiveness Research. DOI: 10.57264/cer-2023-0166
Export citation
Select the citation format you wish to export for this article or chapter.
Citing Literature
- Nicole Princic, Eleanor Faherty, Meghan Moynihan, Caroline Henriques, Sandhya Mehta, Impact of Delaying Disease Recurrence on Economic Burden in Patients with HER2+ Early-Stage Breast Cancer (eBC), ClinicoEconomics and Outcomes Research, 10.2147/CEOR.S560281, Volume 18, (1-14), (2026).
- Manali Bhave, Tiffany Traina, Simon Collin, Jenny Tse, Nazneen Fatima Shaikh, Dajun Tian, Aimee Near, Treatment Patterns, Clinical Events, and Costs of Care for Patients With Triple Negative Metastatic Breast Cancer: A Retrospective US Claims Database Study, Journal of Health Economics and Outcomes Research, 10.36469/jheor.2025.144499, (183-192), (2025).
- Manali Bhave, Tiffany Traina, Simon M. Collin, Jenny Tse, Nazneen Fatima Shaikh, Dajun Tian, Aimee M. Near, Treatment Patterns, Clinical Events, and Costs of Care for Patients With Triple Negative Metastatic Breast Cancer: A Retrospective US Claims Database Study, Journal of Health Economics and Outcomes Research, 10.36469/001c.144499, 12, 2, (2025).