How does risdiplam compare with other treatments for Types 1–3 spinal muscular atrophy: a systematic literature review and indirect treatment comparison
Publication: Journal of Comparative Effectiveness Research
Abstract
Aim: To conduct indirect treatment comparisons between risdiplam and other approved treatments for spinal muscular atrophy (SMA). Patients & methods: Individual patient data from risdiplam trials were compared with aggregated data from published studies of nusinersen and onasemnogene abeparvovec, accounting for heterogeneity across studies. Results: In Type 1 SMA, studies of risdiplam and nusinersen included similar populations. Indirect comparison results found improved survival and motor function with risdiplam versus nusinersen. Comparison with onasemnogene abeparvovec in Type 1 SMA and with nusinersen in Types 2/3 SMA was challenging due to substantial differences in study populations; no concrete conclusions could be drawn from the indirect comparison analyses. Conclusion: Indirect comparisons support risdiplam as a superior alternative to nusinersen in Type 1 SMA.
Spinal muscular atrophy (SMA) is an autosomal, recessive neuromuscular disease with an incidence of approximately 1 in 10,000 live births [1,2]. SMA is characterized by progressive motor neuron degeneration and muscle weakness caused by insufficient levels of the SMN protein due to homozygous deletion of, or loss-of-function mutations within the SMN1 gene [3–5]. A paralogous gene, SMN2, is able to direct the production of low levels of functional SMN protein but is unable to fully compensate for the lack of SMN1 [6,7].
SMA encompasses a broad continuum of disease, divided into five types (Types 0–4) classified by maximum motor milestone achieved, and age of onset [8,9]. Type 0, the most severe form, has a prenatal onset: infants require respiratory support from birth and rarely survive beyond 1 year [9]. Infants with Type 1 SMA present clinically with severe hypotonia and weakness with symptom onset before 6 months of age [8,10]. Without treatment, infants with Type 1 SMA fail to achieve higher motor milestones, such as sitting independently, and typically die before 2 years of age [8,10].
Later-onset SMA (Types 2–4) is a heterogeneous population with a varied phenotype. Individuals with Type 2 SMA experience symptom onset between 7 and 18 months of age [11]. They acquire independent sitting, but never walk independently [12]. Life expectancy is shortened, with 52% of individuals being alive at 40 years of age [13]. In Type 3 SMA, symptom onset occurs after 18 months [11]. Individuals have an almost normal life expectancy and achieve independent ambulation, but may lose this ability over time [12,13]. In Type 4 SMA, the least severe form of SMA, symptom onset occurs later in life (10–30 years of age) [11]. Individuals are able to walk, but may require a walking aid later in life [14].
There are currently three approved treatments for SMA. Risdiplam (EVRYSDI®) is an orally administered (liquid formulation) SMN2 splicing modifier [15] approved for the treatment of patients with SMA aged ≥2 months (USA) or aged ≥2 months with a clinical diagnosis of Type 1, 2 or 3 SMA or 1–4 SMN2 copies (EU) [16,17] and has been investigated in pediatric and adult populations [18–20]. Nusinersen (SPINRAZA®) is an SMN2-targeting antisense oligonucleotide administered by intrathecal injection. It is indicated for use in both adult and pediatric populations [21,22] and has been investigated in two randomized controlled trials (RCTs) in pediatric patients aged ≤9 years [23,24]. Onasemnogene abeparvovec (ZOLGENSMA®) is a gene therapy, administered by intravenous infusion of an adeno-associated virus. It is indicated for the treatment of SMA in patients aged <2 years (US), or in patients with Type 1 SMA or ≤3 SMN2 copies (EU) [25,26] and has been investigated in a pediatric Type 1 population [27–29].
No head-to-head clinical trials have directly compared the efficacy of these disease-modifying therapies (DMTs) in SMA. Some indirect comparisons have been published to estimate differences between treatments; however, these either did not adjust for heterogeneity between samples [30], which can be a source of bias, or did not include risdiplam [31–33]. In this study, we conducted indirect treatment comparisons (ITCs) to estimate the relative effectiveness of risdiplam versus other therapies available for the treatment of Types 1–3 SMA based on currently available published clinical trial evidence.
Methods
Systematic literature review
A search strategy was developed based on the Population, Intervention, Comparator, Outcome, Study type (PICOS) framework (Supplementary Table 1) to identify relevant published data investigating efficacy and safety of treatments for Types 1– 3 SMA. Types 0 and 4 SMA were not included in the search as these were not included in the risdiplam clinical trials. Searches were conducted from database inception (prior to 1966) to 1 March 2021 across a range of bibliographic databases (Embase®, MEDLINE® and Cochrane CENTRAL) and supplementary information sources (for full list see Supplementary Table 2).
Inclusion criteria included RCTs, non-RCTs, single-arm (SA) trials and real-world observational studies (prospective and retrospective). Cross-sectional studies and case series/case reports were excluded. There was no restriction on country of origin, but studies were required to be published in English. Previously published systematic reviews and meta-analyses were included for the purpose of bibliographic searches to identify relevant primary studies.
Feasibility assessment & statistical analyses
Following the systematic literature review (SLR), the similarity of studies was assessed in terms of design, endpoints and populations to determine feasibility and best methods for comparing treatments. A hierarchy of study designs was applied in the selection of the evidence: when RCTs were available for an intervention we did not include SA trials or real-world observational studies. SA trials were only included when RCTs were not available. Dose-comparison/dose-escalation trials were excluded from the ITC if Phase III RCTs or SA trials were available.
Due to the heterogeneity of SMA, and as individual patient data (IPD) were available from clinical trials of risdiplam, methods considered included population-adjusted indirect comparisons, such as matching-adjusted indirect comparison (MAIC) and simulated treatment comparison (STC), in addition to standard adjusted indirect comparison as described by Bucher et al. [34].
MAICs are a type of population-adjusted ITC that attempt to reduce heterogeneity between patient populations using inverse propensity score weighting. IPD from the trials of one treatment are weighted to match the average of selected covariates from aggregated comparator trial data. Weights are estimated using a logistic regression model using the odds of being enrolled in the comparator trial versus the trial for which IPD are available [35]. Outcomes for the IPD trial are then recalculated using the estimated weights. In STCs, outcome regression models are utilized to adjust for differences between patient populations [35]. For each outcome of interest, a model for the conditional mean outcome is regressed on selected model covariates, using data from the IPD trial. Outcomes are then recalculated using the average covariate values of the comparator trial. In Bucher's method, two treatments are compared using relative effects to a common comparator. It assumes there are no differences in treatment-effect modifiers between studies [35].
Analyses were pre-specified prior to data readout (see supplementary materials for Statistical Analysis Plan), and potential prognostic and predictive factors were selected in consultation with medical experts in the field. Main deviations along with their rationale are also listed in the Supplementary materials (Supplementary Table 3).
Different analyses were performed depending on the method selected from the results of the feasibility assessment. Hazard ratios (HRs) for overall survival (OS) and event-free survival (EFS) were estimated with Cox proportional hazards models when using MAIC methodology, and parametric survival analysis assuming an exponential distribution when using STC. Odds ratios (OR) were estimated for binary endpoints. Zero events were adjusted by adding 0.5 to the number of patients with events and adding one to the total number of patients. Mean differences in change from baseline were estimated using an analysis of covariance (ANCOVA) model adjusted for age and baseline score.
Bootstrapping was used to obtain CIs around estimates to account for uncertainty in both sampling error and uncertainty in the weights for the MAICs. CIs were based on the 2.5th and 97.5th percentiles of 1000 bootstrap samples.
Prognostic factors & effect modifiers
‘Unanchored’ population-adjusted ITCs, where evidence networks are disconnected resulting from a lack of a common comparator, require balance in all prognostic factors and effect modifiers for an unbiased estimation of comparative effectiveness. ‘Anchored’ population-adjusted ITCs, where a common comparator connects the network, only require effect modifiers to be balanced [35].
Prognostic factors and effect modifiers in Types 1–3 SMA have been previously identified from an SLR of published literature [36]. Characteristics considered as covariates for MAIC and STC were based on these identified factors, the availability of baseline characteristics in the trials, and on feedback from medical experts. Given the small sample sizes in SMA trials, care was taken in the selection of covariates to avoid overfitting and to maintain a reasonably high effective sample size (ESS).
Characteristics selected as covariates in ITCs for Type 1 SMA were mean age at first dose, disease duration and baseline motor function, all previously identified as effect modifiers in Type 1 SMA [36]. As a measure of baseline motor function, the Children's Hospital of Philadelphia Infant Test of Neuromuscular Disorders (CHOP-INTEND) scale was considered to be a stronger indicator of function than the Hammersmith Infant Neurological Examination, Section 2 (HINE-2), as it was developed based on infants with Type 1 SMA [37] and is more granular [38]. Although mean age at symptom onset is a commonly reported prognostic factor, it was not included as a covariate as it is a function of both age at first dose and symptom duration, which were included as covariates. Similarly, SMN2 copy number is also a prognostic factor [36], but was not selected as a covariate, as all trials exclusively included patients with two SMN2 copies.
Age at screening, SMN2 copy number and baseline motor function score were selected as covariates in the analyses of Types 2 and 3 SMA. Age has been identified as a treatment-effect modifier, while SMN2 copy number and baseline motor function were flagged as prognostic of changes in motor function [36,39,40] and were included as they could be potential treatment-effect modifiers. Scoliosis and contractures can limit the range of motion and may hinder accurate measurement of treatment response on motor function scales [39,41]; the presence of these complications was considered during the feasibility assessment.
All prognostic factors and effect modifiers were studied in relation to efficacy outcomes. There was no evidence on effect modification for safety outcomes in the literature [36].
Results
Study selection
The SLR yielded 1147 records: 1099 records through database searches; 48 through supplementary searches. Sixty-four primary studies were identified (15 journal articles, 44 conference abstracts and five trial registry records). Primary studies comprised 26 clinical trials (ten SA trials, eight RCTs, eight dose-comparison/dose-escalation trials) and 38 observational studies (Supplementary Figure 1).
Seventeen clinical studies that assessed data from the two primary populations of interest were identified: Type 1 (infantile onset, n = 8 [23,42–48]) and Types 2 and 3 SMA (late onset, n = 9 [24,49–56]). Six clinical trials enrolled a mix of patients with Types 1, 2 and 3 SMA [55,57–61].
Treatments that had been approved by the US FDA or the European Medicines Agency (EMA) at the time of risdiplam approval (August 2020) were of interest in the ITC; this limited the feasibility assessment to clinical trials investigating nusinersen and onasemnogene abeparvovec. Five studies were excluded from further consideration as they investigated unapproved treatments (branaplam, SRK-015, CK-107 and olesoxime [48,54,56,61,62]). Another study (STRONG) investigated an experimental intrathecal administration of onasemnogene abeparvovec and was excluded [63]. One study evaluated patients who had previously received treatment for SMA (JEWELFISH) and was also excluded [55].
Dose-comparison/dose-escalation trials were excluded as Phase III RCTs or SA trials were available for all three interventions [44,45,50,51,53,60]. There were a total of ten RCTs and SA trials investigating risdiplam, nusinersen and onasemnogene abeparvovec in Type 1 and Types 2 and 3 SMA for consideration: two trials investigated risdiplam (FIREFISH and SUNFISH [42,49]), five investigated nusinersen (ENDEAR, CHERISH, DEVOTE, EMBRACE and SHINE [23,24,57–59]), and three investigated onasemnogene abeparvovec (STR1VE-US, STR1VE-EU and STR1VE-AP [43,46,47]). Four of these trials were ongoing: two had not published any outcome data (DEVOTE, STR1VE-AP), and two had published insufficient data to analyze (EMBRACE, STR1VE-EU) and so were excluded. The SHINE study was also excluded, as it is an open-label extension of two RCTs (ENDEAR and CHERISH). All excluded trials are listed in Supplementary Table 4. Five studies were selected for inclusion in the ITC (Table 1).
| Study identifier | Intervention | Study type | Comparator | Sample size | SMA type | Status | Primary completion date (study completion date) | Ref. |
|---|---|---|---|---|---|---|---|---|
| FIREFISH (NCT02913482) | Risdiplam | SA | NA | 62 | Type 1 | Ongoing | 14 November 2019 (17 November 2023) | [18,19,42] |
| ENDEAR (NCT02193074) | Nusinersen | RCT | Sham procedure | 122 | Type 1 | Complete | 21 November 2016 (same date) | [23,65] |
| STR1VE-US (NCT03306277) | Onasemnogene abeparvovec | SA | NA | 22 | Type 1 | Complete | 12 November 2019 (same date) | [29,43,64,66] |
| SUNFISH (NCT02908685) | Risdiplam | RCT | Placebo | 231 | Types 2/3 (Amb/NAmb) | Ongoing | 6 September 2019 (2 September 2023) | [20,49] |
| CHERISH (NCT02292537) | Nusinersen | RCT | Sham procedure | 126 | Types 2/3 | Complete | 20 February 2017 (same date) | [24,67] |
Amb: Ambulatory; NA: Not applicable/not available; NAmb: Non-ambulatory; NCT: National clinical trial; RCT: Randomized controlled trial; SA: Single arm; SMA: Spinal muscular atrophy.
Type 1 SMA
Three studies reported data in Type 1 SMA: FIREFISH, a Phase II/III, open-label, SA trial of risdiplam; ENDEAR, a Phase III, randomized, double-blind, sham-procedure controlled trial of nusinersen; and STR1VE-US, a Phase III, open-label, SA trial of onasemnogene abeparvovec. Risk of bias (ROB) assessment found a low ROB for ENDEAR, and a low-to-unclear ROB for FIREFISH and STR1VE-US.
FIREFISH is a two-part study. Part 1 was a dose-finding study which aimed to determine a dose for Part 2. Part 2 is the confirmatory part of the study powered to assess efficacy and safety of risdiplam in Type 1 SMA. To increase the size of the patient population, a pooled dataset of patients on the final risdiplam dose from FIREFISH Parts 1 and 2 was used for the ITC analyses. This included patients from the ‘high-dose’ cohort of FIREFISH Part 1 (the pivotal dose selected for Part 2) and infants enrolled in FIREFISH Part 2. Table 2 summarizes the baseline characteristics of the pooled FIREFISH population, ENDEAR and STR1VE-US clinical trials.
| Baseline characteristic | Risdiplam (FIREFISH) n = 58† | Nusinersen (ENDEAR) n = 80 | Sham control (ENDEAR) n = 41 | Onasemnogene abeparvovec (STR1VE-US) n = 22 |
|---|---|---|---|---|
| Mean age at first dose, days (SD, [range]) | 163 (44, [68–212]) | 163 (NR, [52–242]) | 181 (NR, [30–262]) | ∼114‡ (49, [15–180]) |
| Gender (female, %) | 57 | 54 | 59 | 55 |
| Mean weight at baseline, kg (SD, [range]) | 6.8 (1.2, [4.1–10.6]) | NR | NR | 5.8 (1.1, [3.9–7.5]) |
| Mean age at symptom onset, weeks (SD, [range]) | 7.2 (3, [4–13]) | 7.9 (NR, [2–18]) | 9.6 (NR, [1–20]) | ∼8.2‡ (5, [0–17]) |
| Mean disease duration at screening, weeks (SD, [range]) | 13.0 (5.9, [1.0–23.3]) | 13.2 (NR, [0–25.9]) | 13.9 (NR, [0–23.1]) | NR |
| Mean age at diagnosis in weeks (SD, [range]) | 12.7 (6, [4–26]) | 12.6 (NR, [0–29]) | 17.5 (NR, [2–30]) | ∼8.0‡ (14, [NR]) |
| Mean CHOP-INTEND score (SD, [range]) | 22.47 (6.79, [8–37]) | 26.63 (8.13, [NR]) | 28.43 (7.56, [NR]) | 32.0 (9.7, [18–52]) |
| Patients with nutritional support: unable to swallow/gastrointestinal tube feeding (%) | 9§ | 9 | 12 | 0 |
| Patients with pulmonary care/ventilatory support (%) | 29 | 26 | 15 | 0 |
| Mean HINE-2 score (SD, [range]) | 0.93 (0.95, [0–5]) | 1.29 (1.07, [NR]) | 1.54 (1.29, [NR]) | NR |
| Mean CMAP negative peak amplitude (mV) – ulnar nerve (SD, [range]) | 0.199 (0.15, [0–0.8]) | 0.226 (0.19, [NR]) | 0.225 (0.12, [NR]) | NR |
Matching factors are in bold.
†
Includes patients from the ‘High-dose’ (pivotal dose) cohort of Part 1 (n = 17) and all patients from FIREFISH Part 2 (n = 41).
‡
§
Baseline data on gastrointestinal tube feeding were not available for most patients in Part 1, as the questionnaire was only introduced 6 months after the start of the study. Ability to swallow was used as a proxy for tube feeding for these patients.
CHOP-INTEND: Children's Hospital of Philadelphia Infant Test of Neuromuscular Disorders; CMAP: Compound muscle action potential; HINE-2: Hammersmith Infant Neurological Examination, Section 2; NR: Not reported; SD: Standard deviation.
The age and disease duration of infants enrolled in FIREFISH were similar to those enrolled in ENDEAR. Infants in FIREFISH had more severe disease at baseline as illustrated by the differences in the mean baseline CHOP-INTEND (22 for risdiplam vs 27 for nusinersen vs 28 for sham) and HINE-2 scores (0.9 for risdiplam vs 1.3 for nusinersen vs 1.5 for sham).
Infants enrolled in FIREFISH were on average 49 days older at first dose compared with infants enrolled in STR1VE-US. Infants in FIREFISH also had more severe disease at baseline, as illustrated by differences in the baseline CHOP-INTEND score (22 for risdiplam vs 32 for onasemnogene abeparvovec). Additionally, a greater number of infants in FIREFISH required ventilatory (29 vs 0%) and nutritional support (9 vs 0%).
For Type 1 SMA, standard adjusted indirect comparison was not feasible due to the lack of a connected network (Supplementary Figure 2). IPD were available from FIREFISH, while aggregated data were available from ENDEAR and STR1VE-US. The feasibility assessment concluded that due to differences in patient characteristics described above, population-adjustment methodologies were favored to balance the covariate distribution with the comparator trials; these were applied to the risdiplam trial data using published methodology [35,68,69]. The MAIC method was preferred as it requires less stringent assumptions around the form of the hazard function. STC was explored when MAIC was not feasible due to limited population overlap (determined by the ESS after weighting). To understand the impact of population adjustment, unadjusted indirect comparison, in which treatments are compared without adjustment of imbalances in prognostic and predictive factors, was also performed.
Endpoints of interest and feasibility for comparison across the FIREFISH, ENDEAR and STR1VE-US trials are summarized in Supplementary Table 5.
ITC 1: FIREFISH versus ENDEAR
IPD from the FIREFISH dataset were compared with aggregated data from ENDEAR [65] using an unanchored MAIC [35,68,69]. The follow-up time was shorter in ENDEAR than in FIREFISH. In ENDEAR, median time on study was ∼9 months (median [range]: 280 [6–442] days) in the nusinersen arm and ∼6 months (median [range]: 187 [20–423] days) in the sham control arm, while primary data cuts from FIREFISH Parts 1 and 2 with a follow-up of ≥12 months were available for the analyses (Part 1 median [range]: 451 [20–797] days; Part 2 median [range]: 466 [51–612] days). For binary efficacy endpoints, where results are compared at specific time points, risdiplam would be favored due to the longer follow-up duration. Therefore, a modified dataset of FIREFISH with a median time on study of ∼9 months (283 days) was used by excluding any assessments occurring in the 6 months preceding the clinical cut-off date (Part 1: February 2019; Part 2: November 2019). For time-to-event endpoints (EFS, OS), differences in follow-up time were considered via censoring, and therefore all available data from the 12-month data cuts were used. For serious adverse events (SAEs), a conservative approach was used and all available data over 12 months in FIREFISH were compared with an average follow-up of 9 months in ENDEAR.
Characteristics used as matching factors in the MAIC analysis were mean age at first dose, disease duration at screening and baseline CHOP-INTEND score. Patients in FIREFISH were matched to the average characteristics of the nusinersen and sham arms in ENDEAR.
Post-matching baseline characteristics
FIREFISH baseline characteristics before and after matching to ENDEAR averages are shown in Table 3. Matching of risdiplam baseline IPD to the published aggregated ENDEAR trial characteristics was considered successful, as risdiplam post-matching baseline characteristics were very similar to the ENDEAR baseline characteristics for all three matching factors. Differences to ENDEAR were also reduced for most other characteristics that were not directly matched for, except for gender where an imbalance was introduced; however, gender has not been identified to be prognostic or effect modifying [36]. A histogram showing the distribution of re-scaled weights can be found in Supplementary Figure 3. ESS was reduced to 36.5 from a total sample of 58 FIREFISH patients.
| Baseline characteristic | Pre-matching: risdiplam (pooled FIREFISH†) | Post-matching: risdiplam (pooled FIREFISH†) | Average of nusinersen and BSC (ENDEAR) |
|---|---|---|---|
| Sample size (ESS) | 58 | 58 (36.5) | 121 |
| Mean age at first dose, days | 163 | 169 | 169 |
| Gender (female, %) | 57 | 69 | 55 |
| Mean age at symptom onset, days | 51 | 55 | 60 |
| Mean disease duration at screening, days | 91 | 94 | 94 |
| Mean age at diagnosis, weeks | 12.7 | 14.3 | 14.3 |
| Mean CHOP-INTEND score | 22.47 | 27.24 | 27.24 |
| Mean HINE-2 score | 0.93 | 1.28 | 1.37 |
| Patients with pulmonary care/ventilatory support, % | 29 | 18 | 22 |
Matching factors are denoted in bold.
†
Includes patients from the ‘High-dose’ (pivotal dose) cohort of Part 1 (n = 17) and all patients from FIREFISH Part 2 (n = 41).
BSC: Best supportive care; CHOP-INTEND: Children's Hospital of Philadelphia Infant Test of Neuromuscular Disorders; ESS: Effective sample size; HINE-2: Hammersmith Infant Neurological Examination, Section 2.
Survival outcomes
Survival was assessed in FIREFISH and ENDEAR in terms of EFS and OS. Analyses suggested that treatment with risdiplam may result in prolonged EFS compared with nusinersen. The HR for EFS of risdiplam versus nusinersen was estimated to be 0.24 (95% CI: 0.09–0.46; Figure 1) in the unadjusted analysis and 0.20 (95% CI: 0.06–0.42) in the MAIC analysis (Figure 1). Analyses also suggest risdiplam increases survival relative to best supportive care (BSC), with HRs of 0.11 (95% CI: 0.04–0.22) and 0.09 (95% CI: 0.02–0.19) in the unadjusted and MAIC analysis, respectively (Figure 1).
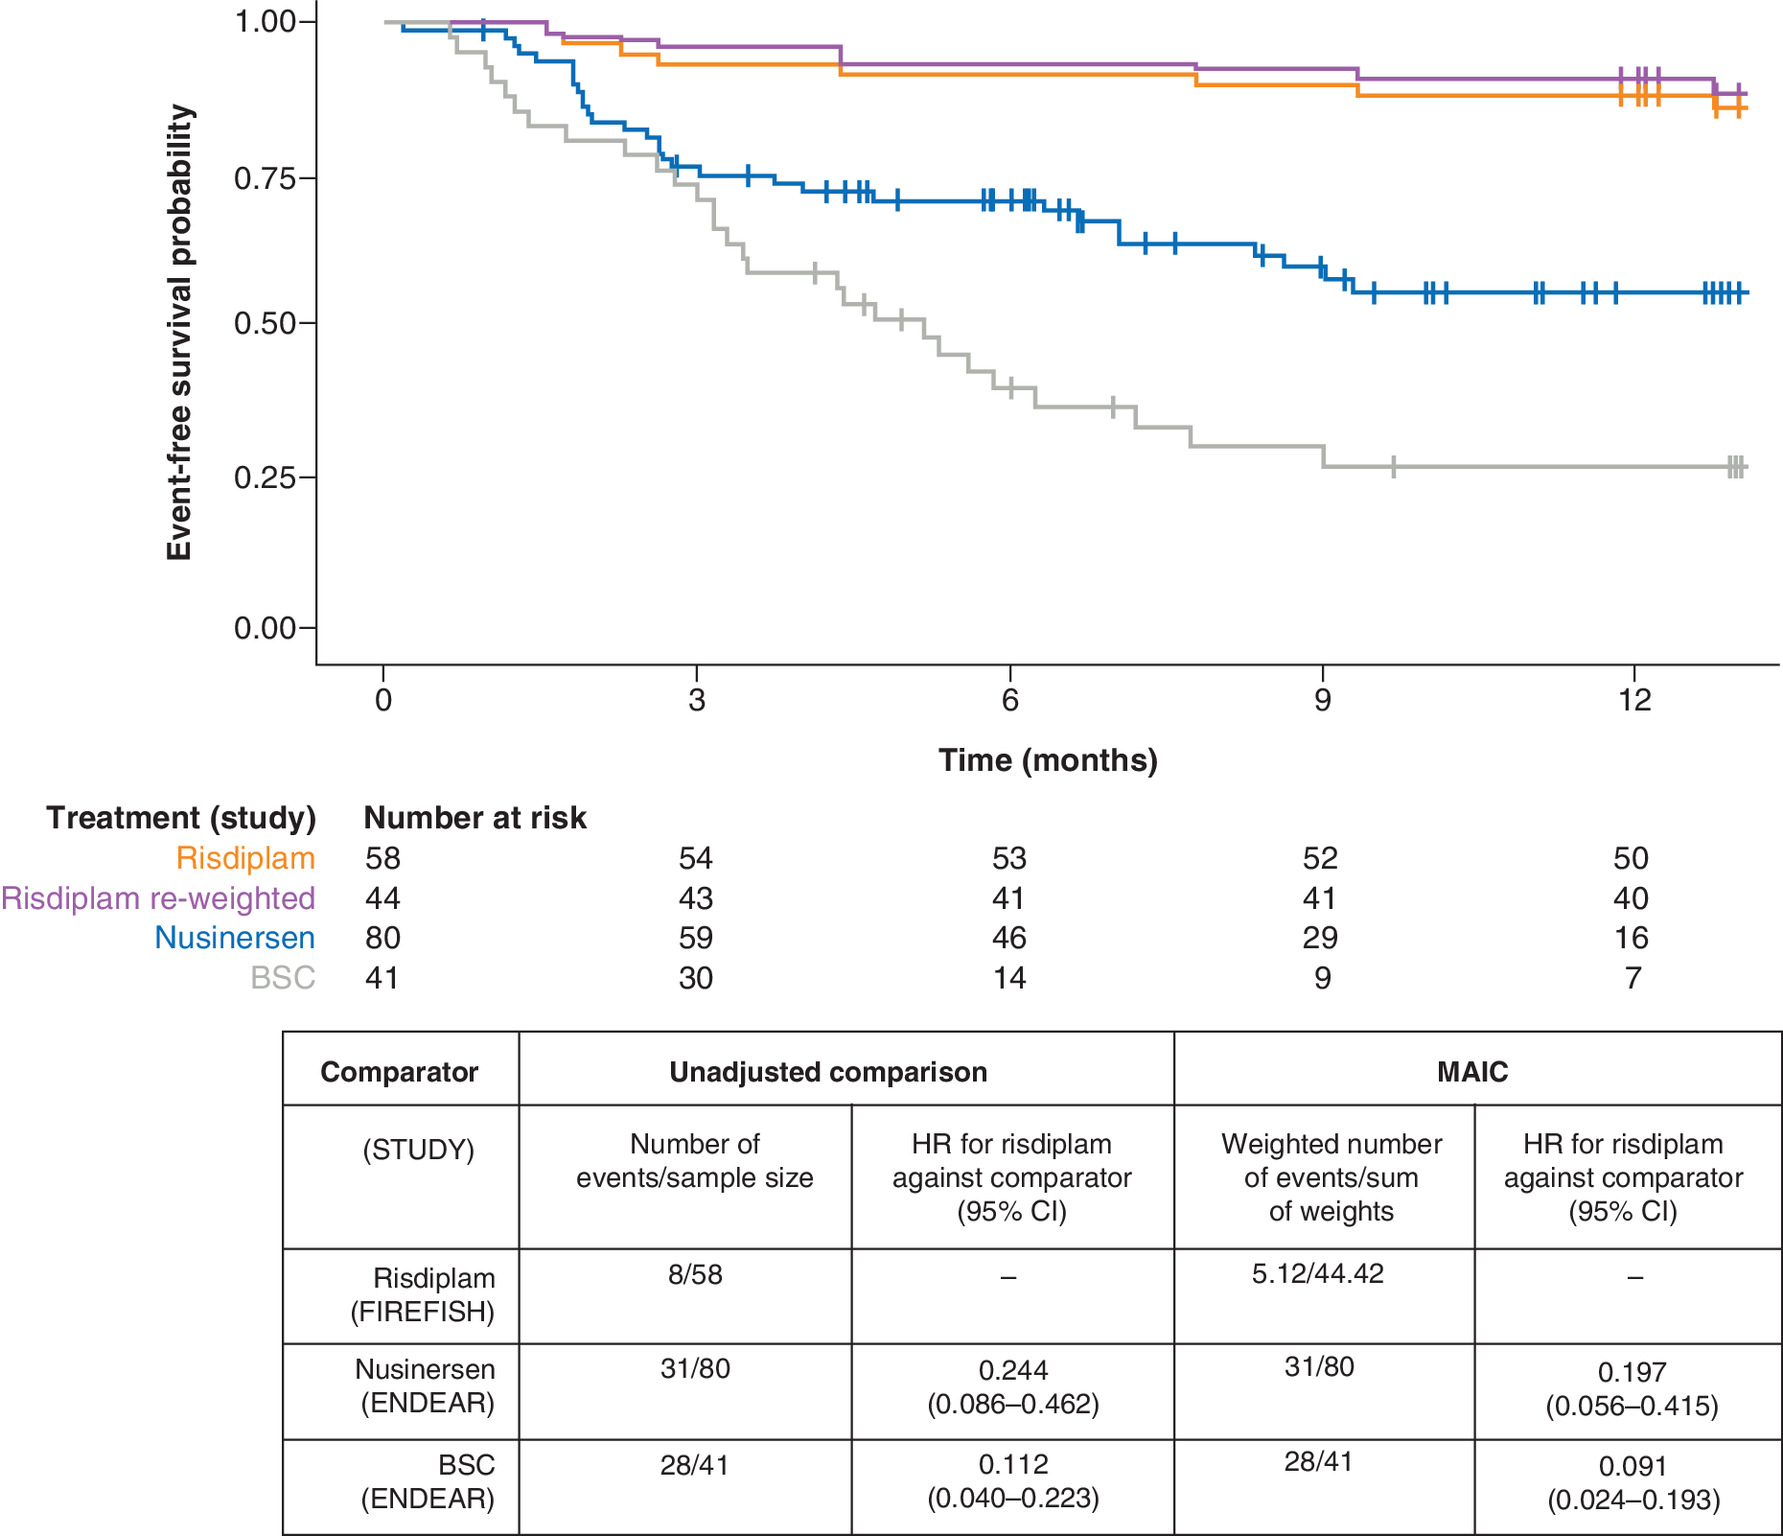
Figure 1. Event-free survival in patients with Type 1 spinal muscular atrophy treated with nusinersen, risdiplam and best supportive care.
Unadjusted survival data from the pooled FIREFISH cohort (orange line) is plotted alongside the data from nusinersen (blue line) and sham control (gray line) arms on ENDEAR. Patients in FIREFISH were matched using MAIC to the average characteristics of the nusinersen and sham control arms in ENDEAR to generate risdiplam re-weighted data (purple line). Characteristics that were used as matching factors in the MAIC analysis were mean age at first dose, disease duration, and baseline CHOP-INTEND total score. HR <1 favor risdiplam over comparator. Bootstrap; N = 1000 bootstrap samples.
BSC: Best supportive care; CHOP-INTEND: Children's Hospital of Philadelphia Infant Test of Neuromuscular Disorders; HR: Hazard ratio; MAIC: Matching-adjusted indirect comparison.
Nusinersen data from [65]. © (2021) Massachusetts Medical Society. Reprinted with permission from Massachusetts Medical Society.
MAIC results were also suggestive of increased OS probability for risdiplam relative to nusinersen (HR: 0.26 [95% CI: 0.03–0.67]) and BSC (HR: 0.10 [95% CI: 0.01–0.24]; Supplementary Figure 4).
Achievement of motor milestones (measured by the HINE-2)
Results of the ITC analysis of achievement of HINE-2 motor milestones are shown in Table 4. Analyses on the HINE-2 motor milestone response, the primary endpoint in ENDEAR, indicated that risdiplam may be associated with a higher likelihood of a response compared with nusinersen. The percentage of patients with a motor milestone response increased after weighting for risdiplam (80 vs 64%). MAIC analysis of risdiplam versus nusinersen gave an OR of 3.97 (95% CI: 2.03–8.38). No patient on BSC achieved a motor milestone response. A comparison of risdiplam with BSC gave an OR of 293.30 (95% CI: 184.94–532.02).
| Milestone | Comparator (STUDY) | Unadjusted comparison | MAIC | ||
|---|---|---|---|---|---|
| Responders/sample size, n (% responders [95% CI]) | OR for risdiplam against comparator (95% CI) | Responders/sum of weights, weighted n (% responders [95% CI]) | OR for risdiplam against comparator (95% CI) | ||
| HINE-2 motor milestone response | Risdiplam† (FIREFISH) | 37/58 (64% [52–76]) | – | 35.67/44.42 (80% [72–89]) | – |
| Nusinersen‡ (ENDEAR) | 37/73 (51% [39–63]§) | 1.714 (0.847–3.556) | 37/73 (51% [39–63]§) | 3.967 (2.033–8.381) | |
| BSC‡ (ENDEAR) | 0/37 (0% [0–10]§) | 130.814¶ (80.263–230.172) | 0/37 (0% [0–10]§) | 293.301¶ (184.942–532.020) | |
| HINE-2 Full head control | Risdiplam† (FIREFISH) | 17/58 (29% [17–41]) | – | 18.43/44.42 (42% [26–57]) | – |
| Nusinersen‡ (ENDEAR) | 16/73 (22% [13–33]§) | 1.477 (0.646–3.316) | 16/73 (22% [13–33]§) | 2.525 (1.095–6.203) | |
| BSC‡ (ENDEAR) | 0/37 (0% [0–10]§) | 31.627¶ (16.237–53.261) | 0/37 (0% [0–10]§) | 53.574¶ (26.869–97.660) | |
| HINE-2 Rolling (supine to prone) | Risdiplam† (FIREFISH) | 0/58 (0% [0–6]) | – | 0/44.42 (0% [0–8]§) | – |
| Nusinersen‡ (ENDEAR) | 7/73 (10% [4–19]§) | 0.076¶ (0.042–0.172) | 7/73 (10% [4–19]§) | 0.099¶ (0.055–0.288) | |
| BSC‡ (ENDEAR) | 0/37 (0% [0–10]§) | NA# | 0/37 (0% [0–10]§) | NA# | |
| HINE-2 Sitting without support (stable sits and pivots) | Risdiplam† (FIREFISH) | 8/58 (14% [5–22]) | – | 12.33/44.42 (28% [11–40]) | – |
| Nusinersen‡ (ENDEAR) | 6/73 (8% [3–17]§) | 1.787 (0.527–6.526) | 6/73 (8% [3–17]§) | 4.292 (1.142–14.900) | |
| BSC‡ (ENDEAR) | 0/37 (0% [0–10]§) | 12.624¶ (4.730–22.253) | 0/37 (0% [0–10]§) | 29.533¶ (9.792–49.927) | |
| HINE-2 Sitting with and without support (sits with support at hips, props, stable sit and pivots) | Risdiplam† (FIREFISH) | 24/58 (41% [29–54]) | – | 26.23/44.42 (59% [46–69]) | – |
| Nusinersen‡ (ENDEAR) | 25/51†† (49% [35–63]§) | 0.734 (0.325–1.572) | 25/51 (49% [35–63]§) | 1.499 (0.715–3.129) | |
| BSC‡ (ENDEAR) | 0/27 (0% [0–13]§) | 39.058¶ (23.147–63.111) | 0/27 (0% [0–13]§) | 78.635¶ (46.918–118.495) | |
| HINE-2 Standing (with support and unaided) | Risdiplam† (FIREFISH) | 0/58 (0% [0–6]§) | – | 0/44.42 (0% [0–8]§) | – |
| Nusinersen‡ (ENDEAR) | 1/73 (1% [0–7]§) | 0.413¶ (0.172–1.256) | 1/73 (1% [0–7]§) | 0.538¶ (0.205–2.132) | |
| BSC‡ (ENDEAR) | 0/37 (0% [0–10]§) | NA# | 0/37 (0% [0–10]§) | NA# | |
| CHOP-INTEND An improvement of ≥4 points | Risdiplam‡‡ (FIREFISH) | 52/58 (90% [81–97]) | – | 42.18/44.42 (95% [90–99]) | – |
| Nusinersen§§ (ENDEAR) | 52/73 (71% [59–81]§) | 3.500 (1.483–12.078) | 52/73 (71% [59–81]§) | 7.585 (3.062–35.708) | |
| BSC§§ (ENDEAR) | 1/37 (3% [0–14]§) | 312.000 (82.376–1,189.286) | 1/37 (3% [0–14]§) | 676.185 (161.187–2,831.340) | |
| CHOP-INTEND Achievement of ≥40 points | Risdiplam‡‡ (FIREFISH) | 27/58 (47% [33–59]) | – | 29.59/44.42 (67% [55–77]) | – |
| Nusinersen§§ (ENDEAR) | 30/73 (41% [30–53]§) | 1.248 (0.591–2.513) | 30/73 (41% [30–53]§) | 2.860 (1.429–6.087) | |
| BSC§§ (ENDEAR) | 1/37 (3% [0–14]§) | 31.355 (7.694–98.529) | 1/37 (3% [0–14]§) | 71.843 (17.900–227.995) | |
| Safety Any SAE | Risdiplam (FIREFISH) | 33/58 (57% [43–69]§) | – | 24.38/44.42 (55% [36–72]§) | – |
| Nusinersen (ENDEAR) | 61/80 (76% [65–85]§) | 0.411 (0.189–0.881) | 61/80 (76% [65–85]§) | 0.379 (0.146–0.971) | |
| BSC (ENDEAR) | 39/41 (95% [84–99]§) | 0.068 (0.014–0.211) | 39/41 (95% [84–99]§) | 0.062 (0.011–0.228) | |
†
FIREFISH HINE-2 motor milestone achievement in infants assessed at the later of Days 0, 119, 245 and 364.
‡
ENDEAR HINE-2 motor milestone achievement assessed in infants at the later of Days 183, 302 and 394.
§
Clopper–Pearson CIs.
¶
ORs calculated using half-cell correction.
#
No ORs were calculated due to 0 events in both arms.
††
Data were taken from an interim analysis (n = 51).
‡‡
FIREFISH CHOP-INTEND score assessed at the later of Days 0, 119, 182, 245, 301, 364 and 427.
§§
ENDEAR CHOP-INTEND score assessed at the later of Days 183, 302 and 394.
OR >1 favor risdiplam over comparator for efficacy outcomes; OR <1 favor risdiplam over comparator for safety outcomes. Bootstrap; N = 1000 Samples.
BSC: Best supportive care; CHOP-INTEND: Children's Hospital of Philadelphia Infant Test of Neuromuscular Disorders; HINE-2: Hammersmith Infant Neurological Examination, Section 2; MAIC: Matching-adjusted indirect comparison; NA: Not available; OR: Odds ratio; SAE: Serious adverse event.
The achievement of individual HINE-2 motor milestones with risdiplam also increased after weighting (Table 4). MAIC analysis of risdiplam versus nusinersen gave an OR of 2.53 (95% CI: 1.10–6.20) for total head control; 4.29 (95% CI: 1.14–14.90) for sitting without support; 1.50 (95% CI: 0.72–3.13) for sitting with and without support; 0.10 (95% CI: 0.06–0.29) for rolling; and 0.54 (95% CI: 0.21–2.13) for standing. Overall trends in OR (OR >1 or <1) did not change before and after weighting for all milestones, except the sitting with and without support milestone with a point estimate >1 after adjustment. ORs for full head control and sitting without support reached statistical significance after weighting.
Motor function (measured by the CHOP-INTEND)
Results of the MAIC analyses on CHOP-INTEND scores are shown in Table 4. Results suggest that risdiplam may be more effective than nusinersen in terms of an improvement in CHOP-INTEND score of ≥4 points (OR: 7.59 [95% CI: 3.06–35.71]) and achievement of a total score of ≥40 points (OR: 2.86 [95% CI: 1.43–6.09]). Results also suggest superiority of risdiplam to BSC with regards to an improvement of CHOP-INTEND score of ≥4 points (OR: 676.19 [95% CI: 161.19–2831.34]) and achievement of a total score of ≥40 points (OR: 71.84 [95% CI: 17.90–228.00]). Results from the unadjusted comparison were consistent with MAIC results (Table 4).
Safety
Results of MAIC analyses on the reporting of SAEs are shown in Table 4. Relative effect estimates remained largely unchanged between unadjusted and MAIC analyses. In the analysis of risdiplam against nusinersen, the OR was 0.41 (95% CI: 0.19–0.89) in the unadjusted analysis and 0.38 (95% CI: 0.15–0.97) in the MAIC analysis. Versus BSC, the OR was 0.07 (95% CI: 0.01–0.21) and 0.06 (95% CI: 0.01–0.23) for the unadjusted and MAIC analyses, respectively.
A qualitative assessment of adverse events (AEs) found that the types of SAEs reported were similar across the trials and reflective of underlying disease. As SAEs include fatal events, the lower number of SAEs with risdiplam compared with both nusinersen and BSC may be partly explained by the lower number of deaths on risdiplam (9%) versus nusinersen (16%) and BSC (39%) (Supplementary Figure 4).
ITC 2: FIREFISH versus STR1VE-US
IPD from the FIREFISH dataset were compared with aggregated data from STR1VE-US [64,66]. Due to limited overlap in prognostic factors (Table 2), matching FIREFISH and STR1VE-US populations resulted in an ESS of 2.1 from a total sample of 58 FIREFISH infants (Supplementary Table 6). Relative effects could therefore not be estimated using MAIC.
STC was applied as an alternative approach to compare risdiplam with onasemnogene abeparvovec [35]. Outcome models were estimated for each of the endpoints using IPD from FIREFISH. An exponential model was used for the analysis of survival outcomes and logistic regression models for the analysis of Bayley Scales of Infant and Toddler Development, third edition (BSID-III), CHOP-INTEND and safety outcomes. Log-transformed outcomes were estimated as a linear combination of the covariates age at first dose and baseline CHOP-INTEND score. Disease duration data were not available from STR1VE-US and could therefore not be included as a covariate in the models. Model fit statistics for each of the endpoints are shown in Supplementary Table 7.
Survival outcomes
Survival was assessed in terms of EFS. Since time-to-event data in STR1VE-US were defined as time from birth, risdiplam data were also recalculated as time from birth for the purpose of these analyses.
Age at first dose and baseline CHOP-INTEND scores were used as covariates in the STC model. The HRs for a 1-month increase in age at first dose and a 1-point increase in baseline CHOP-INTEND score of risdiplam were estimated to be 1.06 (95% CI: 0.56–2.17) and 0.96 (95% CI: 0.84–1.09). The estimated effect sizes of these covariates are small, but the direction of the effects are consistent with research on predictive factors [36]: hazards increased with increasing age and decreased with better motor function.
Analyses did not provide sufficient evidence to draw concrete conclusions on the relative efficacy in EFS between risdiplam and onasemnogene abeparvovec (Figure 2). STC yielded an HR of 0.94 (95% CI: 0.03–4.06) for EFS of risdiplam versus onasemnogene abeparvovec. The 14-month survival probability, one of the co-primary endpoints in STR1VE-US, was 91% for onasemnogene abeparvovec and 93% for risdiplam in the STC.
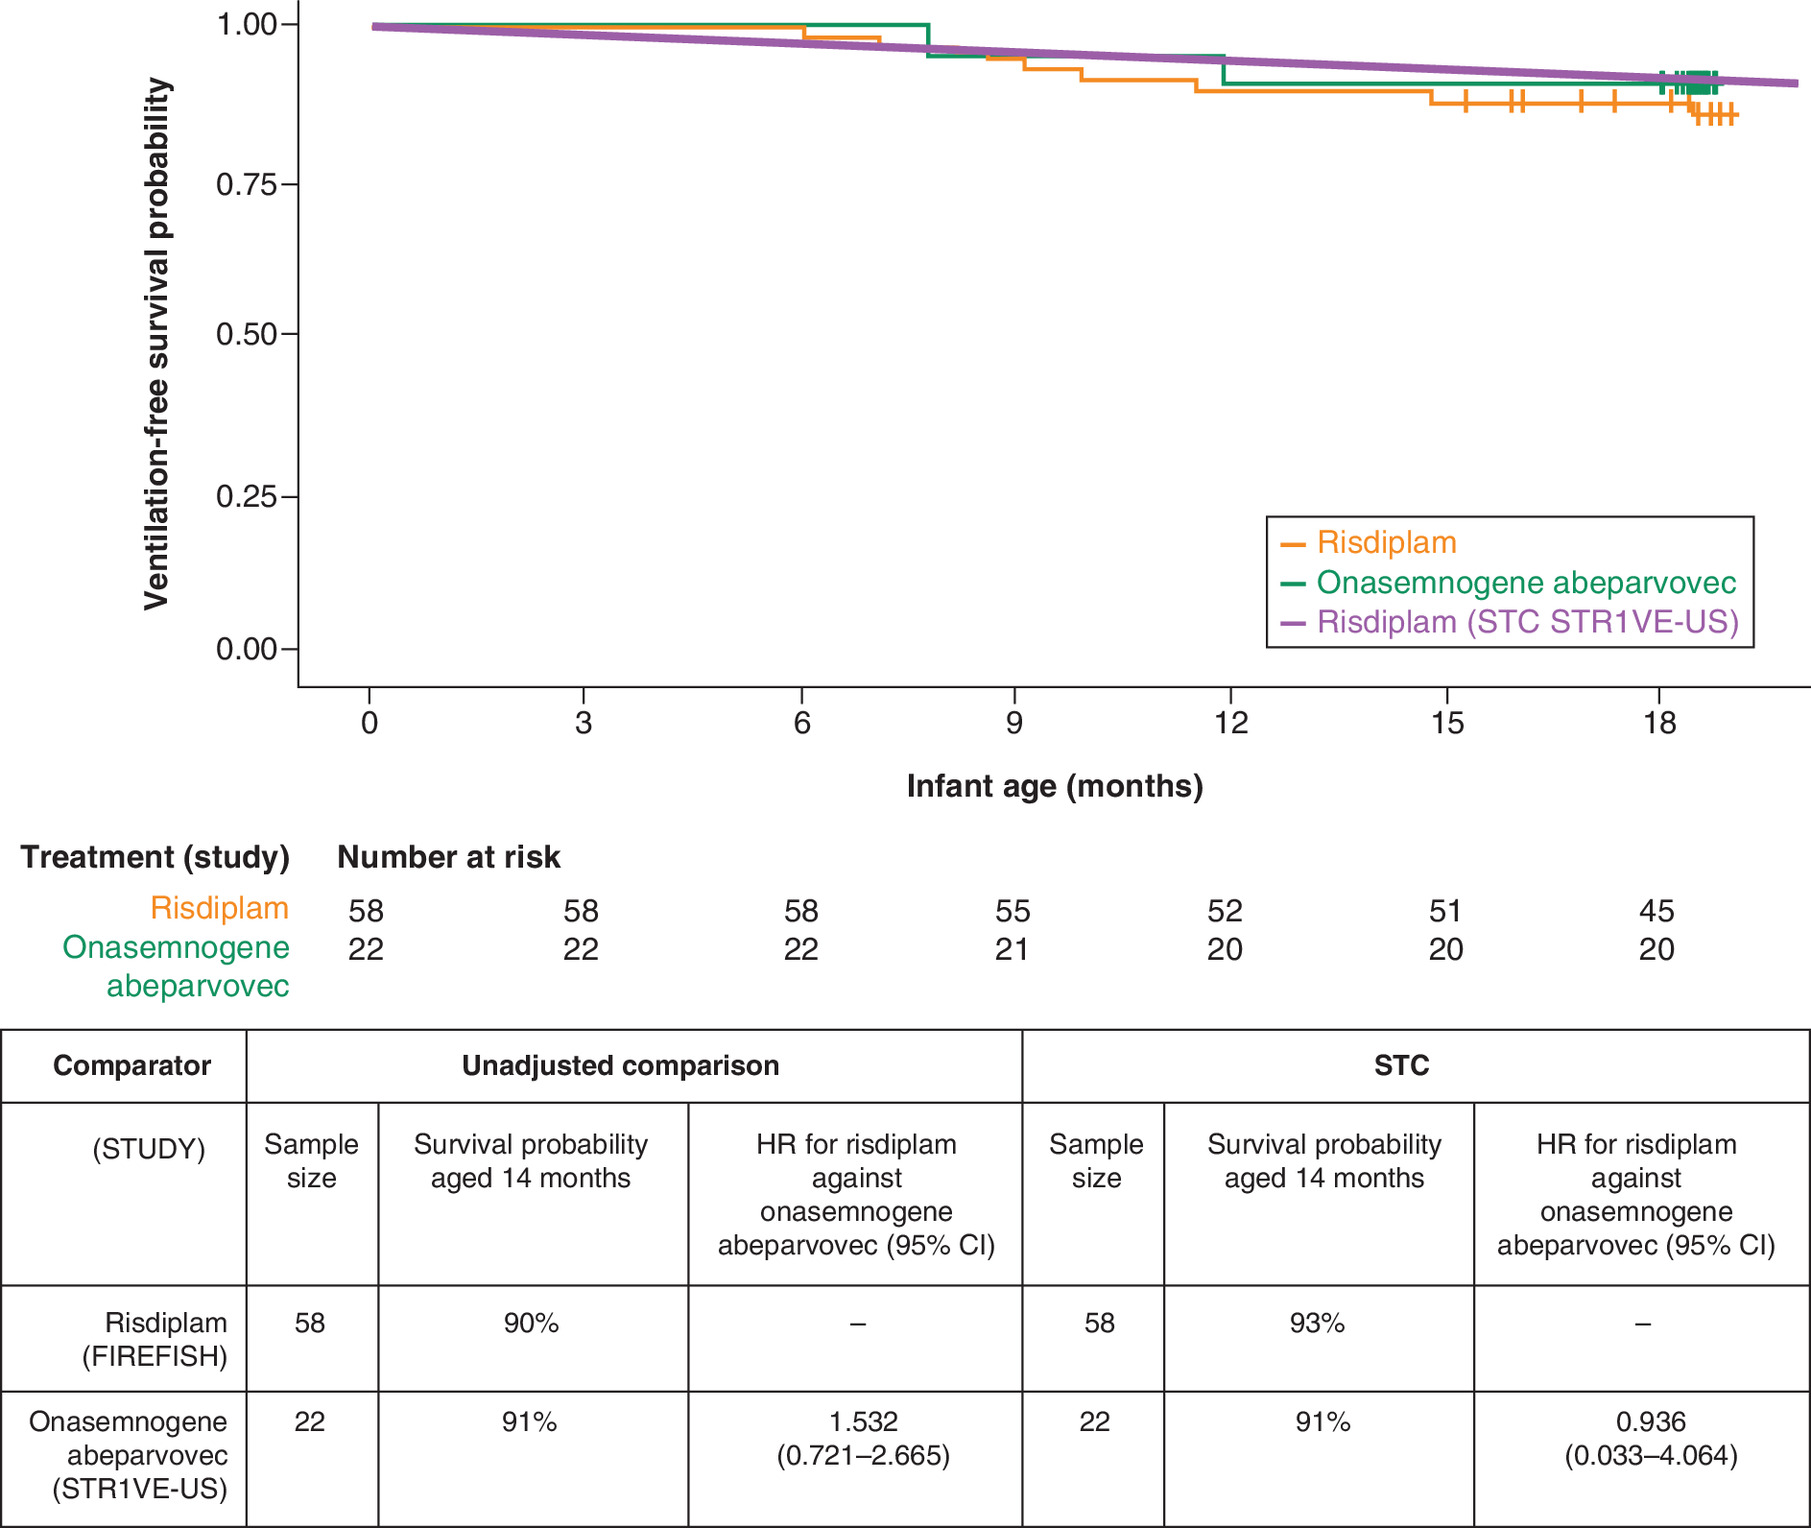
Figure 2. Event-free survival in patients with Type 1 spinal muscular atrophy treated with risdiplam and onasemnogene abeparvovec.
Unadjusted survival data from the pooled FIREFISH cohort (orange line) is plotted alongside the estimated survival with risdiplam in a population with age and baseline motor function adjusted to STR1VE-US (purple line) and the data from onasemnogene abeparvovec (green line) from STR1VE-US. HR <1 favors risdiplam over comparator.
HR: Hazard ratio; STC: Simulated treatment comparison.
Achievement of motor milestones (measured by the BSID-III)
STC analyses were conducted for a list of motor milestones as assessed by the BSID-III (Table 5): sitting without support for ≥30 s (Item 26), head control for ≥3 s (Item 4), rolling from back to side (Item 20) and standing with assistance (Item 33). Comparison could not be conducted on the walking milestone, as no infant in FIREFISH acquired the ability to walk before the data cut. An analysis could also not be conducted on the sitting without support for ≥5 s milestone (Item 22), the primary endpoint of FIREFISH, as this was not reported for STR1VE-US.
| Outcomes | Comparator (STUDY) | Unadjusted comparison | STC | ||
|---|---|---|---|---|---|
| Responders/sample size, n (% responders [95% CI]) | OR for risdiplam against onasemnogene abeparvovec (95% CI) | Responders/sample size, n (% responders [95% CI]) | OR for risdiplam against onasemnogene abeparvovec (95% CI) | ||
| BSID-III Sitting without support for ≥30 s (Item 26) | Risdiplam† (FIREFISH) | 11/58 (19% [10–29]) | – | 30.17/58 (52% [21–88]) | – |
| Onasemnogene abeparvovec‡ (STR1VE-US) | 13/22 (59% [36–79]§) | 0.162 (0.044–0.457) | 13/22 (59% [36–79]§) | 0.750 (0.149–5.264) | |
| BSID-III Head control for ≥3 s (Item 4) | Risdiplam† (FIREFISH) | 33/58 (57% [45–69]) | – | 46.60/58 (80% [55–97]) | – |
| Onasemnogene abeparvovec¶ (STR1VE-US) | 19/22 (86% [65–97]§) | 0.208 (0.029–0.709) | 19/22 (86% [65–97]§) | 0.645 (0.067–5.375) | |
| BSID-III Rolling back to sides (Item 20) | Risdiplam† (FIREFISH) | 27/58 (47% [34–60]) | – | 43.57/58 (75% [46–94]) | – |
| Onasemnogene abeparvovec¶ (STR1VE-US) | 13/22 (59% [36–79]§) | 0.603 (0.207–1.637) | 13/22 (59% [36–79]§) | 2.091 (0.425–13.725) | |
| BSID-III Standing with assistance (Item 33) | Risdiplam† (FIREFISH) | 3/58 (5% [0–12]) | – | 11.59/58 (20% [0–100]) | – |
| Onasemnogene abeparvovec¶ (STR1VE-US) | 1/22 (5% [0–23]§) | 1.146 (0.123–5.571) | 1/22 (5% [0–23]§) | 5.244 (0.352–1,677.000) | |
| CHOP-INTEND An improvement of ≥4 points | Risdiplam† (FIREFISH) | 52/58 (90% [81–97]) | – | 57.40/58 (99% [90–100]) | – |
| Onasemnogene abeparvovec¶ (STR1VE-US) | 19/22 (86% [65–97]§) | 1.368 (0.164–6.057) | 19/22 (86% [65–97]§) | 15.038 (0.697–18,366.512) | |
| CHOP-INTEND Achievement of ≥40 points | Risdiplam† (FIREFISH) | 33/58 (57% [45–69]) | – | 54.28/58 (94% [77–100]) | – |
| Onasemnogene abeparvovec¶ (STR1VE-US) | 19/22 (86% [65–97]§) | 0.208 (0.031–0.614) | 19/22 (86% [65–97]§) | 2.304 (0.233–54.091) | |
| Safety Any SAE | Risdiplam (FIREFISH) | 33/58 (57% [43–69]) | – | 26.58/58 (46% [19–75]) | – |
| Onasemnogene abeparvovec (STR1VE-US) | 10/22 (45% [24–68]§) | 1.584 (0.562–5.168) | 10/22 (45% [24–68]§) | 1.015 (0.225–5.075) | |
†
Achievement at 12 months from baseline visit.
‡
Achievement at the 18 months of age visit (12–15 months from baseline).
§
Clopper–Pearson CIs.
¶
Achievement by the 18 months of age visit.
Patients who died or discontinued the study prior to 18 months were considered non-responders. OR >1 favor risdiplam over comparator for efficacy outcomes; OR <1 favor risdiplam over comparator for safety outcomes. Bootstrap; N = 1000 samples.
BSID-III: Bayley Scales of Infant and Toddler Development, third edition; CHOP-INTEND: Children's Hospital of Philadelphia Infant Test of Neuromuscular Disorders; OR: Odds ratio; STC: Simulated treatment comparison.
Supplementary Table 8 presents estimated ORs for a unit increase in the covariates included in the regression models (age at initiation in months and baseline CHOP-INTEND score) for each of the BSID-III endpoints. The direction of the covariate effects were consistent with research on predictive factors [26]: odds decreased with older age at initiation and increased with better motor function.
STC analyses did not provide sufficient evidence to draw concrete conclusions on the relative efficacy between risdiplam and onasemnogene abeparvovec with regard to the achievement of the following motor milestones: sitting without support ≥30 s (OR: 0.75 [95% CI: 0.15–5.26]), head control for ≥3 s (OR: 0.65 [95% CI: 0.07–5.38]), rolling back to sides (OR: 2.09 [95% CI: 0.42–13.73]) and standing with assistance (OR: 5.24 [95% CI: 0.35–1677.00]).
Motor function (measured by the CHOP-INTEND scale)
For STR1VE-US, the proportions of patients with an improvement of ≥4 points in CHOP-INTEND total score, or those who achieved a score of ≥40 points were calculated from IPD at the last recorded visit when all infants were 18 months old [66]. Patients who discontinued from the study or died prior to the data cut were classified as non-responders in accordance with the analyses conducted in FIREFISH [18,19].
Age at first dose and baseline CHOP-INTEND scores were included as covariates in the STC models. The estimated ORs of a 1-month increase in age at first dose and a 1-point increase in baseline CHOP-INTEND score are summarized in Supplementary Table 9 for each endpoint. The direction of the covariate effects was consistent with research on predictive factors across the two models [36]: odds decreased with increasing age and increased with better motor function.
Across both CHOP-INTEND endpoints, there was insufficient evidence to draw concrete conclusions on the relative efficacy between risdiplam and onasemnogene abeparvovec (Table 5). STC analyses of CHOP-INTEND endpoints yielded an OR of 15.04 (95% CI: 0.70–18,366.51) for an improvement of ≥4 points and an OR of 2.30 (95% CI: 0.23–54.09) for an achievement of ≥40 points.
Safety
No prognostic or predictive factors previously identified were studied in relation to AEs [36]. However, to ensure consistency with the other endpoints, age at first dose and baseline CHOP-INTEND scores were included as covariates in the model. For SAEs, the estimated ORs for a 1-month increase in age at first dose and a 1-point increase in baseline CHOP-INTEND score were 1.09 (95% CI: 0.73–1.71) and 0.97 (95% CI: 0.89–1.05), respectively.
Analyses did not provide sufficient evidence to draw concrete conclusions on relative safety in terms of the frequency of SAEs between treatments. The OR of risdiplam versus onasemnogene abeparvovec was 1.02 (95% CI: 0.22–5.08) in the STC (Table 5).
Types 2 & 3 SMA
Two studies reported data in Types 2 and 3 (later-onset) SMA: SUNFISH, a two-part, Phase II/III, randomized, double-blind, placebo-controlled trial of risdiplam; and CHERISH, a Phase III, randomized, double-blind, sham-procedure controlled trial of nusinersen. Only data from Part 2 of the SUNFISH study were considered for the ITC, as Part 1 was only placebo controlled for 12 weeks.
IPD were available from SUNFISH and aggregated data were available from CHERISH. A connected network of risdiplam and nusinersen was available under the assumption of equivalency between oral placebo (SUNFISH) and sham procedure (CHERISH) (Supplementary Figure 2).
Endpoints of interest and feasibility for comparison are summarized in Supplementary Table 10. In SUNFISH Part 2, the primary study endpoint was the change from baseline in the 32-item Motor Function Measure (MFM32) total score at Month 12. MFM32 was not assessed in CHERISH and so could not be compared. In CHERISH, the primary study endpoint was the change from baseline in Hammersmith Functional Motor Scale – Expanded (HFMSE) total score at Month 15. HFMSE score was assessed in SUNFISH Part 2 as a secondary endpoint. The Revised Upper Limb Module (RULM) score was included as a secondary endpoint in both studies.
For SUNFISH Part 2, the 12-month primary data cut was available for the analyses (median [range] time on study: 429 [129–698] days). CHERISH was terminated early (median time on study unknown). The 15-month assessment was completed by 79% of patients in the nusinersen group and 81% of patients in the sham control group at the time of the final analysis [67]. Outcomes at 12 months were extracted from CHERISH for the indirect comparison analyses, where available.
Baseline characteristics of SUNFISH Part 2 and CHERISH trials are shown in Table 6. SUNFISH Part 2 enrolled a broader population in terms of age (range: 2–25 years vs 2–9 years in CHERISH) and enrolled many patients with a very low baseline HFMSE score (41% had a score of <10) and with presence of severe scoliosis (32%), who would have been excluded from CHERISH. CHERISH study entry criteria also excluded patients with severe contractures, yet they were permitted in SUNFISH. Because of the large heterogeneity in factors that are considered to be predictive of outcome, such as age, baseline motor function and presence of severe scoliosis, standard Bucher ITC comparing the full SUNFISH Part 2 population with CHERISH cannot be conducted. Hence, an anchored MAIC approach was chosen to reduce imbalances in effect modifiers between the two trials [35,68,69].
| Baseline characteristic | SUNFISH Part 2 | CHERISH | ||
|---|---|---|---|---|
| Risdiplam | Placebo | Nusinersen | Sham | |
| Sample size (ESS) | 120 | 60 | 84 | 42 |
| Gender (female, %) | 51 | 50 | 55 | 50 |
| Median age at screening, years (range) | 9.0 (2–25) | 9.0 (2–24) | 4.0 (2–9) | 3.0 (2–7) |
| Median age at symptom onset, months (range) | 12.3 (0–57) | 12.8 (6–135) | 10.0 (6–20) | 11.0 (6–20) |
| Median disease duration, months (range) | 95.8 (5–273) | 92.2 (0–266) | 39.3 (8–94) | 30.2 (10–80) |
| Mean HFMSE baseline score (SD) | 16.1 (12.5) | 16.6 (12.1) | 22.4 (8.3) | 19.9 (7.2) |
| Mean RULM baseline score (SD) | 19.6† (7.2) | 20.5‡ (6.6) | 19.4 (6.2) | 18.4 (5.7) |
| SMN2 copy number (%) | ||||
| – Two copies | 3% | 2% | 7% | 10% |
| – Three copies | 89% | 83% | 88% | 88% |
| – Four copies | 8% | 13% | 2% | 2% |
| – Unknown | 0% | 2% | 2% | 0% |
| Severe scoliosis (%) | 28% | 38% | 0%§ | 0%§ |
†
n = 119.
‡
n = 58.
§
CHERISH exclusion criterion.
ESS: Effective sample size; HFMSE: Hammersmith Function Motor Scale – Expanded; RULM: Revised Upper Limb Module; SD: Standard deviation.
In accordance with the two-step approach proposed by Signorovitch et al., patients who would not have been enrolled in the comparator trial were first excluded from the analysis set before conducting MAIC [70]. The SUNFISH analysis population was therefore selected to exclude patients >9 years of age at screening, patients with a baseline HFMSE score of <10, and patients with evidence of severe scoliosis. As a result, 68 SUNFISH patients remained in the analysis subset (Table 7).
| Baseline characteristic | Pre-matching: SUNFISH subset† | Post-matching (RULM baseline score): SUNFISH subset† | Post-matching (HFMSE baseline score): SUNFISH subset† | CHERISH | |||
|---|---|---|---|---|---|---|---|
| Risdiplam | Placebo | Risdiplam | Placebo | Risdiplam | Placebo | Average of nusinersen & sham | |
| Sample size (ESS) | 43 | 25 | 43 (28.3) | 25 (8.8) | 43 (34.2) | 25 (9.2) | 126 |
| Gender (female, %) | 53 | 44 | 61 | 43 | 60 | 46 | 53 |
| Mean age at screening, years | 5.0 | 5.3 | 3.7 | 3.7 | 4.1 | 3.7 | 3.7‡ |
| Mean age at symptom onset, months | 13.7 | 16.6 | 12.7 | 13.4 | 12.9 | 13.5 | 10.3‡ |
| Mean symptoms duration, months | 46.3 | 46.8 | 31.6 | 30.7 | 36.4 | 30.5 | 36.0‡ |
| Mean HFMSE baseline score | 24.21 | 23.12 | 21.99 | 22.36 | 22.41 | 21.57 | 21.57 |
| Mean RULM baseline score | 21.65 | 22.28 | 19.11 | 19.07 | 20.02 | 19.71 | 19.07 |
| Mean SMN2 copy number | 3.09 | 3.08 | 3.00 | 2.94 | 3.00 | 2.94 | 2.94 |
| Severe scoliosis (%) | 0 | 0 | 0 | 0 | 0 | 0 | 0 |
Matching factors are denoted in bold.
†
Defined as patients from SUNFISH Part 2 who were ≤9 years of age at screening, with an HFMSE baseline score of ≥10 and no severe scoliosis.
‡
In the absence of reported means, the average of the medians was used as a proxy for the purpose of these analyses.
ESS: Effective sample size; HFMSE: Hammersmith Function Motor Scale – Expanded; RULM: Revised Upper Limb Module.
After this first selection, some differences remained between the SUNFISH subset and CHERISH in terms of age, SMN2 copy number and HFMSE and RULM baseline scores; MAIC was therefore applied to this subset to further reduce imbalances. Age at screening, SMN2 copy number and baseline motor function were identified to be potential treatment-effect modifiers and selected as matching factors for the MAIC [36]. RULM score was used as a measure of baseline motor function for analyses of RULM and SAE endpoints; HFMSE score was used as a measure of baseline motor function for analysis of HFMSE endpoints. Matching was conducted on the average characteristics of both arms in CHERISH. Sensitivity analyses were conducted in the same SUNFISH subset using a Bucher ITC approach.
ITC 3: SUNFISH (2–9 years, HFMSE score ≥10 & no severe scoliosis subset) versus CHERISH
Post-matching baseline characteristics
Following matching adjustment, imbalances to CHERISH in terms of mean age at screening, mean baseline motor function score and mean SMN2 copy number were reduced, with only small numerical differences remaining (Table 7). Differences to CHERISH were also reduced for other characteristics that were not directly matched for, such as age at symptom onset and symptom duration. Although weighting resulted in a greater imbalance in gender, this has not been identified as a prognostic or predictive factor [36].
The total ESS of both arms was estimated to be 37.1 matching on RULM baseline score and 43.4 matching on HFMSE baseline score. Histograms showing the re-scaled weights in the placebo and risdiplam arms can be found in Supplementary Figure 5. The reduction in ESS was greater for the placebo group compared with the risdiplam group. Of note, in the placebo arm, ESS was reduced to <10, which may result in unstable estimates.
Motor function
Analyses of RULM endpoints are presented in Table 8. The 12-month RULM change from baseline in the matched placebo group of the SUNFISH subset was similar to that observed in the sham control arm in CHERISH (0.8 vs 0.7), indicating that matching adjustment was successful (Supplementary Figure 6A). The proportion of RULM responders (a change from baseline of ≥2 points) at Month 12 in the placebo arm in the weighted SUNFISH subset was also similar to that observed in the sham control arm in CHERISH (64 vs 56%).
| MAIC in SUNFISH subset† | Bucher ITC in SUNFISH subset† | ||||||||||
|---|---|---|---|---|---|---|---|---|---|---|---|
| Outcome | Comparator (STUDY) | ESS | Change from baseline | Difference against control | Mean difference against comparator (95% CI) | N | Change from baseline | Difference against control | Mean difference against comparator (95% CI) | ||
| Intervention | Control | Intervention | Control | ||||||||
| RULM change from baseline | Risdiplam (SUNFISH subset†) | 37.1 | 3.3 | 0.8 | 2.5 | -0.49 (-3.33 to 2.53)‡ | 68 | 3.6 | 1.2 | 2.4 | -0.60 (-2.24 to 1.22)§ |
| Nusinersen (CHERISH) | 126 | 3.7 | 0.7 | 3.0 | Reference | 126 | 3.7 | 0.7 | 3.0 | Reference | |
| Outcome | Comparator (STUDY) | ESS | Proportion responders | OR against control | OR against comparator (95% CI) | N | Proportion responders | OR against control | OR against comparator (95% CI) | ||
|---|---|---|---|---|---|---|---|---|---|---|---|
| Intervention | Control | Intervention | Control | ||||||||
| RULM responders¶ | Risdiplam (SUNFISH subset†) | 37.1 | 88% | 64% | 4.1 | 2.64 (0–117.94)‡ | 68 | 79% | 48% | 4.1 | 2.66 (0.76–12.74)§ |
| Nusinersen (CHERISH) | 118 | 66% | 56% | 1.5 | Reference | 118 | 66% | 56% | 1.5 | Reference | |
†
Defined as patients from SUNFISH Part 2 who were 2–9 years of age at screening, with HFMSE total score ≥10 at baseline and without severe scoliosis.
‡
N = 989/1000 successful bootstrap samples.
§
N = 1000 successful bootstrap samples.
¶
A change from baseline in RULM total score of ≥2 points.
OR >1 favor risdiplam over comparator.
ESS: Effective sample size; HFMSE: Hammersmith Functional Motor Scale – Expanded; ITC: Indirect treatment comparison; MAIC: Matching-adjusted indirect comparison; OR: Odds ratio; RULM; Revised Upper Limb Module.
Relative efficacy estimates of risdiplam versus nusinersen on RULM outcomes were surrounded by very wide CIs (mean difference in change from baseline: -0.49 [95% CI: -3.33 to 2.53]; OR on RULM response: 2.64 [95% CI: 0–117.94]) and provided insufficient evidence to draw concrete conclusions on relative efficacy. The Bucher ITC results were consistent with MAIC results for both endpoints (Table 8).
MAIC analysis of the HFMSE endpoint could not be successfully performed. Despite successful matching of the mean values of the three matching factors (age, baseline score, SMN2 copy number), the placebo arm of the SUNFISH subset and the sham control arm of CHERISH did not behave similarly (Supplementary Figure 6B). At Month 12, placebo arm outcomes in the weighted SUNFISH subset were higher than sham control outcomes in terms of both change from baseline (2.1 vs 0.2) and proportion of responders (49 vs 26%) (Supplementary Table 11). Anchored MAIC analyses assume comparability of the control arms. Since this assumption was violated, inferences on relative efficacy on HFMSE endpoints cannot be drawn.
Safety
Comparisons of SAEs are shown in Table 9. The proportions of patients reported to have any SAE in the placebo arm of the SUNFISH subset was 24% pre-matching and 12% post-matching, versus 29% in the sham control arm of CHERISH.
| Anchored MAIC in the SUNFISH subset† | Bucher ITC in the SUNFISH subset† | |||||||||
|---|---|---|---|---|---|---|---|---|---|---|
| Comparator (STUDY) | ESS | Proportion with any SAE | OR against control | OR against comparator (95% CI) | N | Proportion with any SAE | OR against control | OR against comparator (95% CI) | ||
| Intervention | Control | Intervention | Control | |||||||
| Risdiplam (SUNFISH subset†) | 34.2 | 24% | 12% | 2.2 | 4.32 (0.88– 37,615,888.28)‡ | 68 | 16% | 24% | 0.6 | 1.23 (0.25–5.76)§ |
| Nusinersen (CHERISH) | 126 | 17% | 29% | 0.5 | Reference | 126 | 17% | 29% | 0.5 | Reference |
†
Patients from SUNFISH Part 2 aged 2–9 years at screening, with HFMSE total score ≥10 at baseline and without severe scoliosis.
‡
N = 988/1000 successful bootstrap samples.
§
N = 1000 successful bootstrap samples. OR <1 favor risdiplam over comparator.
ESS: Effective sample size; HFMSE: Hammersmith Functional Motor Scale – Expanded; ITC: Indirect treatment comparison; MAIC: Matching-adjusted indirect comparison; OR: Odds ratio; SAE: Serious adverse event.
Results of the analyses provided insufficient evidence to draw concrete conclusions on the relative safety in terms of the likelihood of reporting SAEs between risdiplam and nusinersen (MAIC OR of 4.32 [95% CI: 0.88–37,615,888.28]). Estimates from the MAIC must be interpreted with caution, as the upper limit of the CI indicates that results are unstable. Estimates from the Bucher ITC may be less biased, given the smaller difference between control arm outcomes (24 vs 29%). Bucher ITC analysis yielded an OR of reporting any SAE for risdiplam versus nusinersen of 1.23 (95% CI: 0.25–5.76).
Discussion
As no head-to-head trials comparing the efficacy of treatments for SMA currently exist, we conducted ITCs to estimate the relative efficacy and safety of risdiplam relative to nusinersen and onasemnogene abeparvovec for commonly reported outcomes.
Type 1 SMA
Due to the lack of a connected network, risdiplam was compared in two separate instances with nusinersen (ENDEAR) and onasemnogene abeparvovec (STR1VE-US) using unanchored population-adjusted indirect comparison methodologies with known prognostic and predictive variables as matching factors (age at first dose, disease duration and baseline CHOP-INTEND score) [36].
Risdiplam versus nusinersen & BSC
In the comparison of FIREFISH with ENDEAR, study populations appeared to have similar baseline characteristics in terms of age and disease duration. However, FIREFISH patients had on average lower baseline motor function scores than patients in ENDEAR (baseline CHOP-INTEND score was 22 for risdiplam vs 27 for nusinersen). Re-weighting of the FIREFISH IPD to compare with the ENDEAR population strengthened the estimated differences in outcomes. Given that the two trial populations were similar in age and disease duration, unadjusted comparisons between risdiplam and nusinersen may be used.
Results from MAIC analyses versus ENDEAR suggested that risdiplam may prolong EFS and OS in infants with Type 1 SMA compared with nusinersen. Analyses also indicated that risdiplam may improve achievement of some motor milestones compared with nusinersen when assessed using HINE-2 (overall motor milestone response, sitting without support, full head control) or motor function assessed by CHOP-INTEND (patients who reach a score of ≥40 and those that improve by ≥4 points). In terms of the achievement of sitting with and without support and standing milestones, both the unadjusted comparison and MAIC found no evidence of differences between the two treatments. Analyses suggested improved results with nusinersen compared with risdiplam for the rolling milestone.
Analyses also suggested a lower likelihood of reporting SAEs with risdiplam compared with nusinersen, despite a longer follow-up for risdiplam (∼15 months in FIREFISH vs ∼9 months in ENDEAR). This finding may reflect better efficacy rather than safety, as the types of SAEs observed were similar across the trials.
Against BSC, analyses suggested superior efficacy with risdiplam with regards to survival, achievement of motor milestones, motor function and the incidence of SAEs.
Results presented in this report are consistent with a preliminary MAIC conducted using FIREFISH Part 1 data [71].
Risdiplam versus onasemnogene abeparvovec
Unadjusted comparison and MAIC were unsuitable to compare risdiplam with onasemnogene abeparvovec due to limited overlap in prognostic factors at baseline, largely driven by differences in the age at first dose and baseline CHOP-INTEND score. Infants in STR1VE-US started treatment at an earlier age (mean: 114 days vs 163 days) and with a better baseline motor function (a mean CHOP-INTEND score of 32 in STR1VE vs 22 in FIREFISH) than infants in FIREFISH. ESS was reduced to 2.1 patients following matching, rendering MAIC unfeasible.
STC analyses were therefore conducted as an alternative approach. In all STC models, point estimates for the effect of covariates were consistent with previously reported research on prognostic and predictive factors [36]: a later treatment onset impacted negatively on efficacy outcomes and a better baseline CHOP-INTEND score impacted positively on efficacy outcomes.
Results from the STC analyses did not provide sufficient evidence to draw concrete conclusions on the relative efficacy between the two treatments with regards to survival outcomes, motor function, achievement of motor milestones, and the incidence of SAEs, after adjusting for differences in age and baseline motor function score.
Types 2 & 3 SMA
Risdiplam versus nusinersen
A connected network was available to compare risdiplam (SUNFISH) and nusinersen (CHERISH) in later-onset SMA. Substantial heterogeneity between the trials precluded a comparison with the total SUNFISH Part 2 population, so anchored MAIC methodology was applied to adjust for imbalances in effect modifiers using age, baseline motor function score and SMN2 copy number as matching factors. Analyses were conducted on a subpopulation of 68 SUNFISH patients aged 2–9 years with baseline characteristics similar to the CHERISH population.
Upon matching, the control arms of SUNFISH and CHERISH showed similar responses with comparable improvements in RULM scores over the same time span, indicating a good match of patients for this endpoint. Due to very wide CIs, analyses provided insufficient evidence to draw concrete conclusions on the relative efficacy in terms of RULM change from baseline and RULM response between risdiplam and nusinersen.
Robust conclusions on the comparative efficacy on the HFMSE endpoints could not be drawn. Despite successful matching of baseline characteristics to CHERISH, the anchors did not show comparable improvements in HFMSE scores over time. Changes from baseline in HFMSE score were diverging for placebo versus sham control over time. The reason for this is unknown.
Analyses were also insufficient to draw concrete conclusions on the relative safety difference between risdiplam and nusinersen considering the likelihood of reporting SAEs.
ITCs of SMA treatments in the literature
Four studies have been identified in recent literature that have also attempted to compare treatments for SMA. These studies are limited to comparisons within Type 1 SMA [30–33].
Only one study included risdiplam in the comparison, and reported increased motor function benefits with onasemnogene abeparvovec compared with risdiplam and nusinersen [30]. However, these results came from an unadjusted comparison, which do not consider differences in prognostic factors between trial populations. Our analyses did not support these concrete conclusions on relative efficacy in motor function between onasemnogene abeparvovec and risdiplam when adjusting for differences in age and baseline motor function score.
All other studies limited the comparison to onasemnogene abeparvovec and nusinersen [31–33]. Two studies assigned greater efficacy and safety benefits to onasemnogene abeparvovec relative to nusinersen [31,33]. One was an unadjusted comparison that did not consider the heterogeneity across samples [31], and the other was a MAIC that only matched on CHOP-INTEND score and the proportion of infants requiring nutritional support [33]. The third study conducted a MAIC using a larger set of matching variables (age at first dose, age at symptom onset, weight/length at enrollment, gender and CHOP-INTEND score) and found no significant differences in survival outcomes between nusinersen and onasemnogene abeparvovec [32].
Our study is the first population-adjusted ITC to compare risdiplam with nusinersen and onasemnogene abeparvovec based on a comprehensive SLR of clinical trials and currently known prognostic factors and effect modifiers in SMA.
Limitations of ITC analyses
Our findings should be interpreted with consideration of certain limitations. Full study reports and access to patient-level data would have made the ITCs more robust. Availability of further outcome data relevant for treatment decision making (e.g. bulbar function, respiratory function, fatigability, patient-reported outcomes) and consistent outcome definitions would have facilitated additional and more complete ITCs. While analyses of aggregated SAE numbers were performed, this is not comparable to a full safety assessment of individual SAEs and it does not determine how comparable or manageable the SAEs were and how easily they resolved. We were unable to conduct a comparison of specific AEs.
Population-adjusted comparisons assume that prognostic factors (unanchored analyses) and effect modifiers (unanchored and anchored analyses) are similarly distributed in the matched evidence network; failure to identify such factors and account for imbalances may lead to biased estimation of relative effects. No prognostic or predictive factors previously identified were studied in relation to AEs [36], and so analyses were conducted on the same factors identified for efficacy outcomes. By adjusting to the comparator trial, inference on relative efficacy can only be made in the comparator trial population. No inference can be made on patient populations that have not been seen in the comparator trial.
Type 1 SMA
The disconnected evidence network in Type 1 SMA limited the choice of ITC methodologies, as standard adjusted indirect comparison methods require common comparators [69]. Population-adjustment methods were used to attempt to reduce biases resulting from study differences. MAIC methodology requires sufficient overlap in prognostic factors between study populations and therefore STC methodology had to be used to compare FIREFISH with STR1VE-US. Although STC allows for extrapolation of treatment effects beyond the IPD populations, the reduction of bias in the relative effect estimates depends on the validity of these extrapolations. MAICs and STCs only allow pairwise comparisons and therefore comparison of risdiplam with nusinersen and onasemnogene abeparvovec had to be conducted in separate instances. Multilevel network meta-regression is a novel method that allows incorporation of evidence from multiple studies and treatments in a single analysis [72]. While this method has yet to be applied to an unanchored ITC, the feasibility of applying this methodology in SMA may be assessed in future analyses.
While the choice of covariates for population-adjusted ITC was based upon known prognostic factors and effect modifiers, covariate selection was limited by what was reported as baseline characteristics. For example, disease duration was not available from STR1VE-US, so only age at first dose and baseline CHOP-INTEND score could be included as covariates in the STC. Infants in FIREFISH were older at their first treatment dose, so will have had a longer disease duration than the infants in the STR1VE-US study, which may have resulted in an underestimation of the risdiplam treatment effect by the STC. Although differences in baseline age and CHOP-INTEND score explain some of the variation in outcomes of FIREFISH patients, remaining unexplained variation could be in part attributable to differences in disease duration. In the MAIC of risdiplam versus nusinersen, it is possible that there may be imbalanced unreported factors that impact outcomes even though we adjusted for all imbalances in known prognostic factors and effect modifiers.
There were some differences in study design between the studies. FIREFISH and STR1VE-US were open-label studies while ENDEAR was an RCT. In open-label studies, effect sizes on subjective outcomes could be overestimated due to the lack of blinding [73]; however, this would not affect objective measures such as survival. We were also unable to compare the FIREFISH primary endpoint of sitting without support for ≥5 s as assessed by the BSID-III, as this was not assessed in ENDEAR or STR1VE-US.
BSID-III and CHOP-INTEND outcomes were assessed earlier in FIREFISH compared with STR1VE-US. The assessment time point for FIREFISH was the Month 12 visit, while the assessment time point for STR1VE-US was the visit at 18 months of age. As the mean age at first dose in STR1VE-US was 3.7 months, the visit at 18 months of age corresponds to ∼14 months (range: 12–18 months) of treatment with onasemnogene abeparvovec. We were not able to adjust for these differences as no risdiplam data with a longer follow-up were available at the time of the analyses.
STR1VE-US was conducted solely at sites within the USA while FIREFISH was a global study. Therefore, it is possible that differences in standards of care (SoC) between countries or genetic polymorphisms between populations may impact the results. A comparison with STR1VE-EU [29,47] and STR1VE-AP [46] studies once the final data have been released will improve understanding of comparative effectiveness in a global population.
SoC guidelines for SMA were updated in 2018 [74,75]. FIREFISH began in 2019 after these updates, while ENDEAR finished in 2016 [65]. It could be considered that improvements in survival observed in the MAIC were influenced by improvements in respiratory SoC. However, both studies recruited patients globally from a large number of specialized centers and were not conducted sufficiently far apart to expect significant improvements in survival. Furthermore, improvements with risdiplam were also seen consistently across motor function outcomes, which would not be impacted by proactive ventilatory support.
Types 2 & 3 SMA
Comparison between SUNFISH and CHERISH was limited by substantial differences in study enrollment criteria. SUNFISH enrolled a broader range of individuals than CHERISH, in terms of age (SUNFISH: 2–25 years; CHERISH: 2–9 years) and baseline functional score. In contrast to SUNFISH, CHERISH did not enroll patients with an HFMSE score <10, or patients with severe scoliosis and contractures, which are expected to impact treatment outcomes [76].
To minimize differences in study populations, a subset of SUNFISH patients, defined by CHERISH inclusion criteria (e.g. individuals ≤9 years of age with a baseline HFMSE score of ≥10 points and no severe scoliosis), was used for the analysis. Accordingly, inferences on relative efficacy of risdiplam and nusinersen can only be made in a small subset of patients with Types 2 and 3 SMA. No inferences can be made in populations that have not been seen in CHERISH (e.g., adolescents and adults or patients with severe scoliosis). MAIC methodology was applied to further reduce differences in baseline characteristics. This resulted in a small ESS of <10 in the SUNFISH placebo arm, which contributed to unstable estimates and very wide CIs. We also had to rely on the assumption of equivalency between oral placebo (SUNFISH) and sham procedure (CHERISH) to conduct this comparison.
Some differences in enrollment criteria could not be adjusted. For example, individuals with severe contractures that could interfere with the HFMSE assessment (according to the investigator) were not eligible for enrollment in CHERISH [67]. This exclusion criterion was not applied in SUNFISH. As the presence and severity of contractures were not systematically collected at baseline, it was not possible to exclude SUNFISH patients with severe contractures from the analysis. It is also possible that imbalances between risdiplam and placebo groups may have been introduced. For example, there was a slight imbalance in gender between risdiplam and placebo; however, gender was not identified as a treatment-effect modifier in SMA [36]. Results may still be biased due to imbalances in unknown effect modifiers; further heterogeneity might be due to gene expression and functional evolution of individuals with Types 2 and 3 SMA [77,78].
Comparability on HFMSE endpoints was limited by differences in placebo outcomes between the studies, despite alignment in baseline characteristics. In the placebo arm of the population-adjusted SUNFISH subset, the mean 12-month change from baseline in HFMSE total score was 1.9 points higher and the proportion of HFMSE responders at 12 months was double that of the sham control arm of CHERISH (Supplementary Table 11). This is not a limitation unique to this study; studies in other indications have faced similar issues and failed to reduce differences in placebo response using MAIC [79,80].
As a result of these limitations, we were unable to draw robust conclusions on the comparative efficacy or safety of risdiplam versus nusinersen in Types 2 and 3 SMA.
Conclusion
In Type 1 SMA, MAIC analysis showed significant improvements in survival and motor function, and a reduced likelihood of SAEs with risdiplam relative to nusinersen.
Due to substantial differences across study populations, no concrete conclusions could be drawn from the STC analyses of risdiplam versus onasemnogene abeparvovec in Type 1 SMA, or from the MAIC analysis of risdiplam versus nusinersen in Types 2 and 3 SMA.
Overall, these results support the use of risdiplam as a superior alternative to nusinersen for the treatment of patients with Type 1 SMA. Further analyses in other outcomes and populations (e.g, presymptomatic patients, adolescents and adults) with forthcoming evidence from clinical trials and real-world studies may provide additional evidence of comparative effectiveness.
•
Risdiplam, an oral SMN2 splicing modifier, is the latest disease-modifying therapy (DMT) for spinal muscular atrophy (SMA) approved by the FDA and EMA. Two other DMTs have also been approved: the intrathecal splicing modifier nusinersen and the intravenous gene therapy onasemnogene abeparvovec.
•
In the absence of head-to-head randomized controlled trials to compare efficacy and safety of treatments, we conducted indirect treatment comparisons to provide estimates of relative effects of efficacy and safety of treatments approved for SMA.
•
Indirect comparisons assume that prognostic factors (unanchored analyses) and effect modifiers (unanchored and anchored analyses) are similarly distributed in the matched evidence network; failure to identify such factors and account for imbalances may lead to biased estimation of relative effects.
•
Only evidence from disconnected networks was available for Type 1 SMA treatments and therefore, population adjustment methodologies were used to compare treatments.
•
For Type 1 SMA, results from a matching-adjusted indirect comparison (MAIC) of risdiplam (FIREFISH) with nusinersen (ENDEAR) suggested greater improvements in survival and motor function endpoints with risdiplam, as well as a lower frequency of serious adverse events.
•
MAIC of risdiplam (FIREFISH) with onasemnogene abeparvovec (STR1VE-US) was not possible due to limited overlap between patient populations. STC analysis was applied as an alternative methodology.
•
Indirect treatment comparison of FIREFISH and STR1VE-US provided insufficient evidence to draw concrete conclusions on relative efficacy and safety of risdiplam and onasemnogene abeparvovec in infants with Type 1 SMA.
•
A connected network was available for the Types 2 and 3 SMA analysis. Considerable heterogeneity existed across the risdiplam (SUNFISH) and nusinersen (CHERISH) trials, and therefore anchored MAIC methodology was applied in a pediatric subset of patients with Types 2 and 3 SMA that was similar to the CHERISH-enrolled population (2–9 years, no severe scoliosis, Hammersmith Functional Motor Scale – Expanded score ≥10).
•
Indirect comparison analysis did not provide sufficient evidence to draw concrete conclusions on relative efficacy and safety between risdiplam and nusinersen in Types 2 and 3 SMA.
•
This population-adjusted indirect comparison analysis supports risdiplam as a superior alternative to nusinersen in Type 1 SMA.
Author contributions
V Aponte Ribero was responsible for data analysis and contributed to interpretation. M Daigl was responsible for the planning and design of the study and analyses and contributed to their interpretation. Y Martí was responsible for the planning and design of the systematic literature review. K Gorni was responsible for the clinical input in the design and the interpretation of the data. R Evans helped in conceiving and designing the analysis; performed analysis. DA Scott helped in conceiving and designing the analysis and contributed to interpretation. A Mahajan was responsible for study implementation including execution of searches and data extraction. KR Abrams was responsible for study conception, designing the analysis and interpretation. N Hawkins was responsible for study conception, designing the analysis and interpretation.
Acknowledgments
The authors would like to thank the staff of the Spinal Muscular Atrophy Foundation and PTC Therapeutics for their collaboration on the FIREFISH and SUNFISH studies; all the patients and families who participated in the risdiplam program and the staff of the clinical trial sites around the world for their ongoing partnership and assistance.
Financial & competing interests disclosure
The systematic literature review and data extraction were conducted by Bridge Medical Consulting Ltd., London, UK and funded by F. Hoffmann-La Roche Ltd., Basel, Switzerland. Indirect treatment comparison analyses were designed by Visible Analytics, UK, funded by F. Hoffmann-La Roche Ltd. V Aponte Ribero, M Daigl, Y Martí and K Gorni are employees of and are stockholders in F. Hoffmann La Roche Ltd. R Evans, DA Scott, KR Abrams and N Hawkins are partners/employees of Visible Analytics Ltd., which designed the analysis and received consultancy fees and expenses from F. Hoffmann-La Roche Ltd. A Mahajan is an employee of Bridge Medical Consulting Ltd., which conducted this review and received consultancy fees and expenses from F. Hoffmann-La Roche Ltd. The authors have no other relevant affiliations or financial involvement with any organization or entity with a financial interest in or financial conflict with the subject matter or materials discussed in the manuscript apart from those disclosed.
Medical writing support was provided by Lauren Walmsley, PhD, of MediTech Media, UK, and was funded by F. Hoffmann-La Roche Ltd., in accordance with Good Publication Practice (GPP3) guidelines (http://www.ismpp.org/gpp3).
Data sharing statement
This manuscript reports data from a secondary analysis of the data collected in the FIREFISH (NCT02913482) and SUNFISH (NCT02908685) clinical trials. Data are available upon request.
Qualified researchers may request access to individual patient level data through the clinical study data request platform (https://vivli.org/). Further details on Roche's criteria for eligible studies are available here: https://vivli.org/members/ourmembers/. For further details on Roche's Global Policy on the Sharing of Clinical Information and how to request access to related clinical study documents, see here: (https://www.roche.com/research_and_development/who_we_are_how_we_work/clinical_trials/our_commitment_to_data_sharing.htm).
Open access
This work is licensed under the Attribution-NonCommercial-NoDerivatives 4.0 Unported License. To view a copy of this license, visit http://creativecommons.org/licenses/by-nc-nd/4.0/
Supplementary Material
File (statistical analysis plan.pdf)
- Download
- 1.47 MB
File (supplemental figure 1.ai)
- Download
- 279.85 KB
File (supplemental figure 2.ai)
- Download
- 258.99 KB
File (supplemental figure 3.ai)
- Download
- 120.34 KB
File (supplemental figure 4.ai)
- Download
- 1.03 MB
File (supplemental figure 5.ai)
- Download
- 98.71 KB
File (supplemental figure 6.ai)
- Download
- 88.43 KB
File (supplementary tables.docx)
- Download
- 50.18 KB
References
Papers of special note have been highlighted as: •• of considerable interest
1.
Verhaart IEC, Robertson A, Wilson IJ et al. Prevalence, incidence and carrier frequency of 5q-linked spinal muscular atrophy – a literature review. Orphanet J. Rare Dis. 12(1), 124 (2017).
2.
D'amico A, Mercuri E, Tiziano FD, Bertini E. Spinal muscular atrophy. Orphanet J. Rare Dis. 6, 71 (2011).
3.
Lefebvre S, Burglen L, Reboullet S et al. Identification and characterization of a spinal muscular atrophy-determining gene. Cell 80(1), 155–165 (1995).
4.
Burghes AH. When is a deletion not a deletion? When it is converted. Am. J. Hum. Genet. 61(1), 9–15 (1997).
5.
Lorson CL, Hahnen E, Androphy EJ, Wirth B. A single nucleotide in the SMN gene regulates splicing and is responsible for spinal muscular atrophy. Proc. Natl Acad. Sci. USA 96(11), 6307–6311 (1999).
6.
Prior TW. Perspectives and diagnostic considerations in spinal muscular atrophy. Genet. Med. 12, 145–152 (2010).
7.
Singh RN, Howell MD, Ottesen EW, Singh NN. Diverse role of survival motor neuron protein. Biochim. Biophys. Acta Gene Regul. Mech. 1860(3), 299–315 (2017).
8.
Munsat TL, Davies KE. International SMA consortium meeting. (26–28 June 1992, Bonn, Germany). Neuromusc. Disord. 2(5–6), 423–428 (1992).
9.
Dubowitz V. Very severe spinal muscular atrophy (SMA type 0): an expanding clinical phenotype. Eur. J. Paediatr. Neurol. 3(2), 49–51 (1999).
10.
Finkel RS, Mcdermott MP, Kaufmann P et al. Observational study of spinal muscular atrophy type I and implications for clinical trials. Neurology 83(9), 810–817 (2014).
11.
Mercuri E, Bertini E, Iannaccone ST. Childhood spinal muscular atrophy: controversies and challenges. Lancet Neurol. 11(5), 443–452 (2012).
12.
Kaufmann P, Mcdermott MP, Darras BT et al. Observational study of spinal muscular atrophy type 2 and 3: functional outcomes over 1 year. Arch. Neurol. 68(6), 779–786 (2011).
13.
Farrar MA, Vucic S, Johnston HM, Du Sart D, Kiernan MC. Pathophysiological insights derived by natural history and motor function of spinal muscular atrophy. J. Pediatrics 162(1), 155–159 (2013).
14.
Monani UR, De Vivo DC. Neurodegeneration in spinal muscular atrophy: from disease phenotype and animal models to therapeutic strategies and beyond. Future Neurol. 9(1), 49–65 (2014).
15.
Ratni H, Ebeling M, Baird J et al. Discovery of risdiplam, a selective survival of motor neuron-2 (SMN2) gene splicing modifier for the treatment of spinal muscular atrophy (SMA). J. Med. Chem. 61(15), 6501–6517 (2018).
16.
EVRYSDI(R) Highlights of prescribing information. https://www.accessdata.fda.gov/drugsatfda_docs/label/2020/213535s000lbl.pdf (September).
17.
Evrysdi (risdiplam) EMA prescribing information. https://www.ema.europa.eu/en/documents/product-information/evrysdi-epar-product-information_en.pdf (May).
18.
Baranello G, Darras BT, Day JW et al. Risdiplam in Type 1 spinal muscular atrophy. N. Engl. J. Med. 384(10), 915–923 (2021).
•• Reports the primary data from Part 1 of the FIREFISH trial, an open-label clinical trial of risdiplam in Type 1 SMA.
19.
Darras BT, Masson R, Mazurkiewicz-Bełdzińska M et al. Risdiplam-treated infants with Type 1 spinal muscular atrophy versus historical controls. N. Engl. J. Med. 385(5), 427–435 (2021).
•• Reports the primary data from an open-label clinical trial of risdiplam in early-onset (Type 1) SMA (FIREFISH Part 2).
20.
Mercuri E, Deconinck N, Mazzone E et al. Safety and efficacy of once-daily risdiplam in Type 2 and non-ambulant Type 3 spinal muscular atrophy: a Phase III, double-blind, randomised, placebo-controlled trial. Lancet Neurol., (2021).
•• Reports the primary data from a randomized, double-blind, placebo-controlled clinical trial of risdiplam in Type 2 and non-ambulant Type 3 SMA (SUNFISH Part 2).
21.
SPINRAZA® (nusinersen) EMA prescribing information. http://www.ema.europa.eu/docs/en_GB/document_library/EPAR_-_Product_Information/human/004312/WC500229704.pdf (November).
22.
SPINRAZA® (nusinersen) US prescribing information. https://www.accessdata.fda.gov/drugsatfda_docs/label/2016/209531lbl.pdf (November).
23.
NCT02193074: a study to assess the efficacy and safety of ISIS-SMNRx in infants with spinal muscular atrophy (ENDEAR). https://clinicaltrials.gov/ct2/show/NCT02193074 (July).
24.
NCT02292537: a study to assess the efficacy and safety of nusinersen (ISIS 396443) in participants with later-onset spinal muscular atrophy (SMA) (CHERISH). https://clinicaltrials.gov/ct2/show/NCT02292537 (Accessed December 2020).
25.
ZOLGENSMA® (onasemnogene abeparvovec-xioi) US prescribing information. https://www.fda.gov/media/126109/download (November).
26.
ZOLGENSMA® (onasemnogene abeparvovec-xioi). https://www.ema.europa.eu/en/medicines/human/EPAR/zolgensma (November).
27.
Mendell J. Single-dose gene-replacement therapy for spinal muscular atrophy. N. Engl. J. Med. 377, 1713–1722 (2017).
28.
Mendell JR, Al-Zaidy SA, Lehman KJ et al. Five-Year Extension Results of the Phase 1 START Trial of Onasemnogene Abeparvovec in Spinal Muscular Atrophy. JAMA Neurol. 78(7), 834–841 (2021).
29.
Day JW, Finkel RS, Chiriboga CA et al. Onasemnogene abeparvovec gene therapy for symptomatic infantile-onset spinal muscular atrophy in patients with two copies of SMN2 (STR1VE): an open-label, single-arm, multicentre, Phase III trial. Lancet Neurol. 20(4), 284–293 (2021).
•• This study reports the primary data from an open-label clinical trial of onasemnogene abeparvovec in early-onset (Type 1) SMA (STR1VE-US).
30.
Finkel RS, Dabbous O, Arjunji R et al. P.060 Time to treatment effect in spinal muscular atrophy Type 1 (SMA1): an indirect comparison of treatments. Can. J. Neurologic. Sci. 46, S30 (2019).
31.
Dabbous O, Maru B, Jansen JP et al. Survival, motor function, and motor milestones: comparison of AVXS-101 relative to nusinersen for the treatment of infants with spinal muscular atrophy Type 1. Adv. Ther. 36(5), 1164–1176 (2019).
32.
Liao S, Bohn J, De Moor C, Xaplanteris X, Farwell W, Padaris A. PR109 a cautionary tale for indirect treatment comparisons: an example from infantile-onset spinal muscular atrophy. Value Health 23, (2020).
33.
Bischof M, Lorenzi M, Lee J, Druyts E, Balijepalli C, Dabbous O. Matching-adjusted indirect treatment comparison of onasemnogene abeparvovec and nusinersen for the treatment of symptomatic patients with spinal muscular atrophy Type 1. Curr. Med. Res. Opin. (2021) (Epub ahead of print).
34.
Bucher HC, Guyatt GH, Griffith LE, Walter SD. The results of direct and indirect treatment comparisons in meta-analysis of randomized controlled trials. J. Clin. Epidemiol. 50(6), 683–691 (1997).
35.
Phillippo DM, Ades AE, Dias S, Palmer S, Abrams KR, Welton NJ. NICE DSU technical document 18: methods for population-adjusted indirect comparisons in submissions to NICE. (2016).
36.
Baranello G, Gorni K, Daigl M et al. Prognostic factors and treatment-effect modifiers in spinal muscular atrophy. Clin. Pharmacol. Therapeut., (2021) (Epub ahead of print).
•• Reports on the prognostic and predictive factors and treatment-effect modifiers for Types 1–3 SMA through a systematic literature review.
37.
Glanzman AM, Mazzone E, Main M et al. The Children's Hospital of Philadelphia Infant Test of Neuromuscular Disorders (CHOP INTEND): test development and reliability. Neuromusc. Disord. 20, 155–161 (2010).
38.
Pechmann A, Langer T, Schorling D et al. Evaluation of children with SMA Type 1 under treatment with nusinersen within the expanded access program in Germany. J. Neuromuscul. Dis. 5(2), 135–143 (2018).
39.
Annoussamy M, Seferian A, Daron A et al. Natural history of Type 2 and 3 spinal muscular atrophy: 2-year NatHis-SMA study. Ann. Clin. Transl. Neurol. 8(2), 359–373 (2021).
40.
Mercuri E, Lucibello S, Perulli M et al. Longitudinal natural history of Type I spinal muscular atrophy: a critical review. Orphanet J. Rare Dis. 15(1), 84 (2020).
41.
Haaker G, Fujak A. Proximal spinal muscular atrophy: current orthopedic perspective. App. Clin. Genet. 6(11), 113–120 (2013).
42.
NCT02913482: a study to investigate the safety, tolerability, pharmacokinetics, pharmacodynamics and efficacy of RO7034067 in infants with Type 1 spinal muscular atrophy (FIREFISH). https://clinicaltrials.gov/ct2/show/NCT02913482 (July).
43.
NCT03306277: gene replacement therapy clinical trial for patients with spinal muscular atrophy Type 1 (STR1VE-US). https://clinicaltrials.gov/ct2/show/NCT03306277?term=AVXS-101&rank=2 (July).
44.
NCT01839656: a study to assess the safety and pharmacokinetics of ISIS SMNRx in infants with spinal muscular atrophy. https://clinicaltrials.gov/ct2/show/NCT01839656
45.
NCT02122952: gene transfer clinical trial for spinal muscular atrophy Type 1. https://clinicaltrials.gov/ct2/show/NCT02122952 (July).
46.
NCT03837184: single-dose gene replacement therapy using for patients with spinal muscular atrophy Type 1 with one or two SMN2 copies (STR1VE-AP). https://clinicaltrials.gov/ct2/show/NCT03837184?term=NCT03837184&draw=2&rank=1 (Accessed 2020).
47.
NCT03461289: single-dose gene replacement therapy clinical trial for patients with spinal muscular atrophy Type 1 (STRIVE-EU). https://clinicaltrials.gov/ct2/show/NCT03461289?term=NCT03461289&draw=2&rank=1 (Accessed 2020).
48.
NCT02268552: an open-label study of LMI070 in Type 1 spinal muscular atrophy (SMA). https://clinicaltrials.gov/ct2/show/NCT02268552
49.
NCT02908685: a study to investigate the safety, tolerability, pharmacokinetics, pharmacodynamics and efficacy of RO7034067 in Type 2 and 3 spinal muscular atrophy participants (SUNFISH). https://clinicaltrials.gov/ct2/show/NCT02908685 (July).
50.
Darras B, Chiriboga C, Swoboda K et al. Results of a Phase 2 study of ISIS-SMNRx in children with spinal muscular atrophy. Neuromusc. Disord. 24(9–10), 920 (2014).
51.
Chiriboga CA, Swoboda KJ, Darras BT et al. Results from a Phase 1 study of nusinersen (ISIS-SMNRx) in children with spinal muscular atrophy. Neurology 86(10), 890–897 (2016).
52.
NCT01703988: an open-label safety, tolerability and dose-range finding study of multiple doses of ISIS SMNRx in patient with spinal muscular atrophy (SMNRx - CS2). https://clinicaltrials.gov/ct2/show/NCT01703988
53.
NCT02052791: an open-label safety and tolerability study of nusinersen (ISIS 396443) in participants with spinal muscular atrophy (SMA) who previously participated in ISIS 396443-CS2 (NCT01703988) or ISIS 396443-CS10 (Accessed August 2020).
54.
NCT01302600: safety and efficacy of olesoxime (TRO19622) in 3–25 years SMA patients. https://clinicaltrials.gov/ct2/show/NCT01302600 (Accessed June 2020).
55.
NCT03032172: a study of RO7034067 in adult and pediatric participants with spinal muscular atrophy (JEWELFISH). https://clinicaltrials.gov/ct2/show/NCT03032172 (July).
56.
NCT03921528: an active treatment study of SRK-015 in patients with Type 2 or Type 3 spinal muscular atrophy (TOPAZ). https://clinicaltrials.gov/ct2/show/NCT03921528 (Accessed September 2020).
57.
NCT04089566: study of nusinersen (BIIB058) in participants with spinal muscular atrophy (DEVOTE). https://www.clinicaltrials.gov/ct2/show/NCT04089566
58.
NCT02462759: a study to assess the safety and tolerability of nusinersen (ISIS 396443) in participants with spinal muscular atrophy (SMA). (EMBRACE). https://www.clinicaltrials.gov/ct2/show/NCT02462759 (Accessed July 2021).
59.
NCT02594124: a study for participants with spinal muscular atrophy (SMA) who previously participated in nusinersen (ISIS 396443) investigational studies. (SHINE). https://clinicaltrials.gov/ct2/show/NCT02594124 (July).
60.
NCT04042025: long-term follow-up study of patients receiving onasemnogene abeparvovec-xioi. https://www.clinicaltrials.gov/ct2/show/NCT04042025 (Accessed July 2021).
61.
Rudnicki S, Andrews J, Malik F, Wolff A, Day. CK-2127107 a selective activator of the fast skeletal muscle troponin complex, for the potential treatment of spinal muscular atrophy. Amyotroph. Lateral Scler. Frontotemporal Degener. 17(1), 241 (2016).
62.
NCT02628743: a study to evaluate long term safety, tolerability, and effectiveness of olesoxime in patients with spinal muscular atrophy. https://clinicaltrials.gov/ct2/show/NCT02628743 (November).
63.
NCT03381729: study of intrathecal administration of AVXS-101 for spinal muscular atrophy (STRONG). https://clinicaltrials.gov/ct2/show/NCT03381729?term=strong&cond=Spinal+Muscular+Atrophy&rank=1
64.
Day J, Chiriboga C, Crawford T et al. P.349Onasemnogene abeparvovec gene-replacement therapy (GRT) for spinal muscular atrophy Type 1 (SMA1): pivotal Phase III study (STR1VE) update. Neuromusc. Disord. 29, S183 (2019).
65.
Finkel RS, Mercuri E, Darras BT et al. Nusinersen versus sham control in infantile-onset spinal muscular atrophy. N. Engl. J. Med. 377(18), 1723–1732 (2017).
•• Reports the primary data from a randomized, sham-controlled clinical trial of nusinersen in early-onset (Type 1) SMA (ENDEAR).
66.
European Medicines Agency CFMPFHU, Committee for Advanced Therapies. Assessment report: zolgensma (2020). https://www.ema.europa.eu/en/documents/assessment-report/zolgensma-epar-public-assessment-report_en.pdf
67.
Mercuri E, Darras BT, Chiriboga CA et al. Nusinersen versus sham control in later-onset spinal muscular atrophy. N. Engl. J. Med. 378, 625–635 (2018).
•• Reports the primary data from a randomized, sham-controlled clinical trial of nusinersen in later-onset (Types 2 and 3) SMA (CHERISH).
68.
Signorovitch JE, Wu EQ, Yu AP et al. Comparative effectiveness without head-to-head trials: a method for matching-adjusted indirect comparisons applied to psoriasis treatment with adalimumab or etanercept. Pharmacoeconomics 28(10), 935–945 (2010).
69.
Phillippo DM, Ades AE, Dias S, Palmer S, Abrams KR, Welton NJ. Methods for population-adjusted indirect comparisons in health technology appraisal. Med. Decis. Making 38(2), 200–211 (2018).
70.
Signorovitch JE, Sikirica V, Erder MH et al. Matching-adjusted indirect comparisons: a new tool for timely comparative effectiveness research. Value Health 15(6), 940–947 (2012).
71.
Daigl M, Kotzeva A, Gorni K et al. PRO12: how does risdiplam compare in infantile-onset spinal muscular atrophy (SMA)? Preliminary indirect treatment comparisons based on FIREFISH Part 1 data. Value Health 22, S843 (2019).
72.
Phillippo DM, Dias S, Ades AE et al. Multilevel network meta-regression for population-adjusted treatment comparisons. J. R. Stat. Soc. Ser. A Stat. Soc. 183(3), 1189–1210 (2020).
73.
Wood L, Egger M, Gluud LL et al. Empirical evidence of bias in treatment effect estimates in controlled trials with different interventions and outcomes: meta-epidemiological study. BMJ 336(7644), 601–605 (2008).
74.
Mercuri E, Finkel RS, Muntoni F et al. Diagnosis and management of spinal muscular atrophy: Part 1: Recommendations for diagnosis, rehabilitation, orthopedic and nutritional care. Neuromusc. Disord. 28(2), 103–115 (2018).
75.
Finkel RS, Mercuri E, Meyer OH et al. Diagnosis and management of spinal muscular atrophy: Part 2: Pulmonary and acute care; medications, supplements and immunizations; other organ systems; and ethics. Neuromusc. Disord. 28(3), 197–207 (2018).
76.
Mercuri E, Lucibello S, Pera MC et al. Long-term progression in type II spinal muscular atrophy: a retrospective observational study. Neurology 93(13), e1241–e1247 (2019).
77.
Merlini L, Bertini E, Minetti C et al. Motor function-muscle strength relationship in spinal muscular atrophy. Muscle Nerve 29(4), 548–552 (2004).
78.
Millino C, Fanin M, Vettori A et al. Different atrophy-hypertrophy transcription pathways in muscles affected by severe and mild spinal muscular atrophy. BMC Med. 7, 14 (2009).
79.
Swallow E, Fang A, Signorovitch JE, Plumb J, Borghs S. Can matching-adjusted indirect comparison methods mitigate placebo response differences among patient populations in adjunctive trials of brivaracetam and levetiracetam? CNS Drugs 31(10), 899–910 (2017).
80.
Cooper M, Kilvert H, Hodgkins P, Roskell N, Eldar-Lissai A. Using matching-adjusted indirect comparisons and network meta-analyses to compare efficacy of brexanolone injection with selective serotonin reuptake inhibitors for treating postpartum depression. CNS Drugs 33(10), 1039–1052 (2019).
Information & Authors
Information
Published In
Pages: 347 - 370
PubMed: 35040693
Copyright
© 2022 F. Hoffmann-La Roche Ltd. This work is licensed under the Attribution-NonCommercial-NoDerivatives 4.0 Unported License
History
Received: 10 September 2021
Accepted: 14 December 2021
Published online: 18 January 2022
Keywords:
Topics
Authors
Funding Information
Metrics & Citations
Metrics
Article Usage
Article usage data only available from February 2023. Historical article usage data, showing the number of article downloads, is available upon request.
Citations
How to Cite
How does risdiplam compare with other treatments for Types 1–3 spinal muscular atrophy: a systematic literature review and indirect treatment comparison. (2022) Journal of Comparative Effectiveness Research. DOI: 10.2217/cer-2021-0216
Export citation
Select the citation format you wish to export for this article or chapter.
Citing Literature
- Eugenio Mercuri, Richard S. Finkel, Francesco Muntoni, Ten years of disease-modifying therapy in spinal muscular atrophy: lessons learned and future directions, Nature Reviews Neurology, 10.1038/s41582-026-01224-9, (2026).
- Sumaya Abuloha, Amie Goodin, Tianze Jiao, Manuela Corti, Mikael Svensson, Modeling the Budget Impact of Disease-Modifying Therapies in Infantile-Onset Spinal Muscular Atrophy, Clinical Drug Investigation, 10.1007/s40261-026-01571-x, 46, 8, (883-896), (2026).
- undefined Dushyant, Smita Narwal, Vishakha Saini, Ashwani K. Dhingra, Jagdeep Singh, undefined Jasmeen, Rupa Devi, undefined Shabnam, Artificial Intelligence in Pharmaceutical Drug Development: Transforming Formulation and Innovation, Current Drug Discovery Technologies, 10.2174/0115701638388052250724070324, 23, 4, (2026).
- A. V. Makarova, A. A. Pershin, A. Yu. Mushkin, Neuromuscular scoliosis in children: surgical treatment and lung function (analytical and systematic review), Russian Journal of Spine Surgery (Khirurgiya Pozvonochnika), 10.14531/ss2026.1.36-47, 23, 1, (36-47), (2026).
- Lotte Delemarre, Isabelle Huys, Walter Van Dyck, Steven Simoens, Addressing clinical uncertainties in ATMP reimbursement: a review of methodological guidelines and European practice, Frontiers in Pharmacology, 10.3389/fphar.2026.1749386, 17, (2026).
- Svenja Neuhoff, Benjamin Stolte, Jaqueline Lipka, Melina Schlag, Refik Pul, Linda-Isabell Schmitt, Markus Leo, Jelena Skuljec, Cornelius Deuschl, Michael Forsting, Christoph Kleinschnitz, Tim Hagenacker, Matched-pair analysis of motor outcomes in adults with spinal muscular atrophy on nusinersen vs. risdiplam, Journal of Neurology, 10.1007/s00415-025-13589-w, 273, 1, (2026).
- Jing Zhang, Baowei Wang, Jing He, Lina Zhu, Xiaoli Dong, Effects of physical therapy on motor ability in patients with spinal muscular atrophy III: a study protocol for a randomised controlled trial, BMJ Open, 10.1136/bmjopen-2025-104675, 15, 12, (e104675), (2025).
- Claudia Weiß, Katharina Vill, Matthias Baumann, Günther Bernert, Astrid Blaschek, Astrid Eisenkölbl, Marina Flotats-Bastardas, Johannes Friese, Claudia Ganter, Klaus Goldhahn, Andreas Hahn, Maja von der Hagen, Hans Hartmann, Oswald Hasselmann, Veronka Horber, Ralf A Husain, Sabine Illsinger, David Jacquier, Jessika Johannsen, Cornelia Köhler, Heike Kölbel, Michael Kolodzig, Andrea Klein, Astrid Pechmann, Arpad von Moers, Wolfgang Müller-Felber, Christian Rauscher, Ulrike Schara-Schmidt, Gudrun Schreiber, Oliver Schwartz, Joachim Sproß, Georg M Stettner, Corinna Stoltenburg, Eva Stumpe, Regina Trollmann, Gert Wiegand, Ekkehard Wilichowski, Janbernd Kirschner, Andreas Ziegler, Delphi consensus on gene therapy of spinal muscular atrophy with onasemnogene abeparvovec in Germany, Austria and Switzerland—part I—systematic literature review and existing evidence, Journal of Neuromuscular Diseases, 10.1177/22143602251387019, 13, 3, (420-435), (2025).
- Sheffali Gulati, Anzeen Nazir Kanth, Ashwin Dalal, Monika Chhajed, Nehal Patel, Shrikant Jamdade, Surya Prabha, Vineeth Jaison, KN Vykunta Raju, Ajit Singh Baghel, Alpana Konderkar, Ann Agnes Mathew, Gurpreet Singh Kochar, Harsh Patel, Harshuti Shah, Ilin Kinimi, Jasodhara Chaudhury, AS Jyotsna, M Ranjith Kumar, Mary Iype, Mayank Nilay, Mayank Shrivastava, Neelu Desai, Praveen Kumar, Priyanka Madaan, Rahul Badheka, Rajni Farmania, Renu Suthar, Sakshi Ojha, Sanjukta De, Shikha Jain, Sidharth Shah, Smilu Mohan Lal, VY Vishnu, Aradhana Dwivedi, Spinal muscular atrophy in India: Patient journey, access to care, treatment barriers, and strategic recommendations: Insights from experts, Journal of Neuromuscular Diseases, 10.1177/22143602251386118, 13, 4, (573-586), (2025).
- Arianna Vezzoli, Daniele Bottai, Raffaella Adami, Managing Spinal Muscular Atrophy: A Look at the Biology and Treatment Strategies, Biology, 10.3390/biology14080977, 14, 8, (977), (2025).
- See more