Real-world treatment, clinical outcomes and healthcare resource utilization among persons with hemophilia A by age
Publication: Journal of Comparative Effectiveness Research
Abstract
Aim: Examine real-world characteristics, treatment patterns, and outcomes among treated persons with hemophilia A (PwHA) stratified by age. Patients & methods: This study utilized US claims data from 1 January 2007–31 July 2018 from the Humana Research Database. Unadjusted comparisons were conducted across PwHA (<18, 18–55, 56–89 years) enrolled in commercial or Medicare Advantage Prescription Drug plans. Results: A total of 294 PwHA were identified; 21.1% experienced ≥1 bleeding event, and 41.2 and 53.1% had evidence of arthropathy or related disorders, and pain, respectively. Along with all-cause and hemophilia-related healthcare resource utilization (HCRU), these were highest among PwHA aged 56–89 years. Conclusion: Insights into treatment, outcomes and HCRU may identify opportunities for enhanced disease management, particularly in older PwHA.
Congenital hemophilia A is an inherited bleeding disorder, mostly affecting males, resulting in insufficient endogenous production of clotting factor VIII (FVIII). In USA, approximately 20,000 individuals are thought to be living with hemophilia [1]. While no cure exists for hemophilia A, several treatments are available.
The mainstay hemophilia A treatment is intravenous concentrated FVIII, either as an on-demand regimen for acute bleeds or prophylaxis for bleeding prevention. Other nonfactor treatments may include desmopressin, emicizumab or bypassing agents. Persons with hemophilia A (PwHA), particularly those with exposure to FVIII replacement, are at risk of developing an antibody, called an inhibitor, which then renders FVIII treatment ineffective. Inhibitors are estimated to develop in approximately one in five patients [2].
Overall life expectancy for PwHA, particularly for those with mild or moderate disease without viral infections (e.g., HIV or hepatitis C), is now nearly equivalent to those without hemophilia A in high-income countries, due to improved management and treatment [3–5]. As with the general aging population, PwHA will also develop comorbidities, such as joint disease, cardiovascular disease, renal disease, pain, cancer and viral infections, with these conditions developing at earlier ages than the general population, which can complicate disease management [6,7].
Currently, there is a paucity of published literature describing aging PwHA. Evaluating characteristics and outcomes among PwHA in a cohort inclusive of patients enrolled in Medicare could help further understand this growing population. The objective of this study was to examine real-world patient characteristics, treatment patterns, and outcomes among treated PwHA, stratified by age.
Materials & methods
This retrospective study used data from 1 January 2007 to 31 July 2018. Data sources included member enrollment, medical, pharmacy, and laboratory data from Humana Inc., a US-based company that provides national Medicare Advantage and commercial plan offerings. Additionally, Humana’s Clinical Guidance Exchange platform, a case tracking system and data mart for Humana’s clinical operations and other non-claims clinical data, was used as a source.
Patient identification criteria
Patients had to meet one of the following criteria for inclusion from 1 January 2007–31 July 2017, modified from Lyons, et al. [8]: ≥1 medical or pharmacy claim for FVIII therapy, factor eight inhibitor bypassing agent, or recombinant factor VIIa therapy (Appendix A) AND ≥1 diagnosis of congenital hemophilia A (Appendix B); ≥1 medical or pharmacy claim for FVIII/von Willebrand complex therapy (Appendix A) AND no diagnoses of von Willebrand’s disease (Appendix B) AND ≥1 diagnosis of congenital hemophilia A or ≥1 medical or pharmacy claim for desmopressin (Appendix A) AND ≥1 diagnosis of congenital hemophilia A (Appendix B). Patients >90 years of age, and those with ≥2 medical claims for another coagulation disorder (both claims had to be for the same disorder) were excluded (Appendix C). The index date was the date of first treatment observed after meeting the identification criteria. Patients were required to have continuous post-index enrollment for at least 12 months of follow-up.
Treatments
Pharmacy and medical claims over a 12-month period were used to classify each patient’s FVIII regimen type as either prophylactic or on-demand. The expected lower limit (LL) for continuous prophylaxis dosing was defined by the 25th percentile of body weight by sex and age from the National Health and Nutrition Examination Survey [9], the estimated low end of continuous prophylaxis dose range (25 international units [IU]/kg), and the recommended dosing frequency (times three per week for 45 weeks per year [12 months] [10]) denoted by the following equation:
Patient-specific per-month FVIII dosing was determined by summing the total FVIII quantity dispensed (IU) from each claim observed during the 12-month period. The calculated monthly average dose was compared with the expected monthly LL to classify the treatment pattern as consistent with prophylactic (including standard and extended half-life FVIII products) or on-demand therapy. If the calculated monthly FVIII dosing was <LL, it was classified as ‘on-demand’. If dosing was ≥LL, the patient was designated as utilizing ‘prophylactic’ therapy.
Patients with evidence of inhibitors were excluded from classification by prophylaxis or on-demand treatment type and were classified separately. Use of desmopressin was also measured.
Clinical outcomes
Hemophilia-related bleeding events were identified using ICD-9 and ICD-10 codes corresponding to bleeds in joints and muscles (hemarthrosis) and associated sequelae (hematoma), and other less common acute bleeds, including intracranial, neck/throat and gastrointestinal hemorrhages (Appendix B). Bleeding-related claims were grouped by body part and assumed to belong to the same event if they occurred within 7 days of each other. Bleeding events occurring in different body parts were considered separate events if the claims were observed on different days [11].
Joint health and related medical conditions (arthropathy, osteoarthritis, physical therapy, difficulty walking, osteoporosis and stiff joints) and joint procedures/surgery (synovectomy, arthrodesis, osteotomy, excision of joint, arthroscopy and arthroplasty) were examined (Appendices B and E). Patients with ≥1 fracture code on a medical claim were identified (Appendix F). Pain was assessed via diagnosis codes, including general pain or joint-related pain, or prescription claims for pain medications and anti-inflammatories (Appendix B).
Healthcare resource utilization
All-cause and hemophilia-related inpatient hospitalizations, emergency department (ED) visits, physician office visits, and outpatient visits were measured. Hemophilia-related encounters were defined as a diagnosis of congenital hemophilia A (ICD-9: 286.0; ICD-10: D66) in any diagnosis position for ED visits, physician office visits, or outpatient visits. For inpatient hospitalizations, encounters were defined as a diagnosis of hemophilia A in the primary position or a diagnosis of a hemophilia-related bleeding event in the primary position and a diagnosis of hemophilia A in any other position.
Patients were identified as receiving care at a hemophilia treatment center (HTC) if: ≥1 medical claim was associated with a provider listed as an essential community provider [12] serving predominately low-income, medically underserved individuals under the HTC category; ≥1 medical claim was associated with an HTC address (based on either full address match or 5-digit zip code) listed in the CDC HTC Directory [13] or if there was evidence of care at an HTC based on supplementary data.
Additional characteristics
The age, sex, geographic location and population density of patients were described. Plan type was determined from enrollment data and included patients in Medicare Advantage Prescription Drug or commercial plans as of the index date.
Elixhauser comorbidity index score [14–16], RxRisk-V score [17], hepatitis C (Appendix B) and frailty/disability were measured [18]. Hemophilia severity was determined by documentation in supplementary data or from factor level documented in lab results (Appendix D). Patients were classified, based on the minimum FVIII lab value, as mild (5% to <40% normal clotting activity or 0.05–0.40 IU/ml), moderate (1–5% normal clotting activity or 0.01–0.05 IU/ml) or severe (<1% normal clotting activity or <0.01 IU/ml) [10].
Statistical analysis
Demographic, clinical characteristics and outcomes were analyzed descriptively. Categorical variables were summarized as counts and percentages. Continuous variables were summarized using mean, standard deviation, median, interquartile range, minimum and maximum. Unadjusted comparisons among age subgroups were assessed with chi-square for categorical variables and Analysis of Variance or Kruskal–Wallis tests for continuous variables. Note that cell sizes less than ten were suppressed in order to protect study subjects from potential re-identification and privacy considerations. Where no comparisons could be made due to ≥1 cell being suppressed, p-values were removed (nonapplicable; n/a). All analyses were conducted using SAS version 9.4 (SAS Institute, NC, USA). The study protocol was approved by Advarra, an independent institutional review board.
Results
Demographics & patient characteristics
A total of 294 patients were identified based on the inclusion and exclusion criteria (Figure 1). Demographic characteristics are summarized in Table 1. The mean age of the overall cohort was 33.8 years (standard deviation ± 20.7). The majority of the patients in the study (n = 176, 59.9%) were 18–55 years of age and 95.6% of the cohort was male.

Figure 1. Patient identification.
MAPD: Medicare advantage prescription drug.
| Baseline demographics | Overall (N = 294) | <18 (n = 67) | 18–55 (n = 176) | 56–89 (n = 51) | p-value† |
|---|---|---|---|---|---|
| Age | |||||
| Mean (SD) | 33.8 (20.7) | 9.7 (4.8) | 33.1 (10.9) | 68.3 (8.8) | <0.001 |
| Median (IQR) | 29 (18–48) | 10 (6–14) | 31 (24–42) | 68 (61–73) | <0.001 |
| Minimum, maximum | 0, 88 | 0, 17 | 18, 55 | 56, 88 | |
| Sex, n (%) | |||||
| Male | 281 (95.6) | 66 (98.5) | 167 (94.9) | 48 (94.1) | 0.403 |
| US region, n (%) | |||||
| Northeast | <10 | <10 | <10 | <10 | 0.456 |
| Midwest | 74 (25.2) | 22 (32.8) | 42 (23.9) | 10 (19.6) | |
| South | 195 (66.3) | 39 (58.2) | 121 (68.8) | 35 (68.6) | |
| West | <30 | <10 | <20 | <10 | |
| Population density, n (%)‡ | |||||
| Urban | 218 (74.1) | 47 (70.1) | 136 (77.3) | 35 (68.6) | 0.272 |
| Suburban | 54 (18.4) | 17 (25.4) | 26 (14.8) | 11 (21.6) | |
| Rural | <20 | <10 | <20 | <10 | |
| Missing | <10 | <10 | <10 | <10 | |
| Plan type, n (%) | |||||
| MAPD | 76 (25.9) | 0 (0.0) | 34 (19.3) | 42 (82.4) | <0.001 |
| Commercial | 218 (74.1) | 67 (100.0) | 151 (66.5)§ | ||
Cell sizes less than ten were suppressed in order to protect study subjects from potential re-identification and privacy considerations. Where no comparisons could be made due to one or more cells being suppressed, p-values were removed (i.e., non applicable).
†
p-value is for comparison across age groups. Chi-square was used for categorical variables and ANOVA or Kruskal–Wallis for continuous variables.
‡
Analysis was restricted to patients with a known value (i.e., excluded ‘missing’).
§
Combined groups due to n <10 in at least one adjacent cell.
ANOVA: Analysis of Variance; IQR: Interquartile range; MAPD: Medicare advantage prescription drug; NA: Non applicable; SD: Standard deviation.
Selected clinical characteristics are summarized in Table 2. The most common comorbidities overall were arthritis and hepatitis C, with prevalence increasing with age.
| Clinical characteristics | Overall (N = 294) | <18 (n = 67) | 18–55 (n = 176) | 56–89 (n = 51) | p-value† |
|---|---|---|---|---|---|
| Elixhauser comorbidity index | |||||
| Mean (SD) | 1.8 (2.0) | 0.9 (0.5) | 1.7 (1.7) | 3.7 (2.7) | <0.001 |
| Median (IQR) | 1 (1–2) | 1 (1–1) | 1 (1–2) | 3 (2–5) | <0.001 |
| Minimum, maximum | 0, 12 | 0, 2 | 0, 10 | 0, 12 | |
| Elixhauser comorbidities, n (%) | |||||
| Cardiac arrhythmia | 12 (4.1) | 0 (0.0) | 12 (5.3)‡ | <0.001 | |
| Hypertension (uncomplicated) | 54 (18.4) | 0 (0.0) | 20 (11.4) | 34 (66.7) | <0.001 |
| COPD | 20 (6.8) | 0 (0.0) | 20 (8.8)‡ | <0.001 | |
| Diabetes (uncomplicated) | 18 (6.1) | 0 (0.0) | <10 | <10 | NA |
| Liver failure | 29 (9.9) | 0 (0.0) | 29 (12.8)‡ | 0.004 | |
| HIV/AIDS | 27 (9.2) | <10 | 21 (11.9) | <10 | NA |
| Coagulopathy | 244 (83.0) | 57 (85.1) | 143 (81.3) | 44 (86.3) | 0.615 |
| Depression | 26 (8.8) | <10 | 17 (9.7) | <10 | NA |
| RxRisk score | |||||
| Mean (SD) | 2.2 (2.7) | 0.5 (0.8) | 2.3 (2.7) | 4.3 (3.1) | <0.001 |
| Median (IQR) | 1 (0–4) | 0 (0–1) | 1 (0–4) | 5 (2–7) | <0.001 |
| Minimum, maximum | 0, 15 | 0, 3 | 0, 15 | 0, 13 | |
| Hepatitis C, n (%) | 57 (19.4) | 0 (0.0) | 43 (24.4) | 14 (27.5) | <0.001 |
| Frailty | |||||
| Mean (SD) | 1.0 (1.5) | 0.5 (0.7) | 0.8 (1.2) | 2.1 (2.3) | <0.001 |
| Median (IQR) | 1 (0–1) | 0 (0–1) | 0 (0–1) | 1 (1–3) | <0.001 |
| Minimum, maximum | 0, 10 | 0, 3 | 0, 8 | 0, 10 | |
| Frailty comorbidities, n (%) | |||||
| Arthritis | 116 (39.5) | 18 (26.9) | 69 (39.2) | 29 (56.9) | 0.004 |
| Heart failure | 10 (3.4) | 0 (0.0) | <10 | <10 | NA |
| Sepsis | 15 (5.1) | <10 | <10 | <10 | NA |
| Psychiatric | 34 (11.6) | <10 | 24 (13.6) | <10 | NA |
| Difficulty walking | 16 (5.4) | 0 (0.0) | <10 | <10 | NA |
| Stroke | 18 (6.1) | <10 | <10 | <10 | NA |
| Weakness | 14 (4.8) | <10 | <10 | <10 | NA |
| Ambulance§ | 18 (6.1) | <10 | 12 (6.8) | <10 | NA |
Cell sizes less than 10 were suppressed in order to protect study subjects from potential re-identification and privacy considerations. Where no comparisons could be made due to one or more cells being suppressed, p-values were removed (i.e., NA).
†
p-value is for comparison across age groups. Chi-square was used for categorical variables and ANOVA or Kruskal–Wallis for continuous variables.
‡
Combined groups due to n <10 in at least one adjacent cell.
§
Study subject utilized ambulance services.
ANOVA: Analysis of Variance; COPD: Chronic obstructive pulmonary disease; IQR: Interquartile range; NA: Non applicable; SD: Standard deviation.
Severity could be assessed in 57 (19.4%) patients. Among those whose severity was available, 50.9% were mild, with 65.5% ≤55 and 34.5% 56–89 years old. The number of individuals classified in each age group as moderate or severe was small (specific cell counts are masked as required by privacy policies).
Treatments
Treatment data are reported in Table 3. There were <10 patients identified as having inhibitors based on treatments or laboratory results. Overall, 29.9% (n = 88) of patients were identified as utilizing prophylaxis and 61% (n = 179) were identified as utilizing on-demand FVIII treatment, not including those with evidence of inhibitors. Prophylaxis use was highest among patients aged <18 years (44.8%); however, approximately one-quarter of patients ≥18 also received prophylaxis. On-demand and desmopressin use were more common among the 18–55 and 56–89 years age groups.
| 12-month postindex treatments | Overall (N = 294) | <18 (n = 67) | 18–55 (n = 176) | 56–89 (n = 51) | p-value† |
|---|---|---|---|---|---|
| Treatments, n (%) | |||||
| Prophylaxis | 88 (29.9) | 30 (44.8) | 58 (25.6)‡ | <0.001 | |
| On-demand | 179 (60.9) | 33 (49.3) | 111 (63.1) | 35 (68.6) | 0.066 |
| Evidence of inhibitors | <10 | <10 | <10 | <10 | NA |
| Desmopressin | 34 (11.6) | 21 (8.6)‡ | 13 (25.5) | 0.002 | |
| Number of FVIII claims (separate service dates) | |||||
| Mean (SD) | 7.1 (9.2) | 10.1 (15.2) | 7.2 (6.4) | 2.8 (3.5) | <0.001 |
| Median (IQR) | 6 (2–11) | 10 (2–13) | 6 (2–11) | 2 (1–4) | <0.001 |
| Minimum, maximum | 0, 124 | 0, 124 | 0, 57 | 0, 15 | |
Cell sizes less than ten were suppressed in order to protect study subjects from potential re-identification and privacy considerations. Where no comparisons could be made due to one or more cells being suppressed, p-values were removed (i.e., NA). When <10 patients overall had the outcome of interest, it was not reported in the table but described in the results.
†
p-value is for comparison across age groups. Chi-square was used for categorical variables and ANOVA or
‡
Kruskal–Wallis for continuous variables.
Combined groups due to n <10 in at least one adjacent cell.
ANOVA: Analysis of Variance; FVIII: Factor VIII; IQR: Interquartile range; NA: Non applicable; SD: Standard deviation.
Clinical outcomes
A total of 21.1% patients experienced ≥1 bleeding event. There were statistically significant differences in the proportion of patients with bleeding events (<18 years 28.4%, 18–55 years 14.8% and 56–89 years 33.3%; p = 0.004) (Figure 2). Arthropathy or related disorders and pain were evidenced in 41.2 and 53.1% of patients, and generally increased with age. Fractures occurred in 8.2% of patients, fewer than ten patients overall had osteoporosis, osteopenia, difficulty walking, or stiff joints, and only 12 patients had indication of any joint procedures or surgery.
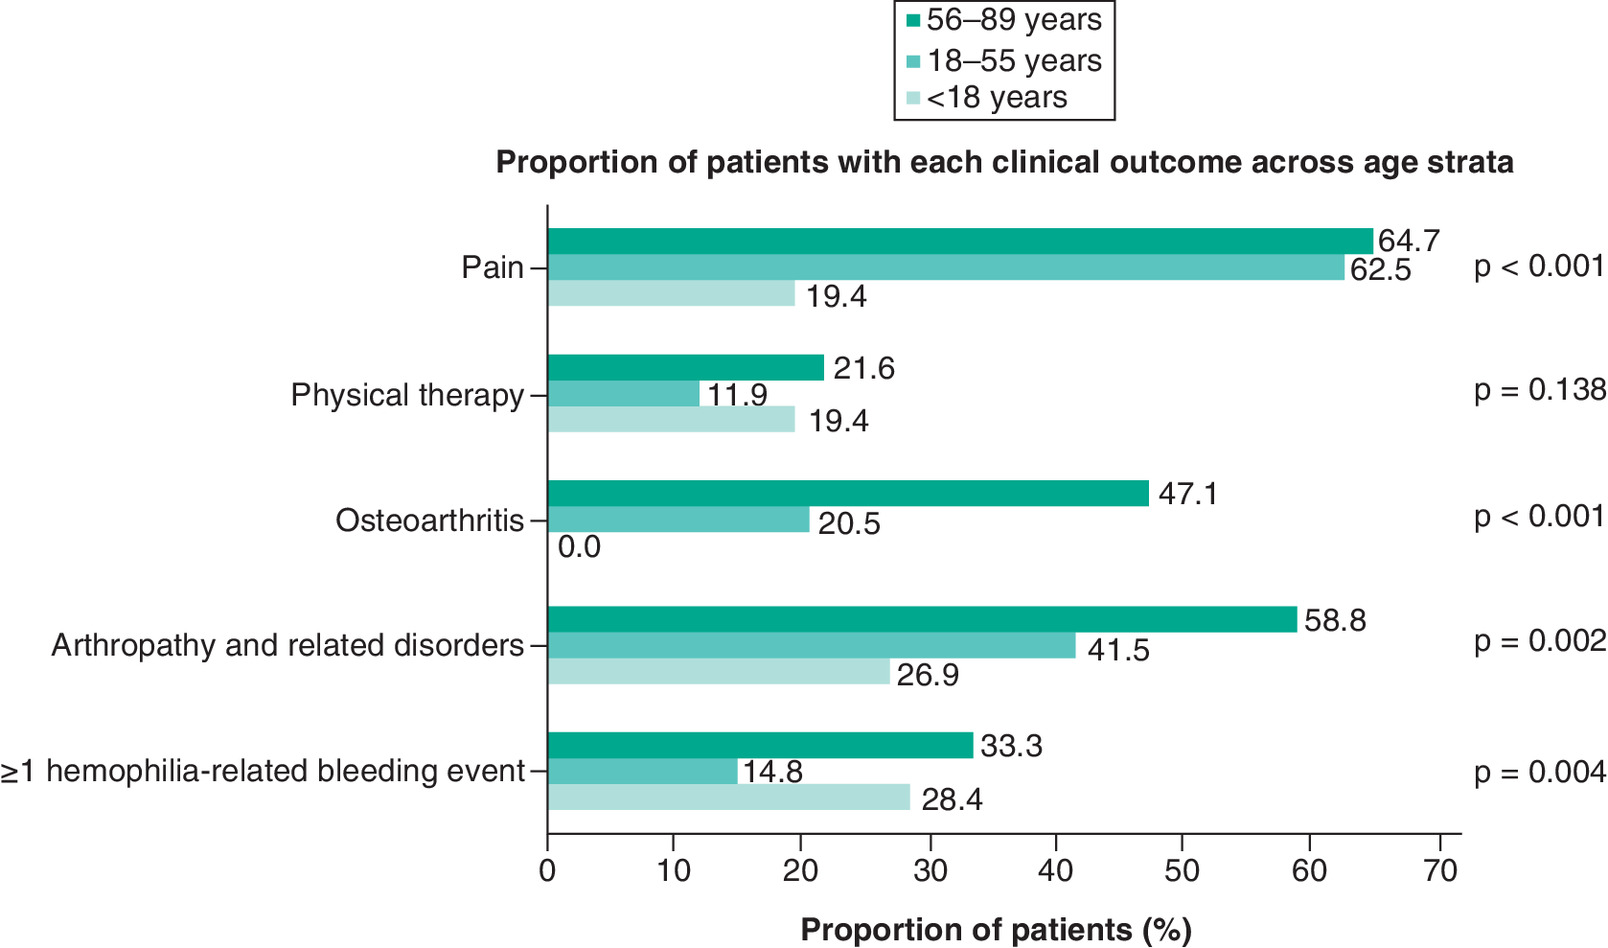
Figure 2. Clinical outcomes* by age categories.
*Fractures, joint procedures/surgery, osteoporosis, osteopenia, difficulty walking or stiff joints are not included in this figure due to sample sizes <10 overall or in one or more age strata.
p-value is from omnibus chi-square test for comparison across all age groups.
HCRU
A total of 15.0 and 34.4% of patients had ≥1 all-cause inpatient admission and ED visit during follow-up, respectively (Table 4). Generally, as age increased, measures of healthcare resource utilization (HCRU) increased and were highest for the 56–89 years age group; however, all-cause and hemophilia-related ED visits, and hemophilia-related physician office visits were similar across groups. HTC use was greatest in the 18–55 years age group.
| 12-month post-index HCRU | Overall (N = 294) | <18 (n = 67) | 18–55 (n = 176) | 56–89 (n = 51) | p-value† |
|---|---|---|---|---|---|
| HCRU | |||||
| All-cause inpatient hospitalizations (at least one), n (%) | 44 (15.0) | 25 (10.3)‡ | 19 (37.3) | <0.001 | |
| Hemophilia-related inpatient hospitalizations (at least one), n (%) | 12 (4.1) | <10 | <10 | <10 | NA |
| All-cause ED visits (at least one), n (%) | 101 (34.4) | 18 (26.9) | 60 (34.1) | 23 (45.1) | 0.118 |
| Hemophilia-related ED visits (at least one), n (%) | 83 (28.2) | 17 (25.4) | 48 (27.3) | 18 (35.3) | 0.448 |
| Number of all-cause physician office visits | |||||
| Mean (SD) | 6.7 (8.0) | 5.1 (4.4) | 5.8 (7.1) | 12.3 (11.4) | <0.001 |
| Median (IQR) | 4 (2–9) | 4 (2–7) | 3 (1–8) | 8 (4–16) | <0.001 |
| Minimum, maximum | 0, 45 | 0, 18 | 0, 45 | 0, 45 | |
| Number of hemophilia-related physician office visits | |||||
| Mean (SD) | 1.5 (1.8) | 1.7 (2.3) | 1.3 (1.5) | 1.8 (2.1) | 0.058 |
| Median (IQR) | 1 (0–2) | 1 (0–2) | 1 (0–2) | 1 (0–3) | 0.355 |
| Minimum, maximum | 0, 13 | 0, 13 | 0, 9 | 0, 7 | |
| Number of all-cause outpatient visits, overall | |||||
| Mean (SD) | 8.9 (9.8) | 6.9 (5.6) | 7.8 (9.0) | 15.6 (13.4) | <0.001 |
| Median (IQR) | 5.5 (2–12) | 5 (3–9) | 4 (2–10) | 11 (8–21) | <0.001 |
| Minimum, maximum | 0, 67 | 1, 24 | 0, 49 | 1, 67 | |
| Number of hemophilia-related outpatient visits | |||||
| Mean (SD) | 2.5 (2.7) | 2.9 (2.9) | 2.1 (2.4) | 3.5 (3.2) | 0.003 |
| Median (IQR) | 2 (1–3) | 2 (1–3) | 1 (1–3) | 3 (1–5) | 0.002 |
| Minimum, maximum | 0, 16 | 0, 16 | 0, 12 | 0, 15 | |
| Hematologist visits | |||||
| Mean (SD) | 1.8 (2.6) | 2.1 (3.6) | 1.5 (2.1) | 2.4 (2.5) | 0.055 |
| Median (IQR) | 1 (0–2) | 1 (0–2) | 1 (0–2) | 2 (0–4) | 0.037 |
| Minimum, maximum | 0, 18 | 0, 18 | 0, 13 | 0, 12 | |
| HTC utilization, yes, n (%) | 173 (58.8) | 33 (49.3) | 116 (65.9) | 24 (47.1) | 0.011 |
Cell sizes less than ten were suppressed in order to protect study subjects from potential re-identification and privacy considerations. Where no comparisons could be made due to one or more cells being suppressed, p-values were removed (i.e., NA).
†
p-value is for comparison across age groups. Chi-square was used for categorical variables and ANOVA or Kruskal–Wallis for continuous variables.
‡
Combined groups due to n <10 in at least one adjacent cell.
ANOVA: Analysis of Variance; ED: Emergency department; HCRU: Healthcare resource utilization; HTC: Hemophilia treatment center; IQR: Interquartile range; NA: Non applicable; SD: Standard deviation.
Discussion
This analysis identified 294 PwHA from 2007 to 2017, 17.3% of whom were 56–89 years of age. These older PwHA had higher comorbidity burden, including hepatitis C and hemophilia-related comorbidities than the other age groups. The majority of these patients utilized on-demand FVIII treatment, and this group had the highest proportion of patients with bleeding events, as well as incurring the highest HCRU across a majority of utilization categories.
The cohort of patients included in this study represents an older age distribution of PwHA compared with those enrolled in the CDC Registry or included in the HTC Population Profile [19]. For example, 51% of patients in the CDC Registry were <20 years of age, versus only 22.8% <18 years of age in the current study [19]. While a small number of patients overall were ≥65 in the current study (∼10%), even fewer were reported in the CDC HTC Population Profile or Registry (4 and 5%, respectively [19]).
The relatively small proportion of older PwHA in the general population may be due to several factors. Many died or had a shortened lifespan due to contracting HIV or hepatitis C in the 1970s/1980s from blood-based infusions (e.g., plasma, factor) [20], and patients with more severe disease may have died due to bleeds before prophylaxis was established as standard of care in the US in the mid-1990s [20]. Approximately 25% of patients in this study were enrolled in an Medicare Advantage Prescription Drug plan due to either age or disability, representing a group that may otherwise be excluded from studies conducted only in commercial health plan populations. As PwHA age, the management of multimorbidity and polypharmacy in this population will challenge providers, necessitating a collaborative team approach to delivery of effective care for these patients [5–7].
Identifying prophylaxis use via claims is challenging given assumptions that must be made regarding dosing. While not yet validated, this methodology provides an alternative approach to identification, which may benefit from further assessment. Approximately 30% of patients were classified as having evidence of receiving a prophylaxis regimen. This is lower than the rate of prophylaxis observed in a surveillance study of PwHA, which identified approximately 59% in 2010 [21]. The highest proportion of prophylaxis was seen among patients ≤19 years of age (75%) and the lowest (∼20%) in patients 50–69 years of age [21]; a similar trend was seen in the current study where the highest proportion of prophylaxis use was among those <18 and lowest among those 56–89 years of age. Differences in the proportion of patients utilizing prophylaxis may reflect the demographic makeup of the study cohort. Patients in the surveillance study were on average 17.7 years of age with 64.2% ≤19 years versus an average age of 33.8 years with 77.2% ≥18 years in the current study. Shrestha et al. also reported that a lower proportion of patients aged 45–64 years had ever been on prophylaxis (27.0%) compared with younger age groups [11], possibly due to past fears of hepatitis C and HIV contamination with factor infusions in the 1980s [5]. The use of claims-based measures to classify treatment type may also impact these estimates, given the assumptions necessary for the calculations of prophylaxis versus nonprophylaxis therapy. Desmopressin utilization was highest among those patients 56–89 years (25.5%) compared with the younger populations. This could be related to severity of disease, with a greater proportion of older patients potentially having nonsevere (i.e., mild or moderate) hemophilia A [19,22], where desmopressin use is most commonly indicated [10].
The 56–89 years age group had the highest proportion of patients with ≥1 hemophilia-related bleeding event. While the absolute number of patients was small (n = 17), and results need to be interpreted with caution, these older patients may be at risk for bleeding due to other conditions or medications regardless of their hemophilia severity. This age group also had the highest proportion of patients with arthropathy and related disorders as well as osteoarthritis, though it was not determined if these were hemophilia-related. In Shrestha et al., the 45–64 years age group had the highest proportion of individuals who ever experienced hemophilia-related joint problems (64.86%), compared with younger adults 19–44 years (45.88%) or children 6–18 years (12.23%) [11]. While primary prophylaxis is recommended to prevent hemophilia-related joint disease [10], there has been evidence that secondary and tertiary prophylaxis may still be beneficial for reduction of bleeding events and improved joint health [23]. It is unclear if the higher proportion of patients with joint conditions in the older population is due to aging or other conditions, or if the lower prophylaxis use may be a contributing factor.
Severity was only identified in approximately 20% of patients, given the limitations of the data sources, with 50.9% identified as mild. It has been cited that up to 60% of PwHA may suffer from the severe form of the disease [24]. A claims-based analysis with supplemental electronic medical records data reported 41.9% of PwHA without inhibitors had the severe form of the disease, 12.3% moderate, and 45.8% mild; however, the median age of those patients was 6 years old [25]. The severe form of the disease is often recognized early in life and the mostly adult population in the current study may have included more patients with less severe forms of the disease, similar to what has been reported in registries (~60%) [19,22]. In addition, this study did not include patients covered by Medicaid, which may include younger individuals and those with more severe hemophilia A.
Across age groups, there was higher all-cause HCRU for older patients. These patients had a greater number of comorbidities, which may require additional management, and the high burden in this population warrants further study of how current treatments can improve their condition. The overall proportion of patients who were identified as receiving care from an HTC was 58.8% versus 70–80% as reported by the CDC registry [19,22]. Patients in the HTC registry were younger and may have greater severity of disease requiring more intensive and specialized care, which may explain the overall rate of HTC utilization in addition to the limitations of HTC utilization capture methods in claims data.
Limitations
As with most studies reporting administrative claims data, limitations include inaccurate claims coding and the absence of certain relevant information in the database, such as disease severity and body weight. While this study also used data available from clinical reviews and prior authorization requests, these data are not available for all patients and often exist for specific reasons (medication authorization, pre-operative reviews). Further, Medicaid patients were not included in the study due to limitations of the data; thus, our results may not be representative of this population. The algorithm used for hemophilia identification has not been validated, thus may have not included everyone with hemophilia and may have included patients who have other bleeding disorders, despite the exclusions applied. Additionally, this study did not impose a requirement for continuous pre-index enrollment without evidence of treatment, and this was a descriptive study that did not control for unmeasured confounding (e.g., patient disease severity).
Limitations to this study also include several assumptions that had to be made for the algorithm for prophylaxis treatment. Thus, the proportion of patients on prophylaxis may have been under- or over-estimated. Additionally, it was neither possible to identify when patients first initiated prophylaxis, nor to clearly identify if patients were receiving immune tolerance induction, although patients with inhibitors were identified to the extent possible. Not all encounters with an HTC may have been captured using the methods described, thus potentially underestimating the proportion receiving care in those centers. Hemophilia severity was identified either from claims or supplemental sources in only 57 (19.4%) patients. Without a validated claims-based proxy for severity, outcomes based on this important clinical factor were not able to be measured or controlled. Bleeding events may have been underestimated as minor bleeding occurrences (e.g., nose bleeds) may be managed at home.
Conclusion
PwHA represent a medically complex group of individuals who incur substantial HCRU. Treatment patterns, clinical outcomes, and utilization vary across different ages of this population. Insights on shifts in outcomes and HCRU as PwHA age may identify opportunities for enhanced management of older patients with this condition.
•
Understanding characteristics of persons with hemophilia A (PwHA) across age categories is critical to informing appropriate management strategies.
•
Currently, there is a paucity of published literature describing the older population of PwHA.
•
In this retrospective study, the US administrative claims data from 1 January 2007 to 31 July 2018 from the Humana Research Database were utilized and unadjusted comparisons on characteristics, clinical outcomes and healthcare resource utilization (HCRU) were conducted in PwHA across age groups (<18, 18–55, 56–89 years).
•
Among the 294 PwHA identified, 22.8, 59.8 and 17.3% were <18, 18–55 and 56–89 years old, respectively.
•
The most common comorbidities were arthritis and hepatitis C.
•
Overall, 29.9% of PwHA had evidence of prophylactic treatment, of whom 44.8% were <18 years old.
•
A total of 21.1% of patients overall experienced ≥1 bleeding event, and 41.2 and 53.1% had evidence of arthropathy or related disorders, and pain, respectively; along with all-cause and hemophilia-related HRCU, these were all highest among PwHA aged 56–89 years.
•
This study is subject to limitations inherent to an administrative claims database study, including lack of clinical information such as disease severity and body weight.
•
As PwHA live longer, insights into differences in treatment, outcomes, and HCRU may identify opportunities for enhanced disease management.
Author contributions
All authors contributed to the study design and data interpretation. RW DeClue and TF Shaffer analyzed the data. EO Caplan and BT Suehs drafted the manuscript, with critical review and revisions from all authors. All authors approve the final version to be published and agree to be accountable for all aspects of the work.
Financial & competing interests disclosure
This study, and preparation of this article, were sponsored by Genentech, Inc., and conducted as part of a research collaboration with Humana. EO Caplan and BT Suehs are employees of Humana Healthcare Research, Inc, which received funding from Genentech, Inc, for this study. RW DeClue and TF Shaffer were employees of Humana Healthcare Research at the time of this study. M Sehman is a current employee of Humana and D Cornett was an employee of Humana at the time of this study. AM Patel and K Raimundo are employees of Genentech, Inc., and stockholders (F. Hoffmann-La Roche Ltd). The authors have no other relevant affiliations or financial involvement with any organization or entity with a financial interest in or financial conflict with the subject matter or materials discussed in the manuscript apart from those disclosed.
Medical editing support for the development of this manuscript, under the direction of the authors, was provided by E Slobodian, and P Tate of Ashfield MedComms, an Ashfield Health company, and funded by Genentech, Inc.
Ethical conduct of research
The authors state that they have obtained appropriate institutional review board approval from the independent review board Advarra. Informed consent was not required due to the nature of this study.
Data sharing statement
The code listings used can be found in the appendices.
Open access
This work is licensed under the Attribution-NonCommercial-NoDerivatives 4.0 Unported License. To view a copy of this license, visit http://creativecommons.org/licenses/by-nc-nd/4.0/
Supplementary Material
File (appendices.xlsx)
- Download
- 162.42 KB
References
Papers of special note have been highlighted as: • of interest; •• of considerable interest
1.
Centers for Disease Control and Prevention. Data & statistics on hemophilia (2019). https://www.cdc.gov/ncbddd/hemophilia/data.html
2.
Wight J, Paisley S. The epidemiology of inhibitors in haemophilia A: a systematic review. Haemophilia 9(4), 418–435 (2003).
3.
Darby SC, Kan SW, Spooner RJ et al. Mortality rates, life expectancy, and causes of death in people with hemophilia A or B in the United Kingdom who were not infected with HIV. Blood 110(3), 815–825 (2007).
4.
Plug I, Van Der Bom JG, Peters M et al. Mortality and causes of death in patients with hemophilia, 1992–2001: a prospective cohort study. J. Thromb. Haemost. 4(3), 510–516 (2006).
5.
Franchini M, Tagliaferri A, Mannucci PM. The management of hemophilia in elderly patients. Clin. Interv. Aging 2(3), 361–368 (2007).
6.
Angelini D, Konkle BA, Sood SL. Aging among persons with hemophilia: contemporary concerns. Semin. Hematol. 53(1), 35–39 (2016).
7.
Mannucci PM, Iacobelli M. Progress in the contemporary management of hemophilia: the new issue of patient aging. Eur. J. Intern. Med. 43, 16–21 (2017).
•• Discusses how improvements in hemophilia care have led to an aging population of people with hemophilia A, and the common comorbidities in this population that can complicate their management.
8.
Lyons J, Desai V, Xu Y et al. Development and validation of an algorithm for identifying patients with hemophilia A in an administrative claims database. Value Health 21(9), 1098–1103 (2018).
9.
Fryar CD, Gu Q, Ogden CL, Flegal KM. Anthropometric reference data for children and adults: United States, 2011–2014. Vital Health Stat. 3 39, 1–46 (2016).
10.
Srivastava A, Santagostino E, Dougall A et al. WFH guidelines for the management of hemophilia, 3rd edition. Haemophilia 26(Suppl. 6), 1–158 (2020).
• The latest edition of the World Federation of Hemophilia Guidelines for the Management of Hemophilia. The guidelines provide recommendations on therapeutic approaches and principles of care for people with hemophila, including management of comorbidities and medical issues with aging.
11.
Shrestha A, Eldar-Lissai A, Hou N, Lakdawalla DN, Batt K. Real-world resource use and costs of haemophilia A-related bleeding. Haemophilia 23(4), e267–e275 (2017).
•• This US claims-based study (2004–2012) identifies hemophilia A-related healthcare utilization, healthcare costs and prophylaxis or nonprophylaxis treatment among males with hemophilia aged 6–64 years old. It concludes that initiating prophylaxis earlier in life may reduce the healthcare cost burden and long-term complications.
12.
Centers for Medicase & Medicaid Services. Essential Community Providers (ECP) – final 2017 ECP list. https://dbdgateway.cdc.gov/HTCDirSearch.aspx
13.
Centers for Disease Control and Prevention. Hemophilia Treatment Center (HTC) directory. https://dbdgateway.cdc.gov/HTCDirSearch.aspx
14.
Quan H, Sundararajan V, Halfon P et al. Coding algorithms for defining comorbidities in ICD-9-CM and ICD-10 administrative data. Med. Care 43(11), 1130–1139 (2005).
15.
Klabunde CN, Potosky AL, Legler JM, Warren JL. Development of a comorbidity index using physician claims data. J. Clin. Epidemiol. 53(12), 1258–1267 (2000).
16.
Elixhauser A, Steiner C, Harris DR, Coffey RM. Comorbidity measures for use with administrative data. Med. Care 36(1), 8–27 (1998).
17.
Sloan KL, Sales AE, Liu CF et al. Construction and characteristics of the RxRisk-V: a VA-adapted pharmacy-based case-mix instrument. Med. Care 41(6), 761–774 (2003).
18.
Faurot KR, Jonsson Funk M, Pate V et al. Using claims data to predict dependency in activities of daily living as a proxy for frailty. Pharmacoepidemiol. Drug Saf. 24(1), 59–66 (2015).
19.
Centers for Disease Control and Prevention. Community counts - registry for bleeding disorders surveillance. https://www.hemophilia.org/Bleeding-Disorders/History-of-Bleeding-Disorders
20.
National Hemophilia Foundation. History of bleeding disorders. https://www.hemophilia.org/Bleeding-Disorders/History-of-Bleeding-Disorders
21.
Manco-Johnson MJ, Soucie JM, Gill JC. Prophylaxis usage, bleeding rates, and joint outcomes of hemophilia, 1999 to 2010: a surveillance project. Blood 129(17), 2368–2374 (2017).
•• This publication analyzed patterns of prophylaxis use and its correlation with indicators of arthropathy in people with severe hemophilia A in the US Hemophilia Treatment Center Network and Centers for Disease Control and Prevention registry. It concludes that normal joint function can only be preserved by initiating prophylaxis earlier than 4 years of age.
22.
Office of Disease Prevention and Health Promotion. Community counts hemophilia treatment centers population profile. https://www.healthypeople.gov/2020/data-source/community-counts-hemophilia-treatment-centers-population-profile
23.
Manco-Johnson MJ, Lundin B, Funk S et al. Effect of late prophylaxis in hemophilia on joint status: a randomized trial. J. Thromb. Haemost. 15(11), 2115–2124 (2017).
•• This publication reports the results of a 3-year, open-label, randomized study investigating the impact of prophylaxis versus on-demand therapy for males aged 12–50 years with severe hemophilia A. Those receiving prophylaxis had reduced bleeding, pain and healthcare resource utilization, and improved joint health, activity, satisfaction and health-related quality of life; however, there was no decrease in structural arthropathy progression, suggesting that pre-existing joint arthropathy may be irreversible.
24.
National Organization for Rare Disorders. Hemophilia A. https://rarediseases.org/rare-diseases/hemophilia-a/
25.
Armstrong EP, Malone DC, Krishnan S, Wessler MJ. Costs and utilization of hemophilia A and B patients with and without inhibitors. J. Med. Econ. 17(11), 798–802 (2014).
• This retrospective, observational study utilized US electronic medical records and administrative claims data from 2006–2011 to evaluate health system costs for people with hemophilia A and B with and without inhibitors. The authors found that a higher frequency of hospitalizations and higher costs were associated with inhibitors.
Information & Authors
Information
Published In
Pages: 1121 - 1131
PubMed: 34240615
Copyright
© 2021 F. Hoffmann-La Roche. This work is licensed under the Attribution-NonCommercial-NoDerivatives 4.0 Unported License
History
Received: 7 May 2021
Accepted: 21 June 2021
Published online: 9 July 2021
Keywords:
Topics
Authors
Funding Information
Metrics & Citations
Metrics
Article Usage
Article usage data only available from February 2023. Historical article usage data, showing the number of article downloads, is available upon request.
Citations
How to Cite
Real-world treatment, clinical outcomes and healthcare resource utilization among persons with hemophilia A by age. (2021) Journal of Comparative Effectiveness Research. DOI: 10.2217/cer-2021-0109
Export citation
Select the citation format you wish to export for this article or chapter.
Citing Literature
- Nikoletta Sofiaki, Oresteia Zisimopoulou, Argyro Solakidi, Marina Economou, Olga Katsarou, Anna Kouramba, Efrosyni Nomikou, Helen Pergantou, Sofia Vakalopoulou, George Filippidis, Vasilis Grammelis, Damianos Menegas, Andriani Angelopoulou, Charalampos Tzanetakos, George Gourzoulidis, Disease burden and unmet medical need in severe hemophilia in Greece: insights from clinicians and patients, Frontiers in Public Health, 10.3389/fpubh.2026.1766482, 14, (2026).
- Caitlin Montcrieff, Jorge Caicedo, Alicia Cerretani, Angela (Qi) Fan, Michael Bullano, Ekaterina Ponomareva, Bleeding rates, healthcare utilization, and costs among patients with hemophilia a without inhibitors treated with concomitant octocog alfa or extended half-life factor VIII while on emicizumab prophylaxis, Journal of Medical Economics, 10.1080/13696998.2026.2642552, 29, 1, (835-847), (2026).
- Lisa Young, Lu Ban, Yong Chen, Patrick F. Fogarty, Clinical Burden and Healthcare Resource Use Among Adults Living with Hemophilia A: An Observational Study, Drugs - Real World Outcomes, 10.1007/s40801-025-00516-8, 12, 4, (581-591), (2025).
- Dominik Obermüller, Karin Berger, Robert Klamroth, Maria Kleppisch, Stephan Rauchensteiner, Ines Ecke, Sandra Hermann, Dorota Pawlowska-Phelan, Dennis Häckl, Agnes Kisser, Epidemiology, Health Care Resource Utilization, and Costs of Hemophilia A and B by Treatment Regimen: A Retrospective Analysis of German Claims Data from 2016 to 2021, Hämostaseologie, 10.1055/a-2558-9886, (2025).
- Mark T. Reding, María Teresa Álvarez‐Román, Giancarlo Castaman, Maissaa Janbain, Tadashi Matsushita, Karina Meijer, Kathrin Schmidt, Johannes Oldenburg, Interim analyses of the multinational real‐world prospective cohort HEM‐POWR study evaluating the effectiveness and safety of damoctocog alfa pegol in patients with hemophilia A , European Journal of Haematology, 10.1111/ejh.14114, 112, 2, (286-295), (2023).
- Luying Zhang, Peng Zhang, Wen Chen, Treatment regimens, patient reported outcomes and health-related quality of life in children with moderate and severe hemophilia A in China: using real-world data, Orphanet Journal of Rare Diseases, 10.1186/s13023-023-02835-x, 18, 1, (2023).
- Yilin Chen, Spencer J Cheng, Tyler Thornhill, Paul Solari, Sean D Sullivan, Health care costs and resource use of managing hemophilia A: A targeted literature review, Journal of Managed Care & Specialty Pharmacy, 10.18553/jmcp.2023.29.6.647, 29, 6, (647-658), (2023).
- Miguel Escobar, Neha Agrawal, Sagnik Chatterjee, Swastik Bhattacharya, Jorge Caicedo, Michael Bullano, Bob G. Schultz, Impact of switching prophylaxis treatment from factor VIII to emicizumab in hemophilia A patients without inhibitors, Journal of Medical Economics, 10.1080/13696998.2023.2196922, 26, 1, (574-580), (2023).
- Katharine Batt, Bob G. Schultz, Jorge Caicedo, Christopher S. Hollenbeak, Neha Agrawal, Sagnik Chatterjee, Michael Bullano, A real-world study comparing pre-post billed annualized bleed rates and total cost of care among non-inhibitor patients with hemophilia A switching from FVIII prophylaxis to emicizumab, Current Medical Research and Opinion, 10.1080/03007995.2022.2105072, 38, 10, (1685-1693), (2022).
- Lorraine Cafuir, Adina Estrin, Er Chen, David Hinds, Patricia Prince, Jennifer Thorburn, Henry Mead, Christine L. Kempton, Early real-world experience with emicizumab and concomitant factor VIII replacement products in adult males with Hemophilia A without inhibitors, Journal of Medical Economics, 10.1080/13696998.2022.2102779, 25, 1, (984-992), (2022).