Review and estimation of disutility for joint health states of severe and nonsevere hypoglycemic events in diabetes
Publication: Journal of Comparative Effectiveness Research
Abstract
Aim: Many economic evaluations used linear or log-transformed additive methods to estimate the disutility of hypoglycemic events in diabetes, both nonsevere (NSHEs) and severe (SHEs). Methods: We conducted a literature search for studies of disutility for hypoglycemia. We used additive, minimum and multiplicative methods, and the adjusted decrement estimator to estimate the disutilities of joint health states with both NSHEs and SHEs in six scenarios. Results: Twenty-four studies reported disutilities for hypoglycemia in diabetes. Based on construct validity, the adjusted decrement estimator method likely provides less biased estimates, predicting that when SHEs occur, the additional impact from NSHEs is marginal. Conclusion: Our proposed new method provides a different perspective on the estimation of quality-adjusted life-years in economic evaluations of hypoglycemic treatments.
Hypoglycemia is a common side effect that people with Type 1 or Type 2 diabetes may experience when taking blood sugar-lowering medications [1]. It is characterized by low blood glucose levels and can be asymptomatic (biochemical) or symptomatic (mild, moderate or severe) [2,3]. By clinical definition, nonsevere hypoglycemic events (NSHEs) can be self-treated (by eating or drinking food items containing carbohydrates), while severe hypoglycemic events (SHEs) require assistance from another person [1,3,4]. Both types of events can occur in the daytime (normal waking hours) or nocturnally (usually defined as while sleeping or attempting to sleep) [5].
Many of the classic long-term diabetes economic models (e.g., United Kingdom Prospective Diabetes Study [UKPDS] Outcomes Model, CORE [Switzerland's Center for Outcomes Research] Diabetes Model) only accounted for SHEs [6,7]. However, NSHEs may have health and economic impacts for people with diabetes [8]. Recent economic evaluations incorporated the benefits of reduced NSHEs on health-related quality of life (HRQoL) [9–20], most using disutilities derived from a study by Evans et al. [4]. This study defined 13 health states to describe different types and frequencies of hypoglycemic events and elicited time trade-off (TTO) utilities from 8286 adults from the general population (including 551 people with Type 1 diabetes and 1603 with Type 2 diabetes) in five countries (Canada, Germany, Sweden, United Kingdom and USA). The authors estimated that the average disutility per single hypoglycemic event was 0.004 for a daytime NSHE, 0.007 for a nocturnal NSHE, 0.057 for a daytime SHE and 0.062 for a nocturnal SHE [4]. However, this study did not estimate disutility (or utility) for joint health states with different types of hypoglycemic events. Based on the country-specific results or the average results across the five countries from Evans et al. [4], later economic evaluations used either a linear additive or log additive method [21] to estimate the overall health impacts of different types of hypoglycemic events.
In the linear additive method, the disutility per event for each type of event is multiplied by the corresponding frequency of events per year and added together [10,11,17,20], This method can be expressed using the following formula:
where DSN is the total reduction in health utilities from hypoglycemia; NdNSHE, NnNSHE, NdSHE and NnSHE are the yearly frequencies of daytime NSHE, nocturnal NSHE, daytime SHE and nocturnal SHE, respectively; and β1, β2, β3 and β4 are the disutility values per event (i.e., coefficient) associated with daytime NSHE, nocturnal NSHE, daytime SHE and nocturnal SHE, respectively.
This linear additive method has two possible concerns:
•
The relationship between the frequency of hypoglycemic events per year and the overall effect of hypoglycemia on utility is not linear. As the frequency of hypoglycemic events increases, utility per event decreases at a variable rate. For example, in the study by Evans et al., the average impact on utility for a nocturnal NSHE decreases from 0.0033 for 12 events a year (0.040 for one event per month) to 0.00074 for 156 events a year (0.115 for three events per week) [4].
•
The additive approach may be not appropriate for estimating overall impact on utility for different types of hypoglycemic events because the types of events are highly correlated and each event impacts HRQoL. Patients are likely to experience both daytime and nocturnal SHEs and NSHEs [5,22]. We can demonstrate this phenomenon using multiple linear regression models, where multicollinearity may impact the effect of predictor variables on the response variable.
The log additive method is also often used in economic evaluations [14,15,18,19]. Lauridsen et al. applied log-transformed estimates of disutility values associated with daytime and nocturnal NSHEs and added them together for the overall impact of NSHEs [21]. This method overcomes our first concern regarding the nonlinear association between disutility and the number of NSHEs, but it does not directly address how to account for the correlation between SHEs and NSHEs. Therefore, a new method to estimate the disutility of joint NSHEs and SHEs is needed.
The objectives of the present study were to review the published literature on disutility due to hypoglycemia, and suggest new approaches to estimate the disutility for the joint health states of SHEs and NSHEs with appropriate consideration of the cumulative impact of NSHEs and SHEs, for application in cost-utility analyses.
Methods
Literature review
We performed a literature search in June 2021 using the Ovid interface in the Medline and Embase databases to identify studies published from 1 January 2000–11 June 2021 that reported utility and/or disutility due to hypoglycemia for Type 1 or Type 2 diabetes. We used controlled vocabulary (e.g., Medical Subject Headings) and relevant keywords, such as ‘hypoglycemia’ and ‘diabetes’ and ‘utility’ and ‘health related quality of life.’ See Supplementary Material 1 for the details of our literature search strategies. We excluded abstracts, conference proceedings and articles published in languages other than English. We also excluded studies if the disutility value due to hypoglycemia could not be estimated (e.g., no information on baseline utility). We included studies in which diabetic patients provided utilities or disutilities for their own experiences with hypoglycemia, as well as those in which respondents from the general public provided direct utilities (e.g., TTO) for hypothetical health states of hypoglycemia. Eliciting health state utilities from the general population is the standard method for utility studies. Furthermore, we examined the reference lists in published reviews of HRQoL and health utility studies for additional relevant studies [23–26]. When a study reported results of several analyses (e.g., using different statistical models), we summarized the utility and disutility results from the main analyses. Due to heterogeneity amongst studies, we did not conduct a meta-analysis.
A single author (XX) conducted an initial screening of titles and abstracts and retrieved the full text articles of studies that were potentially eligible for review. Two authors (XX and KEB) independently reviewed the full-text articles to select studies for inclusion. Data from selected studies were extracted by XX and verified by JG.
Overview of methods to estimate disutility of the joint health states: the basics
Nonparametric methods that are commonly used to estimate joint health state utilities include the additive, minimum and multiplicative methods, and adjusted decrement estimator (ADE) [27,28]. We provide a brief introduction to these methods below. For simplicity, we begin with a perfect baseline health state (baseline utility = 1). UA and UB denote the mean utilities for individuals with single condition A or B, respectively. Also, the utility decrements for conditions A and B are denoted as 1 – UA and 1 – UB, respectively. UJ denotes the mean joint health utility for individuals who have both conditions A and B, and the utility decrement of the joint health state is denoted by 1 – UJ.
Additive method
Minimum method
Multiplicative method
The multiplicative method assumes that for each additional condition, the disutility impact is proportional to the disutility already experienced [27]:
ADE method
This method incorporates all three of the above. It calculates the joint utility as the minimum utility minus the minimum utility multiplied by the two disutilities [28,29]:
We extended the above methods to estimate the utilities for the joint health states for NSHEs and SHEs. We defined the utility from diabetes without any hypoglycemic events as the baseline utility, and considered up to four health conditions for daytime and nocturnal NSHEs and SHEs. Finally, we estimated the disutility of a joint health state (DJ) which is the difference between the utility of the joint health state and baseline utility (U0):
In the Supplementary Materials 2 & 3, we provide the details of the process of estimating disutility of the joint health states of hypoglycemic events. We used SAS 9.4 (SAS Institute, NC, USA) to perform the analyses. The SAS code is available on request from the corresponding author.
Methods of estimating disutility of the joint four health states: daytime NSHE, nocturnal NSHE, daytime SHE and nocturnal SHE
The disutility of a joint health state is the difference between the utility of the joint health state and baseline utility. We chose a study that derived utilities for hypoglycemia using TTO in the general population (Evans et al.) [4] to estimate the disutility for joint SHEs and NSHEs due to the following considerations:
•
We expected that the severity and frequency of hypoglycemic events should impact utility. This study provided the disutilities for daytime and nocturnal SHEs and NSHEs separately, which can be used for estimating the disutility for joint health states at the given frequencies of SHEs and NSHEs.
•
The health states included events which have short-term impact and long-term impact.
•
Many published economic evaluations used this study to estimate disutility for hypoglycemic events.
To illustrate the estimation of disutility in joint health states, we used the results of a recent survey study in 552 individuals with Type 1 (n = 94) and Type 2 (n = 456) diabetes in Canada [5]. We assumed that the number of each type of hypoglycemic event follows a Poisson distribution. Based on the median, 10th percentile and 90th percentile of simulated data of hypoglycemic events for Type 1 and Type 2 diabetes, we created six hypothetical scenarios (Table 1), with low, medium and high frequencies of NSHEs and SHEs. We first estimated the disutility for each type of event (the disutility values per event [4] multiplied by the corresponding frequency of events per year, or log-transformed estimates of disutility values associated with daytime and nocturnal NSHEs by Lauridsen et al. [21]), and then estimated the disutility of joint health states with four types of events (daytime NSHE, nocturnal NSHE, daytime SHE and nocturnal SHE) using four commonly used nonparametric methods discussed above. See Supplementary Material 2.
| Hypothetical hypoglycemia scenario | Scenario description and frequency (per patient-year [n]) of hypoglycemic events† | Disutility of each type of hypoglycemic event (Linear)‡ | Disutility of daytime and nocturnal NSHE (Log)§ | ||||||||
|---|---|---|---|---|---|---|---|---|---|---|---|
| Diabetes | dNSHE (n) | nNSHE (n) | dSHE (n) | nSHE (n) | DdNSHE | DnNSHE | DdSHE | DnSHE | DdNSHE | DnNSHE | |
| Scenario 1 | Type 1-M | 42 | 14 | 1 | 1 | -0.168 | -0.098 | -0.057 | -0.062 | -0.050 | -0.052 |
| Scenario 2 | Type 1-L | 34 | 9 | 0 | 0 | -0.136 | -0.063 | 0 | 0 | -0.047 | -0.045 |
| Scenario 3 | Type 1-H | 50 | 19 | 3 | 2 | -0.2 | -0.133 | -0.171 | -0.124 | -0.053 | -0.058 |
| Scenario 4 | Type 2-M | 17 | 11 | 1 | 1 | -0.068 | -0.077 | -0.057 | -0.062 | -0.037 | -0.048 |
| Scenario 5 | Type 2-L | 12 | 7 | 0 | 0 | -0.048 | -0.049 | 0 | 0 | -0.033 | -0.042 |
| Scenario 6 | Type 2-H | 22 | 16 | 3 | 2 | -0.088 | -0.112 | -0.171 | -0.124 | -0.040 | -0.055 |
The baseline utility for diabetes with no hypoglycemic events is 0.844 [4].
†
dNSHE, nNSHE, dSHE and nSHE are the yearly frequencies of daytime NSHE, nocturnal NSHE, daytime SHE and nocturnal SHE, respectively. Type 1-M, Type 1-L are Type 1-H represent the Type 1 diabetes with medium, low and high frequencies of hypoglycemic events. Type 2-M, Type 2-L are Type 2-H represent the Type 2 diabetes with medium, low and high frequencies of hypoglycemic events.
‡
DdNSHE, DnNSHE, DdSHE and DnSHE are the disutilities due to daytime NSHE, nocturnal NSHE, daytime SHE and nocturnal SHE, respectively. The average disutility per single hypoglycemic event was 0.004 for a daytime NSHE, 0.007 for a nocturnal NSHE, 0.057 for a daytime SHE and 0.062 for a nocturnal SHE [4]. The disutility for each type of hypoglycemic events is equal to the disutility per event for each type of event multiplied by the corresponding frequency of events per year (i.e., the linear method).
§
We used the log-transformed estimates of disutility values associated with daytime and nocturnal NSHEs by the formula from Lauridsen et al. (authors did not introduce the log-transformed estimates of disutility for SHEs) [21].
D: Disutility; n: Number; NSHE: Nonsevere hypoglycemic event; SHE: Severe hypoglycemic event.
Methods of estimating the disutility for joint two health states: NSHE and SHE
Other than their time of occurrence, daytime and nocturnal hypoglycemic events are similarly defined [4]. We therefore combined daytime NSHEs and nocturnal NSHEs to estimate the total number of NSHEs, and combined daytime and nocturnal SHEs to estimate the number of SHEs. We assumed the total number of NSHEs and SHEs would jointly predict the disutility. We first estimated the disutility values associated with the total number of NSHEs and SHEs separately [4]. A recent Canadian study showed that 25 and 40% of hypoglycemic events were nocturnal for Type 1 and Type 2 diabetes, respectively [5]. We assumed that NSHEs occur randomly throughout the 24 hour day, so the disutility of any NSHEs at a given frequency would be approximately equal to the weighted disutility of daytime NSHEs (75% weight) and nocturnal NSHEs (25% weight).
We used the linear regression model to predict the disutility from the transformed number of events. Transformations on a dependent variable change the distribution of error terms while transformations on the independent variable often have less impact on the distribution of error terms [30]. Thus, we used six different methods to transform the total number of NSHEs per year (i.e., the independent variable), but not disutility (the dependent variable). We used R2, the sum of squares due to error and mean absolute error to evaluate the prediction models. The same approach was used to estimate the disutility due to SHEs. Since the best prediction models fitted the observed data well (e.g., R2 = 0.98 for NSHEs and R2 = 1.00 for SHEs), we considered that the prediction model met our requirement and did not try other models.
We used the ADE [29] and multiplicative method [28] to estimate the joint utility of diabetes-specific health states with both NSHEs and SHEs. We did not use the additive method because it assumes that each condition independently affects the distutility [27], or the minimum utility method because it does not account for the additional impact from other conditions. Supplementary Material 3 & Supplementary Tables 1 & 2 provide the details of estimating the disutility for joint health states of SHEs and NSHEs.
Construct validation of the estimation of joint disutility due to hypoglycemic events
We used two approaches to validate the findings. Firstly, we compared the estimated disutility of the ‘average’ Type 1 diabetes (scenario 1) and Type 2 diabetes (scenario 4) by different methods with the adjusted disutilities in our review. The adjusted disutility (i.e., the coefficients from the regression model) reflects the mean change of utility value between diabetes with hypoglycemia versus diabetes without hypoglycemia, after controlling various factors. Because diabetic patients with SHEs generally experience NSHEs, the coefficients of SHEs versus no hypoglycemia can be considered as the mean joint disutility due to SHEs and NSHEs for these patients.
Secondly, we compared the disutility estimates from the joint four and two health states by different methods to the disutilities of various diabetes complications from the CORE diabetes model and the UKPDS cost-utility analysis model (Supplementary Table 3) [6,31]. Both of these models have been widely used worldwide. Although they have been updated, their utilities have not been changed [7]. We also included a recent study which derived EQ-5D-5L utilities for diabetic complications from 4963 diabetic patients [32].
Results
Literature review
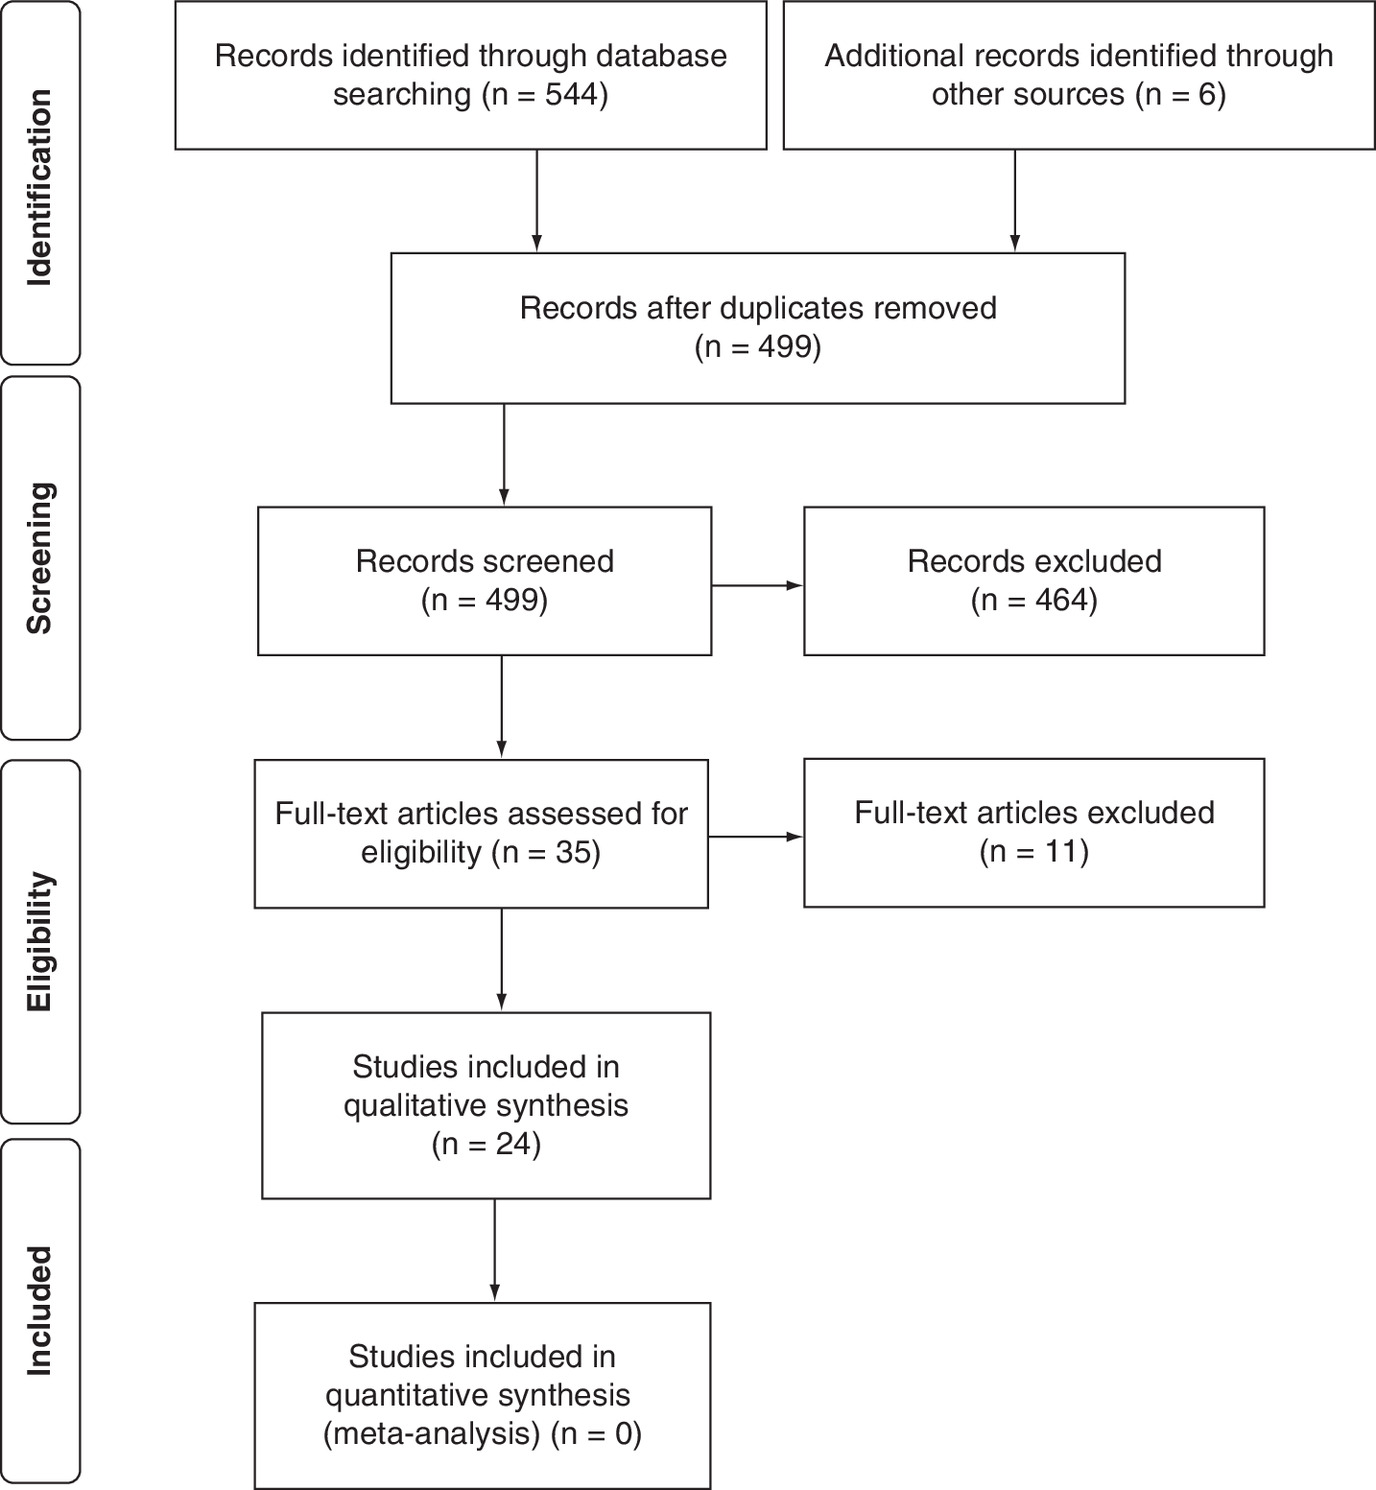
We identified 24 studies that met our inclusion criteria [4,32–45]. Detailed results of the literature search, selection and exclusion are summarized in a Preferred Reporting Items for Systematic Reviews and Meta-analyses (PRISMA) flow diagram (Figure 1) [46]. Nineteen studies elicited disutility of hypoglycemia from patients with diabetes (Table 2 & Supplementary Table 4) [32–43,47–53] and five obtained utilities for scenarios from the general public (Supplementary Tables 5 & 6) [4,44,45,54,55].
| Author (year) | Diabetes type (n) | Type of hypoglycemia, n (%) | Utility measure | Unadjusted utility, mean ± SD | Adjusted disutility†, mean (SE) or mean (CI: 95%) | Ref. |
|---|---|---|---|---|---|---|
| Neuwahl et al., (2021) | Type 2 (15252) | No hypo: NR With hypo: NR; number of hypo events requiring any assistance = 1247 | HUI-3 | NR NR | – -0.001 (0.006), NS | [47] |
| Gordon et al., (2020) | Type 1 (648) | Severe hypo (yes vs no): 6 (0.9%) Log transformed number of symptomatic hypo | EQ-5D-3L | – – | Calculated: -0.035†† Calculated: -0.0032†† | [33] |
| Yfantopoulos et al., (2020) | Type 2 (938) | No severe hypo: 798 (84.9%) Severe hypoglycemia: 140 (15.1%) | EQ-5D-5L | 0.728 ± 0.234 0.634 ± 0.238 | – -0.050 (-0.091 to -0.009) | [34] |
| Zhang et al., (2020) | Type 2 (7081) | Symptomatic hypoglycemia: 711 (10.4%) Severe hypoglycemia: 344 (4.9%) | EQ-5D-3L | NR NR | -0.007 (0.002) for an additional event -0.008 (0.004) for an additional event | [35] |
| Shao et al., (2019) | Type 2 (8713) | No Hypo: NA Symptomatic hypo (event year): NA Symptomatic hypo (successive years): NA Severe (event year): NA Severe (successive years): NA | HUI-3 | 0.71 ± 0.26 0.64 ± 0.30 0.62 ± 0.29 0.66 ± 0.28 0.66 ± 0.28 | Both severe and symptomatic: -0.036 (0.010) for event year -0.033 (0.011) for successive years | [36] |
| Takahara et al., (2019) | Type 1 and Type 2 (4963) | No severe or nocturnal hypo: 4784 (96.1%) Severe or nocturnal hypo: 179 (3.6%) | EQ-5D-5L | 0.905 ± 0.135 0.831 ± 0.155 | – -0.025 (0.012) | [32] |
| Pratipanawatr et al., (2019) | Type 2 (659) | No hypo: 457 (69.3%) With hypo: 202 (30.7%) – Mild: 119 (59.4%) – Moderate: 67 (33.2%) – Severe/very severe: 15 (7.4%) | EQ-5D-3L | 0.79 ± 0.31 NR 0.62 ± 0.47 0.68 ± 0.38 0.58 ± 0.51 | – – -0.156 (-0.225, -0.087) -0.096 (-0.183, -0.008) -0.198 (-0.373, -0.023) | [48] |
| Pagkalos et al., (2018) | Type 2 (383) | No hypo: 218 (56.9%) With hypo: 165 (43.1%) – Mild: 82 (49.7%) – Moderate: 68 (41.2%) – Severe/very severe: 15 (9.1%) | EQ-5D-3L | 0.8 ± 0.2 0.7 ± 0.2 NR NR NR | – Model A§: -0.040 (NR), NS Model B§: -0.018 (NR), NS Model B§: -0.043 (NR), NS Model B§: -0.151 (NR) | [49] |
| Pawaskar et al., (2018a) | Type 2 (3630) | No hypo: 1729 (47.6%) With hypo: 1901 (52.4%) – Nonsevere hypo: 1729 (91.0%) – Severe hypo: 172 (9.0%) | SF-6D | 0.68 NR 0.66 0.60 | – – – – | [50] |
| Pawaskar et al., (2018b) | Type 2 (1269) | No hypo: 652 (51.4%) With hypo: 617 (48.6%) – Nonsevere hypo: 533 (86.3%) – Severe hypo: 84 (13.6%) | SF-6D | 0.64 NR 0.62 0.58 | – – – – | [51] |
| Cvetanović et al., (2017) | Type 2 (269) | No hypo: 78 (29.0%) With Hypo: 191 (71.0%) | EQ-5D-3L | 0.87 0.85 | – NS | [52] |
| Peasgood et al., (2016) | Type 1 (2453) | No severe hypo: 1923 (78%) Severe hypo: 530 (22%) | EQ-5D-3L and SF-6D | NR NR | – EQ-5D-3L: -0.002 (0.002), NS SF-6D: -0.003 (0.002), NS | [37] |
| Sheu et al., (2012) | Type 2 (2257) | No hypo: 1388 (61.5%) With hypo: 869 (38.5%) – Mild: 508 (58.5%) – Moderate: 189 (21.7%) – Severe: 101 (11.6%) – Very severe: 71 (8.2%) | EQ-5D-3L | 0.90 ± 0.15 0.88 ± 0.15 0.89 ± 0.14 0.85 ± 0.15 0.87 ± 0.17 0.87 ± 0.13 | – Any hypo: -0.019 (NR) – – – – | [53] |
| Solli et al., (2010) | Type 1 (165) Type 2 (356) | Hypo index (3 levels): NR Hypo index (3 levels): NR | EQ-5D-3L EQ-5D-3L | NR NR | -0.023 (-0.071 to 0.025), NS -0.004 (-0.039 to 0.032), NS | [38] |
| Marrett et al., (2009) | Type 2 (1984) | No hypo: 736 (37%) With hypo: 1248 (63%) – Mild: 540 (45.6%)‡ – Moderate: 442 (37.4%)‡ – Severe or very severe: 201 (17.0%)‡ | EQ-5D-3L | 0.86 ± 0.16 0.78 ± 0.19 0.83 ± 0.16 0.77 ± 0.17 0.67 ± 0.24 | – Model A§: -0.05 (NR) Model B§: NR and NS Model B§: -0.05 (NR) Model B§: -0.16 (NR) | [39] |
| Vexiau et al., (2008) | Type 2 (400) | No hypo: 264 (66%) With hypo: 136 (34%) – Mild: 78 (58.2%) – Moderate: 40 (29.9%) – Severe or very severe: 16 (11.9%) | EQ-5D-3L | 0.80 ± 0.23 0.70 ± 0.26 0.73 ± NR 0.70 ± NR 0.54 ± NR | – Model A§: -0.09 (NR) Model B§: -0.07 (NR) Model B§: -0.08 (NR) Model B§: -0.27 (NR) | [40] |
| Currie et al., (2006) | Type 1 (419) | No hypo: 64 (15%) With hypo: 355 (85%) – Mild: NR – Moderate: NR – Severe: 43 (12%) | EQ-5D-3L | 0.644 ± 0.34 NR 0.758 ± 0.261 0.68 ± 0.341 0.522 ± 0.422 | – – – – – | [41] |
| Type 2 (768) | No hypo: 340 (44%)¶ With hypo: 428 (56%)¶ – Mild: NR – Moderate: NR – Severe: 25 (6%)¶ | EQ-5D-3L | 0.711 ± 0.281 NR 0.656 ± 0.309 0.49 ± 0.353 0.467 ± 0.326 | – – – – – | ||
| All Type 1 and Type 2 (1187) | Severe hypo (yes vs no): NR Log transformed number of symptomatic hypo | EQ-5D-3L | – – | Calculated: -0.047†† Calculated: -0.0142†† | ||
| Lundkvist et al., (2005) | Type 2 (307) | No hypo: 193 (63%) With hypo: 114 (37) | EQ-5D-3L | 0.77 ± 0.24 0.70 ± 0.27 | – -0.047 (0.0302), NS | [42] |
| Davis et al., (2005) | Type 1 and Type 2 (861) | No hypo: 232 (27%) With hypo: 629 (73%) – Mild or moderate: 516 (60%)# – Severe: 57 (7%)# – Nocturnal only: 191 (22%)# | EQ-5D-3L | NR NR 0.65 ± 0.33 0.53 ± 0.38 0.77 ± 0.17 | – – – – – | [43] |
†
Except these with note of ‘not significant,’ the adjusted disutility was statistically significant at a significance level of 0.05.
‡
There were 1183 out of 1248 Type 2 diabetes patients who reported the severity level of hypoglycemia [39].
§
¶
For Type 2 diabetes, authors reported results by insulin users (n = 168) and patients using only oral agents (n = 600) separately in Table 3 [41]. We combined the data of these two categories.
#
A small number of patients did not report the severity level. Also, there was some overlap between the categories of ‘nocturnal only’ and ‘mild, moderate or severe’ hypoglycemia.
††
It was calculated from the two-stage model. We provided the details of calculation process using Currie et al. [41]. In the first stage model to predict hypoglycemia fear survey (HFS) score, the coefficients of severe hypoglycemia and Log transformed number of symptomatic hypoglycemias were 5.881 and 1.773, respectively. In the second stage model to predict utility, the coefficient of HFS score was -0.008. Then, it was calculated that the coefficient for severe hypoglycemia and Log transformed number of symptomatic hypoglycemias were -0.047 (5.881× [-0.008]) and -0.0142 (1.773× [-0.008]), respectively. However, both first stage and second stage models were relatively poor predictive model with low R2. See Supplementary Table 1 for more details.
EQ-5D-3L: EuroQol–5 dimension–3 level; EQ-5D-5L: EuroQol–5 dimension–5 level; hypo: Hypoglycemia; HUI-3: Health Utilities Index Mark 3; n: number; NA: Not applicable; NR: Not reported; NS: Not statistically significant at a significance level of 0.05; SE: Standard error; SF-6D: Short form–6 dimension.
The 19 studies in patients used different definitions for the severity of hypoglycemic events, which occurred between 4 weeks [33,42] and 1 year [37] before the date of the survey or interview. Sixteen studies used multiple linear or mixed linear models to evaluate disutility due to hypoglycemia (yes or no, or by severity), with adjustments for other common diabetic complications and patients' characteristics. All studies showed that hypoglycemic events were associated with reduced health utility, however, the magnitude of disutility varied greatly. Four studies in patients with Type 2 diabetes showed large absolute disutilities for severe hypoglycemia, 0.15 [49], 0.16 [39], 0.20 [48] and 0.27 [40]. Interestingly, the patients in all of these studies were Type 2 diabetics treated with oral antihyperglycaemic agents (e.g., sulphonylurea) [39,40,48,49]. In the other studies, the disutility of severe hypoglycemia ranged from -0.05 [34] to -0.002 [37] . Compared with studies which primarily evaluated the impact of hypoglycemia on HRQoL for diabetes, the studies which investigated the impact of several diabetic complications (including hypoglycemia) on HRQoL seemed to find a smaller magnitude of utility decrement for hypoglycemia. We also observed the following trends:
•
Only two studies [33,41] included the frequency of hypoglycemic events (using a log transformed total number of symptomatic hypoglycemic events in the past 4 weeks [33] or 3 months [41]) in a two-stage model, while authors suggested that the model had ‘lack of fit’ [41]. Supplementary Table 4 provides details of the included studies.
Five studies elicited TTO utilities for hypothetical health states from the general public [4,44,45,54,55]. A study from Malaysia showed that the disutility per daytime NSHE was -0.0354, and the disutility per daytime SHE was -0.3619 [54]. But, the absolute values of disutility for hypoglycemia were much smaller in the other four studies conducted in developed countries [4,44,45,55]. The disutility per SHE was approximately -0.06 [4,44]; and the disutility per NSHE ranged from -0.0032 to -0.0076. Supplementary Table 5 provides details of these studies, including the statistical methods to estimate disutility per hypoglycemic event.
Disutility of the joint four health states: daytime NSHE, nocturnal NSHE, daytime SHE & nocturnal SHE
As described previously, we created six hypothetical diabetes scenarios with different frequencies of SHEs and NSHEs. The disutility of each type of hypoglycemic event estimated using the linear approach was larger than that using the log-transformed method, and the differences between the two approaches were larger when the rates of NSHE were high, such as scenarios 3 and 6 (Table 1).
We also used four methods to estimate the disutility for joint states of different types of hypoglycemic events (Table 3). Not surprisingly, the minimum utility method resulted in the smallest absolute value of disutility, and the additive method was associated with the largest absolute value of disutility. The absolute value of disutility using the multiplicative method was greater than using the ADE.
| Hypothetical hypoglycemia scenario† | Disutility of joint health states by different methods (Linear)‡ | Disutility in joint health states by different methods (Log)§ | ||||||
|---|---|---|---|---|---|---|---|---|
| Additive | Minimum | Multiplicative | ADE | Additive | Minimum | Multiplicative | ADE | |
| Scenario 1 | -0.385 | -0.168 | -0.328 | -0.194 | -0.222 | -0.062 | -0.201 | -0.070 |
| Scenario 2 | -0.199 | -0.136 | -0.189 | -0.142 | -0.092 | -0.047 | -0.090 | -0.048 |
| Scenario 3 | -0.628 | -0.200 | -0.475 | -0.258 | -0.406 | -0.171 | -0.343 | -0.199 |
| Scenario 4 | -0.264 | -0.077 | -0.235 | -0.089 | -0.204 | -0.062 | -0.187 | -0.069 |
| Scenario 5 | -0.097 | -0.049 | -0.094 | -0.051 | -0.075 | -0.042 | -0.073 | -0.043 |
| Scenario 6 | -0.495 | -0.171 | -0.398 | -0.210 | -0.390 | -0.171 | -0.333 | -0.197 |
The baseline utility for diabetes with no hypoglycemic events is 0.844 [4].
†
See Table 1 for descriptions of the scenarios.
‡
The disutility for each type of hypoglycemic event is equal to the disutility per event for each type of event multiplied by the corresponding frequency of events per year (i.e., the linear method). Then, we used the additive, minimum, multiplicative and ADE methods to estimate the disutility for the joint health states.
§
We used the log-transformed estimates of disutility values associated with daytime and nocturnal nonsevere hypoglycemic events by Lauridsen et al. (authors did not introduce the log-transformed estimates of disutility for severe hypoglycemic events) [21]. Then, we used the additive, minimum, multiplicative and ADE methods to estimate the disutility for the joint health states.
ADE: Adjusted decrement estimator.
Disutility of the joint two health states: NSHE & SHE
We identified the best fitting models (Supplementary Table 2) for NSHEs (formula S3.6) and SHEs (formula S3.7) in Supplementary Material 3, and used these models to predict the disutilities for NSHEs and SHEs in six hypothetical diabetes scenarios (Table 4). We then estimated the disutilities for joint NSHEs and SHEs using the ADE and multiplicative method.
| Hypothetical hypoglycemia scenario | Frequency (n per patient-year) | Disutility of each type of hypoglycemic events, mean (SE) | Disutility of joint health states by method, mean (SE) | |||
|---|---|---|---|---|---|---|
| NSHE (n) | SHE (n) | DNSHE† | DSHE‡ | ADE§ | Multiplicative¶ | |
| Scenario 1 | 56 | 2 | -0.056 (0.004) | -0.092 (0.001) | -0.096 (0.001) | -0.142 (0.004) |
| Scenario 2 | 43 | 0 | -0.051 (0.004) | NA | -0.051 (0.004) | -0.051 (0.004) |
| Scenario 3 | 69 | 5 | -0.060 (0.004) | -0.111 (0.001) | -0.116 (0.001) | -0.163 (0.004) |
| Scenario 4 | 28 | 2 | -0.044 (0.003) | -0.092 (0.001) | -0.095 (0.001) | -0.132 (0.003) |
| Scenario 5 | 19 | 0 | -0.039 (0.003) | NA | -0.039 (0.003) | -0.039 (0.003) |
| Scenario 6 | 38 | 5 | -0.049 (0.003) | -0.111 (0.001) | -0.115 (0.001) | -0.153 (0.003) |
The baseline utility for diabetes with no hypoglycemic events is 0.844 [4].
†
The disutility estimates for NSHEs were based the best-fitting model, Formula S3.6 in Supplementary Material 3.
‡
The disutility estimates for SHEs were based the best-fitting model, Formula S3.7 in Supplementary Material 3.
§
The disutility estimates for joint health states were based on the ADE, Formulas S3.3 and S3.4 in Supplementary Material 3.
¶
The disutility estimates for joint health states were based on the multiplicative method, Formulas S3.4 and S3.5 in Supplementary Material 3.
ADE: Adjusted decrement estimator; NA: Not applicable; n: Number; NSHE: Nonsevere hypoglycemic event; SE: Standard error; SHE: Severe hypoglycemic event.
Assessment of the construct validity for disutility of joint health states
Tables 3 & 4 show that both the ADE and multiplicative methods estimated higher utilities (or smaller absolute values of disutility) than the linear additive and log additive methods. The best method is likely to depend on the dataset used for validation. Our literature review showed a large variation in estimated disutility values (Table 2). If using the validation datasets from studies with very large absolute disutilities for severe hypoglycemia [39,40,48,49], (adjusted disutility ranging from -0.27 to -0.15), the multiplicative method is likely to be less biased, as its estimated joint disutilities of ‘average’ Type 1 (Scenario 1) and Type 2 (Scenario 4) diabetes were closer to the mean disutility in these studies, compared with the additive and ADE methods. However, if using other studies as the validation datasets [34,38,41], we may find that the ADE method resulted in smaller utility decrements, which are closer to the disutility reported than multiplicative method. Furthermore, when frequencies of NSHEs and SHEs are high (Scenarios 3 and 6), the absolute values of disutility are very large using the additive and multiplicative methods.
We compared the joint health state of SHE and NSHE with utilities for other diabetic complications. The impact of SHE on HRQoL, while considerable, is on average likely smaller than that of complications such as myocardial infarction, stroke, congestive heart failure, or amputation. Based on our clinical judgement, some studies [39,40,48,49] may overestimate the health impact of SHE, and the ADE method is likely to provide more conservative and less-biased estimates. We can interpret this model to mean that when a person with diabetes has SHEs, the additional health impact from NSHEs is marginal.
For the remaining two hypothetical scenarios with 19 (scenario 5) and 43 (scenario 2) NSHEs per year with no SHEs, the absolute values of disutilities were 0.039 and 0.051, respectively, using the best-fitting NSHE model (Table 4), while the linear additive and log additive methods resulted in absolute disutility values ranging from 0.097 to 0.199, and from 0.075 to 0.092, respectively (Table 3). Evans et al. [4] reported that the disutilities of 12 (1 event per month) and 52 (1 event per week) daytime NSHEs were -0.032 and -0.036, respectively; and the disutilities of 12 and 52 nocturnal NSHEs were -0.040 and -0.069, respectively. Thus, the predicted disutilities from our model fit the observed data well, while the disutility estimates from the linear additive and log additive methods were significantly higher than observed (Supplementary Table 3).
Discussion
Based on a literature review and an analysis of several methods to estimate the disutilities of joint hypoglycemic events in diabetes, considering both their type and frequency, we recommend estimating the disutility due to NSHEs (Formula S3.6) and SHEs (Formula S3.7) (i.e., two health states approach), and then using the ADE method to estimate the disutility of joint NSHEs and SHEs (Formulas S3.3 and S3.4) for the following reasons:
•
The underlying assumptions for the additive and minimum utility methods are not suitable for hypoglycemic events.
•
•
There is a phenomenon of ‘first being worst’ for hypoglycemic events, such that with increased frequency of events, the marginal disutility per additional NSHE and SHE is reduced [21]. Compared with the approach using four health states, the joint disutilities estimated by our approach considering two health states are less sensitive to the increased frequency of events (i.e., the difference in disutility between the high and low frequencies of events using ADE is smaller than using the multiplicative method). This approach may better reflect the true impact of hypoglycemic events.
•
ADE better captures the strong correlation between different types of hypoglycemic events (e.g., stronger than the correlation between asthma and angina).
Because the true disutilities of the hypothetical scenarios are unknown, we cannot definitely determine which estimate had the least bias. It was not methodologically appropriate to compare the ranges of published utility or disutility values because the measures (e.g., TTO and EQ-5D), statistical models for estimating disutility and baseline utilities were not uniform across studies. However, in practice, most economic evaluations use utility data from multiple sources. As such, it may be reasonable to evaluate the logical consistency of disutility estimates using different methods, if the disutility of a given diabetes complication is reflective of its severity.
Our suggested methods provide conservative estimates of absolute disutilities which were less sensitive to the frequencies of SHEs and NSHEs than the linear additive and log additive methods. Therefore, economic evaluations of interventions to reduce hypoglycemic events that use our methods for estimating hypoglycemia disutilities instead of those methods may result in fewer quality-adjusted life-years (QALYs) gained and very different cost–effectiveness results. For instance, according to the ADE method, if the intervention reduces the frequency of NSHEs (but not SHEs), the impact on hypoglycemia-associated disutility is likely to be marginal. Decision-makers need to understand how methods of estimating disutility are strongly associated with the QALYs gained and judge the credibility of cost–effectiveness results. At least, researchers may examine how cost–effectiveness results change when they use different methods to calculate the disutility of joint SHEs and NSHEs. Also, the best approach for joint SHEs and NSHEs in diabetes may not be the best in other conditions.
Future research in health utility of patients with diabetes should include health states with common diabetic complications, and different severities and frequencies of hypoglycemic events. These studies could help us better understand the impact of joint health states of SHEs and NSHEs, or SHEs or NSHEs alone on baseline utilities, relative to the disutility values for other diabetic complications. Then, we can make more accurate estimates of disutility for diabetes, and provide more reliable cost–effectiveness estimates.
Conclusion
Our literature review showed that the magnitude of disutility for joint hypoglycemic events was highly variable. Our proposed methods for estimating the disutilities for joint health states of SHEs and NSHEs overcome the limitations of the previously used linear additive and log additive methods. It provides a different perspective on the estimation of QALYs for hypoglycemic events and is recommended for economic evaluations of interventions for the treatment of hypoglycemia.
•
Many of the classic long-term diabetes economic models only accounted for severe hypoglycemic events (SHEs). However, nonsevere hypoglycemic events (NSHEs) may have health and economic impacts for people with diabetes.
•
Recent economic evaluations used linear or log-transformed additive methods to estimate the disutility of daytime and nocturnal hypoglycemic events in diabetes, both NSHEs and SHEs, without accounting for the correlation between them.
•
The underlying assumptions for the additive and minimum utility methods are not suitable for hypoglycemic events. The additive method assumes that the conditions that affect the utility function independently with no overlap. The minimum utility method assumes there is no cumulative burden from the other events.
•
We identified 24 studies which reported disutilities for hypoglycemia in diabetes. All studies showed that hypoglycemic events were associated with reduced health utility, however, the magnitude of disutility varied greatly (e.g., from -0.27 to -0.002 for severe hypoglycemia).
•
We chose a study that derived utilities for hypoglycemia using time trade-off in the general population (Evans et al., 2013) to estimate the disutility for joint SHEs and NSHEs. This study provided the disutilities for daytime and nocturnal SHEs and NSHEs separately, which can be used for estimating the disutility for joint health states at the given frequencies of SHEs and NSHEs.
•
We calculated the disutility of daytime and nocturnal NSHEs and SHEs at different frequencies in six scenarios. The disutility estimates for the joint health states of NSHEs and SHEs were smaller using the adjusted decrement estimator (ADE) and multiplicative methods than the linear or log-transformed additive methods. Based on construct validity, the ADE method is likely to provide a less biased estimate. It predicted that when SHEs occur, the additional health impact from NSHEs is marginal.
•
Our suggested methods provide conservative estimates of absolute disutilities which were less sensitive to the frequencies of SHEs and NSHEs than the linear additive and log additive methods. Therefore, economic evaluations of interventions to reduce hypoglycemic events that use our methods for estimating hypoglycemia disutilities instead of additive methods may result in fewer quality-adjusted life-years gained and very different cost–effectiveness results.
•
Future research in health utility of patients with diabetes should include health states with common diabetic complications, and different severities and frequencies of hypoglycemic events. These studies could help us better understand the impact of joint health states of SHEs and NSHEs, or SHEs or NSHEs alone on baseline utilities, relative to the disutility values for other diabetic complications.
Author contributions
X Xie conceived this study idea. X Xie, J Guo, KE Bremner and M Wang designed this study and drafted the manuscript. X Xie conducted the statistical analysis. BR Shah and A Volodin provided important intellectual content, designed the study, revised the draft manuscript and interpreted the results.
Acknowledgments
The opinions expressed in this publication do not necessarily represent the opinions of Ontario Health. No endorsement is intended or should be inferred.
Financial & competing interests disclosure
The authors have no relevant affiliations or financial involvement with any organization or entity with a financial interest in or financial conflict with the subject matter or materials discussed in the manuscript. This includes employment, consultancies, honoraria, stock ownership or options, expert testimony, grants or patents received or pending, or royalties.
No writing assistance was utilized in the production of this manuscript.
Data sharing statement
The data and SAS code that support the findings of this study are available from the corresponding author.
Supplementary Material
File (suppl_file.docx)
- Download
- 145.08 KB
References
Papers of special note have been highlighted as: • of interest; •• of considerable interest
1.
Brod M, Pohlman B, Wolden M, Christensen T. Non-severe nocturnal hypoglycemic events: experience and impacts on patient functioning and well-being. Qual. Life Res. 22(5), 997–1004 (2013).
2.
Seaquist ER, Anderson J, Childs B et al. Hypoglycemia and diabetes: a report of a workgroup of the American Diabetes Association and the Endocrine Society. Diabetes Care 36(5), 1384–1395 (2013).
3.
American Diabetes Association Workgroup on Hypoglycemia. Defining and reporting hypoglycemia in diabetes: a report from the American Diabetes Association Workgroup on Hypoglycemia. Diabetes Care 28(5), 1245–1249 (2005).
4.
Evans M, Khunti K, Mamdani M et al. Health-related quality of life associated with daytime and nocturnal hypoglycaemic events: a time trade-off survey in five countries. Health Qual. Life Outcomes 11, 90 (2013).
•• A health state utility study which has been widely used in the health economic evaluations for diabetes with hypoglycemia.
5.
Ratzki-Leewing A, Harris SB, Mequanint S et al. Real-world crude incidence of hypoglycemia in adults with diabetes: results of the InHypo-DM Study, Canada. BMJ Open Diabetes Res. Care 6(1), e000503 (2018).
• A survey which reported the incidence rates of severe and non-severe hypoglycemic events in Type 1 and Type 2 diabetes in Canada.
6.
Palmer AJ, Roze S, Valentine WJ et al. The CORE Diabetes Model: projecting long-term clinical outcomes, costs and cost–effectiveness of interventions in diabetes mellitus (types 1 and 2) to support clinical and reimbursement decision-making. Curr. Med. Res. Opin. 20(Suppl. 1), S5–S26 (2004).
7.
Hayes AJ, Leal J, Gray AM, Holman RR, Clarke PM. UKPDS outcomes model 2: a new version of a model to simulate lifetime health outcomes of patients with Type 2 diabetes mellitus using data from the 30 year United Kingdom Prospective Diabetes Study: UKPDS 82. Diabetologia 56(9), 1925–1933 (2013).
8.
Morales J, Schneider D. Hypoglycemia. Am. J. Med. 127(Suppl. 10), S17–S24 (2014).
9.
Evans M, Wolden M, Gundgaard J, Chubb B, Christensen T. Cost–effectiveness of insulin degludec compared with insulin glargine in a basal-bolus regimen in patients with Type 1 diabetes mellitus in the UK. J. Med. Econ. 18(1), 56–68 (2015).
10.
Pedersen-Bjergaard U, Kristensen PL, Norgaard K et al. Short-term cost–effectiveness of insulin detemir and insulin aspart in people with Type 1 diabetes who are prone to recurrent severe hypoglycemia. Curr. Med. Res. Opin., 1–7 (2016).
11.
Evans M, Chubb B, Gundgaard J. Cost–effectiveness of insulin degludec versus insulin glargine in adults with Type 1 and Type 2 diabetes mellitus. Diabetes Ther. 8(2), 275–291 (2017).
12.
Sabapathy S, Neslusan C, Yoong K, Teschemaker A, Johansen P, Willis M. Cost–effectiveness of canagliflozin versus sitagliptin when added to metformin and sulfonylurea in Type 2 diabetes in Canada. J. Popul. Ther. Clin. Pharmacol. 23(2), e151–e168 (2016).
13.
Ericsson A, Lundqvist A. Cost–effectiveness of insulin degludec plus liraglutide (IDegLira) in a fixed combination for uncontrolled Type 2 diabetes mellitus in Sweden. Appl. Health Econ. Health Policy 15(2), 237–248 (2017).
14.
Bilir SP, Hellmund R, Wehler E, Li H, Munakata J, Lamotte M. The cost–effectiveness of a flash glucose monitoring system for management of patients with Type 2 diabetes receiving intensive insulin treatment in Sweden. Eur. Endocrinol. 14(2), 80–85 (2018).
15.
Bilir SP, Hellmund R, Wehler B, Li H, Munakata J, Lamotte M. Cost–effectiveness analysis of a flash glucose monitoring system for patients with Type 1 diabetes receiving intensive insulin treatment in Sweden. Eur. Endocrinol. 14(2), 73–79 (2018).
16.
Vigersky RA. The benefits, limitations, and cost–effectiveness of advanced technologies in the management of patients with diabetes mellitus. J. Diabetes Sci. Technol. 9(2), 320–330 (2015).
17.
Healthcare Improvement Scotland. Evidence note 81: What is the clinical and cost–effectiveness of Freestyle Libre® flash glucose monitoring for patients with diabetes mellitus treated with intensive insulin therapy? (2018). www.healthcareimprovementscotland.org/our_work/technologies_and_medicines/topics_assessed/shtg_009-18.aspx
18.
Valentine WJ, Van Brunt K, Boye KS, Pollock RF. Treating Type 1 diabetes mellitus with a rapid-acting analog insulin regimen vs. regular human insulin in Germany: a long-term cost–effectiveness evaluation. Appl. Health Econ. Health Policy 16(3), 357–366 (2018).
19.
Pollock RF, Tikkanen CK. A short-term cost-utility analysis of insulin degludec versus insulin glargine U100 in patients with Type 1 or Type 2 diabetes in Denmark. J. Med. Econ. 20(3), 213–220 (2017).
20.
Pollock RF, Chubb B, Valentine WJ, Heller S. Evaluating the cost–effectiveness of insulin detemir versus neutral protamine Hagedorn insulin in patients with Type 1 or Type 2 diabetes in the UK using a short-term modeling approach. Diabetes Metab. Syndr. Obes. 11, 217–226 (2018).
21.
Lauridsen JT, Lonborg J, Gundgaard J, Jensen HH. Diminishing marginal disutility of hypoglycaemic events: results from a time trade-off survey in five countries. Qual. Life Res. 23(9), 2645–2650 (2014).
• A study which used the log-transformed additive methods to estimate the disutility of daytime and nocturnal hypoglycemic events in diabetes. A number of cost-utility studies used this method to estimate the disutility due to nonsevere hypoglycemic events.
22.
Cariou B, Fontaine P, Eschwege E et al. Frequency and predictors of confirmed hypoglycaemia in Type 1 and insulin-treated Type 2 diabetes mellitus patients in a real-life setting: results from the DIALOG study. Diabetes Metab. 41(2), 116–125 (2015).
23.
Beaudet A, Clegg J, Thuresson PO, Lloyd A, McEwan P. Review of utility values for economic modeling in Type 2 diabetes. Value Health 17(4), 462–470 (2014).
24.
Fidler C, Elmelund Christensen T, Gillard S. Hypoglycemia: an overview of fear of hypoglycemia, quality-of-life, and impact on costs. J. Med. Econ. 14(5), 646–655 (2011).
25.
Martyn-Nemeth P, Schwarz Farabi S, Mihailescu D, Nemeth J, Quinn L. Fear of hypoglycemia in adults with Type 1 diabetes: impact of therapeutic advances and strategies for prevention – a review. J. Diabetes Complications 30(1), 167–177 (2016).
26.
Smith-Palmer J, Bae JP, Boye KS, Norrbacka K, Hunt B, Valentine WJ. Evaluating health-related quality of life in Type 1 diabetes: a systematic literature review of utilities for adults with Type 1 diabetes. Clinicoecon. Outcomes Res. 8, 559–571 (2016).
27.
Thompson AJ, Sutton M, Payne K. Estimating joint health condition utility values. Value Health 22(4), 482–490 (2019).
•• A study which provided the technical details of estimating joint health utilities for up to four health states.
28.
Ara R, Wailoo AJ. Estimating health state utility values for joint health conditions: a conceptual review and critique of the current evidence. Med. Decis. Making 33(2), 139–153 (2013).
• A article which reviewed the current methods of estimating the utilities for joint health conditions.
29.
Hu B, Fu AZ. Predicting utility for joint health states: a general framework and a new nonparametric estimator. Med. Decis. Making 30(5), E29–E39 (2010).
• A study which introduced the adjusted decrement estimator for the estimation of joint health utility.
30.
Scientific Approaches to Transportation Research. Useful transformations. Appendix B. 2 (2001). https://onlinepubs.trb.org/onlinepubs/nchrp/cd-22/manual/v2appendixb.pdf
31.
Clarke PM, Gray AM, Briggs A et al. Cost-utility analyses of intensive blood glucose and tight blood pressure control in Type 2 diabetes (UKPDS 72). Diabetologia 48(5), 868–877 (2005).
32.
Takahara M, Katakami N, Shiraiwa T et al. Evaluation of health utility values for diabetic complications, treatment regimens, glycemic control and other subjective symptoms in diabetic patients using the EQ-5D-5L. Acta Diabetol. 56(3), 309–319 (2019).
33.
Gordon J, Beresford-Hulme L, Bennett H, Tank A, Edmonds C, McEwan P. Relationship between hypoglycaemia, body mass index and quality of life among patients with Type 1 diabetes: observations from the DEPICT clinical trial programme. Diabetes Obes. Metab. 22(5), 857–865 (2020).
34.
Yfantopoulos J, Chantzaras A. Health-related quality of life and health utilities in insulin-treated Type 2 diabetes: the impact of related comorbidities/complications. Eur. J. Health Econ. 21(5), 729–743 (2020).
35.
Zhang Y, Wu J, Chen Y, Shi L. EQ-5D-3L Decrements by diabetes complications and comorbidities in China. Diabetes Ther. 11(4), 939–950 (2020).
36.
Shao H, Yang S, Fonseca V, Stoecker C, Shi L. Estimating quality of life decrements due to diabetes complications in the United States: the Health Utility Index (HUI) diabetes complication equation. Pharmacoeconomics 37(7), 921–929 (2019).
37.
Peasgood T, Brennan A, Mansell P, Elliott J, Basarir H, Kruger J. The Impact of diabetes-related complications on preference-based measures of health-related quality of life in adults with Type I diabetes. Med. Decis. Making 36(8), 1020–1033 (2016).
38.
Solli O, Stavem K, Kristiansen IS. Health-related quality of life in diabetes: the associations of complications with EQ-5D scores. Health Qual. Life Outcomes 8, 18 (2010).
39.
Marrett E, Stargardt T, Mavros P, Alexander CM. Patient-reported outcomes in a survey of patients treated with oral antihyperglycaemic medications: associations with hypoglycaemia and weight gain. Diabetes Obes. Metab. 11(12), 1138–1144 (2009).
40.
Vexiau P, Mavros P, Krishnarajah G, Lyu R, Yin D. Hypoglycaemia in patients with Type 2 diabetes treated with a combination of metformin and sulphonylurea therapy in France. Diabetes Obes. Metab. 10(Suppl. 1), 16–24 (2008).
41.
Currie CJ, Morgan CL, Poole CD, Sharplin P, Lammert M, Mcewan P. Multivariate models of health-related utility and the fear of hypoglycaemia in people with diabetes. Curr. Med. Res. Opin. 22(8), 1523–1534 (2006).
42.
Lundkvist J, Berne C, Bolinder B, Jonsson L. The economic and quality of life impact of hypoglycemia. Eur. J. Health Econ. 6(3), 197–202 (2005).
43.
Davis RE, Morrissey M, Peters JR, Wittrup-Jensen K, Kennedy-Martin T, Currie CJ. Impact of hypoglycaemia on quality of life and productivity in Type 1 and Type 2 diabetes. Curr. Med. Res. Opin. 21(9), 1477–1483 (2005).
44.
Harris S, Mamdani M, Galbo-Jorgensen CB, Bogelund M, Gundgaard J, Groleau D. The effect of hypoglycemia on health-related quality of life: Canadian results from a multinational time trade-off survey. Can. J. Diabetes 38(1), 45–52 (2014).
45.
Levy AR, Christensen TL, Johnson JA. Utility values for symptomatic non-severe hypoglycaemia elicited from persons with and without diabetes in Canada and the United Kingdom. Health Qual. Life Outcomes 6, 73 (2008).
46.
Moher D, Liberati A, Tetzlaff J, Altman DG, Prisma Group. Preferred reporting items for systematic reviews and meta-analyses: the PRISMA statement. PLoS Med. 6(6), e1000097 (2009).
47.
Neuwahl SJ, Zhang P, Chen H et al. Patient health utility equations for a Type 2 diabetes model. Diabetes Care 44(2), 381–389 (2021).
48.
Pratipanawatr T, Satirapoj B, Ongphiphadhanakul B, Suwanwalaikorn S, Nitiyanant W. Impact of hypoglycemia on health-related quality of life among Type 2 diabetes: a cross-sectional study in Thailand. J. Diabetes Res. 2019, 5903820 (2019).
49.
Pagkalos E, Thanopoulou A, Sampanis C et al. The real-life effectiveness and care patterns of Type 2 diabetes management in Greece. Exp. Clin. Endocrinol. Diabetes 126(1), 53–60 (2018).
50.
Pawaskar M, Iglay K, Engel SS, Rajpathak S, Witt EA. Impact of the severity of hypoglycemia on health-related quality of life, productivity, resource use, and costs among US patients with Type 2 diabetes. J. Diabetes Comp. 32(5), 451–457 (2018).
51.
Pawaskar M, Witt EA, Engel SS, Rajpathak SN, Iglay K. Severity of hypoglycaemia and health-related quality of life, work productivity and healthcare costs in patients with Type 2 diabetes in Europe. Endocrinol. Diabetes Metab. 1(2), e00011 (2018).
52.
Cvetanovic G, Stojiljkovic M, Miljkovic M. Estimation of the influence of hypoglycemia and body mass index on health-related quality of life, in patients with Type 2 diabetes mellitus. Vojnosanitetski Pregled. 74(9), 831–839 (2017).
53.
Sheu WHH, Ji L-N, Nitiyanant W et al. Hypoglycemia is associated with increased worry and lower quality of life among patients with Type 2 diabetes treated with oral antihyperglycemic agents in the Asia-Pacific region. Diabetes Res. Clin. Pract. 96(2), 141–148 (2012).
54.
Shafie AA, Ng CH, Thanimalai S, Haron N, Manocha AB. Estimating the utility value of hypoglycaemia according to severity and frequency using the visual analogue scale (VAS) and time trade-off (TTO) survey. J. Diabetes Metab. Disorders 17(2), 269–275 (2018).
55.
Shingler S, Fordham B, Lloyd AJ et al. Utilities for treatment-related adverse events in Type 2 diabetes. J. Med. Econ. 18(1), 45–55 (2015).
Information & Authors
Information
Published In
Pages: 961 - 974
PubMed: 34287017
Copyright
© 2021 Future Medicine Ltd.
History
Received: 11 March 2021
Accepted: 16 June 2021
Published online: 21 July 2021
Keywords:
Topics
Authors
Metrics & Citations
Metrics
Article Usage
Article usage data only available from February 2023. Historical article usage data, showing the number of article downloads, is available upon request.
Citations
How to Cite
Review and estimation of disutility for joint health states of severe and nonsevere hypoglycemic events in diabetes. (2021) Journal of Comparative Effectiveness Research. DOI: 10.2217/cer-2021-0059
Export citation
Select the citation format you wish to export for this article or chapter.
Citing Literature
- Phil McEwan, Marc Evans, The health economics of insulin therapy: How do we address the rising demands, costs, inequalities and barriers to achieving optimal outcomes, Diabetes, Obesity and Metabolism, 10.1111/dom.16488, 27, S5, (24-35), (2025).
- Reduced insulin use and diabetes complications upon introduction of SGLT-2 inhibitors and GLP1-receptor agonists in low- and middle-income countries: A microsimulation, PLOS Medicine, 10.1371/journal.pmed.1004559, 22, 4, (e1004559), (2025).
- Salah Ghabri, Dalia Dawoud, Michael Drummond, Methods for Including Adverse Events in Economic Evaluations: Suggestions for Improvement, Value in Health, 10.1016/j.jval.2024.03.013, 27, 7, (936-942), (2024).
- Xuanqian Xie, Alexis K. Schaink, Chengyu Gao, Olga Gajic-Veljanoski, Wendy J. Ungar, Andrei Volodin, Evaluating the correlations of cost and utility parameters from summary statistics for probabilistic analysis in economic evaluations, Expert Review of Pharmacoeconomics & Outcomes Research, 10.1080/14737167.2023.2221436, 23, 8, (901-909), (2023).
- Mohammed Al-Beltagi, Nermin Kamal Saeed, Adel Salah Bediwy, Reem Elbeltagi, Insulin pumps in children - a systematic review, World Journal of Clinical Pediatrics, 10.5409/wjcp.v11.i6.463, 11, 6, (463-484), (2022).