Patterns and association of vaccination among adults with a history of cancer in the USA: a population-based study
Publication: Journal of Comparative Effectiveness Research
Abstract
Aim: To assess the association of vaccination status among adults with history of cancer in a population-based cohort in the USA. Materials & methods: National Health Interview Survey datasets (2008–2018) have been accessed and information about the patterns and associations of the following vaccinations were collected (influenza vaccination, pneumococcal vaccination, hepatitis B vaccination, hepatitis A vaccination and shingles vaccination). Association of different sociodemographic variables with each of the above types of vaccination was studied through multivariable logistic regression analysis. Results: Private health insurance (vs no private insurance) was associated with higher percentages of recommended vaccination (influenza vaccination: 65 vs 59.7%; pneumococcal vaccination: 74.9 vs 68.8%; hepatitis B vaccination: 22.9 vs 19.3%; hepatitis A vaccination: 10.1 vs 8.6%; shingles vaccination: 33.8 vs 26.7%; p < 0.001 for all comparisons). Within multivariable logistic regression analyses, African American race, lower education and lower income were associated with less probability of adherence to recommended vaccination (for influenza vaccination; odds ratio (OR) for black race vs white race: 0.785; 95% CI: 0.717–0.859; OR for ≤high school vs >high school education: 0.763; 95% CI: 0.723–0.805; OR for income ≤US$45,000 vs >US$45,000: 0.701; 95% CI: 0.643–0.764). Conclusion: There is evidence of socio-economic disparities in adherence to recommended vaccination among this cohort of cancer survivors in the USA. More efforts need to be done to ensure that recommended vaccination is being delivered to all cancer survivors in need (including enhancing coverage and awareness to under-represented groups of the society).
Vaccination has been a recommended preventive strategy among individuals with certain comorbidities (including cancer), but adherence to recommended vaccinations has been a recognized challenge among cancer survivors. The reason being that patients and providers focus on cancer care rather than other noncancer related healthcare services like vaccination [1–3]. Previous studies evaluating the rates of adherence to recommended vaccination have been shaded by inadequate sample size and noncontemporaneous nature of data collection casting a lot of doubt about the validity of the results of these studies [4–7]. In the US context, vaccination guidelines for the general public are issued and updated regularly by the CDC [8]. With few exceptions, these guidelines should generally apply for many individuals with history of cancer as well.
To provide a better idea about the adherence patterns for different adult vaccinations as well as the sociodemographic associations of such adherence in North America, the National Health Interview Survey (NHIS) has been accessed [9]. Using its large sample size, rigorous data collection methodology and comprehensive description of participants, this should provide a unique opportunity to answer the above research question. The results of the current study should provide clearer guidance to patients, healthcare providers as well as health policymakers about how to improve adherence to recommended vaccination among cancer patients.
Objective
To assess the sociodemographic associations of vaccination status among adults with history of cancer in a population-based cohort in the USA.
Materials & methods
Data sources
The current study is based on a pooled analysis of data from annual NHIS datasets (2008–2018), which is a national healthcare data collection project of the National Center for Health Statistics (which is part of the CDC). It is by far, one of the main health information sources for the USA noninstitutionalized population. As the current study is centered around the patterns of vaccination in the last decade, the focus was on NHIS datasets from 2008–2018. As data were publicly available from the CDC website, they were accessed and downloaded and then pooled together.
Cohorts’ definitions
The current study encompassed five separate cohorts (with each cohort representing an eligible population for one of the five studied vaccinations):
•
Influenza vaccination cohort which included adult participants (≥18 years) with a history of cancer and information about influenza vaccination in the past 12 months (reported in the NHIS datasets as the flu shot). This was identified within NHIS questionnaire with the following question: during the past 12 months, have you had a flu vaccination?
•
Pneumococcal vaccination cohort which included elderly participants (≥65 years) with a history of cancer and information about pneumococcal vaccination. Type of pneumococcal vaccination (conjugate vs polysaccharide vaccine) cannot be determined from the NHIS datasets. This was identified within NHIS questionnaire with the following question: have you ever had a pneumonia shot?
•
Hepatitis B vaccination cohort which included adult participants (≥18 years) with a history of cancer and information about hepatitis B vaccination. This was identified within NHIS questionnaire with the following question: have you ever received the hepatitis B vaccine?
•
Hepatitis A vaccination cohort which included adult participants (≥18 years) with a history of cancer and complete information about hepatitis A vaccination. This was identified within NHIS questionnaire with the following question: have you ever received the hepatitis A vaccine?
•
Herpes zoster (shingles) vaccination cohort included adult participants (≥60 years) with a history of cancer and information about shingles vaccination. It has to be noted that for the majority of NHIS datasets, the type of shingles vaccination cannot be determined (live attenuated vs recombinant). The age limit of 60 years was chosen because CDC guidance recommends live vaccine for adults 60 years and older and recombinant vaccine for adults 50 years and older. This was identified within NHIS questionnaire with the following question: have you had a vaccine for shingles?
Age limitations for pneumococcal and shingles vaccinations were chosen following the CDC age recommendations for both vaccines [10]. It has to be noted that NHIS datasets do not provide information about time between cancer diagnosis and survey completion. Thus, the term ‘adults with cancer’ was used throughout this manuscript because it was not possible to discriminate cancer survivors from cancer patients on active treatment within the NHIS datasets.
Data collection
For each participant, the following data were collected where available: age at survey completion, gender, race, marital status, working status, insurance status, yearly earnings (in US dollars), English language proficiency, self-reported health status, year of survey completion and primary tumor site. It has to be noted that yearly earnings were reported in the NHIS datasets as a categorical rather than a continuous variable. Cancer staging and any possible treatments were not reported within NHIS datasets.
Statistical analysis
Descriptive statistical analysis was initially used to describe the frequencies and associations within each study subcohort. Temporal patterns in participants’ recall of vaccination were evaluated through descriptive statistics as well. Multivariable logistic regression analyses were then used to evaluate factors associated with vaccination uptake within each of the study cohorts. Within each analysis, the following factors were included in the model: age, gender, race, marital status, working status, insurance status, yearly earnings and self-reported health status. All factors in the model were entered in a single step. These variables were selected because of their potential relevance on healthcare decision making in the US (including vaccination). It has to be noted that vaccination information was based on participants’ recall without validation from vaccination records. All statistical analyses were conducted through SPSS v. 25 (IBM, NY, USA).
Results
Temporal patterns in participants’ recall of vaccination
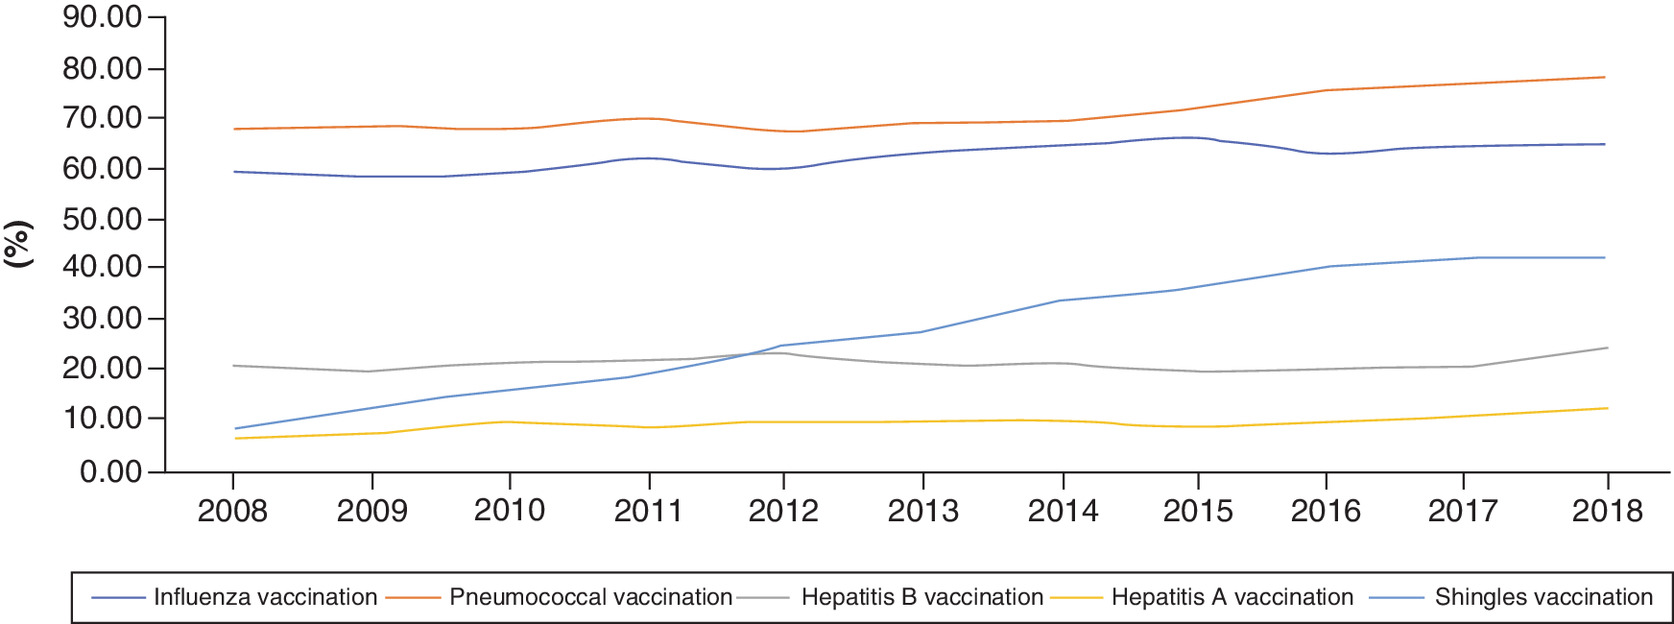
Yearly patient recall percentages of different types of vaccination were evaluated throughout the study duration (2008–2018; Figure 1), and they were increasing for all the studied vaccinations. For influenza vaccination, percentage of participants in 2008 was 59.6 versus 65.2% in 2018 (p < 0.001); for pneumococcal vaccination, percentage of participants in 2008 was 67.9 versus 78.2% in 2018 (p < 0.001); for hepatitis B vaccination, percentage of participants in 2008 was 21.2 versus 24.8% in 2018 (p < 0.001); for hepatitis A vaccination, percentage of participants in 2008 was 6.5 versus 12.5% in 2018 (p < 0.001); and for shingles vaccination, percentage of participants in 2008 was 8.6 versus 42% in 2018 (p < 0.001). Distribution of different baseline characteristics of included participants within all five cohorts was detailed in Table 1.
| Parameters | Influenza vaccination cohort (30,484 participants) | Pneumococcal vaccination cohort (16,086 participants) | Hepatitis B vaccination cohort (29,621 participants) | Hepatitis A vaccination cohort (29,312 participants) | Shingles vaccination cohort (20,095 participants) |
|---|---|---|---|---|---|
| Age (mean; SD) | 64.37; 13.92 | 74.36; 6.14 | 64.37; 13.87 | 64.51; 13.76 | 71.97; 7.38 |
| Sex – Male – Female | 12,330 (40.4%) 18,154 (59.6%) | 7236 (45%) 8850 (55%) | 11,883 (40.1%) 17,738 (59.9%) | 11,782 (40.2%) 17,530 (59.8%) | 8922 (44.4%) 11173 (55.6%) |
| Race – White – African American – Asian – American Indian – Others | 26,614 (87.3%) 2488 (8.2%) 677 (2.2%) 172 (0.6%) 533 (1.7%) | 14,213 (88.4%) 1241 (7.7%) 345 (2.1%) 62 (0.4%) 225 (1.4%) | 25,854 (87.3%) 2452 (8.3%) 634 (2.1%) 172 (0.6%) 509 (1.7%) | 25,605 (87.4%) 2421 (8.3%) 621 (2.1%) 168 (0.6%) 497 (1.7%) | 17,693 (88%) 1607 (8%) 418 (2.1%) 87 (0.4%) 290 (1.4%) |
| Work status – Working – Not working – Unknown | 10,082 (33.1%) 20,391 (66.9%) 11 (<0.01%) | 2378 (14.8%) 13,705 (85.2%) 3 (<0.01%) | 9806 (33.1%) 19,805 (66.9%) 10 (<0.01%) | 9619 (32.8%) 19,685 (67.2%) 8 (<0.01%) | 4177 (20.8%) 15,914 (79.2%) 4 (<0.01%) |
| Yearly income – <US$45,000 – >US$45,000 – Unknown | 5931 (19.5%) 4073 (13.4%) 20,480 (67.2%) | 1777 (11%) 705 (4.4%) 13,605 (84.6%) | 5816 (19.6%) 3935 (13.3%) 19,870 (67.1%) | 5693 (19.4%) 3878 (13.2%) 19741 (67.3%) | 2770 (13.8%) 1568 (7.8%) 15,757 (78.4%) |
| Insurance† – Private – Medicaid – Medicare | 18,228 (59.8%) 3010 (9.9%) 18,526 (60.8%) | 8882 (55.2%) 1126 (7%) 15,572 (96.8%) | 17,755 (59.9%) 2897 (9.8%) 18,016 (60.8%) | 17,853 (50%) 2859 (9.8%) 17,903 (61.6%) | 11,611 (57.8%) 1541 (7.7%) 16,367 (81.4%) |
| Health status – Excellent – Very good – Good – Fair – Poor – Unknown | 42,335 (13.9%) 8422 (27.6%) 9846 (32.3%) 5655 (18.6%) 2301 (7.5%) 25 (0.1%) | 2014 (12.5%) 4541 (28.2%) 5514 (34.3%) 2943 (18.3%) 1058 (6.6%) 16 (0.1%) | 4146 (14%) 8196 (27.7%) 9569 (32.3%) 5482 (18.5%) 2207 (7.5%) 21 (0.1%) | 4070 (13.9%) 8120 (27.7%) 9512 (32.5%) 5407 (18.4%) 2181 (7.4%) 22 (0.1%) | 2558 (12.7%) 5658 (28.2%) 6738 (33.5%) 3713 (18.5%) 1409 (7%) 19 (0.1%) |
| Education – ≤High school – >High school – Unknown | 12,160 (39.9%) 18,213 (59.7%) 111 (0.4%) | 7002 (43.5%) 9025 (56.1%) 59 (0.4%) | 11,852 (40%) 17,669 (59.7%) 100 (0.3%) | 11,789 (40.2%) 17,429 (59.5%) 95 (0.3%) | 8316 (41.4%) 11,715 (58.3%) 64 (0.3%) |
| English proficiency – Very well – Well – Not well – Not at all – Unknown | 17,879 (58.7%) 816 (2.7%) 311 (1%) 176 (0.6%) 11,302 (37.1%) | 9945 (61.8%) 473 (2.9%) 169 (1.1%) 106 (0.7%) 5393 (33.5%) | 16,819 (56.8%) 750 (2.5%) 285 (1%) 160 (0.5%) 11,607 (39.2%) | 16,625 (56.7%) 739 (2.5%) 277 (0.9%) 154 (0.5%) 11,517 (39.3%) | 12,227 (60.8%) 592 (2.9%) 206 (1.1%) 117 (0.6%) 6953 (34.6%) |
| Marital status – Unmarried – Married – Unknown | 16,207 (53.2%) 14,232 (46.7%) 45 (0.1%) | 8585 (53.4%) 7477 (46.5%) 24 (0.1%) | 15,734 (53.1%) 13,844 (46.7%) 43 (0.1%) | 15,566 (53.1%) 13,704 (46.8%) 42 (0.1%) | 10,461 (52%) 9603 (47.8%) 31 (0.2%) |
†
Some patients might have more than one insurance support.
SD: Standard deviation.
Patients’ recall of vaccination according to private insurance coverage
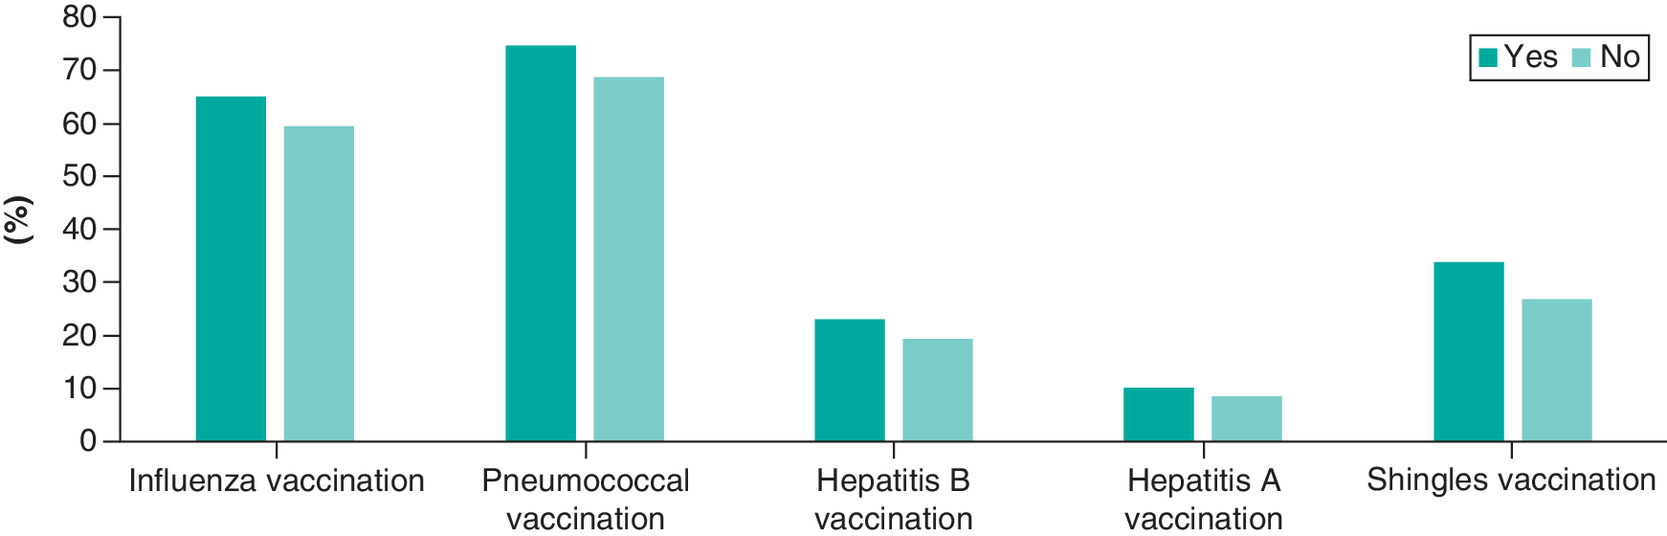
When patients’ recall of vaccination was stratified according to the availability of private insurance coverage, participants with private insurance coverage seem to have higher percentages of vaccination among all study cohorts; influenza vaccination: 65 versus 59.7%; pneumococcal vaccination: 74.9 versus 68.8%; hepatitis B vaccination: 22.9 versus 19.3%; hepatitis A vaccination: 10.1 versus 8.6%; shingles vaccination: 33.8 versus 26.7%; p < 0.001 for all comparisons (Figure 2).
Patients’ recall of vaccination according to cancer diagnosis
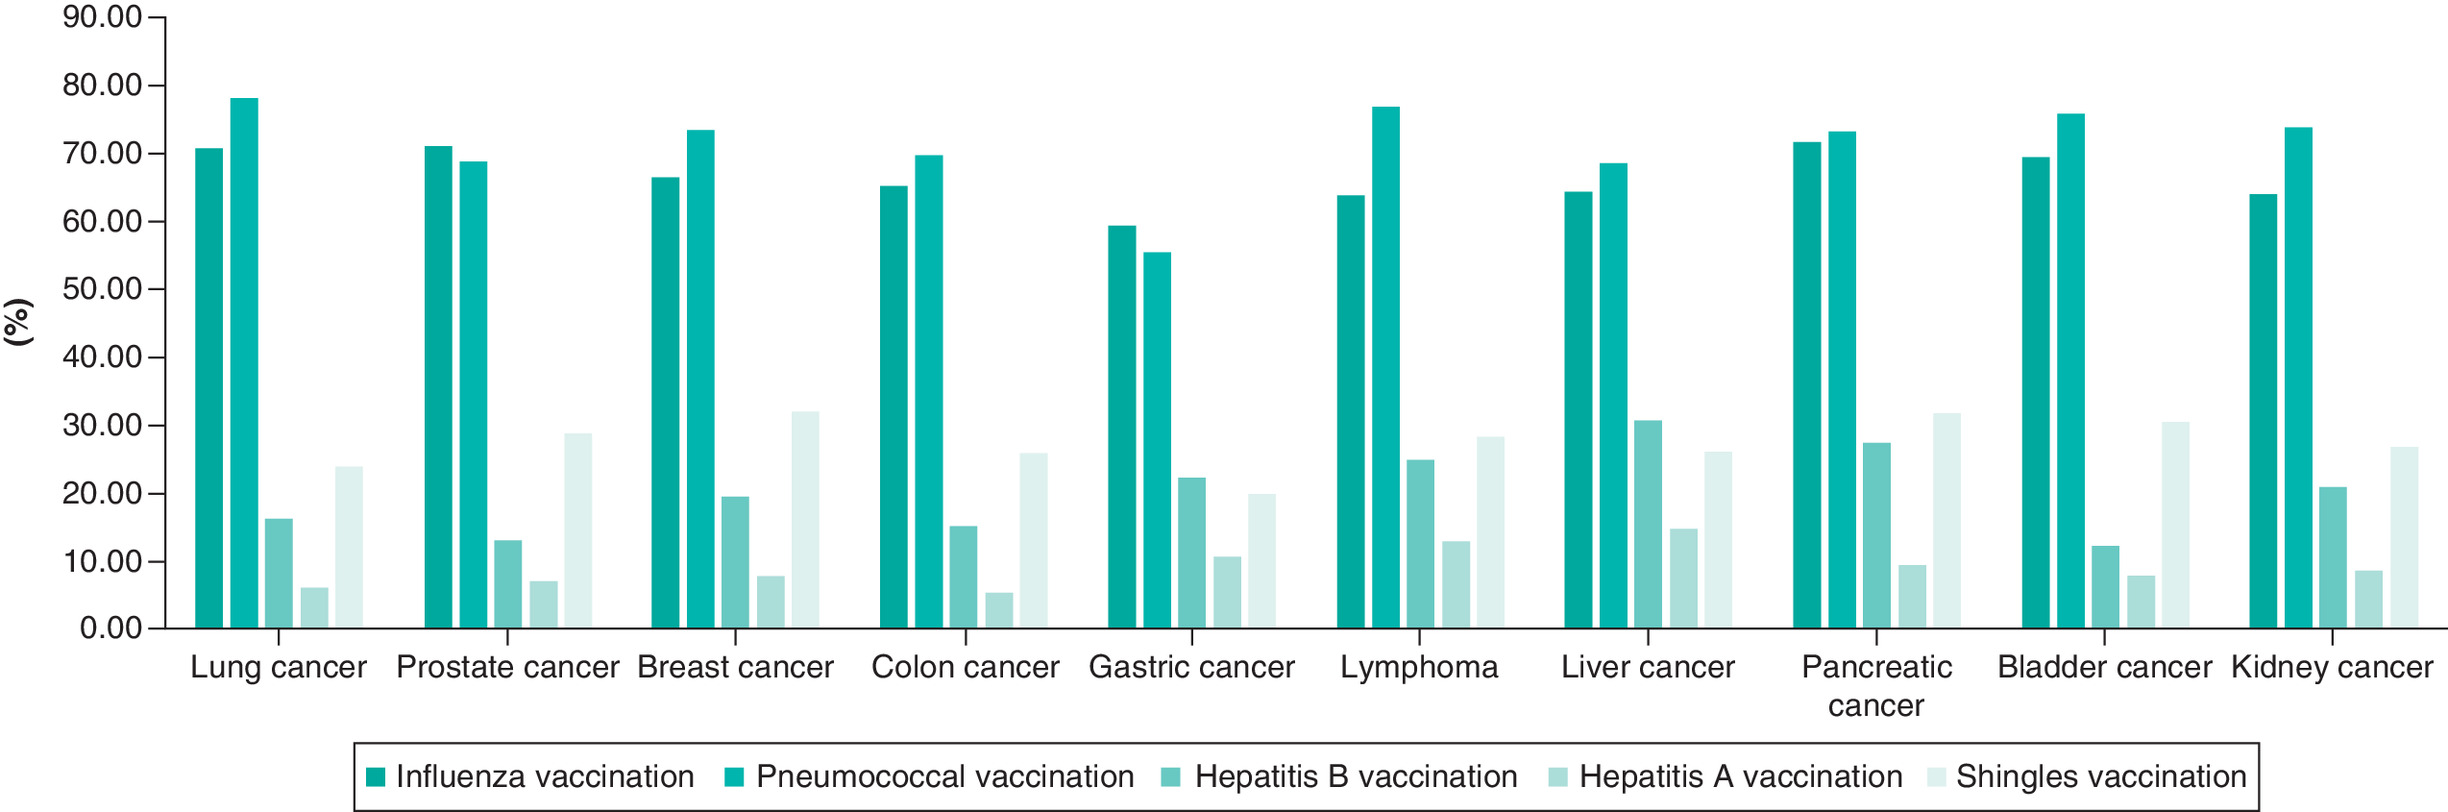
Percentages of patients’ recall of different types of vaccination were summarized in Figure 3 for the following primary tumor sites (lung cancer, prostate cancer, breast cancer, colon cancer, bladder cancer, kidney cancer, gastric cancer, liver cancer, pancreatic cancer and lymphoma). These cancers were chosen as they represent the most common cancers in the USA during the study period [11].
Influenza vaccination cohort
A total of 30,484 participants were included in the influenza vaccination cohort; including 19,163 participants (62.9%) who received influenza vaccination and 11,321 participants (37.1%) who did not receive influenza vaccination.
The following factors were associated with a higher likelihood of influenza vaccination: older age (odds ratio [OR]: 1.045; 95% CI: 1.042–1.047), female gender (OR: 1.094; 95% CI: 1.038–1.153), white race (OR for black race vs white race: 0.785; 95% CI: 0.717–0.859), not working (OR: 1.217; 95% CI: 1.125–1.317), higher income (OR for income ≤45,000 vs >45,000: 0.701; 95% CI: 0.643–0.764), poorer health status (OR for fair health status vs excellent health status: 1.249; 95% CI: 1.140–1.369), higher education (OR for ≤high school vs >high school education: 0.763; 95% CI: 0.723–0.805) and married status (OR for unmarried vs married status: 0.795; 95% CI: 0.755–0.837; Table 2).
| Parameters | Influenza vaccination cohort; OR (95% CI) | Pneumococcal vaccination cohort; OR (95% CI) | Hepatitis B vaccination cohort; OR (95% CI) | Hepatitis A vaccination cohort; OR (95% CI) | Shingles vaccination cohort; OR (95% CI) |
|---|---|---|---|---|---|
| Age (continuous) | 1.045 (1.042‑1.047) | 1.049 (1.042‑1.055) | 0.957 (0.955‑0.960) | 0.965 (0.962‑0.968) | 1.028 (1.023‑1.033) |
| Sex – Male – Female | Reference 1.094 (1.038‑1.153) | Reference 1.260 (1.170‑1.357) | Reference 1.306 (1.225‑1.392) | Reference 0.874 (0.803‑0.952) | Reference 1.288 (1.206‑1.374) |
| Race – White – African American – Asian – American Indian – Others | Reference 0.785 (0.717‑0.859) 0.992 (0.837‑1.176) 1.169 (0.843‑1.622) 0.827 (0.687‑0.994) | Reference 0.542 (0.479‑0.613) 0.447 (0.359‑0.558) 0.726 (0.425‑1.241) 0.852 (0.636‑1.141) | Reference 1.040 (0.931‑1.162) 1.083 (0.887‑1.322) 1.409 (0.995‑1.996) 1.283 (1.040‑1.582) | Reference 1.014 (0.867‑1.186) 1.583 (1.246‑2.010) 1.104 (0.673‑1.812) 1.532 (1.179‑1.991) | Reference 0.430 (0.371‑0.499) 0.855 (0.687‑1.063) 0.756 (0.453‑1.261) 0.726 (0.547‑0.962) |
| Employment status – Working – Not working | Reference 1.217 (1.125‑1.317) | Reference 1.280 (1.125‑1.456) | Reference 1.026 (0.939‑1.122) | Reference 1.133 (1.004‑1.279) | Reference 1.218 (1.092‑1.358) |
| Yearly income – >US$45,000 – <US$45,000 | Reference 0.701 (0.643‑0.764) | Reference 1.257 (1.046‑1.511) | Reference 0.867 (0.791‑0.951) | Reference 0.727 (0.645‑0.821) | Reference 0.912 (0.794‑1.048) |
| Health status‡ – Excellent – Very good – Good – Fair – Poor | Reference 1.166 (1.075‑1.264) 1.241 (1.145‑1.345) 1.249 (1.140‑1.369) 1.088 (0.968‑1.221) | Reference 1.237 (1.100‑1.390) 1.336 (1.191‑1.499) 1.341 (1.177‑1.528) 1.293 (1.090‑1.535) | Reference 0.973 (0.887‑1.068) 0.961 (0.875‑1.055) 1.041 (0.934‑1.159) 0.963 (0.834‑1.111) | Reference 0.880 (0.782‑0.990) 0.769 (0.681‑0.868) 0.748 (0.646‑0.866) 0.806 (0.663‑0.979) | Reference 0.870 (0.789‑0.959) 0.703 (0.638‑0.775) 0.495 (0.441‑0.556) 0.436 (0.371‑0.512) |
| Education – >High school – ≤High school | Reference 0.763 (0.723‑0.805) | Reference 0.729 (0.677‑0.785) | Reference 0.483 (0.451‑0.518) | Reference 0.430 (0.389‑0.476) | Reference 0.570 (0.534‑0.610) |
| Marital status – Married – Unmarried | Reference 0.795 (0.755‑0.837) | Reference 0.794 (0.737‑0.856) | Reference 0.990 (0.931‑1.052) | Reference 0.938 (0.863‑1.020) | Reference 0.753 (0.706‑0.804) |
†
Patients with unknown variables were included in different analyses but not reported in this table.
‡
Self-reported.
OR: Odds ratio.
Pneumococcal vaccination cohort
A total of 16,086 participants were included in the pneumococcal vaccination cohort; including 11,615 participants (72.2%) who received pneumococcal vaccination and 4471 participants (27.8%) who did not receive pneumococcal vaccination.
The following factors were found to be associated with higher probability of pneumococcal vaccination: older age (OR: 1.049; 95% CI: 1.042–1.055), female gender (OR: 1.260; 95% CI: 1.170–1.357), white race (OR for black race vs white race: 0.542; 95% CI: 0.479–0.613), not working (OR: 1.280; 95% CI: 1.125–1.456), lower income (OR: 1.257; 95% CI: 1.046–1.511), poorer health status (OR for fair health status vs excellent health status: 1.341; 95% CI: 1.177–1.528), higher education (OR for ≤high school vs >high school education: 0.729; 95% CI: 0.677–0.785) and married status (OR for unmarried vs married status: 0.794; 95% CI: 0.737–0.856; Table 2).
Hepatitis B vaccination cohort
A total of 29,621 participants were included in the hepatitis B vaccination cohort; including 6363 participants (21.5%) who received hepatitis B vaccination and 23,258 participants (78.5%) who did not receive hepatitis B vaccination.
The following factors were found to be associated with higher probability of hepatitis B vaccination: younger age (OR: 0.957; 95% CI: 0.955–0.960), female gender (OR: 1.306; 95% CI: 1.225–1.392), higher income (OR for income ≤45,000 vs >45,000: 0.867; 95% CI: 0.791–0.951) and higher education (OR for ≤high school vs >high school education: 0.483 [0.451–0.518; Table 2).
Hepatitis A vaccination cohort
A total of 29,312 participants were included in the hepatitis A vaccination cohort; including 2787 participants (9.5%) who received hepatitis A vaccination and 26,525 participants (90.5%) who did not receive hepatitis A vaccination.
The following factors were found to be associated with higher probability of hepatitis A vaccination: younger age (OR: 0.965; 95% CI: 0.962–0.968), male gender (OR for female vs male survivors: 0.874; 95% CI: 0.803–0.952), not working (OR: 1.133; 95 % CI: 1.004–1.279), higher income (OR for income ≤45,000 vs >45,000: 0.727; 95% CI: 0.645–0.821), better health status (OR for fair health status vs excellent health status: 0.748; 95% CI: 0.646–0.866) and higher education (OR for ≤high school vs >high school education: 0.430; 95% CI: 0.389–0.476; Table 2).
Shingles vaccination cohort
A total of 20,095 participants were included in the shingles vaccination cohort; including 6192 participants (30.8%) who received shingles vaccination and 13,903 participants (69.2%) who did not receive shingles vaccination.
The following factors were associated with a higher likelihood of shingles vaccination: older age (OR: 1.028; 95% CI: 1.023–1.033), female gender (OR: 1.288; 95% CI: 1.206–1.374), white race (OR for black race vs white race: 0.430; 95% CI: 0.371–0.499), not working (OR: 1.218; 95% CI: 1.092–1.358), better health status (OR for fair health status vs excellent health status: 0.495 [0.441–0.556]), higher education (OR for ≤high school vs >high school education: 0.570 [0.534–0.610]) and married status (OR for unmarried vs married status: 0.753 [0.706–0.804]; Table 2).
Discussion
The current study evaluates the patterns and associations of vaccination among a cohort of adults with history of cancer in the USA in the last decade. There is generally an increase in the percentages of the five studied vaccinations, most notably in shingles vaccination. There is also a suggestion of a socio-economic disparity in the adherence to recommended vaccination with less adherence among African American individuals and those with lower income and lower levels of education in a plurality of the studied vaccination.
The association of lower socio-economic status with lower percentages of recommended vaccination adds to a number of studies that highlight the crucial role played by socio-economic status in cancer outcomes [12–14]. These studies have suggested that individuals with cancer and lower socio-economic status in the USA were more likely to have worse cancer-specific outcomes as well as noncancer specific outcomes compared with individuals with cancer and higher socio-economic status. It is notable also that – in the current study – individuals who described themselves as not working were more likely to have received all the recommended vaccinations. A possible explanation is that those nonworking individuals were older and/or have poorer self-reported health status (and both characteristics have been linked to higher adherence to screening). It is also possible that older, nonworking individuals have access to Medicare which would facilitate their access to recommended vaccination [15]. The socio-economic disparities observed in the current study is similar to the disparities in vaccination coverage observed within the general US population [16]. Similar disparities in influenza vaccination were observed as well in a recent study of Canadian adults with cancer (in spite of the fact that influenza vaccination is provided as part of universal healthcare coverage in Canada) [17]. This indicates that addressing these disparities goes beyond simple expansion of access, but this needs more coordinated efforts.
The increase in the percentages of vaccination throughout the study period might be related to increased patients’ awareness, increased availability of vaccines and/or increased accessibility to vaccination (through the implementation of affordable care act). Previous population-based studies have suggested improved cancer treatment access with the implementation of the affordable care act [18,19]; thus, access to vaccination may have been improved in the same way. On the other hand, it has to be remembered that accessibility to vaccination is not dependent fully on health insurance status; vaccinations are widely available in nonoffice settings including local and state health departments. The increase in the rate of shingles vaccination is particularly notable, although no clear explanation is available for this.
The current study has several strengths and weaknesses that need to be acknowledged. The strengths included the large sample size, contemporaneous nature of data collection and known quality of data collection within the NHIS datasets. On the other hand, the weaknesses included the retrospective nature of data collection, absence of detailed oncological information of included participants (e.g., how many participants were on treatment, type of treatment and stage of cancer), not using multiple testing corrections, and also the absence of vaccination-related outcomes (including possible side effects attributed to vaccination and rates of respective infections among participants who had or had not each vaccine). NHIS datasets do not distinguish between patients with active malignancy versus those in survivorship phase. As patients receiving treatments for an active malignancy may not be eligible for certain immunizations, this might be a possible source of bias as well. Moreover, NHIS provides information as to what patients recall about immunization rather than objective correlation with prior immunization records. Influenza vaccine recall, which is a recurring annual vaccine, would be more acceptable than recall of once-in-a-lifetime vaccine series, such as hepatitis A or B series and this might raise the concerns for a possible attrition bias in this analysis. Additionally, eligibility in this study is based principally on age criteria. Real-world eligibility criteria are more complex and might incorporate other patient-specific variables which might not be available to query within the NHIS; thus, this is another source of possible bias. It has to be noted also that the results of the current analysis are limited to the US context; thus, caution needs to be exercised before extrapolating these results to other healthcare systems like Canada or Europe. Generalizability of the results of this specific sample for the US population is not warranted as well. The above weaknesses also highlight the fact that the current study can provide information about association rather than causation with regards to different baseline demographic factors and adherence to different types of vaccination.
While the administration of four vaccines studied in the current analysis (influenza, pneumococcal vaccination, hepatitis B and hepatitis A) has been deemed safe for cancer patients, the administration of shingles vaccination among cancer patients has been questioned based on safety concerns [20]. This is because the standard shingles vaccination used to be provided as a live attenuated vaccine which has not been recommended for cancer patients on active anticancer treatment (chemotherapy or radiation therapy) and/or those with hematological malignancies. The recent approval in 2017 of a recombinant zoster vaccine has made it safer to administer this vaccine among many cancer patients. Given the period of the current study (2008–2018), the shingles vaccine in the current analysis mostly refers to the live attenuated form of the vaccine.
Healthcare providers involved in the care of individuals with cancer (whether at the stage of active cancer treatment or afterward) have a responsibility to remind their patients of the importance of following public health guidance with regards to vaccination (particularly given the history of cancer). Vaccination should be part of the standard survivorship follow-up checklist and survivors should be counseled about this.
Conclusion
In conclusion, despite the overall increase in adherence to vaccination among adults with a history of cancer in the USA, there is a suggestion of socio-economic disparities in vaccination patterns in the current cohort. More efforts need to be done to ensure that recommended vaccination is being delivered to all cancer survivors in need (including enhancing coverage and awareness to under-represented groups of the society).
•
National Health Interview Survey datasets (2008–2018) have been accessed and information about the patterns and associations of the following vaccinations were collected (influenza vaccination, pneumococcal vaccination, hepatitis B vaccination, hepatitis A vaccination and shingles vaccination).
•
Association of different sociodemographic variables with each of the above types of vaccination was studied through multivariable logistic regression analysis.
•
Private health insurance (vs no private insurance) was associated with higher percentages of recommended vaccination (influenza vaccination: 65 vs 59.7%; pneumococcal vaccination: 74.9 vs 68.8%; hepatitis B vaccination: 22.9 vs 19.3%; hepatitis A vaccination: 10.1 vs 8.6%; shingles vaccination: 33.8 vs 26.7%; p < 0.001 for all comparisons).
•
Within multivariable logistic regression analyses, African American race, lower education and lower income were associated with less probability of adherence to recommended vaccination (for influenza vaccination; odds ratio [OR] for black race vs white race: 0.785; 95% CI: 0.717–0.859; OR for ≤high school vs >high school education: 0.763; 95% CI: 0.723–0.805; OR for income ≤US$45,000 vs >US$45,000: 0.701; 95% CI: 0.643–0.764).
•
There is evidence of socio-economic disparities in adherence to recommended vaccination among cancer survivors in the USA.
•
More efforts need to be done to ensure that recommended vaccination is being delivered to all cancer survivors in need (including enhancing coverage and awareness to under-represented groups of the society).
Acknowledgments
This study is based on the NHIS datasets (2008–2018).
Financial & competing interests disclosure
The author has no relevant affiliations or financial involvement with any organization or entity with a financial interest in or financial conflict with the subject matter or materials discussed in the manuscript. This includes employment, consultancies, honoraria, stock ownership or options, expert testimony, grants or patents received or pending, or royalties.
No writing assistance was utilized in the production of this manuscript.
References
Papers of special note have been highlighted as: • of interest
1.
Shah MK, Kamboj M. Immunizing cancer patients: which patients? Which vaccines? When to give? Oncology (Williston Park) 32(5), 254–258 c253 (2018).
2.
General recommendations on immunization – recommendations of the Advisory Committee on Immunization Practices (ACIP). MMWR Recomm. Rep. 60(2), 1–64 (2011). [CDC report].
3.
Bitterman R, Eliakim-Raz N, Vinograd I, Zalmanovici Trestioreanu A, Leibovici L, Paul M. Influenza vaccines in immunosuppressed adults with cancer. Cochrane Database Syst. Rev. 2, Cd008983 (2018).
4.
Toleman MS, Herbert K, Mccarthy N, Church DN. Vaccination of chemotherapy patients – effect of guideline implementation. Support. Care Cancer 24(5), 2317–2321 (2016).
5.
Vollaard A, Schreuder I, Slok-Raijmakers L, Opstelten W, Rimmelzwaan G, Gelderblom H. Influenza vaccination in adult patients with solid tumours treated with chemotherapy. Eur. J. Cancer 76, 134–143 (2017).
6.
Loulergue P, Mir O, Alexandre J, Ropert S, Goldwasser F, Launay O. Low influenza vaccination rate among patients receiving chemotherapy for cancer. Ann. Oncol. 19(9), 1658–1658 (2008).
7.
Pollyea DA, Brown JM, Horning SJ. Utility of influenza vaccination for oncology patients. J. Clin. Oncol. 28(14), 2481–2490 (2010).
8.
Centers for Disease Control & Prevention. Vaccines by disease (2021). www.cdc.gov/vaccines/vpd/vaccines-diseases.html
9.
Centers for Disease Control & Prevention. National Health Interview Survey (2021). www.cdc.gov/nchs/nhis/index.htm
10.
Centers for Disease Control & Prevention. Vaccines by disease (2021). www.cdc.gov/vaccines/vpd/vaccines-diseases.html
11.
Siegel RL, Miller KD, Jemal A. Cancer statistics, 2019. CA Cancer J. Clin. 69(1), 7–34 (2019).
12.
Abdel-Rahman O. Socioeconomic predictors of suicide risk among cancer patients in the United States: a population-based study. Cancer Epidemiol. 63, 101601 (2019).
• The impact of socio-economic variables on the risk of suicide was assessed.
13.
Abdel-Rahman O. Outcomes of nonmetastatic colon cancer patients in relationship to socioeconomic status: an analysis of SEER census tract-level socioeconomic database. Int. J. Clin. Oncol. 24(12), 1582–1587 (2019).
14.
Abdel-Rahman O. Impact of NCI socioeconomic index on the outcomes of nonmetastatic breast cancer patients: analysis of SEER census tract-level socioeconomic database. Clin. Breast Cancer 19(6), e717–e722 (2019).
15.
Liao CY, Mott DA, Ford JH II, Look KA, Hayney MS. Influenza vaccination rates and location for receiving the influenza vaccination among older adult medicare beneficiaries. J. Am. Pharm. Assoc. (2003) (2021) (Epub ahead of print).
16.
Williams WW, Lu PJ, O'Halloran A et al. Surveillance of vaccination coverage among adult populations – United States, 2015. MMWR Surveill. Summ. 66(11), 1–28 (2017).
17.
Racial background and health behaviors among adults with cancer in Canada; results from a National Survey. J. Natl Cancer Comp. Network (In Press).
18.
Loehrer AP, Chang GJ. Implications of the Affordable Care Act on surgery and cancer care. Surg. Oncol. Clin. N. Am. 27(4), 603–614 (2018).
19.
Lu Y, Jackson BE, Gehr AW et al. Affordable Care Act and cancer stage at diagnosis in an underserved population. Prev. Med. 126, 105748 (2019).
20.
Ward EM, Flowers CR, Gansler T, Omer SB, Bednarczyk RA. The importance of immunization in cancer prevention, treatment, and survivorship. CA Cancer J. Clin. 67(5), 398–410 (2017).
Information & Authors
Information
Published In
Pages: 899 - 907
PubMed: 34114478
Copyright
© 2021 Future Medicine Ltd.
History
Received: 10 November 2020
Accepted: 10 May 2021
Published online: 11 June 2021
Keywords:
Topics
Authors
Metrics & Citations
Metrics
Article Usage
Article usage data only available from February 2023. Historical article usage data, showing the number of article downloads, is available upon request.
Citations
How to Cite
Patterns and association of vaccination among adults with a history of cancer in the USA: a population-based study. (2021) Journal of Comparative Effectiveness Research. DOI: 10.2217/cer-2020-0251
Export citation
Select the citation format you wish to export for this article or chapter.
Citing Literature
- Alberto Giuseppe Agostara, Silvia Della Torre, Sara Di Bella, Michela Pelliccione, Paola Candido, Valeria Smiroldo, Davide Toniolo, Francesca Zannier, Roberto Bollina, Enhancing Herpes Zoster Vaccination Rates Among Oncology Outpatients: Impact of an In-House Vaccination Initiative, Cancers, 10.3390/cancers17213502, 17, 21, (3502), (2025).
- Kavita Renduchintala, Mariana Arevalo, Gabriella Fonseca, Mary Katherine Haver, Clement K. Gwede, Smitha Pabbathi, Shannon M. Christy, Vaccination uptake among post-treatment cancer survivors: A multi-vaccine scoping review, Vaccine, 10.1016/j.vaccine.2024.05.043, 42, 22, (125995), (2024).