A systematic review of noninferiority margins in oncology clinical trials
Publication: Journal of Comparative Effectiveness Research
Abstract
Aim: A systematic literature review was conducted to identify and characterize noninferiority margins for relevant end points in oncology clinical trials. Materials & methods: Randomized, controlled, noninferiority trials of patients with cancer were identified in PubMed and Embase. Results: Of 2284 publications identified, 285 oncology noninferiority clinical trials were analyzed. The median noninferiority margin was a hazard ratio of 1.29 (mean: 1.32; range: 1.05–2.05) for studies that reported time-to-event end points (n = 192). The median noninferiority margin was 13.0% (mean: 12.7%; range: 5.0–20.0%) for studies that reported response end points as absolute rate differences (n = 31). Conclusion: Although there was consistency in the noninferiority margins’ scale, variability was evident in noninferiority margins across trials. Increased transparency may improve consistency in noninferiority margin application in oncology clinical trials.
Noninferiority clinical trials are designed to evaluate whether the efficacy of an experimental intervention is not unacceptably worse than that of a standard of care treatment; these types of studies are useful when a new agent is anticipated to have similar efficacy versus a comparator but improved tolerability, a more convenient dosing/administration schedule and/or reduced costs [1,2]. Regulatory agencies, including the US FDA [3] and the EMA [4], have issued guidelines for study design and statistical considerations in noninferiority clinical trials. These studies typically require a large sample size, and consequently, substantial time and resources.
The noninferiority hypothesis is tested by ruling out a prespecified noninferiority margin, defined as the minimum threshold beyond which the experimental intervention is unacceptably worse than the active comparator [1]. When the whole confidence interval (CI) for the primary end point falls within the margin of noninferiority, the null hypothesis is rejected, and the study is considered positive, in other words, noninferiority cannot be disproven. Conversely, when the value of the low boundary of the CI of the primary end point result falls outside of this range, inferiority cannot be disproven. Hence, the selection of this margin is crucial for both the sample size calculation and later interpretation of results [5].
Despite strict methodological and statistical principles governing noninferiority studies, guidance on how to define specific noninferiority margins for different end points is limited. Regulatory agencies recommend that noninferiority margins be based on statistical considerations and clinical judgment, including historical evidence from previous clinical trials [3,4]. In theory, the size of the prespecified noninferiority margin is dependent on several factors, including disease, severity of toxicity and invasiveness relative to the degree of benefit from the control [6]. Several systematic literature reviews have been conducted to assess noninferiority margins used in clinical trials [7–12]. For oncology noninferiority clinical trials in particular, earlier systematic literature reviews focused on the design and quality [7–9,13]; however, results were not presented separately per specific end point. A systematic literature review published in 2019 evaluated only oncology noninferiority clinical trials with overall survival (OS) as a primary or coprimary end point [12]. The aim of the current study was to identify previously used noninferiority margins for various relevant end points in oncology noninferiority clinical trials and to explore factors that drive the selection of noninferiority margins.
Materials & methods
Search strategy
We conducted electronic searches of PubMed and Embase on 4 September 2019 for randomized controlled trials (RCTs) with noninferiority study designs for patients with cancer (detailed search terms are shown in Supplementary Table 1); a manual screening of references of included publications was also conducted. The search was limited to English language publications after 1 January 2000. Editorials and letters were excluded from the PubMed search, and editorials, errata, letters, notes, reviews and short surveys were excluded from the Embase search.
Screening & eligibility criteria
Using predefined eligibility criteria, two investigators (T Vincken and F Kroi) reviewed the titles and abstracts of retrieved articles sequentially for inclusion in the analysis. Publications were included if they were based on randomized noninferiority clinical trials of active treatments (i.e., surgical intervention, radiotherapy, adjuvant or neoadjuvant therapy, or systemic treatment) in patients with any type and stage of cancer; conference abstracts and study protocols were considered if they included sufficient details or if it was possible to retrieve supplementary sources associated with the presented study. Publications were excluded if a noninferiority margin was not prespecified. Duplicate publications, in other words, articles identified both in PubMed and Embase were removed. Subsequently, three investigators (T Vincken, F Kroi and S Gebregergish) reviewed the full text of the selected publications for the eligibility criteria described above as well as for relevant efficacy outcomes (OS, other time-to-event end points or response) or safety outcomes; studies that reported only duration of response or adverse events, quality of life or pharmacokinetic/pharmacodynamic outcomes were excluded. Study ID was used to avoid including multiple publications that reported on the same study. Disagreement regarding eligibility between investigators was resolved by consulting with a fourth investigator (M Hashim).
Data extraction
The following attributes were extracted from the full-length publications: ClinicalTrials.gov registry number, trial phase, country (multiple countries [≥2] vs single country), masking (blinded vs open-label), control arm (active vs placebo), number of treatment arms, sample size, age of participants (adult vs pediatric), cancer setting (early-stage vs advanced/metastatic), cancer type (solid tumor vs blood cancer), treatment modality, primary analysis population (intention-to-treat vs per treatment), primary end point, noninferiority margin scale, rationale for the prespecified noninferiority margin and results of the noninferiority test (successful vs failed; Supplementary Table 2). The dataset was validated based on independent extraction by three investigators (T Vincken, F Kroi and S Gebregergish).
Statistical analysis
Noninferiority margins in the different trials were described on absolute or relative scales. On an absolute scale, the noninferiority margin was expressed as the absolute difference between values of the two treatment groups, and the unit of the noninferiority margin was the same as the unit of the outcome. On a relative scale, the noninferiority margin was expressed as a ratio that compared the two treatment groups, for example, an hazard ratio (HR) between the two treatment groups, with the study outcome measured as the time-to-event. Trials with noninferiority margins reported as HRs for time-to-event outcomes and the absolute rate difference reported for response outcomes were considered for further analysis (primary outcome of this review). For other scales and end points, only descriptive statistics are presented.
The relationships between the reported noninferiority margin and prespecified trial and population characteristics were evaluated with both simple and multiple linear regression models fitted with the noninferiority margin as a dependent variable, available study characteristics and sample size as independent variables. For those variables with statistically significant coefficients (p < 0.05) in the multiple model, violin plots were used to visualize the distribution of noninferiority margins.
The following variables were considered: three most common cancers (colorectal, breast or lung cancer) in the studies reviewed, studies published in 2006 or prior (to coincide with EMA guidance [4] and initial Consolidated Standards of Reporting Trials [CONSORT] guidelines for noninferiority trials [14]); studies published from 2007 to 2010 (to coincide with draft FDA guidance [15] and updated CONSORT guidelines for noninferiority trials [16]); studies published from 2011 to 2016 (to coincide with final FDA guidance for noninferiority trials [3]); and studies published in or after 2017; Phase III or IV versus Phase II or not reported; multiple countries versus single country recruitment; open-label, blinded or not reported; active- versus placebo-controlled; adult versus pediatric or mixed-age populations; advanced/metastatic versus early-stage disease; solid tumor versus blood cancer; intention-to-treat versus other analyses; OS versus other primary end point for time-to-event outcomes and overall response rate (ORR) versus other primary end point for response outcomes; and rationale for the noninferiority margin specified versus not specified. Since treatment modality is highly correlated with cancer setting (advanced/metastatic vs early-stage disease), it was not included as a variable.
Results
Selection of publications
A total of 2284 publications were identified in PubMed (n = 1530), Embase (n = 751) and by additional manual screening of the included reports (n = 3). Of 2209 publications that remained after removal of duplicates, 436 records qualified for full-text screening; of these, 285 noninferiority clinical trials met the eligibility criteria and were included in the analysis (Figure 1). A bibliography of the included articles is provided in the Supplementary Material.
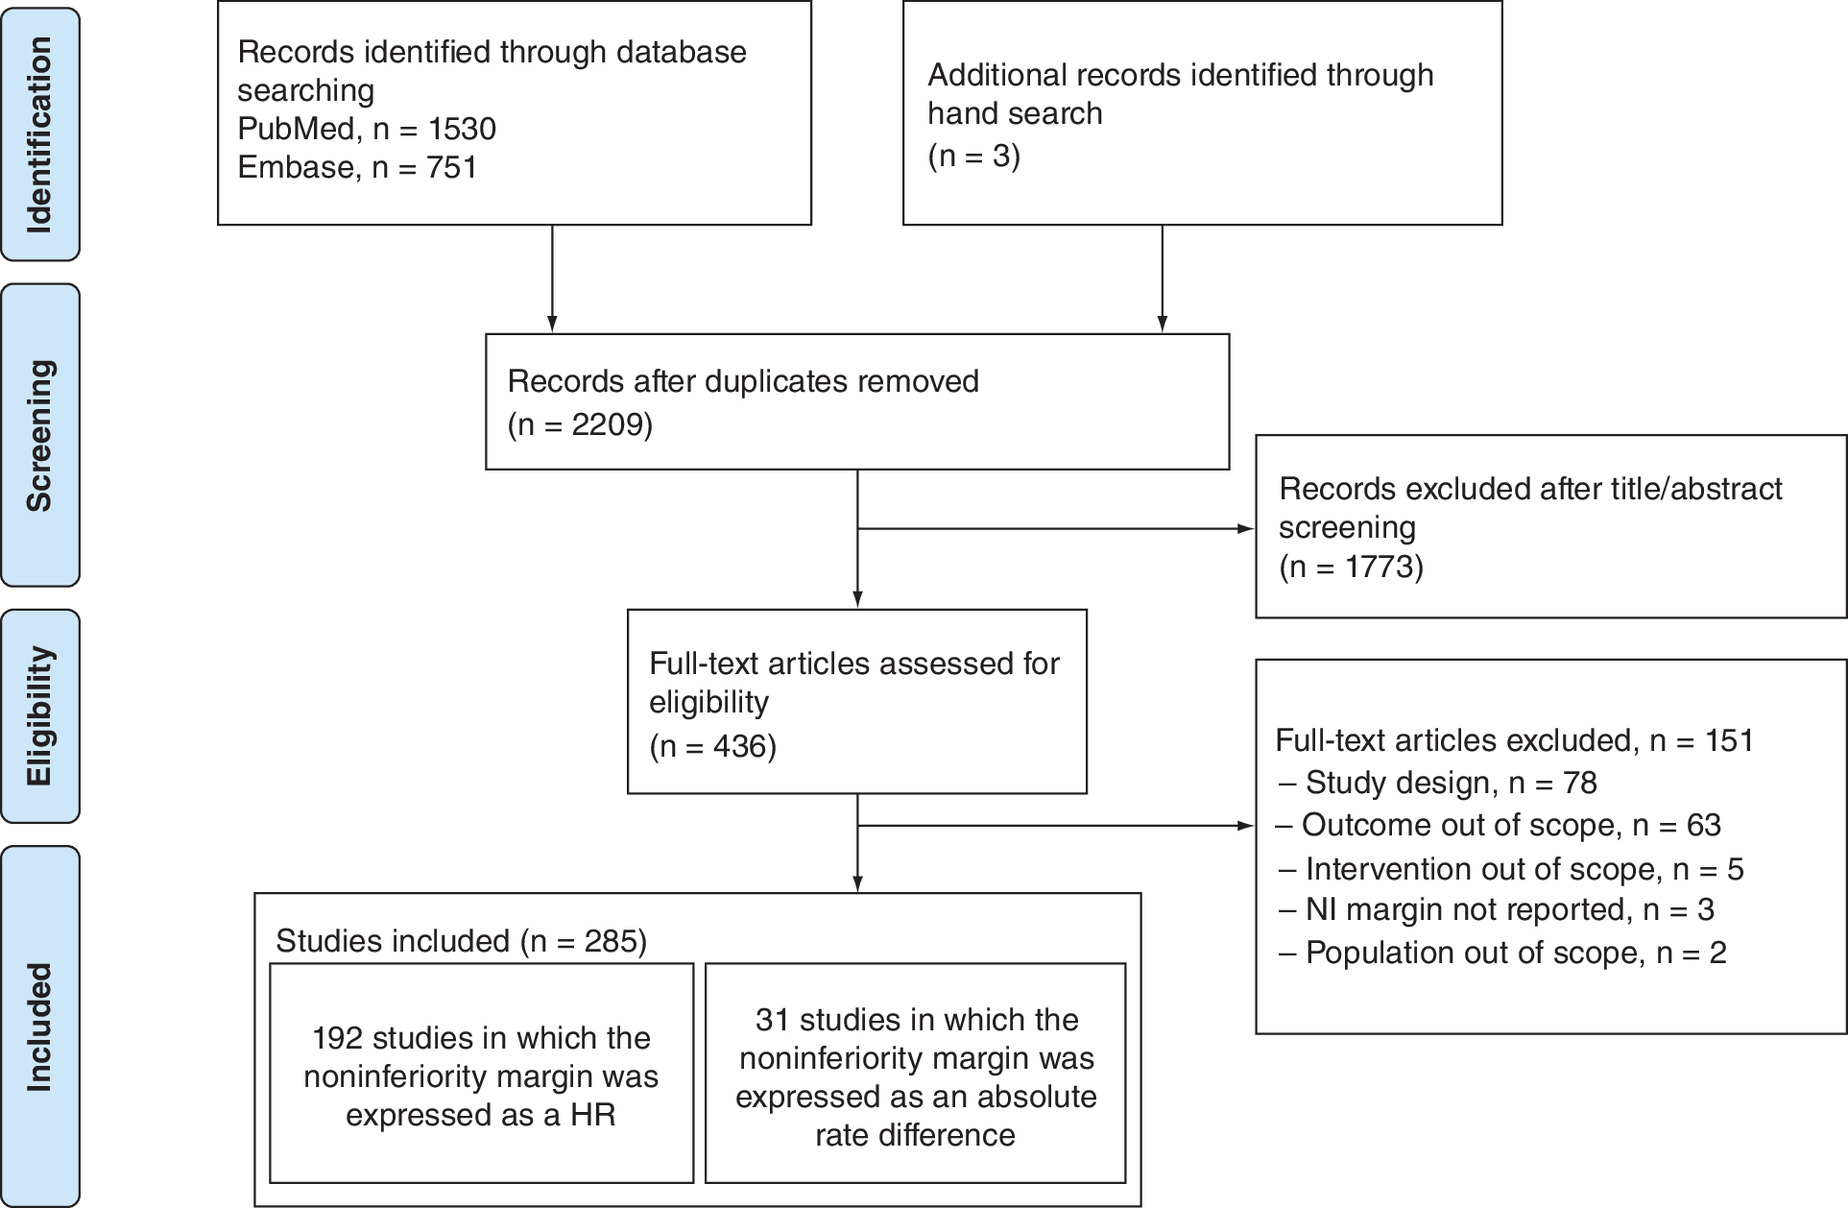
Figure 1. PRISMA flow diagram.
HR: Hazard ratio; NI: Noninferiority.
Noninferiority clinical trial characteristics
The noninferiority clinical trials included in this systematic review were most commonly Phase III (76.8%), open-label (74.7%), conducted in multiple countries (64.6%) and had active control arms (98.6%; Table 1). The three most common cancers included in the trials were colorectal (22.9%), breast (19.3%) and lung cancer (14.6%). The study populations consisted primarily of adults (97.2%), patients with advanced or metastatic disease (57.5%) and patients with solid tumors (86.0%). In the majority of studies, noninferiority assessment was carried out in the intention-to-treat population (74.0%). The rationale for the prespecified noninferiority margin was reported for most (87.7%) of the included studies; estimation was based on historical data (survival rates or effect size of active over control treatment in prior studies) in 71.2% of the trials. Nearly a third (29.5%) of the included trials failed to establish noninferiority for the active treatment over the control treatment. A small proportion of the studies used a placebo control arm (1.4%) or investigated a pediatric patient population (2.5%); therefore, these variables were excluded from the regression models. The mean sample size in the included trials was 829 (range: 7–10,270) and the median (25th–75th percentile) sample size was 509 (272–981).
| Variable | n (%) |
|---|---|
| Total | 285 (100.0) |
| Publication date | |
| 2006 or prior | 24 (8.4) |
| 2007–2010 | 41 (14.4) |
| 2011–2016 | 140 (49.1) |
| 2017 or after | 80 (28.1) |
| Trial phase | |
| Phase II | 27 (9.5) |
| Phase III | 219 (76.8) |
| Phase IV | 3 (1.1) |
| Not reported | 36 (12.6) |
| Continent | |
| Asia | 97 (34) |
| Europe | 89 (31.2) |
| Multiple continents | 83 (29.1) |
| North America | 13 (4.6) |
| Australia | 1 (0.4) |
| Africa | 1 (0.4) |
| South America | 1 (0.4) |
| Country | |
| Multiple Countries | 184 (64.6) |
| Single Country | 101 (35.4) |
| Masking | |
| Open-label | 213 (74.7) |
| Blinded | 22 (7.7) |
| Not reported | 50 (17.5) |
| Control arm | |
| Active | 281 (98.6) |
| Placebo | 4 (1.4) |
| No. of treatment arms | |
| 2 | 265 (93) |
| 3 | 17 (6.0) |
| 4 | 3 (1.1) |
| Total sample size | |
| ≤1000 patients | 217 (76.1) |
| >1000 patients | 68 (23.9) |
| Age of participants | |
| Adult | 277 (97.2) |
| Pediatric | 7 (2.5) |
| Mixed | 1 (0.4) |
| Cancer setting | |
| Advanced/metastatic | 164 (57.5) |
| Early-stage | 121 (42.5) |
| Cancer type | |
| Solid tumor | 245 (86.0) |
| Blood cancer | 40 (14.0) |
| Top three cancers by site | |
| Colorectal cancer | 44 (22.9) |
| Breast cancer | 37 (19.3) |
| Lung cancer | 28 (14.6) |
| Treatment modality | |
| Systemic | 198 (69.5) |
| Surgical | 27 (9.5) |
| Adjuvant/Neoadjuvant | 20 (7.0) |
| Radiotherapy | 20 (7.0) |
| Combination | 20 (7.0) |
| Primary analysis population | |
| Intention-to-treat analysis | 211 (74.0) |
| Per protocol analysis | 44 (15.4) |
| Not reported | 30 (10.5) |
| Primary end point | |
| OS | 96 (33.7) |
| DFS, RFS, TTR or local recurrence | 74 (26.0) |
| PFS or TTP | 70 (24.6) |
| ORR | 20 (7.0) |
| Biochemical or clinical failure | 7 (2.5) |
| Safety | 2 (0.7) |
| Other† | 16 (5.6) |
| Noninferiority margin scale | |
| Time-to-event end points | 194 (68.1) |
| Hazard ratio | 192 (67.4) |
| Absolute scale | 2 (0.7) |
| Binary end points | 91 (31.9) |
| Absolute scale | 88 (30.9) |
| Absolute difference in survival rate | 47 (16.5) |
| Absolute difference in %, response end points | 31 (10.9) |
| Absolute difference in %, other efficacy end points | 8 (2.8) |
| Absolute difference in %, safety end points | 2 (0.7) |
| Relative scale | 3 (1.1) |
| Rationale for prespecified noninferiority margin | |
| Based on historical survival rates | 111 (38.9) |
| Based on effect size of active over control treatment in prior trials | 92 (32.3) |
| Statistically appropriate / feasible | 25 (8.8) |
| Other reasons‡ | 22 (7.7) |
| Not reported | 35 (12.3) |
| Results of the noninferiority test | |
| Successful | 174 (61.1) |
| Failed | 84 (29.5) |
| Unknown§ | 27 (9.5) |
†
Included very good partial response, complete response, no progressive disease, progressive disease and sonographic recurrence.
‡
Included expert opinion, assumptions and noninferiority margin in previous studies.
§
Publications based on a study protocol.
DFS: Disease-free survival; ORR: Overall response rate; OS: Overall survival; PFS: Progression-free survival; RFS: Relapse-free survival; TTP: Time to progression; TTR: Time to relapse.
In all, 194 (68.1%) studies used noninferiority margins for time-to-event end points (Table 1); 192 studies in which the noninferiority margin was expressed as an HR between treatment groups were selected for further analysis, as per the prespecified primary outcome of this review. A total of 91 (31.9%) studies used noninferiority margins to evaluate binary end points; 31 studies that expressed the absolute difference in rates in treatment groups for response end points were included in further analysis.
Noninferiority margins for time-to-event end points
In the 192 studies that reported noninferiority margins for time-to-event end points as an HR, the mean/median sample size was 990/618 patients (range: 21–10,273); 134 studies (69.8%) evaluated populations of ≤1000 patients, with a mean/median sample size of 490/472 (range: 21–999). Across all trials, noninferiority margins ranged from 1.05 to 2.05 with mean and median values of 1.32 and 1.29, respectively; corresponding values for studies of ≤1000 patients were 1.33 and 1.30. As shown in Figure 2A, larger sample size was associated with lower noninferiority margins for time-to-event end points. Visual examination of the scatter plots showed half a symmetrical inverted funnel above the no effect estimate (i.e., HR: 1); with sample size used as a measure of precision, these results indicated that the risk of publication bias was unlikely.

Summary statistics for noninferiority margins of time-to-event end points are shown in Table 2; trends for higher noninferiority margins in study populations of ≤1000 patients appeared to be consistent with the overall analysis of time-to-event end points. The mean and median noninferiority margins, respectively, for the three most common cancers were, 1.31 and 1.28 for colorectal, 1.31 and 1.29 for breast and 1.25 and 1.25 for lung cancer. Eighty studies reported noninferiority margins as an HR for OS (mean/median sample size: 700/606 patients; range: 21–2135) with mean and median noninferiority margins of 1.28 and 1.25, respectively, in all studies. Fifty-seven studies reported noninferiority margins as an HR for progression-free survival (PFS) or time-to-progression (TTP) (mean/median sample size: 548/450 patients; range: 58–2126) with mean and median noninferiority margins of 1.30 and 1.25, respectively, in all studies. The range of noninferiority margins was smaller for OS (1.05–1.82) and PFS (1.08–1.80) compared with time-to-event end points overall (1.05–2.05). In an analysis of trials of patients who received chemotherapy (n = 83) versus targeted therapy (n = 55), mean and median noninferiority margins were similar for the systemic treatments (data not shown).
| Hazard ratio | ||||||||
|---|---|---|---|---|---|---|---|---|
| n | Mean | STD | Minimum | 25th percentile | Median | 75th percentile | Maximum | |
| All studies | 192 | 1.32 | 0.16 | 1.05 | 1.22 | 1.29 | 1.35 | 2.05 |
| Colorectal cancer | 44 | 1.31 | 0.13 | 1.10 | 1.24 | 1.28 | 1.33 | 1.82 |
| Breast cancer | 37 | 1.31 | 0.16 | 1.11 | 1.23 | 1.29 | 1.33 | 2.03 |
| Lung cancer | 28 | 1.25 | 0.08 | 1.11 | 1.18 | 1.25 | 1.32 | 1.50 |
| Trials by sample size | ||||||||
| Trials with >1000 patients | 58 | 1.29 | 0.19 | 1.05 | 1.19 | 1.25 | 1.32 | 2.03 |
| Trials with ≤1000 patients | 134 | 1.33 | 0.15 | 1.08 | 1.25 | 1.30 | 1.37 | 2.05 |
| Primary end point | ||||||||
| OS | 80 | 1.28 | 0.13 | 1.05 | 1.20 | 1.25 | 1.33 | 1.82 |
| PFS or TTP | 57 | 1.30 | 0.13 | 1.08 | 1.22 | 1.25 | 1.34 | 1.80 |
| DFS, RFS, TTR or local recurrence | 48 | 1.37 | 0.22 | 1.10 | 1.25 | 1.31 | 1.46 | 2.05 |
| Biochemical or clinical failure | 7 | 1.42 | 0.19 | 1.21 | 1.25 | 1.37 | 1.61 | 1.72 |
| Publication date | ||||||||
| 2006 or prior | 13 | 1.26 | 0.09 | 1.11 | 1.25 | 1.25 | 1.26 | 1.51 |
| 2007 to 2010 | 31 | 1.26 | 0.09 | 1.08 | 1.18 | 1.25 | 1.33 | 1.50 |
| 2011 to 2016 | 100 | 1.33 | 0.17 | 1.05 | 1.21 | 1.30 | 1.42 | 2.00 |
| After 2017 | 48 | 1.34 | 0.19 | 1.08 | 1.25 | 1.31 | 1.37 | 2.05 |
| Trial phase | ||||||||
| Phase III or IV | 160 | 1.29 | 0.13 | 1.05 | 1.21 | 1.25 | 1.33 | 2.03 |
| Phase II or not reported | 32 | 1.45 | 0.23 | 1.15 | 1.26 | 1.39 | 1.51 | 2.05 |
| Country | ||||||||
| Multiple countries | 79 | 1.28 | 0.17 | 1.05 | 1.20 | 1.25 | 1.33 | 2.00 |
| Single country | 113 | 1.34 | 0.15 | 1.10 | 1.25 | 1.32 | 1.39 | 2.05 |
| Masking | ||||||||
| Open-label | 110 | 1.32 | 0.16 | 1.10 | 1.25 | 1.30 | 1.34 | 2.05 |
| Blinded | 14 | 1.28 | 0.12 | 1.08 | 1.24 | 1.25 | 1.32 | 1.60 |
| Cancer setting | ||||||||
| Advanced/metastatic | 118 | 1.28 | 0.12 | 1.05 | 1.20 | 1.25 | 1.33 | 1.82 |
| Early-stage | 74 | 1.38 | 0.20 | 1.10 | 1.25 | 1.32 | 1.50 | 2.05 |
| Cancer type | ||||||||
| Solid tumor | 176 | 1.31 | 0.16 | 1.05 | 1.23 | 1.27 | 1.34 | 2.05 |
| Blood cancer | 16 | 1.39 | 0.20 | 1.11 | 1.21 | 1.36 | 1.51 | 1.77 |
| Primary analysis | ||||||||
| Intention-to-treat | 144 | 1.31 | 0.16 | 1.05 | 1.22 | 1.26 | 1.36 | 2.03 |
| Other | 48 | 1.33 | 0.18 | 1.08 | 1.22 | 1.30 | 1.34 | 2.05 |
| Rationale for noninferiority margin | ||||||||
| Specified | 171 | 1.31 | 0.16 | 1.05 | 1.22 | 1.26 | 1.33 | 2.05 |
| Not specified | 21 | 1.37 | 0.16 | 1.11 | 1.25 | 1.34 | 1.47 | 1.80 |
DFS: Disease-free survival; OS: Overall survival; PFS: Progression-free survival; RFS: Relapse-free survival; TTP: Time to progression; TTR: Time to relapse. STD: Standard deviation.
Based on the simple linear regression models, trial phase (Phase III/IV vs Phase II or not reported), patient recruitment (multiple countries vs single country), cancer setting (advanced/metastatic vs early disease) and primary end point (OS vs others) were significantly associated with lower noninferiority margins; based on the multiple model, trial phase and cancer setting remained significantly associated with lower noninferiority margins (Supplementary Tables 3 & 4). Additionally, in the multiple model, studies with lower sample size and those reporting rationale behind margin specification reported lower margins. Violin plots of noninferiority margin scales for HRs according to these variables are shown in Supplementary Figure 1.
For two studies that used the absolute difference in median survival times (sample sizes: 271 and 284 patients), the noninferiority margin was assumed to be 1.5 months in each study. In both studies, this was on the basis of survival rates that come from unspecified sources.
Noninferiority margins for binary end points
Among 31 studies that reported noninferiority margins for response end points as absolute rate difference, the mean/median sample size was 289/212 patients (range: 7–1229). Noninferiority margins ranged from 5.0 to 20.0%, with mean and median values of 12.7 and 13.0%, respectively. Similar to the trend observed for time-to-event end points, larger sample size was associated with lower noninferiority margins for response end points, with half a symmetrical inverted funnel above the no effect estimate (i.e., absolute difference = 0%) indicating absence of bias (Figure 2B).
Summary statistics for response end points and prespecified subgroups are shown in Table 3. A total of 19 (61.3%) of these studies (mean/median sample size: 246/212 patients; range: 7–719) evaluated ORR as the primary end point; in this group, the mean noninferiority margin was 13.5% and median was 15.0%. The remaining 12 (38.7%) studies (mean/median sample size: 358/211; range: 81–1229) assessed other response end points; mean and median noninferiority margins were 11.5 and 10.0%, respectively. Mean and median noninferiority margins were similar for trials of chemotherapy (n = 17) and targeted therapy (n = 7; data not shown). No variables were predictive of the noninferiority margin, based on the simple or multiple linear regression model (Supplementary Tables 3 & 4).
| Percentage point (%) | ||||||||
|---|---|---|---|---|---|---|---|---|
| n | Mean | STD | Minimum | 25th percentile | Median | 75th percentile | Maximum | |
| All studies | 31 | 12.7 | 3.9 | 5.0 | 10.0 | 13.0 | 15.0 | 20.0 |
| Colorectal cancer | 2 | 12.5 | 3.5 | 10.0 | 10.0 | 12.5 | 15.0 | 15.0 |
| Breast cancer | 5 | 11.4 | 3.5 | 7.0 | 8.5 | 10.0 | 15.0 | 15.0 |
| Lung cancer | 6 | 14.7 | 3.3 | 10.0 | 12.3 | 15.0 | 16.3 | 20.0 |
| Primary response end point | ||||||||
| ORR | 19 | 13.5 | 3.7 | 7.0 | 10.0 | 15.0 | 15.0 | 20.0 |
| Other response end points | 12 | 11.5 | 4.0 | 5.0 | 10.0 | 10.0 | 15.0 | 20.0 |
| Publication date | ||||||||
| 2006 or prior | 4 | 13.3 | 5.4 | 8.0 | 8.5 | 12.5 | 18.8 | 20.0 |
| 2007 to 2010 | 3 | 13.3 | 2.9 | 10.0 | 10.0 | 15.0 | 15.0 | 15.0 |
| 2011 to 2016 | 13 | 12.7 | 3.9 | 5.0 | 10.0 | 15.0 | 15.0 | 20.0 |
| After 2017 | 11 | 12.4 | 4.0 | 7.0 | 10.0 | 13.0 | 15.0 | 20.0 |
| Trial phase | ||||||||
| Phase III or IV | 21 | 12.6 | 4.1 | 7.0 | 10.0 | 10.0 | 15.0 | 20.0 |
| Phase II or not reported | 10 | 12.9 | 3.5 | 5.0 | 10.0 | 15.0 | 15.0 | 16.3 |
| Country | ||||||||
| Multiple countries | 25 | 12.5 | 4.2 | 5.0 | 10.0 | 10.0 | 15.0 | 20.0 |
| Single country | 6 | 13.5 | 2.0 | 10.0 | 12.3 | 14.0 | 15.0 | 15.0 |
| Masking | ||||||||
| Open-label | 18 | 13.0 | 4.1 | 5.0 | 10.0 | 15.0 | 15.0 | 20.0 |
| Blinded | 5 | 11.6 | 3.1 | 7.0 | 8.5 | 13.0 | 14.0 | 15.0 |
| Cancer setting | ||||||||
| Advanced/metastatic | 18 | 12.3 | 4.0 | 5.0 | 9.5 | 14.0 | 15.0 | 20.0 |
| Early-stage | 13 | 13.3 | 3.7 | 10.0 | 10.0 | 13.0 | 15.0 | 20.0 |
| Cancer type | ||||||||
| Solid tumor | 21 | 12.8 | 3.3 | 7.0 | 10.0 | 15.0 | 15.0 | 20.0 |
| Blood cancer | 10 | 12.5 | 5.1 | 5.0 | 9.3 | 11.5 | 16.3 | 20.0 |
| Primary analysis | ||||||||
| Intention-to-treat | 23 | 13.4 | 3.8 | 7.0 | 10.0 | 15.0 | 15.0 | 20.0 |
| Other | 8 | 10.9 | 3.8 | 5.0 | 7.8 | 10.0 | 15.0 | 15.0 |
| Rationale for noninferiority margin | ||||||||
| Specified | 24 | 13.2 | 3.7 | 7.0 | 10.0 | 14.0 | 15.0 | 20.0 |
| Not specified | 7 | 11.2 | 4.4 | 5.0 | 7.0 | 10.0 | 15.0 | 16.3 |
ORR: Overall response rate; STD: Standard deviation.
For 47 studies that assessed the absolute difference in survival rate as the noninferiority margin scale (mean/median sample size: 482/360 patients; range: 70–2073), mean and median noninferiority margins were 11 and 10%, respectively. For eight studies (mean/median sample size: 1512/1374; range: 89–2090) that reported absolute difference in percentage for efficacy end points other than response, for example, locoregional recurrence and sonographic recurrence, the mean and median noninferiority margins were 7.5 and 8.0%, respectively. For two studies that assessed safety end points with the absolute percentage difference as the noninferiority margin scale (sample sizes: 200 and 217 patients), noninferiority margins were 10 and 15%, respectively. For three studies that assessed relative risk for binary efficacy outcomes as the noninferiority margin scale (sample sizes: 447, 707 and 501 patients), noninferiority margins were reported to be 1.14, 1.25 and 1.15, respectively.
Discussion
This study aimed to identify and characterize previously applied noninferiority margins for relevant end points in oncology noninferiority clinical trials and included a variety of cancer types, settings and treatments. Across 192 trials reporting time-to-event end points with HRs, mean and median noninferiority margins were 1.32 and 1.29, respectively. Across 31 trials reporting response end points with absolute rate difference, mean and median noninferiority margins were 12.7 and 13.0%, respectively. There was substantial variation in noninferiority margins for both time-to-event end points (range: 1.05–2.05) and response end points (range: 5.0–20.0%).
Noninferiority margins in the literature
The median noninferiority margin values reported here are in line with those described in a prior systematic literature review of oncology noninferiority clinical trials published from January 2001 to January 2011, in which the median noninferiority margin was 1.25 for 34 studies reporting time-to-event end points and 12.5% for 28 studies reporting binary end points [8]. In that analysis, the noninferiority margin range for time-to-event outcomes (1.10–1.50) was narrower than that observed here, whereas the range for binary end points (4–25%) was slightly broader [8]. A list of the included oncology noninferiority clinical trials was not published with that systematic literature review [8]; thus, it is not possible to directly compare our findings with the results of the earlier analysis. A systematic literature review (conducted in March 2018 with no date limitations) that evaluated noninferiority criteria for HRs for 23 oncology noninferiority clinical trials with OS as a primary or coprimary end point reported a range of 1.08–1.33 [12], which was also narrower than the range for OS in our analysis (1.05–1.82). This may be explained, in part, by the fact that the trials included in the analysis by Gyawali et al. were all Phase III studies and evaluated patients with solid tumors [12]; these variables were significantly associated with lower noninferiority margins for time-to-event end points in our analysis.
Selection of noninferiority margin
Guidelines from the FDA and EMA recommend that both statistical and clinical judgment be used for the selection of a noninferiority margin [3,4]. Statistical reasoning should be based on historical data for the active comparator, preferably with the noninferiority margin defined according to pooled effect estimates from multiple prior RCTs and clinical judgment used to establish the proportion of the known effect of the active control versus placebo that must be maintained with the experimental agent [2]. However, practical considerations for trial feasibility, such as sample size, must be weighed against the clinical relevance of the noninferiority threshold and may, in part, drive differences in trial design and margin specification observed here. In simple and multiple linear regression models, the timing of study publication relative to EMA guidance (from 2007 to 2010 vs in 2006 or prior), draft FDA guidance (from 2011 to 2016 vs 2007 to 2010) or final FDA guidance (on or after 2017 vs 2011 to 2016), was not predictive of noninferiority margin. This suggests that the practice of noninferiority margin selection has not changed over time, but it is not readily apparent if it is consistent with regulatory guidance.
In general, there was considerable consistency in the scale used for noninferiority margins: most time-to-event end points were described with HRs and most binary end points were described using absolute difference in percentage point. However, there was a substantial variation in the prespecified margins and the rationale for choosing those margins. Since the benefit–risk assessment for cancer treatments differs from other therapeutic areas, special considerations should be taken when designing oncology noninferiority clinical trials, with particular attention to regulatory guidance on prespecification of the noninferiority margin, sample size and analysis population [3,4]. Increased transparency regarding the methods for specification of noninferiority margins will aid in design of future trials. Researchers will have a better understanding of the methodological issues and challenges involved in selection of noninferiority margins based on previous studies, which in turn can help them address any queries while designing future studies [2,17]. Transparency will also facilitate comparison between different trials utilizing the same noninferiority margins and could help researchers identify areas that need further study [2].
Rationale for selection of noninferiority margins
Of note, we found that the rationale for the prespecified noninferiority margin was not stated in 12.2% of the analyzed trials, and three studies that were identified in the search had to be excluded because they did not report the selected noninferiority margin. Since the first CONSORT extension for noninferiority trials in 2006, it has been recommended that the noninferiority margin and rationale for its selection be included in publications of randomized noninferiority clinical trials [14,16]. Despite this, earlier systematic literature reviews, published in 2012 and 2013, have also described inadequate reporting compared with CONSORT guidelines [7–9].
We also identified two systematic literature reviews published in the last 5 years of noninferiority trials outside of oncology. The first review explored the noninferiority margins used in vaccine RCTs, and results indicate that of the 143 trials, 66% used a margin of 10, 23% used margins lower than 10% and 11% used margins larger than 10% [18]. The authors therefore conclude that while most noninferiority vaccine RCTs used a noninferiority margin of 10% for difference, the variation in the margins was primarily due to the lack of rationale and unclear guidelines on the selection of noninferiority margins. Similarly, a second review assessing noninferiority margins in anti-infective trials showed that of the 227 trials, only 36.6% had a clear rationale for selection of noninferiority margins and 15% had misleading conclusions [19].
Timing of study publication relative to the issuance of the first CONSORT guidelines (from 2007 to 2010 vs in 2006 or prior) or updated guidelines (from 2011 to 2016 vs from 2007 to 2010) was not predictive of noninferiority margin in our simple and multiple linear regression models. The majority of the studies included in this analysis used the ITT population; however, FDA guidance for noninferiority studies recommends the use of a per protocol population [3].
Sample size considerations
Sample size planning is a crucial part of any trial design. It is well established that a prespecified noninferiority margin has a direct impact on the size of a noninferiority trial, since if the noninferiority margin is reduced the sample size is increased and vice versa [3]. Our finding that Phase III or IV studies were associated with lower noninferiority margins for time-to-event end points versus Phase II studies or studies for which the phase was not reported is likely due to their higher quality statistical planning and larger sample size. These factors may also be applied to the finding that studies conducted in multiple (≥2) countries were associated with lower noninferiority margins than those conducted in a single country. We additionally found that advanced/metastatic cancer (versus early-stage disease) and solid tumors (versus blood cancer) were associated with lower inferiority margins for time-to-event end points. The lower noninferiority margins observed in trials of advanced/metastatic versus early-stage cancer may be attributed to the fact that more events are expected within a shorter follow-up duration in patients with advanced disease, and thus, these studies have more power to show noninferiority for a given sample size. Moreover, smaller differences in efficacy outcomes are expected to be more meaningful in patients at higher risk, with a greater absolute impact that is reflected by the noninferiority margin.
Limitations & areas for future research
There are several limitations associated with this systematic literature review.
First, reporting of the methods and the rationale for specifying noninferiority margins in the included publications was generally short and often ambiguous. Consequently, we were unable to use this information to provide a specific recommendation on how noninferiority margins should be described, defined or justified in noninferiority clinical trials. Second, we analyzed cancer trials in general, for a comprehensive analysis, rather than focusing on a particular oncology setting or indication. Evaluation of noninferiority margins for specific types of cancer or treatments could be an area of future research. Third, we limited our analysis to publications of efficacy and safety outcomes. Health-related quality of life is also a key outcome of oncology trials but is rarely selected as the primary end point and thus represents an evidence gap for future analysis.
In this paper, we have focused on the noninferiority margin values used in previous oncology noninferiority trials rather than exploring the associations between positive results (i.e., a finding of noninferiority between two treatment arms) and characteristics of those studies. This is an interesting topic that warrants further research. Additionally, an assessment of the adequacy of noninferiority margins was not done as part of our analysis due to the retrospective nature of the studies, but could provide valuable insights to future researchers. Finally, other variables, including the effects of study duration, selection of active control, statistical power and alpha on margin choice, were not within the scope of this work and represent other areas for future investigation.
The noninferiority margins for key oncology end points identified here can aid in the interpretation of data from indirect treatment comparisons, for circumstances in which head-to-head trials have not been conducted or are not feasible. An earlier, targeted literature review of 99 publications based on oncology noninferiority clinical trials, identified mean noninferiority margins for PFS and OS as HRs of 1.333 and 1.298, respectively, for studies of ≤1000 patients [20], which is consistent with the findings here, based on a larger publication sample size. These noninferiority margins have been applied to matching adjusted indirect comparisons to categorize differences between treatment regimens, with results that did not achieve superiority or inferiority and did not qualify per the noninferiority criteria (HR: 1.333 for PFS and HR: 1.298 for OS) [20] treated as inconclusive [21].
Future perspective
With the development of new cancer treatments, more noninferiority clinical trials can be expected in the near future. Greater number of noninferiority trials will result in a larger dataset that can be utilized for systematic analysis. It will be interesting to see if there is an improvement in reporting of these noninferiority trials compared with the trials reviewed in our analyses. In the future, with a larger dataset and more complete reporting of noninferiority trials, it may be possible to make recommendations for optimal noninferiority margins in oncology clinical trials.
Conclusion
This systematic literature review identified and synthesized previously used noninferiority margins for time-to-event and response end points in randomized, controlled, noninferiority clinical trials of patients with cancer. There was considerable consistency in the scale used for noninferiority margins: most time-to-event end points were described with HRs and most binary end points were described using absolute difference in percentage. There was considerable variation in prespecified noninferiority margins across trials. Greater transparency about the selection of noninferiority margins and further research are needed to improve application and reporting of noninferiority margins in oncology noninferiority clinical trials.
•
Noninferiority clinical trials are designed to evaluate if the efficacy of an experimental intervention is not unacceptably worse than that of a standard of care treatment.
•
A systematic literature review was performed to evaluate previously used noninferiority margins for relevant end points in oncology noninferiority clinical trials.
•
Among 192 studies that reported noninferiority margins for time-to-event end points as a hazard ratio, mean and median values were 1.32 and 1.29, respectively, with a range of 1.05 to 2.05.
•
Among 31 studies that reported noninferiority margins for response end points as absolute rate difference, mean and median values were 12.7 and 13.0%, respectively, with a range of 5.0–20.0%.
•
Increased transparency regarding the specification of noninferiority margins is needed to improve consistency in their definition and application in oncology noninferiority clinical trials.
Author contributions
M Hashim, T Vincken, F Kroi and S Gebregergish performed the systematic literature review and analysis. M Spencer, J Wang, T Kampfenkel, A Lam and J He designed the analyses. All the authors participated in data interpretation, contributed to drafting of the manuscript and provided final approval for submission.
Financial & competing interests disclosure
These analyses were sponsored by Janssen Research & Development, LLC. M Hashim, T Vincken, F Kroi and S Gebregergish are employees of Ingress-Health, which was hired by Janssen to conduct this research. M Spencer, J Wang, T Kampfenkel, A Lam and J He are employees of Janssen. The authors have no other relevant affiliations or financial involvement with any organization or entity with a financial interest in or financial conflict with the subject matter or materials discussed in the manuscript apart from those disclosed.
Medical writing support was provided by Joanna Bloom, PhD, of Eloquent Scientific Solutions and was funded by Janssen Global Services, LLC.
Supplementary Material
File (suppl_file.zip)
- Download
- 243.71 KB
References
Papers of special note have been highlighted as: •• of considerable interest
1.
Fleming TR, Odem-Davis K, Rothmann MD, Li Shen Y. Some essential considerations in the design and conduct of non-inferiority trials. Clin. Trials 8(4), 432–439 (2011).
2.
Althunian TA, de Boer A, Groenwold RHH, Klungel OH. Defining the noninferiority margin and analysing noninferiority: an overview. Br. J. Clin. Pharmacol. 83(8), 1636–1642 (2017).
3.
US Food and Drug Administration. Guidance Document: Non-Inferiority Clinical Trials to Establish Effectiveness.(2016). www.fda.gov/media/78504/download
•• US FDA’s regulatory document includes guidelines on different aspects of noninferiority trial design.
4.
European Medicines Agency. Guideline on the choice of the non-inferiority margin. [Online] Committee For Medicinal Products For Human Use (CHMP) (2005). www.ema.europa.eu/en/documents/scientific-guideline/guideline-choice-non-inferiority-margin_en.pdf
•• European Medicines Agency’s regulatory document includes guidelines on selection of noninferiority margins.
5.
Jung SH. Design of Phase II non-inferiority trials. Contemp. Clin. Trials Commun. 7, 23–27 (2017).
6.
Introduction to Statistical Methods for Clinical Trials. Cook TD, De Mets DL (Eds). Chapman & Hall/CRC, FL, USA (2008).
7.
Tanaka S, Kinjo Y, Kataoka Y, Yoshimura K, Teramukai S. Statistical issues and recommendations for noninferiority trials in oncology: a systematic review. Clin. Cancer Res. 18(7), 1837–1847 (2012).
•• This literature review focused on the design and quality of oncology noninferiority clinical trial, with special emphasis on methodological issues.
8.
Riechelmann RP, Alex A, Cruz L, Bariani GM, Hoff PM. Non-inferiority cancer clinical trials: scope and purposes underlying their design. Ann. Oncol. 24(7), 1942–1947 (2013).
•• This systematic literature review evaluated the purpose underlying selection of noninferiority design and size of the noninferiority margin in oncology trials.
9.
Saad ED, Buyse M. Non-inferiority trials in breast and non-small cell lung cancer: choice of non-inferiority margins and other statistical aspects. Acta Oncol. 51(7), 890–896 (2012).
•• This review assessed the design features of oncology noninferiority clinical trials with regard to the justification of noninferiority margins.
10.
Rehal S, Morris TP, Fielding K, Carpenter JR, Phillips PP. Non-inferiority trials: are they inferior? A systematic review of reporting in major medical journals. BMJ Open 6(10), e012594 (2016).
11.
Althunian TA, de Boer A, Klungel OH, Insani WN, Groenwold RH. Methods of defining the non-inferiority margin in randomized, double-blind controlled trials: a systematic review. Trials 18(1), 107 (2017).
12.
Gyawali B, Tessema FA, Jung EH, Kesselheim AS. Assessing the justification, funding, success, and survival outcomes of randomized noninferiority trials of cancer drugs: a systematic review and pooled analysis. JAMA Netw. Open 2(8), e199570 (2019).
13.
Paesmans M, Grigoriu B, Ocak S et al. Systematic qualitative review of randomised trials conducted in nonsmall cell lung cancer with a noninferiority or equivalence design. Eur. Respir. J. 45(2), 511–524 (2015).
14.
Piaggio G, Elbourne DR, Altman DG, Pocock SJ, Evans SJ. Group C. Reporting of noninferiority and equivalence randomized trials: an extension of the CONSORT statement. JAMA 295(10), 1152–1160 (2006).
15.
US Food and Drug Administration. Guidance for industry non-inferiority clinical trials draft guidance (2010). www.fdanews.com/ext/resources/files/archives/n/NoninferiorityGuidance.pdf
16.
Piaggio G, Elbourne DR, Pocock SJ, Evans SJ, Altman DG. Group C. Reporting of noninferiority and equivalence randomized trials: extension of the CONSORT 2010 statement. JAMA 308(24), 2594–2604 (2012).
17.
HonOrio HM, Wang L, Rios D. Non-inferiority clinical trials: importance and applications in health sciences. Braz. Oral Res. 34(Suppl. 2), e072 (2020).
18.
Donken R, de Melker HE, Rots NY, Berbers G, Knol MJ. Comparing vaccines: a systematic review of the use of the non-inferiority margin in vaccine trials. Vaccine 33(12), 1426–1432 (2015).
19.
Bai AD, Komorowski AS, Lo CKL et al. Methodological and reporting quality of non-inferiority randomized controlled trials comparing antibiotic therapies: a systematic review. Clin. Infect. Dis. ciaa1353 (2020).
20.
Hashim M, He J, Hu P et al. Is there a consensus regarding clinically relevant non-inferiority margins used for key oncology endpoints in non-inferiority oncology trials? Value Health 21(Suppl. 1), S228 (2018).
21.
Mateos MV, San-Miguel J, Goldschmidt H et al. The effects of different schedules of bortezomib, melphalan, and prednisone for patients with newly diagnosed multiple myeloma who are transplant ineligible: a matching-adjusted indirect comparison. Leuk. Lymphoma 61(3), 680–690 (2020).
Information & Authors
Information
Published In
Pages: 443 - 455
PubMed: 33728935
Copyright
© 2021 Future Medicine Ltd.
History
Received: 14 September 2020
Accepted: 29 January 2021
Published online: 17 March 2021
Keywords:
Topics
Authors
Metrics & Citations
Metrics
Article Usage
Article usage data only available from February 2023. Historical article usage data, showing the number of article downloads, is available upon request.
Citations
How to Cite
A systematic review of noninferiority margins in oncology clinical trials. (2021) Journal of Comparative Effectiveness Research. DOI: 10.2217/cer-2020-0200
Export citation
Select the citation format you wish to export for this article or chapter.
Citing Literature
- Keisuke Anan, Yuki Kataoka, Masataka Taguri, Kazuya Ichikado, Ryo Tachikawa, Kazunori Tobino, Kodai Kawamura, Chigusa Shirakawa, Takafumi Kawabata, Yosuke Yamamoto, Efficacy and safety of RApid PrednIsolone Dose reduction for acute exacerbation of Idiopathic Pulmonary Fibrosis (RAPID-IPF Trial): a study protocol for a randomised controlled trial, BMJ Open Respiratory Research, 10.1136/bmjresp-2025-003818, 13, 1, (e003818), (2026).
- Nick J. Lee, Federico Polverino, Leonardo Quarta, Maximilian Filzmayer, Michele Petix, Jordan A. Goyal, Nicola Longo, Gennaro Musi, Felix K.H. Chun, Alberto Briganti, Shahrokh F. Shariat, Fred Saad, Pierre I. Karakiewicz, Tumor size effect on cancer-specific mortality in T2N0M0 urothelial bladder cancer treated with trimodal therapy, Urologic Oncology: Seminars and Original Investigations, 10.1016/j.urolonc.2026.111076, 44, 5, (111076), (2026).
- Heinz Ludwig, Evangelos Terpos, Mario Boccadoro, Sara Martínez, Carmen Kahatt, Javier Jiménez, Antonio Nieto, Sonia Extremera, Javier Gómez, Vicente Alfaro, Ruthanna Davi, Xiang Yin, María Victoria Mateos, Plitidepsin in combination with dexamethasone (ADMYRE trial) versus an external control arm of pomalidomide plus dexamethasone in patients with relapsed/refractory multiple myeloma, Annals of Hematology, 10.1007/s00277-026-06811-w, 105, 1, (2026).
- Dawn Lee, Alex Allen, Alan Lovell, Ahmed Abdelsabour, Edward C.F. Wilson, G.J. Melendez-Torres, How Similar Is Similar Enough? Assessment of Indirect Treatment Comparisons to Support Similarity for National Institute for Health and Care Excellence’s Cost Comparison Route, Value in Health, 10.1016/j.jval.2025.05.003, 28, 11, (1770-1779), (2025).
- Kelly E. McCann, Noran Osman, Joan Cannon, Lonnie Brent, Yuexi Wang, Jon Tepsick, Prithviraj Vikramsinh Mandora, Vincent Miller, Nancy Martin, Virginia G. Kaklamani, Goserelin 3-month depot shows non-inferiority to the monthly formulation in U.S. patients with premenopausal breast cancer: a real-world evidence study, Breast Cancer Research and Treatment, 10.1007/s10549-025-07656-z, 211, 2, (409-419), (2025).
- Troy J Kleber, Alexander D Sherry, Andrew J Arifin, Gabrielle S Kupferman, Ramez Kouzy, Joseph Abi Jaoude, Timothy A Lin, Esther J Beck, Avital M Miller, Adina H Passy, Zachary R McCaw, Pavlos Msaouel, Ethan B Ludmir, Justification, margin values, and analysis populations for oncologic noninferiority and equivalence trials: a meta-epidemiological study, JNCI: Journal of the National Cancer Institute, 10.1093/jnci/djae318, 117, 5, (898-906), (2024).
- Sven G. Meuth, Stephanie Wolff, Anna Mück, Alice Willison, Konstanze Kleinschnitz, Saskia Räuber, Marc Pawlitzki, Franz Felix Konen, Thomas Skripuletz, Matthias Grothe, Tobias Ruck, Hagen B. Huttner, Christoph Kleinschnitz, Tobias Bopp, Refik Pul, Bruce A. C. Cree, Hans‐Peter Hartung, Kathrin Möllenhoff, Steffen Pfeuffer, Different Treatment Outcomes of Multiple Sclerosis Patients Receiving Ocrelizumab or Ofatumumab, Annals of Neurology, 10.1002/ana.27143, 97, 3, (583-595), (2024).