Network meta-analyses for EGFR mutation-positive non-small-cell lung cancer: systematic review and overview of methods and shortcomings
Publication: Journal of Comparative Effectiveness Research
Abstract
Aim: To perform a review of network meta-analyses (NMAs) for the first-line treatment of EGFR mutation-positive non-small-cell lung cancer, and to provide an overview of methodological approaches and potential shortcomings. Materials & methods: We conducted a systematic review of NMAs and evaluated their methodologies, including inclusion/exclusion criteria, information sources, results and outcomes, and statistical methodologies. Results: We identified ten published NMAs using five archetypical network structures. Despite similar objectives, there was substantial variability in the number of trials included in each NMA and in the relative treatment efficacy of the tyrosine kinase inhibitors. Conclusion: We identified methodological issues to explain differences in the findings, criteria for inclusion in NMAs and the degree of lumping of treatments. These factors should be given particular consideration in future research.
Lay abstract
Medical researchers often use research methods (called network meta-analysis), using data from clinical trials, to estimate the relative benefits of drug treatments that have not been compared directly. These methods have often been used to compare treatment options for patients with EGFR mutation-positive non-small-cell lung cancer. In this study, we identified and looked at ten published comparisons to see how they were conducted and if the assumptions made by the researchers led to differences in the results. We found that assumptions about the similarity of treatments were an important factor that should be given particular consideration when conducting this type of research in the future.
The discovery of EGFR mutations in non-small-cell lung cancer (NSCLC) launched a new era of personalized medicine for patients with advanced NSCLC; EGFR tyrosine kinase inhibitors (TKIs) are now the standard first-line treatment for patients with EGFR mutation-positive disease [1,2]. There are currently three generations of EGFR TKIs that have been approved for first-line treatment: the first-generation TKIs that are characterized by reversible binding to EGFR (erlotinib, gefitinib and icotinib); the second-generation TKIs that are characterized by irreversible binding to EGFR, as well as other members of the ErbB receptor family, HER2 and HER4 (afatinib and dacomitinib); and the third-generation TKI, osimertinib, which is characterized by irreversible binding to EGFR and activity against the T790M mutation.
Numerous randomized clinical trials (RCTs) have been conducted to establish the efficacy and safety of these agents in patients with EGFR mutations. Chemotherapy was the standard of care before the discovery of EGFR mutations. The original clinical trials, therefore, compared EGFR TKIs with first-line chemotherapy regimens – namely, platinum-based doublet therapy, including cisplatin or carboplatin plus gemcitabine, taxanes or pemetrexed. Subsequent studies have also been conducted comparing gefitinib with either afatinib [3] or erlotinib [4]. RCTs conducted for subsequent agents – namely, osimertinib and dacomitinib – were compared with the reversible EGFR TKIs (erlotinib or gefitinib and gefitinib, respectively).
Despite the increasing number of trials comparing TKIs, the lack of direct comparative trials between second- and third-generation TKIs implies that what constitutes the ‘optimal choice of TKI’ remains an area of discussion. Even though NMAs are not commonly used in clinical decision-making, they are frequently used to guide funding and systems-level healthcare decision-making.
NMAs provide a useful method for estimating the relative treatment effects of available EGFR TKIs and have advantages over pairwise meta-analyses as they enable direct and indirect evidence via a common comparator. Whereas pairwise meta-analysis seeks to combine evidence from trials comparing two treatments (A and B), NMAs involve more than two treatments and can estimate the relative treatment effects of B and C indirectly, using data from A versus B and A versus C.
Use of NMAs is also a relatively new statistical approach, and rigor is required in many aspects of the analysis to ensure valid and generalizable findings. To perform a valid NMA, the assumption of exchangeability of the true treatment effect must be met [5]. Even though it is not possible to rule out the presence of potential confounders without randomization, researchers need to ensure that the effect modifiers between studies (homogeneity) and effect modifiers across comparisons (consistency) are balanced [6]. If any such imbalances exist, the validity of an NMA cannot be assumed. Researchers should, therefore, strive to limit the impact of deviations from exchangeability and the impact of chance imbalances in effect modifiers, and also hold down clinical heterogeneity between direct and indirect evidence [5].
The continued development of different EGFR TKIs has resulted in a large number of published NMAs in this setting. In fact, there are nearly as many NMAs published on this topic as there are RCTs on which the analyses are based. Even though the sources and statistical methods are mostly similar, results and conclusions tend to differ in the literature. A coherent, systematic overview of previous work and assessment of potential causes of any discrepancies can provide useful information for decision-makers and can potentially inform future research in this area.
In this study, we performed a literature review of published NMAs in first-line EGFR mutation-positive NSCLC to characterize and structure published work in this area. Also, we reconstructed some of the identified networks to explore how different approaches and trade-offs impact results.
Materials & methods
Search strategy
We performed a systematic review to identify NMAs comparing EGFR TKIs as first-line treatment for adults with locally advanced or metastatic (stage IIIb or IV) nonsquamous NSCLC having activating EGFR mutations. We searched MEDLINE In-Process, MEDLINE, EMBASE and the Cochrane Library via Ovid. Only published articles in peer-reviewed journals were included. Congress abstracts were excluded as they do not report sufficient detail for adequate evaluation here. Searches were limited to English language publications on human subjects published up to June 2019. Search syntax included terms for NSCLC, stage of the disease and treatments of interest (including the term EGFR TKI). The search was limited to NMAs, mixed treatment comparisons and indirect treatment comparisons.
Data extraction
Full publications for all citations of interest were obtained, and data on the stated objectives and methods of the retrieved publications, including study eligibility criteria, sources (i.e., databases searched), bias risk assessment, effect measures and statistical methods, were extracted. In addition, information on the underlying methods/models used, statistical treatment of first- versus second-line therapy, statistical analysis of chemotherapy regimens and heterogeneity and sensitivity analyses, were also collected.
Analysis
NMA evaluation based on International Society for Pharmacoeconomics and Outcomes Research
We used the 26-item questionnaire developed by the International Society for Pharmacoeconomics and Outcomes Research (ISPOR) Academy of Managed Care Pharmacy and the National Pharmaceutical Council taskforce [6] to provide a structure for our review. The questionnaire is used to score an NMA over the two domains of relevance and credibility. The relevance domain (four questions) scores the extent to which results of a NMA, if trustworthy, apply to the setting of interest. The domain includes questions related to the population, comparators, end points, time frame and other policy-relevant differences. The credibility domain (22 questions) scores the extent to which the NMA provides valid answers to the questions. Questions guiding the assessment of credibility are grouped into five subdomains: evidence base used for the indirect comparison or NMA, analysis of a NMA reporting quality and transparency, interpretation and conflict of interest.
Objectives, search strategies, eligibility criteria & bias assessment
We compared the stated objectives across the identified NMAs and analyzed the information sources, the number of trials included and the eligibility criteria used. We investigated whether the quality or bias risk of the included studies was assessed and, if so, the tools and methods used (e.g., JADAD score [7], Cochrane risk [8] and National Institute for Health and Care Excellence [9]).
Completeness of trial inclusion & network construction
We report the completeness of each NMA trial inclusion by compiling a list of trials identified across all reviews and making comparisons across each NMA, with consideration of the interventions included and the numbers of trials evaluated. We also compared how networks were constructed.
Chosen outcomes & efficacy/safety estimates
We compared which outcomes had been chosen to measure efficacy and compared reported estimates of efficacy and associated statistical significance across NMAs. We also evaluated whether safety was compared, and the methods by which this was done.
Statistical analyses
First, we compared the method/model used for obtaining pooled estimates of efficacy (e.g., frequentist regression or Bayesian NMA). Second, we compared how the NMAs dealt with the analyses of first- versus second-line patients. Finally, we compared the types of analyses conducted to explore potential sources of heterogeneity, as well as sensitivity analyses and outlier detection.
Network reconstruction
To provide a consistent benchmark of how different analytical strategies affect results, we reconstructed networks identified in the literature using a frequentist weighted least-squares approach, as described by Rücker [10]. For heterogeneity tests, Chi-square tests and I2 inconsistency statistics were used [11,12]. I2 values of 0–24.9, 25–49.9, 50–74 and 75–100% were considered as none, low, moderate and high heterogeneity, respectively [11,12]. To investigate heterogeneity and inconsistency, we used the Cochran’s Q statistic for multivariate meta-analysis. The Q value is composed of the sum of within-design and between-design Q statistics that incorporate the concept of design inconsistency; see details described by Higgins and Thompson [11]. A p-value of 0.10 was considered to indicate significant heterogeneity. To perform the analyses on which treatment is ‘best’, we used p-values to rank interventions; higher p-values indicated a greater probability of an intervention being the best treatment.
Results
Our search identified 127 articles with 49 duplicates. We reviewed 78 abstracts/titles, excluded 66 in the initial eligibility assessment and included 12 publications for the full-text eligibility review. Two publications were excluded in this process, leaving ten publications for the full review (Figure 1) [15–24].
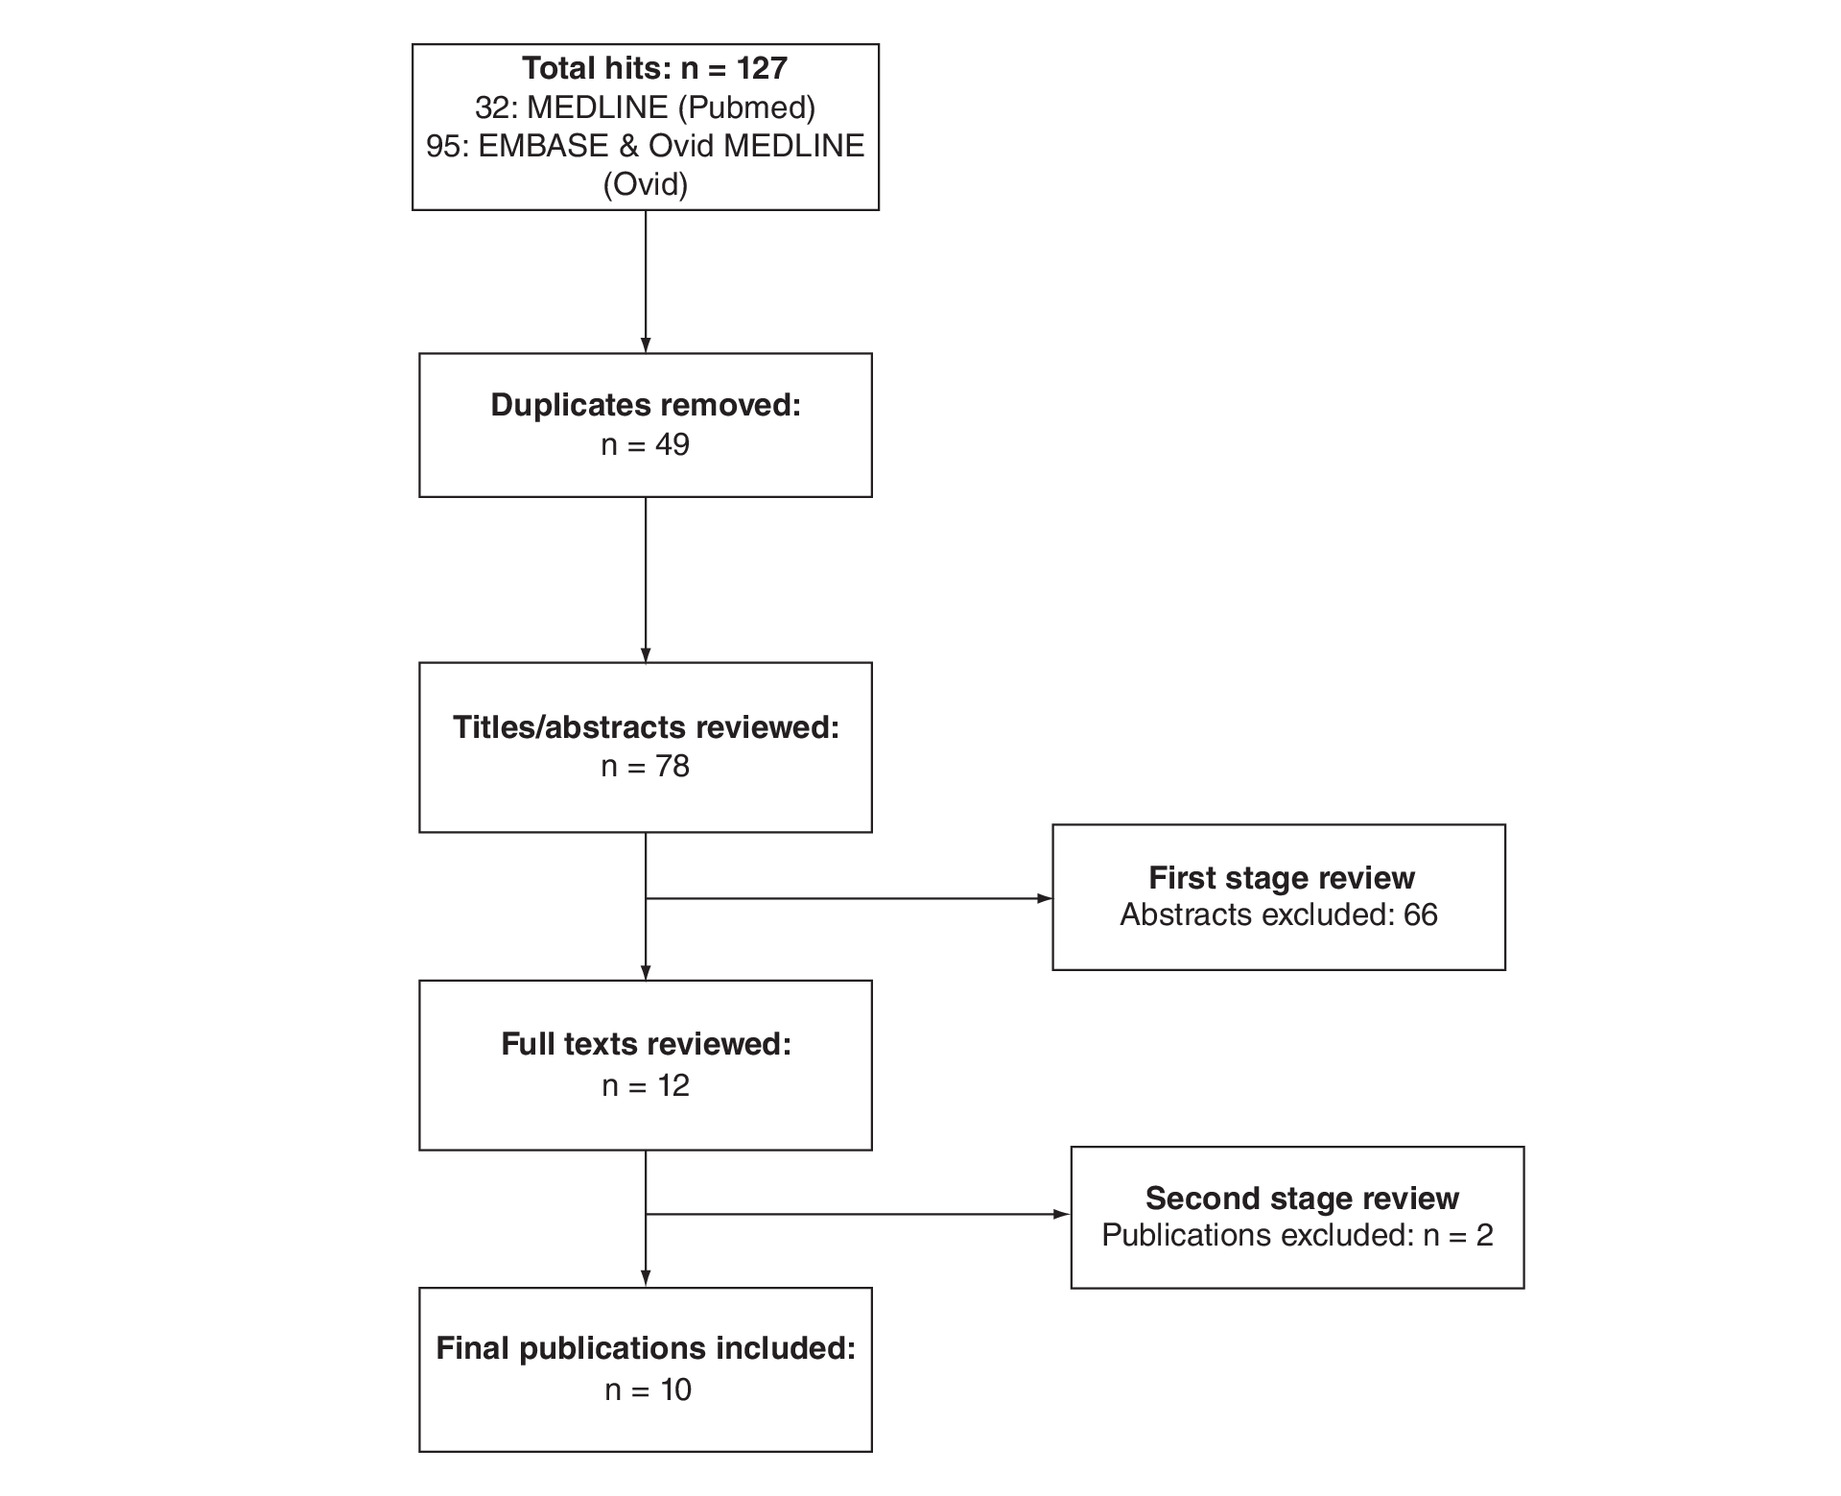
Figure 1. Flow diagram literature search.
Publications were excluded because they were not conducted in the correct patient population, they were not network meta-analyses or they were conference abstracts.
Objectives, search strategies, eligibility criteria & bias assessment
Two over-reaching objectives were observed (Table 1). Eight reviews aimed to assess the comparative efficacy and safety of different EGFR TKIs for the treatment of EGFR mutation-positive NSCLC. Two papers aimed to assess whether the efficacy of EGFR TKIs differs between exon 19 deletion (Del19) and exon 21 L858R (L858R) mutations.
| Study (year) | Databases searched | Trial details | TKIs | Other interventions | Assessed outcomes | ||||||||||||||||
|---|---|---|---|---|---|---|---|---|---|---|---|---|---|---|---|---|---|---|---|---|---|
| PubMed | EMBASE | Cochrane Library | Congress abstracts | Trial quality assessment | Period of search | N of included studies | Type of trial included | Line of treatments | Patient populations included | Afatinib | Dacomitinib | Erlotinib | Gefitinib | Icotinib | Osimertinib | PFS | OS | ORR/DCR | Safety | ||
| Liang et al. (2014) | x | x | x | x | JADAD score | Up to Mar 2013 | 12 | RCTs | Mixed | ITT | x | x | x | x | x | Chemotherapy with pemetrexed (lumped) Chemotherapy without pemetrexed (lumped) | 1-year | 1-/2-year | x | Rash, diarrhea | |
| Popat et al. (2014) | x | x | x | NICE | 2002–Mar 2012 | 21 | RCTs | First line | ITT and common mutations separately; and nonmutated patients | x | x | x | Cisplatin/pemetrexed Cisplatin/gemcitabine Cisplatin/vinorelbine Cisplatin/docetaxel Carboplatin/docetaxel Carboplatin/paclitaxel Cisplatin/paclitaxel Carboplatin/gemcitabine | x | x | – | |||||
| Zhang et al. (2016) | x | x | x | x | JADAD score | Up to Dec 2015 | 16 | RCTs | Mixed | ITT | x | x | x | – | 1-year | 1-/2-year | x | Rash, diarrhea, liver enzymes | |||
| Batson et al. (2017) | x | x | x | x | NICE | Up to Mar 2016 | 9 | RCTs | First line | ITT | x | x | x | Chemotherapy (lumped) Erlotinib + bevacizumab | x | – | |||||
| Lin et al. (2018) | x | x | x | x | JADAD score | Jan 2009–Nov 2017 | 11 | RCTs | First line | ITT | x | x | SoC | x | Chemotherapy (lumped) | x | x | x | – | ||
| De Mello et al. (2018) | x | x | – | Up to Aug 2016 | 9 | Phase III RCTs | First line | ITT | x | x | x | Control/systematic treatment | x | x | x | Diarrhea, skin rash, stomatitis, paronychia | |||||
| Holleman et al. (2019) | x | x | x | Cochrane tool | Jan 2010–Nov 2016 | 13 | RCTs | First line | ITT (activating) | x | x | x | x | x | Chemotherapy (lumped) | x | x | x | Diarrhea, rash | ||
| Franek et al. (2019) | x | x | x | x | NICE | Jan 2004–Aug 2018 | 8 | RCTs | First line | ITT | x | x | x | x | x | Cisplatin + gemcitabine | x | x | – | ||
| Sheng et al. (2016) | x | x | x | x | JADAD score | 1999–2015 | 26 | RCTs and retrospective | Mixed | Del19 and L858R separately | x | x | x | Chemotherapy (lumped) | x | x | x | – | |||
| Zhang et al. (2014) | x | x | x | Google Scholar | JADAD score /Newcastle–Ottawa scale | Not given | 13 | RCTs and retrospective | First line | ITT | x | x | x | x | x | Chemotherapy first line (lumped) Chemotherapy after first line (lumped) | x | – | |||
DCR: Disease control rate; ITT: Intention to treat; NICE: National Institute for Health and Care Excellence; ORR: Objective response rate; OS: Overall survival; PFS: Progression-free survival; RCT: Randomized controlled trial; SoC: Standard of care; TKI: Tyrosine kinase inhibitor.
All publications used standard search terms and the key databases (MEDLINE, EMBASE and the Cochrane Library of registered trials [Table 1]); some, but not all, included searches of conference proceedings but few additional studies were identified by this method. The reviews investigating the relative efficacy and safety of different EGFR TKIs limited the included studies to RCTs, whereas the two publications investigating the difference between Del19 and L858R mutations also included retrospective analyses. Eight publications included only studies conducted in the first-line setting, and three evaluated both first- and second-line trials.
Nine publications reported that the quality of the included trials was assessed, most commonly using the JADAD score [7]. In general, all publications evaluating study quality reported that the included trials were of sufficient quality to warrant inclusion in the network.
Completeness of trial inclusion & network construction
The number of trials included in networks differed between the publications (Table 2). We identified three main factors, in addition to timing of publication, that led to different subsets of trials being used: different treatment settings being assessed (first- vs second-line setting) [22,23]; which interventions were considered to be relevant (chemotherapy is, for instance, not commonly prescribed in the first line anymore) [17]; and retrospective studies in addition to RCTs (which increase the number of trials included in the respective NMA) [24,25].
| Author | Date | Trial name | Treatment setting | TKI | Comparator | NMAs | ||||||||||
|---|---|---|---|---|---|---|---|---|---|---|---|---|---|---|---|---|
| N of NMAs, including trial | Liang et al. (2014) | Popat et al. (2014) | Zhang et al. (2014) | Sheng et al. (2016) | Zhang et al. (2016) | Batson et al. (2017) | Lin et al. (2018) | Franek et al. (2019) | De Mello et al. (2018) | Holleman et al. (2019) | ||||||
| Fukuoka et al. | 2009 | IPASS | First line | Gefitinib | Carboplatin/paclitaxel | 7 | x | x | x | x | x | x | x | |||
| Maemondo et al. | 2010 | NEJ002 | First line | Gefitinib | Carboplatin/paclitaxel | 9 | x | x | x | x | x | x | x | x | x | |
| Mitsudomi et al. | 2010 | WJTOG 3405 | First line | Gefitinib | Cisplatin/docetaxel | 8 | x | x | x | x | x | x | x | x | ||
| Zhou et al. | 2011 | OPTIMAL | First line | Erlotinib | Carboplatin/gemcitabine | 8 | x | x | x | x | x | x | x | x | ||
| Rosell et al. | 2012 | EUTRAC | First line | Erlotinib | Chemotherapy | 9 | x | x | x | x | x | x | x | x | x | |
| Han et al. | 2012 | First-SIGNAL | First line | Gefitinib | Cisplatin/gemcitabine | 5 | x | x | x | x | x | |||||
| Sequist et al. | 2013 | LUX-Lung 3 | First line | Afatinib | Cisplatin/pemetrexed | 10 | x | x | x | x | x | x | x | x | x | x |
| Wu et al. | 2013 | LUX-Lung 6 | First line | Afatinib | Cisplatin/gemcitabine | 10 | x | x | x | x | x | x | x | x | x | x |
| Seto et al. | 2014 | JO25567 | First line | Erlotinib/ bevacizumab | Erlotinib | 2 | x | x | ||||||||
| Wu et al. | 2015 | ENSURE | First line | Erlotinib | Cisplatin/gemcitabine | 7 | x | x | x | x | x | x | x | |||
| Park et al. | 2015 | LUX-Lung 7 | First line | Afatinib | Gefitinib | 5 | x | x | x | x | x | |||||
| Soria et al. | 2017 | Flaura | First line | Osimertinib | Erlotinib/gefitinib | 3 | x | x | x | |||||||
| Wu et al. | 2017 | ARCHER | First line | Dacomitinib | Gefitinib | 3 | x | x | x | |||||||
| Shi et al. | 2017 | CONVINCE | First line | Icotinib | Cisplatin/pemetrexed | 1 | x | |||||||||
| Yang et al. | 2017 | CTONG 0901 | Mixed | Gefitinib | Erlotinib | 3 | NR | NR | NR | x | NR | x | NR | NR | x | |
| Douillard et al. | 2008 | INTEREST | Previously treated | Gefitinib | Docetaxel | 2 | x | NR | NR | NR | x | NR | NR | NR | ||
| Maruyama et al. | 2008 | V 15–32 | Previously treated | Gefitinib | Docetaxel | 2 | x | NR | NR | NR | x | NR | NR | NR | ||
| Ciuleanu et al. | 2012 | TITAN | Previously treated | Erlotinib | Pemetrexed/docetaxel | 3 | x | NR | NR | NR | x | NR | x | NR | NR | |
| Shi et al. | 2013 | ICOGEN | Previously treated | Icotinib | Gefitinib | 1 | x | NR | NR | NR | NR | NR | NR | |||
| Kawaguchi et al. | 2014 | DELTA | Previously treated | Erlotinib | Docetaxel | 1 | NR | NR | NR | x | NR | NR | NR | |||
| Nishiyama et al. | 2014 | WJOG 5108L | Previously treated | Gefitinib | Erlotinib | 1 | NR | NR | NR | x | NR | NR | NR | |||
| Other retrospective studies | 2020 | Various | Various | Various | – | 18 | 6 | |||||||||
| Other chemotherapy studies | 2020 | Various | First line | Various | – | 11 | ||||||||||
NMA: Network meta-analysis; NR: Not relevant based on inclusion criteria; TKI: Tyrosine kinase inhibitor.
Among the ten NMAs, we identified five archetypical network structures that mainly differentiated between chemotherapies that were lumped in the respective networks (Figure 2).
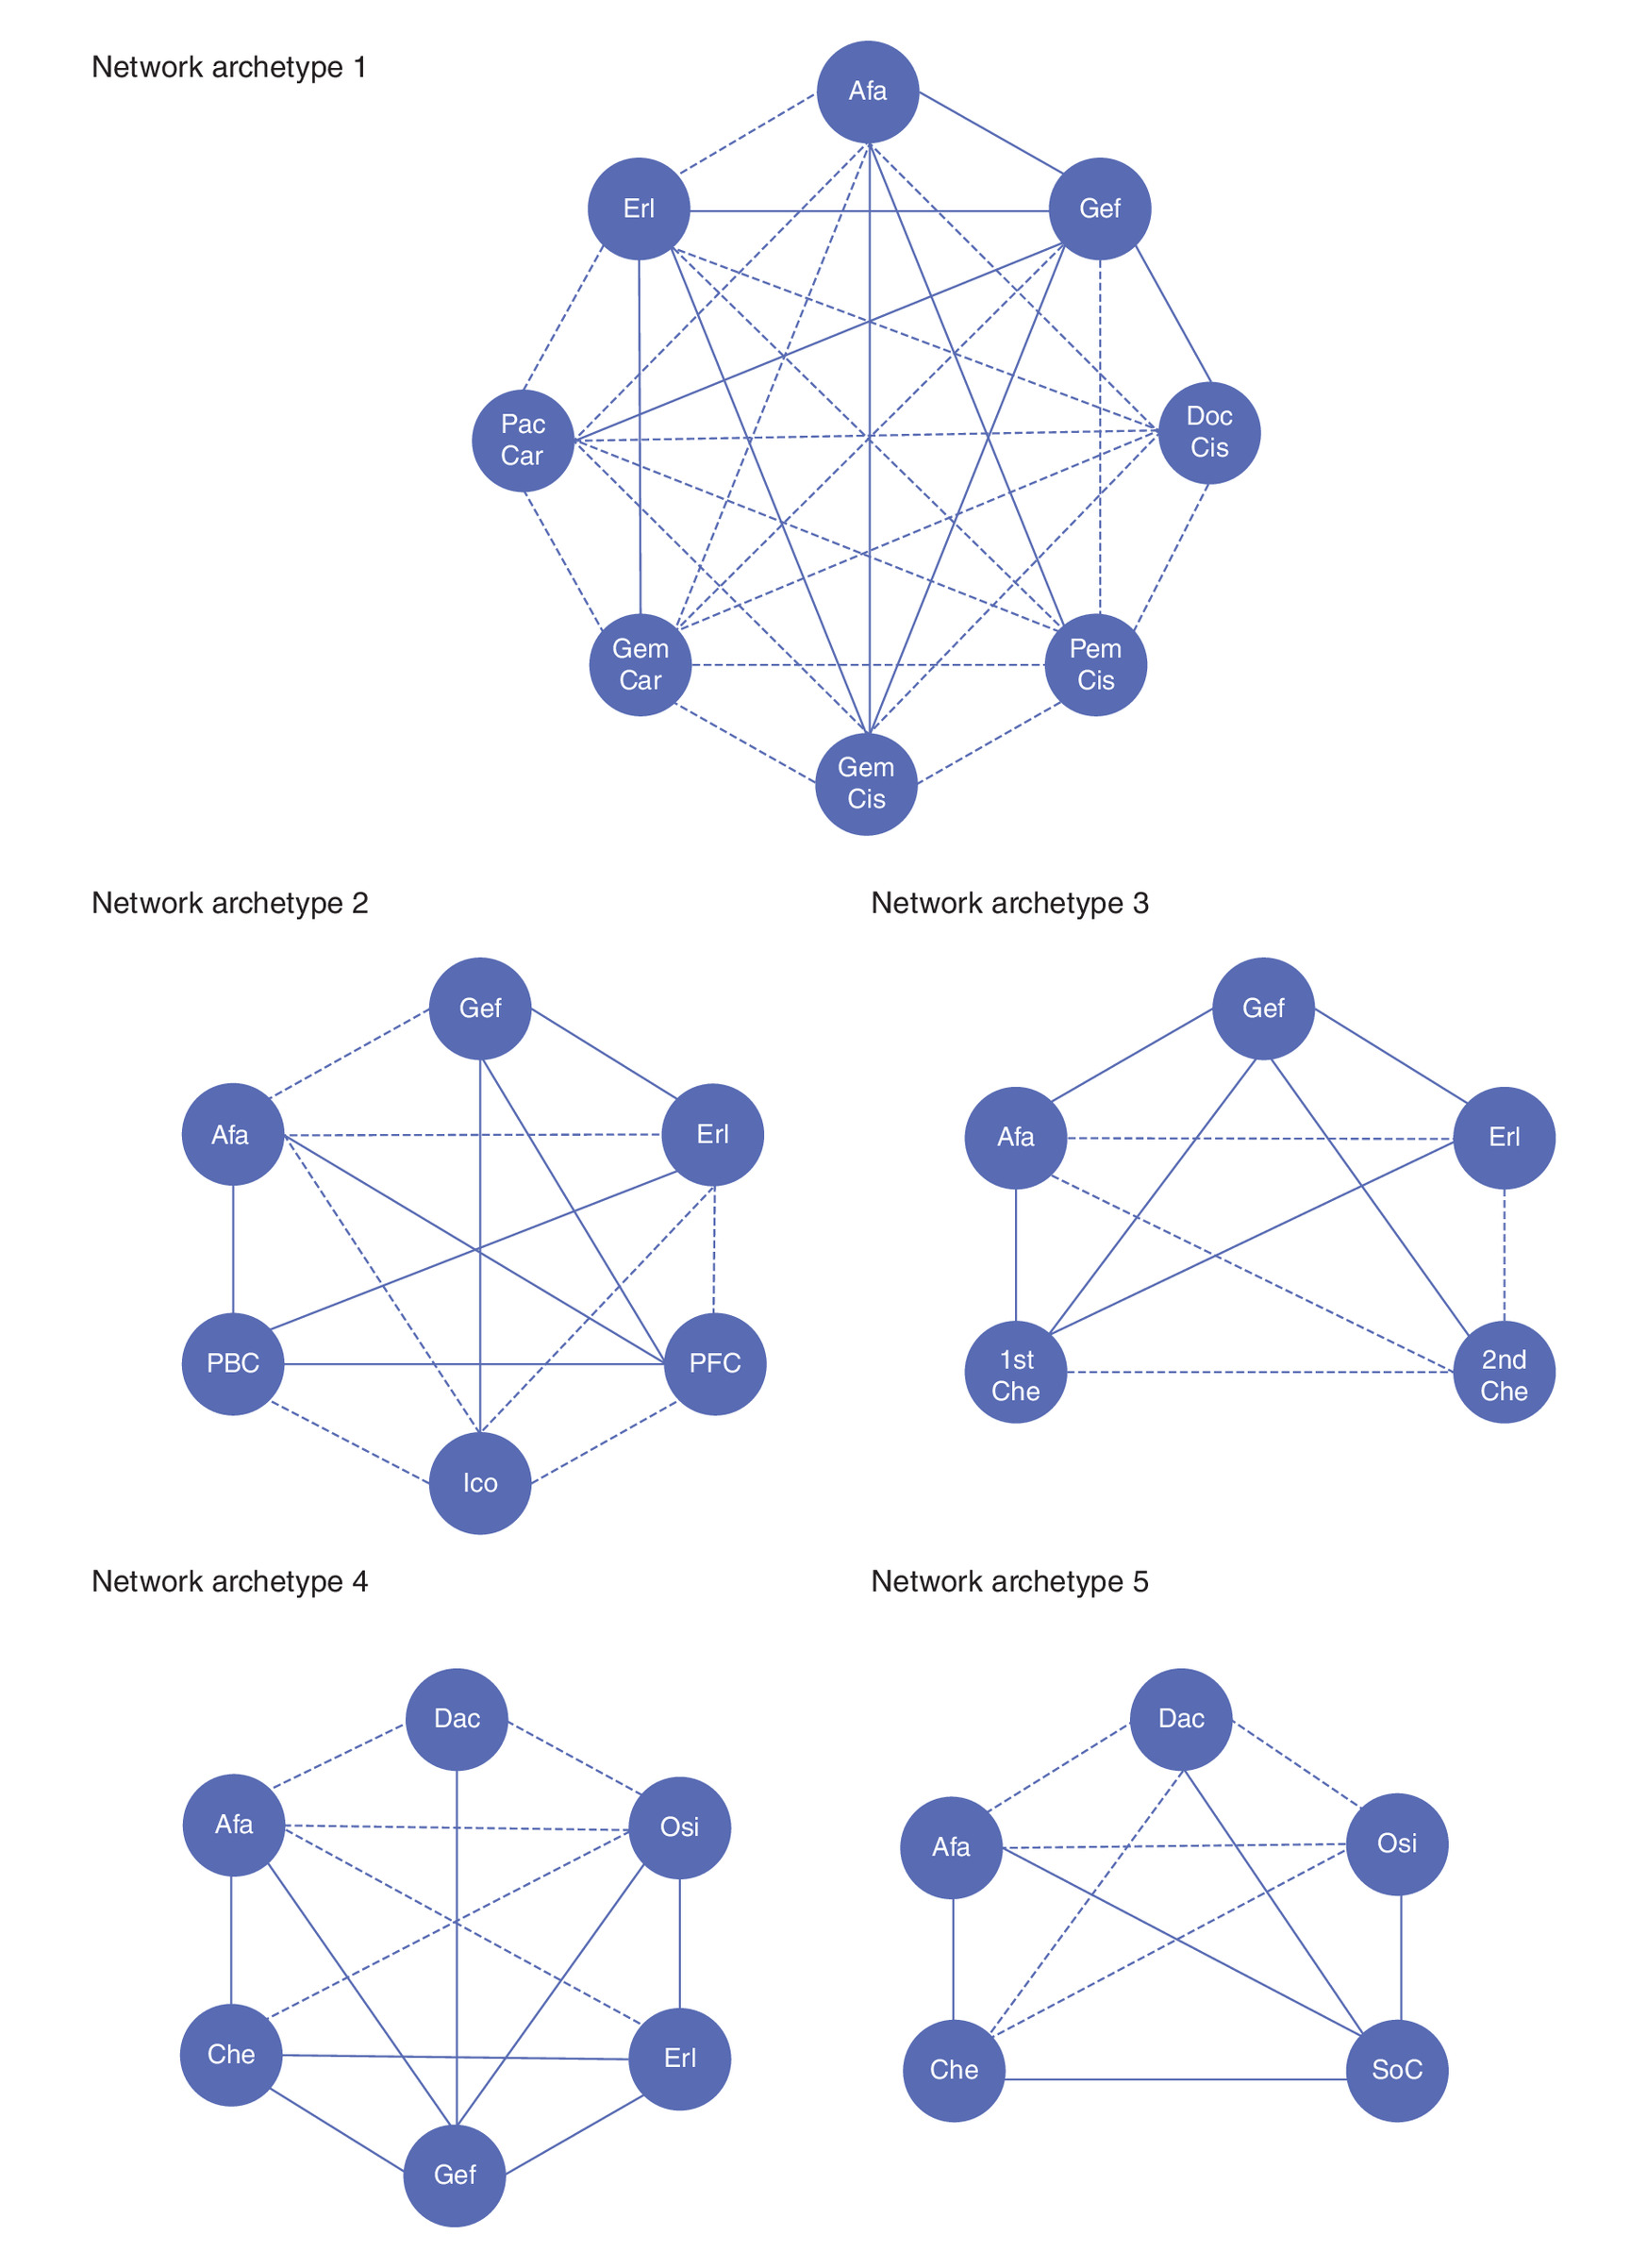
Figure 2. Most commonly occurring network architectures.
Afa: Afatinib; Car: Carboplatin; Che: Chemotherapy; Cis: Cisplatin; Dac: Dacomitinib; Doc: Docetaxel; Erl: Erlotinib; Gef: Gefitinib; Gem: Gemcitabine; Ico: Icotinib; Osi: Osimertinib; Pac: Paclitaxel; PBC: Platinum-based chemotherapy; Pem: Pemetrexed; PFC: Platinum-free chemotherapy; SoC: Standard-of-care.
Lumping is a process whereby similar treatments are put into the same group [26]; for instance, putting different chemotherapy regimens into a collective ‘chemotherapy’ arm. The decision to lump interventions should be based on clinical relevance and should be performed only if all drugs within a group have identical clinical efficacy and are considered to be clinically interchangeable.
In eight of the ten studies, different chemotherapies were lumped together, whereas the respective chemotherapies were handled as different interventions in two studies. We found that there were five main strategies for handling lumping in the studies or ‘archetypes’.
In Archetype 1, no treatments were lumped together [17,21]. In Archetype 2, chemotherapies were lumped together based on whether or not pemetrexed was included in the chemotherapy combination, in other words, one treatment arm with pemetrexed-based chemotherapy and one treatment arm with nonpemetrexed-based chemotherapy [19]. In Archetype 3, chemotherapies were lumped together based on which treatment line the respective trial was investigated in, in other words, one treatment arm for first-line chemotherapy and one treatment arm for second-line chemotherapy [22]. In Archetype 4, first-line chemotherapies were lumped together, giving one treatment arm for all chemotherapies [15,16,18,24]. In Archetype 5, both chemotherapies and first-generation TKIs (erlotinib and gefitinib) were lumped together [20].
Comparison of statistical analyses used
Seven NMAs were based on Bayesian methods using reported statistics, one used a Bayesian approach using reconstructed survival data and two used frequentist methods (Table 3). Six publications explored potential sources of heterogeneity using different methods; however, not all publications that reported a heterogeneity assessment published or discussed the results. Of the publications that reported results, all found significant heterogeneity and inconsistency. One title used a star-shaped network, whereby heterogeneity cannot be observed unless there is more than one study for at least one comparison, and the impact of inconsistency cannot be directly observed. One researcher reported that it was not possible to assess heterogeneity. Inconsistency was not uniformly assessed or reported; three publications did not disclose inconsistency statistics, and six reported significantly high to medium–high degrees of inconsistency in their networks.
| Study (year) | Applied methodology | Analysis of first-line vs second-line treatment | Analysis of mutation type | Analysis of chemotherapy | Heterogeneity analyses | Sensitivity analyses |
|---|---|---|---|---|---|---|
| Liang et al. (2014) | Bayesian indirect treatment comparison (OR and 95% CI) | Covered by sensitivity analysis | Only patients with EGFR mutation | Included studies that compared pemetrexed-based regimen with pemetrexed-free regimen in order to optimize the network | Forest plot and inconsistency statistic (I2) – results not reported | Separate networks for first line only |
| Popat et al. (2014) | Bayesian indirect treatment comparison (OR and 95% CI); random- and fixed-effects models | NA | Network included data for chemotherapy comparators from a number of studies not restricted to an EGFR mutation-positive population | Chemotherapies considered separately | Not reported | • Central vs independent review • PFS in patients with common EGFR mutations from all trials • Exclude OPTIMAL due to outlier results |
| Sheng et al. (2016) | Bayesian indirect treatment comparison (OR and 95% CI); random- and fixed-effects models | Mixed | Analysis specifically looking at mutation type (Del19 vs exon 21) | Chemotherapy lumped | Pairwise assessment Chi-square test and I2 statistic – heterogeneity reported as significant | None |
| Zhang et al. (2014) | Bayesian indirect treatment comparison (OR and 95% CI); random-effects model | NA | Analysis specifically looking at mutation type (Del19 vs exon 21) | Chemotherapy lumped | Forest plot and inconsistency statistic (I2) – results not reported | None |
| Zhang et al. (2016) | Bayesian indirect treatment comparison (OR and 95% CI); random-effects model | Two subnetworks for multiple treatment comparisons in chemo-naive patients or previously treated patients | Separate networks for all EGFR and by common mutation type | Chemotherapy lumped on assumption of no differences by mutation type | Forest plot and inconsistency statistic (I2) | None |
| Batson et al. (2017) | Bayesian framework using reconstructed survival data | NA | None – similarity assumed | Covered by sensitivity analysis | Not assessed | • Random-effects model analyzing data for the individual chemotherapy regimens • Studies in Asian patients only |
| Lin et al. (2018) | Frequentist fixed- or random-effects logistic model based on heterogeneity | NA | Subgroup analysis by mutation type | Covered by sensitivity analysis | Q total statistic – significant heterogeneity found | • Studies with median PFS >6 months in the chemotherapy arm |
| De Mello et al. (2018) | Mantel–Haenzsel random-effects model | NA | None | None | Inconsistency statistic (I2) - heterogeneity reported as significant | None |
| Holleman et al. (2019) | Bayesian indirect treatment comparison (OR and 95% CI); fixed-effects model | NA | None | Chemotherapy lumped; erlotinib and gefitinib assumed equal in FLAURA | Not assessed – the limited number of trials was stated as making assessment impossible | None |
| Franek et al. (2019) | Bayesian indirect treatment comparison (HR and 95% CI); fixed-effects model | NA | Molecularly select or stratify for patients with EGFR-positive NSCLC prior to randomization; subgroup analysis by mutation type | Multiple chemotherapy trials excluded from the network | Not reported | Inclusion of regional treatment trials |
NA: Not available; NSCLC: Non-small-cell lung cancer; OR: Odds ratio; PFS: Progression-free survival.
Five publications reported results of sensitivity analyses. Sensitivity analyses included ethnicity, the inclusion of regional trials, exclusion of outliers, exclusion of chemotherapy studies with median progression-free survival (PFS) >6 months, consideration of treatment line, central versus independent review of PFS and mutation type.
Comparison of chosen outcomes efficacy estimates & findings
The hazard ratio (HR) for PFS was used in nearly all publications, although both median PFS and the percentage of ‘patients progression-free at 1 year’ were also used to evaluate this outcome and were handled similarly in analyses conducted (Table 1). Both independently reviewed or investigator-assessed PFS were included in the networks. Assessment of objective response rate/disease control rate and overall survival (OS) were also frequently assessed. Analysis of OS was frequently assessed; however, mature OS data were not always present – some trials used 2-year survival estimates to attempt to account for this, others compared both mature and immature OS data in the same networks.
All publications consistently showed that treatment with an EGFR TKI resulted in better PFS than treatment with chemotherapy, although there were differences in the relative efficacy across the different NMAs; HRs or odds ratios versus chemotherapy for PFS were reported to range from 0.09 to 0.61 for afatinib, 0.25 to 0.5 for dacomitinib, 0.08 to 0.63 for erlotinib, 0.24 for erlotinib + bevacizumab, 0.13 to 0.63 for gefitinib and 0.18 for osimertinib (Figure 3). Similarly, relative efficacy between the TKIs, compared with afatinib – the only treatment that was not lumped and was also present in all networks – varied substantially; HRs/odds ratios ranged from 1.2 to 1.45 for dacomitinib, 0.6 to 1.3 for erlotinib, 4.08 for erlotinib + bevacizumab, 0.6 to 1.35 for gefitinib, 0.86 for icotinib and 1.35 to 2.07 for osimertinib (Figure 4). Furthermore, the probability rankings were in the range of 0–88% for afatinib, 1–78% for dacomitinib, 0–75% for erlotinib, 0–35% for gefitinib and 91–99% for osimertinib (Table 4).
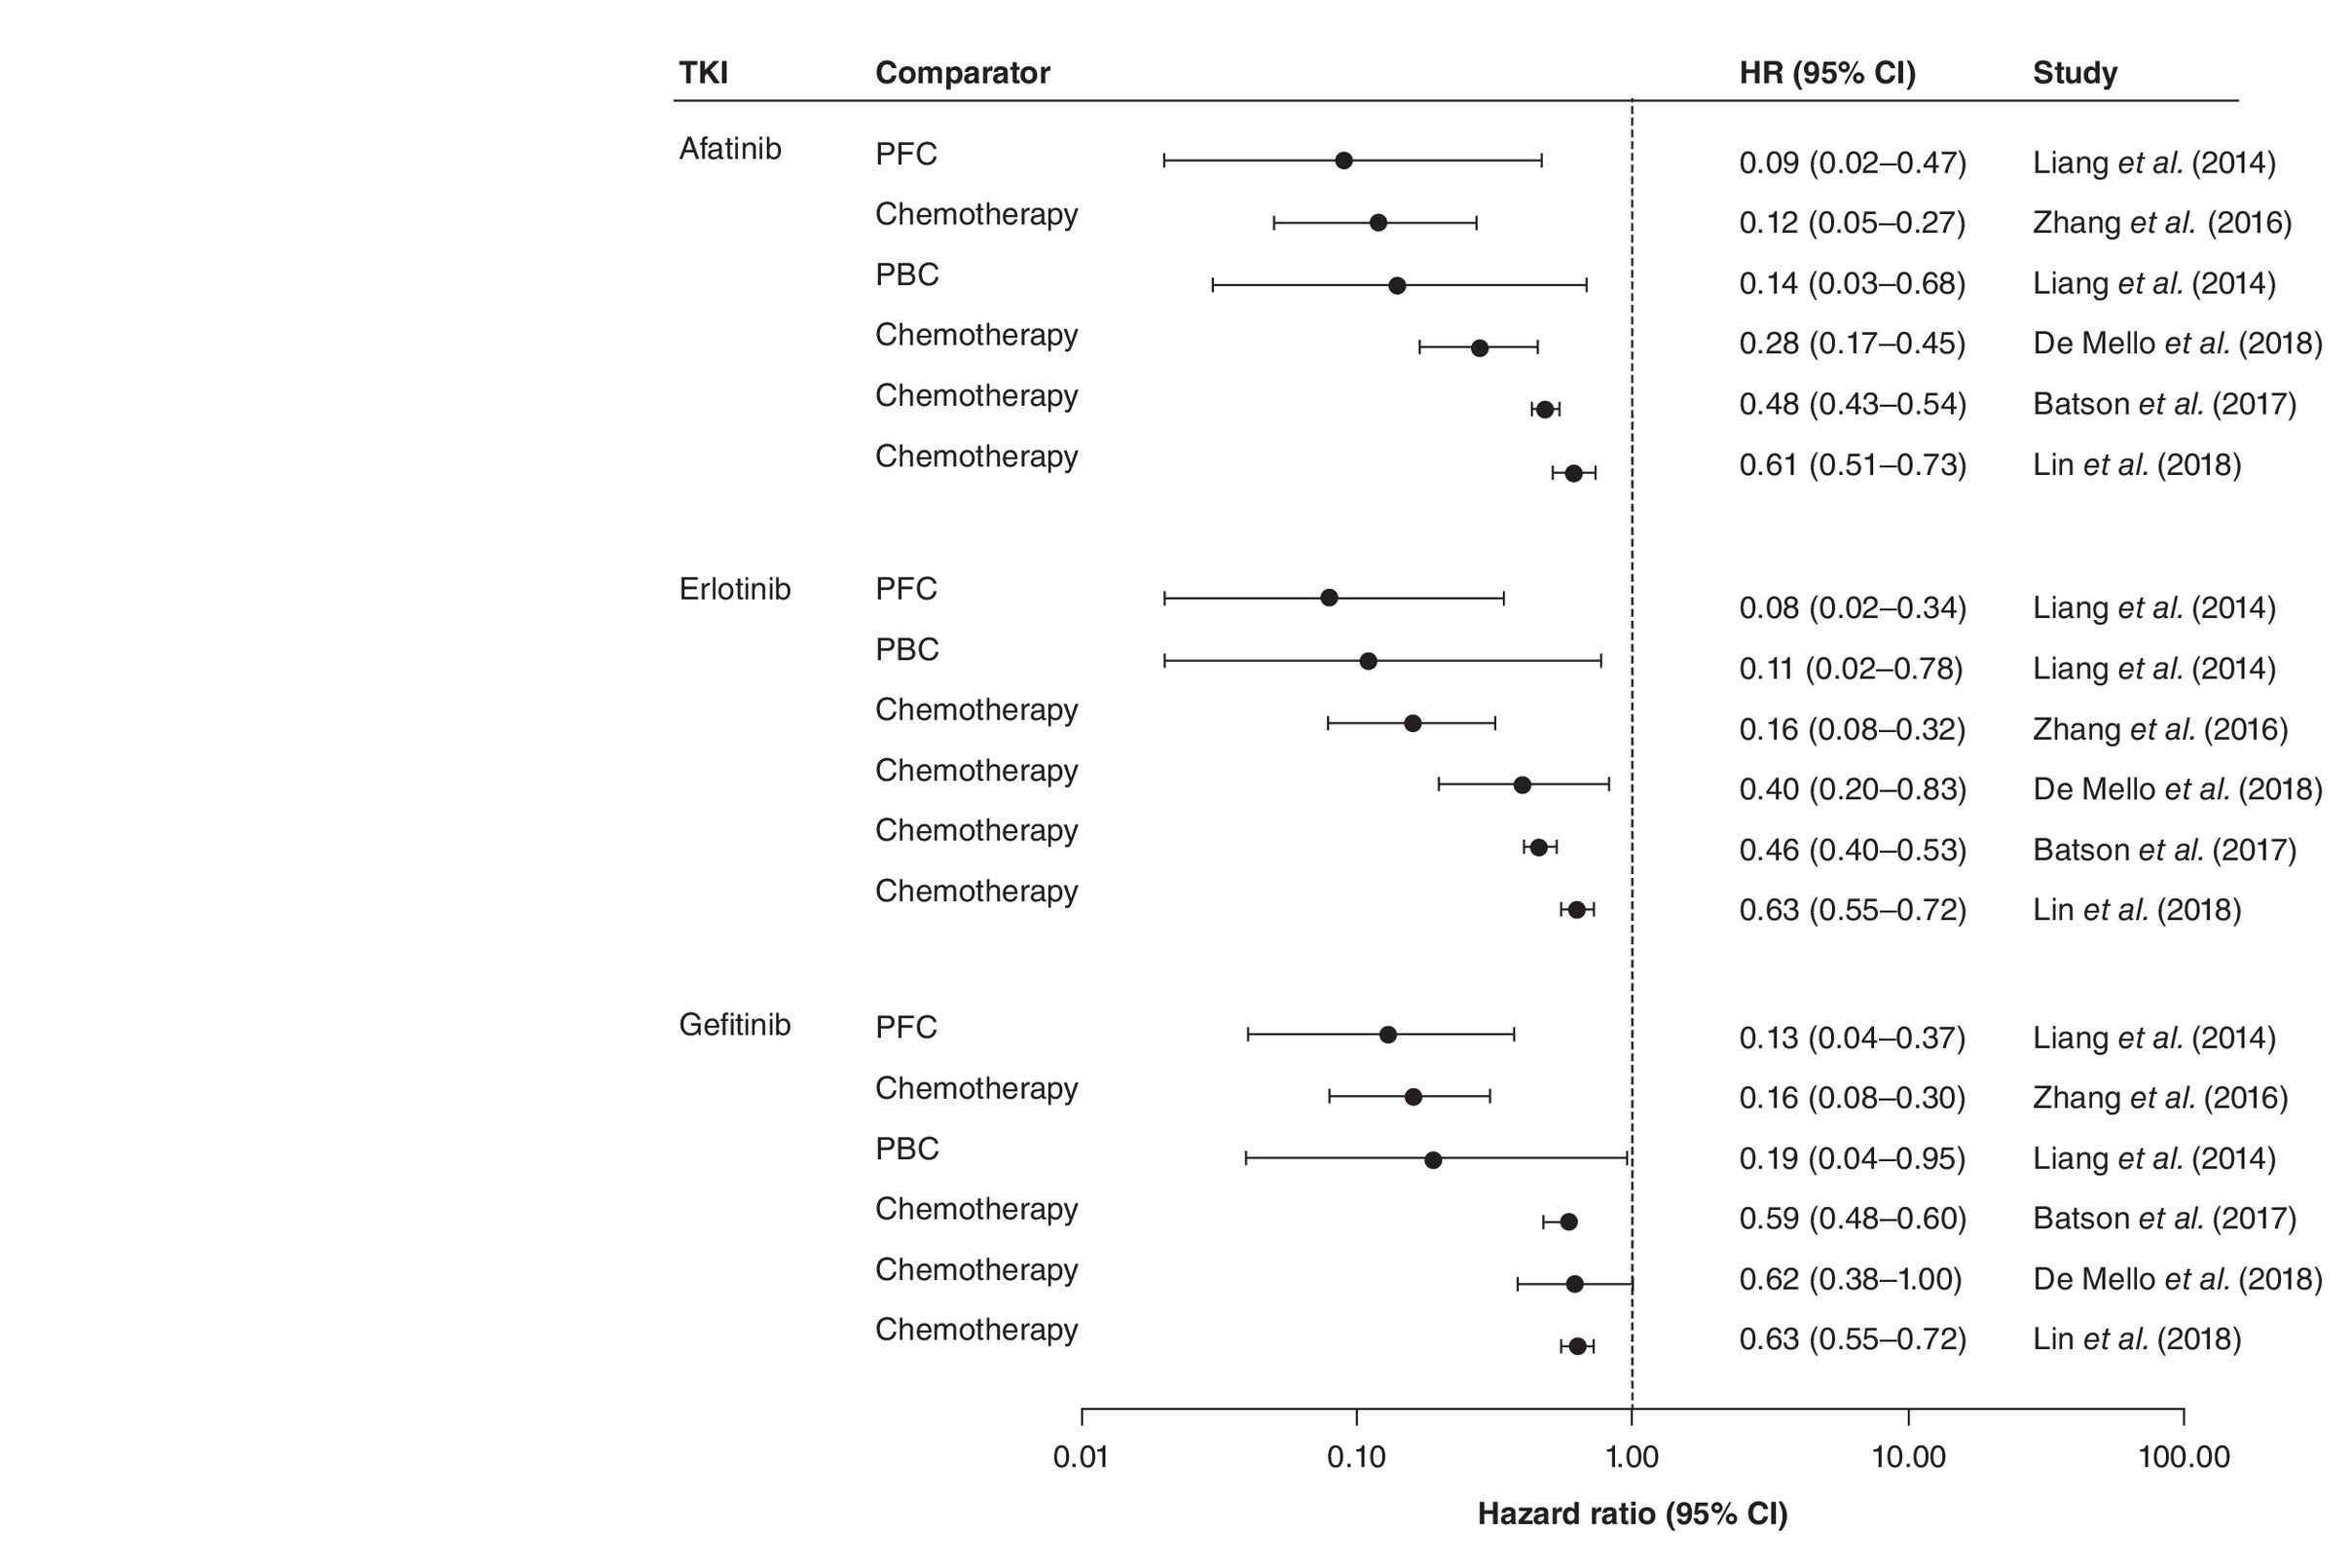
Figure 3. Hazard ratios for progression-free survival of tyrosine kinase inhibitors versus chemotherapy.
HR: Hazard ratio; PBC: Platinum-based chemotherapy; PFC: Platinum-free chemotherapy; TKI: Tyrosine kinase inhibitor.
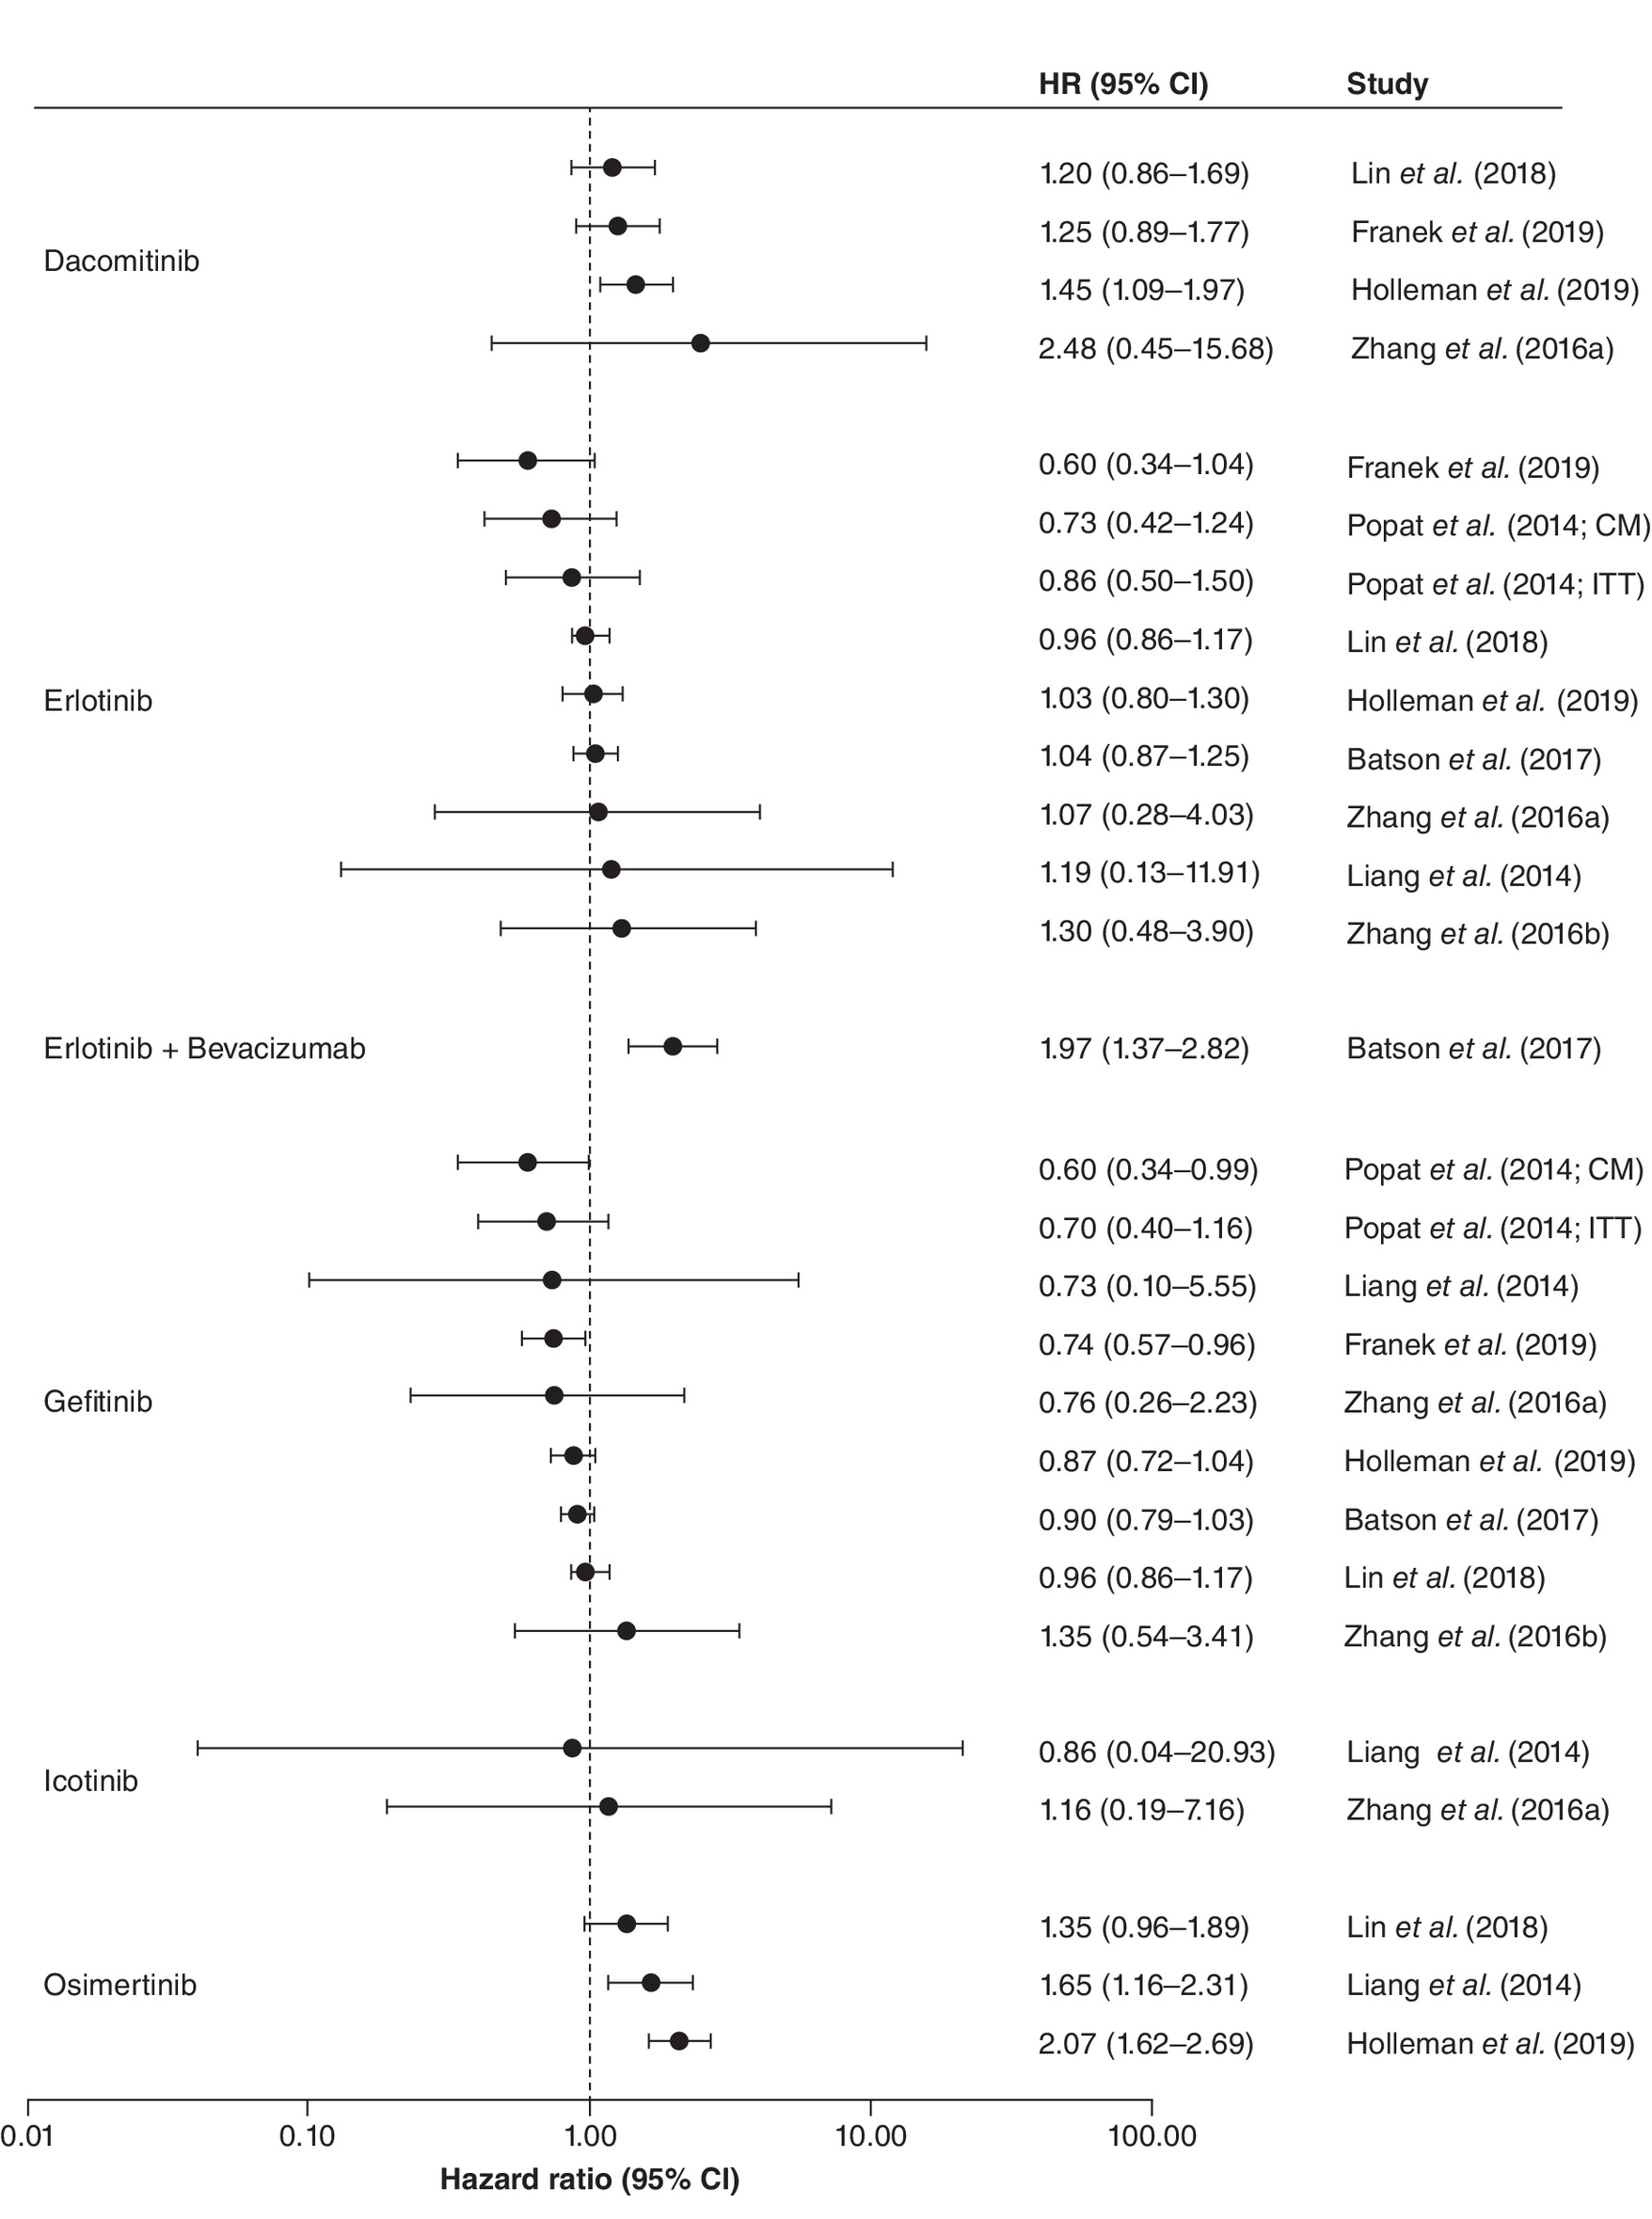
Figure 4. Hazard ratios for progression-free survival of afatinib versus other tyrosine kinase inhibitors.
CM: Common mutations; HR: Hazard ratio; ITT: Intention to treat.
| Study (year) | Afatinib | Erlotinib | Gefitinib | Icotinib | Osimertinib | Dacomitinib | |
|---|---|---|---|---|---|---|---|
| Liang et al. (2014) | All treatment lines | 27% | 38% | 6% | 29% | ||
| First-line | 29% | 61% | 10% | NA | |||
| Popat et al. (2014) | ITT | 70% | 27% | 30% | |||
| Common mutations | 88% | 10% | 1% | ||||
| Zhang et al. (2016) | All EGFR | 59% | 27% | 14% | |||
| Batson et al. (2017) (SUCRA) | 50% | 75% | 25% | ||||
| Lin et al. (2018) | 46% | 35% | 35% | 91% | 78% | ||
| Holleman et al. (2019) | 0% | 0% | 0% | 99% | 1% | ||
| Franek et al. (2019) | 2% | 1% | 0% | 95% | 5% |
ITT: Intention to treat; NA: Not applicable.
Only four publications included tolerability in the NMA assessments. The majority stated that inconsistent reporting of these outcomes between clinical trials would make such comparisons unreliable.
Network reconstruction
In network Archetype 1 (no lumping), tau2 = 0.0184; tau = 0.1358; I2 = 46.1% (0.0; 71.1%), indicating low heterogeneity. Total Q was significant at 24.138473, p = 0.03; heterogeneity (within designs) was not significant at 8.14, p = 0.32, whereas significant inconsistency (between designs) was detected at Q = 16, p = 0.014. The p-value was 0.99 for afatinib, 0.79 for erlotinib and 0.74 for gefitinib.
In network Archetype 2 (chemotherapy regimens were lumped based on pemetrexed), tau2 = 0.0921; tau = 0.3035; I2 = 70.6% (25.2; 88.4%), indicating moderate heterogeneity. Total Q was 13.6, p = 0.008; within-design heterogeneity was significant (13.6, p = 0.009), whereas inconsistency (between-design heterogeneity) was close to zero, p = not available. The p-value was 1.00 for erlotinib, 0.8 for afatinib and 0.54 for gefitinib.
In network Archetype 3 (chemotherapy lumped according to treatment line), tau2 = 0.1220; tau = 0.3493; I2 = 77% (57.6; 87.5%), indicating high heterogeneity. Heterogeneity/inconsistency total Q was 39.08, p < 0.0001; within-design heterogeneity was significantly present, Q = 26.55, p = 0.0002, whereas inconsistency (between-design heterogeneity) was significant, Q = 12.53, p = 0.0058. The p-value was 0.89 for erlotinib, 0.81 for afatinib and 0.52 for gefitinib.
In network Archetype 4 (first-line chemotherapies were lumped together), tau2 = 0.0972; tau = 0.3118; I2 = 74.6% (50.8; 86.9%), indicating moderate heterogeneity. Total Q was significant at Q = 31.47, p = 0.0001; within-design heterogeneity was significant, Q = 26.55, p = 0.0002, whereas between-design heterogeneity (inconsistency) was not significant, Q = 4.92, p = 0.0855. The p-value was 0.90 for erlotinib, 0.73 for afatinib and 0.36 for gefitinib.
In network Archetype 5 (both first-generation TKI and chemotherapies are lumped), tau2 = 0.1442; tau = 0.3798; I2 = 81.6% (63.2; 90.9%), indicating high heterogeneity. Total Q was 32.70, p < 0.0001; within-design heterogeneity was significant, Q = 25.02, p = 0.0001, and between-design heterogeneity was also significant, Q = 7.68, p = 0.0056. The p-value was 0.87 for afatinib and 0.61 for first-generation TKI (afatinib and erlotinib combined).
NMA evaluation based on ISPOR
A full summary of the ISPOR evaluation is provided in the Supplementary Material.
It should be noted that three additional NMAs have been published since our original searches were conducted [27–29]. However, we do not believe that the inclusion of these additional publications would substantially alter our findings or our recommendations for the conduct of future trials in this area.
Discussion
Our structured review revealed that authors apply different strategies when performing NMAs in first-line EGFR mutation-positive NSCLC. These differences are important to consider given their influence on results and the potential to impact healthcare decision-making. Although the broad evidence base of RCTs in this therapy area makes evaluation of the relative effectiveness of EGFR TKIs using NMAs possible, our review has demonstrated that the clinical and statistical complexity of such analyses makes it challenging to achieve methodological consistency. The post hoc analysis of heterogeneity and inconsistency in the reconstructed archetype networks revealed that substantial significant heterogeneity and inconsistency were present in most networks and were dependent on network construction. Our review highlights two key methodological issues that we believe explain the differences in the findings of these analyses and should be given consideration in future research, as well as several additional considerations.
First, the inclusion of trials proved to be the most influential factor explaining fluctuations in the observed magnitude of treatment effects and rankings. In our review, we found that this was inconsistently applied among the publications. Even though valid causes can explain this difference – for instance, the increasing number of trials performed over time and the removal of trials not contributing to the network – these reasons alone do not fully explain the observed variance. Examples of noticeable differences between the studies include: the combination of first- and later-line patient populations given the accepted differences in outcome in these populations; the inclusion of retrospective studies; and the inclusion of trials with molecularly selected patients. Some studies restricted trials performed on an EGFR mutation-positive population, others to type of EGFR mutations, whereas one trial allowed a broader patient population to overcome challenges associated with lumping (see later). If molecular biomarkers are heterogeneously dispersed across the trials, an imbalance in effect modifiers across the network may be present. Failing to appropriately adjust for biomarker status across the trials may bias the network. Although some NMAs did use sensitivity analyses to evaluate the impact of trial inclusion, we believe that this is an area that could be explored further. In situations where the inclusion of one or more trials is not a clear-cut decision, we encourage the use of sensitivity analyses (with clearly stated rationale) by the exclusion of such trials to evaluate the impact of methodological decisions on NMA outcome.
Second, several researchers lumped treatment arms together to increase the statistical power of the network or to overcome network disconnection. Four out of the five identified network archetypes applied different levels of lumping, ranging from: no lumping; lumping all chemotherapies together; lumping pemetrexed- and nonpemetrexed-based regimens together; lumping first- and second-line chemotherapies together; and lumping chemotherapies and first-generation TKIs (gefitinib and erlotinib) together. We identified this to be a significant source of discordance in the findings. It should be noted that only networks that did not apply any lumping reported low heterogeneity; as such, lumping could explain up to 50% of unexplainable network variance. Although lumping treatments can provide a sound strategy when facing sparsity, as this may reduce the number of connections in a network, it requires strict assumptions of homogeneity that may be difficult to control using statistical methods [5]. Furthermore, specialized statistical methods that account for treatment class effects should be used; none of the authors identified in this review reported having used such models. It should also be noted that studies should generally not be combined, as is the case when lumping treatments, when the therapeutic agents: have a different mechanism of action; include different patient subtypes; or if the studies are conducted in a different setting [30]. The lumping of chemotherapies may be particularly problematic, especially where there are known differences in efficacy between agents [31], as this has the potential for networks that lump chemotherapies being at a high risk of bias. As such, the degree of lumping of therapies should be a key consideration when interpreting the results of analyses and should be avoided where possible.
Although a primary assumption for the conduct of NMAs is that clinical studies are sufficiently homogeneous, clinically and methodologically, to be quantitatively combined, the statistical challenges of addressing heterogeneity and inconsistency in these analyses make it especially important to consider these factors when constructing networks. A detailed discussion of differences in the design of studies in this area has been conducted previously [32] and is beyond the scope of our review. However, key factors that should be considered and are worth highlighting include use of investigator versus independent assessment of PFS, mutation type and important clinical characteristics that are known to impact on the outcome. Our review highlights that these factors are occasionally, but by no means universally, considered. We consider the use of independent-assessed PFS in NMAs to be an appropriate bias-minimizing approach, especially when including open-label studies in networks. This recommendation is based on evidence that open-label studies are at a higher risk of suffering from evaluation bias caused by investigator assessment than double-blinded trials [33,34]. Based on our review of the NMAs, only two authors reported that independent- and investigator-reported PFS were analyzed separately and assessed using sensitivity analyses [17,21]. Mutation type is also an essential consideration as the inclusion of patients with common EGFR mutations only (Del19/L858R) results in a more homogeneous patient population than studies that included patients with both common and uncommon mutations, as outcomes are known to be impacted by mutation type. Only one NMA considered the influence of uncommon mutations on outcome [21]. Finally, the presence of brain metastases is an important clinical factor that is known to impact treatment outcome [35] and, as such, consideration should be given to whether trials included in NMAs enrolled these patients. We identified only one paper that discussed heterogeneity in terms of patients selected for brain metastasis or metastasis in the CNS [17].
Several approaches have been suggested for evaluating incoherence in NMAs [36,37] and have been described elsewhere [38]. It should, however, be noted that tests for incoherence have low power and, therefore, may fail to detect incoherence as statistically significant even when it is present [39,40]. Conclusions should be drawn not just from consideration of statistical significance but by interpreting the range of values included in confidence intervals of the incoherence factors [38].
Although our research was focused on the treatment of EGFR mutation-positive NSCLC, personalized medicine is rapidly becoming a reality for many patients as cancer treatment advances and more targeted treatments become available. As such, comparative effectiveness research needs to carefully consider the implications of these factors in the design of comparative analyses in order to maintain the validity of findings. Areas of future research include the development of robust methods to summarize and synthesize evidence across treatment settings to help determine the optimal sequence of treatments rather than an isolated intervention. Although the discovery of the EGFR mutation has advanced the expected outcomes for patients, the treatment of NSCLC remains a complex area, with many factors potentially influencing the relative effectiveness of treatments, including the presence of brain metastases and tolerability profile; we did not individually evaluate these factors in this review, but they should be considered when interpreting findings. As more treatment options become available for patients with EGFR mutation-positive NSCLC, the ability to evaluate evidence from different trials becomes increasingly important. Combination approaches are increasingly being used in this population. As such, future analyses will also need to include methods for combining and controlling for the inclusion of monotherapy and combination trials.
Conclusion
In conclusion, we identified several issues with the published NMAs and advise caution when using NMAs to inform decision-making for patients with EGFR mutation-positive NSCLC. Although future analyses may reveal additional considerations for the conduct of these types of cross-trial comparisons, our review highlights several important considerations for future comparative effectiveness research.
•
Network meta-analysis (NMA) has become a commonly used methodology in oncology for comparing the benefits of agents that have not been directly compared.
•
We identified ten published NMAs, for first-line treatment of EGFR mutation-positive non-small-cell lung cancer, using five archetypical network structures, that showed substantial variability in the number of trials included in each NMA and in the relative treatment efficacy of the tyrosine kinase inhibitors.
•
Our review highlights several important considerations for future comparative effectiveness research.
•
Inclusion of trials proved to be the most influential factor explaining fluctuations in the observed magnitude of treatment effects and rankings and should be carefully considered and clinically justified.
•
Lumped treatment arms together to increase the statistical power of the network or to overcome network disconnection requires strict assumptions of homogeneity that may be difficult to control using statistical methods, and as such, needs careful consideration.
Author contributions
All authors were responsible for study conception and design. C Samuelsen conducted data analysis and all authors contributed to drafting and revision of the manuscript.
Acknowledgments
The authors would like to thank N Hawkins, University of Glasgow, for his review and input of the manuscript.
Financial & competing interests disclosure
C Samuelsen is a former employee of Boehringer Ingelheim International GmbH, Germany, and the owner of Outcomes Analytica AS. He has received funding from Boehringer Ingelheim. I Griebsch is an employee of Boehringer Ingelheim International GmbH, Germany, and is the author of one of the NMAs reviewed in this article. The authors have no other relevant affiliations or financial involvement with any organization or entity with a financial interest in or financial conflict with the subject matter or materials discussed in the manuscript apart from those disclosed.
The authors would like to thank S Patel, Origin Health Ltd, for editorial assistance, funded by Boehringer Ingelheim International GmbH.
Open access
This work is licensed under the Attribution-NonCommercial-NoDerivatives 4.0 Unported License. To view a copy of this license, visit http://creativecommons.org/licenses/by-nc-nd/4.0/
Supplementary Material
File (suppl_file.docx)
- Download
- 13.31 KB
References
Papers of special note have been highlighted as: • of interest; •• of considerable interest
1.
Planchard D, Popat S, Kerr K et al. Metastatic non-small-cell lung cancer: ESMO clinical practice guidelines for diagnosis, treatment and follow-up. Ann. Oncol. 29(Suppl. 4), iv192–iv237 (2018).
2.
National Comprehensive Cancer Network. Non-small-cell lung cancer. Version 1–2019 (2020). www.nccn.org/professionals/physician_gls/default.aspx
3.
Park K, Tan EH, O'Byrne K et al. Afatinib versus gefitinib as first-line treatment of patients with EGFR mutation-positive non-small-cell lung cancer (LUX-Lung 7): a Phase IIB, open-label, randomised controlled trial. Lancet Oncol. 17(5), 577–589 (2016).
4.
Yang JJ, Zhou Q, Yan HH et al. A Phase III randomised controlled trial of erlotinib vs gefitinib in advanced non-small-cell lung cancer with EGFR mutations. Br. J. Cancer 116(5), 568–574 (2017).
5.
Dias S. Network Meta-Analysis for Decision Making (Statistics in Practice). John Wiley & Sons Ltd, NJ, USA (2018).
•• Provides key background on conducting network meta-analyses.
6.
Jansen JP, Trikalinos T, Cappelleri JC et al. Indirect treatment comparison/network meta-analysis study questionnaire to assess relevance and credibility to inform healthcare decision making: an ISPOR-AMCP-NPC Good Practice Task Force report. Value Health 17(2), 157–173 (2014).
•• Key guidance on assessing the quality of network meta-analysis.
7.
Jadad AR, Moore RA, Carroll D et al. Assessing the quality of reports of randomized clinical trials: is blinding necessary? Control. Clin. Trials 17(1), 1–12 (1996).
8.
Higgins JPT, Altman DG, Gøtzsche PC et al. The Cochrane Collaboration’s tool for assessing risk of bias in randomised trials. BMJ 343, d5928 (2011).
9.
National Institute for Health and Clinical Excellence. Single technology appraisal (STA): specification for manufacturer/sponsor submission of evidence (2009). www.nice.org.uk/Media/Default/About/what-we-do/NICE-guidance/NICE-technology-appraisals/Guide-to-the-single-technology-appraisal-process.pdf.
10.
Rücker G. Netmeta: network meta-analysis using frequentist methods. R package. Version 0.9–0. (2016).
11.
Higgins J, Thompson S. Quantifying heterogeneity in a meta-analysis. Stat. Med. 21(11), 1539–1558 (2002).
12.
Higgins JP, Thompson SG, Deeks JJ, Altman DG. Measuring inconsistency in meta-analyses. BMJ 327(7414), 557–560 (2003).
13.
Team RC. R: a language and environment for statistical computing. (2013).
14.
Rücker G, Schwarzer G, Krahn U, König J, Schwarzer MG. Package ‘netmeta’: network meta-analysis using frequentist methods (version 0.7-0). (2015).
15.
Batson S, Mitchell SA, Windisch R, Damonte E, Munk VC, Reguart N. Tyrosine kinase inhibitor combination therapy in first-line treatment of non-small-cell lung cancer: systematic review and network meta-analysis. Onco. Targets Ther. 10, 2473–2482 (2017).
16.
De Mello RA, Escriu C, Castelo-Branco P et al. Comparative outcome assessment of epidermal growth factor receptor tyrosine kinase inhibitors for the treatment of advanced non-small-cell lung cancer: a network meta-analysis. Oncotarget 9(14), 11805–11815 (2018).
17.
Franek J, Cappelleri JC, Larkin-Kaiser KA, Wilner KD, Sandin R. Systematic review and network meta-analysis of first-line therapy for advanced EGFR-positive non-small-cell lung cancer. Future Oncol. 15(24), 2857–2871 (2019).
18.
Holleman MS, van Tinteren H, Groen HJ, Al MJ, Uyl-de Groot CA. First-line tyrosine kinase inhibitors in EGFR mutation-positive non-small-cell lung cancer: a network meta-analysis. Onco. Targets Ther. 12, 1413–1421 (2019).
19.
Liang W, Wu X, Fang W et al. Network meta-analysis of erlotinib, gefitinib, afatinib and icotinib in patients with advanced non-small-cell lung cancer harboring EGFR mutations. PLoS ONE 9(2), e85245 (2014).
20.
Lin JZ, Ma SK, Wu SX, Yu SH, Li XY. A network meta-analysis of non-small-cell lung cancer patients with an activating EGFR mutation: should osimertinib be the first-line treatment? Medicine (Baltimore) 97(30), e11569 (2018).
21.
Popat S, Mok T, Yang JC et al. Afatinib in the treatment of EGFR mutation-positive NSCLC -- a network meta-analysis. Lung Cancer 85(2), 230–238 (2014).
22.
Zhang Y, Sheng J, Yang Y et al. Optimized selection of three major EGFR-TKIs in advanced EGFR-positive non-small-cell lung cancer: a network meta-analysis. Oncotarget 7(15), 20093–20108 (2016).
23.
Zhang Y, Zhang Z, Huang X et al. Therapeutic efficacy comparison of 5 major EGFR-TKIs in advanced EGFR-positive non-small-cell lung cancer: a network meta-analysis based on head-to-head trials. Clin. Lung Cancer 18(5), e333–e340 (2017).
24.
Sheng M, Wang F, Zhao Y et al. Comparison of clinical outcomes of patients with non-small-cell lung cancer harbouring epidermal growth factor receptor exon 19 or exon 21 mutations after tyrosine kinase inhibitors treatment: a meta-analysis. Eur. J. Clin. Pharmacol. 72(1), 1–11 (2016).
25.
Zhang Y, Sheng J, Kang S et al. Patients with exon 19 deletion were associated with longer progression-free survival compared to those with L858R mutation after first-line EGFR-TKIs for advanced non-small-cell lung cancer: a meta-analysis. PLoS ONE 9(9), e107161 (2014).
26.
Xing A, Lin L. Effects of treatment classifications in network meta-analysis. Res. Methods Med. Health Sci. (2020) (Epub ahead of print).
27.
Li XY, Lin JZ, Yu SH. Front-line therapy in advanced non-small-cell lung cancer with sensitive epidermal growth factor receptor mutations: a network meta-analysis. Clin. Ther. 42(2), 338–350.e4 (2020).
28.
Zhang Z, Zeng K, Zhao S et al. Pemetrexed/carboplatin plus gefitinib as a first-line treatment for EGFR-mutant advanced non-small-cell lung cancer: a Bayesian network meta-analysis. Ther. Adv. Med. Oncol. 11, (2019) (Epub ahead of print).
29.
Zhao Y, Liu J, Cai X et al. Efficacy and safety of first-line treatments for patients with advanced epidermal growth factor receptor mutated, non-small-cell lung cancer: systematic review and network meta-analysis. BMJ 367, l5460 (2019).
30.
ter Veer E, van Oijen MGH, van Laarhoven HWM. The use of (network) meta-analysis in clinical oncology. Front Oncol. 9, 822 (2019).
• Overview of important considerations for oncology trial analysis.
31.
Scagliotti GV, Parikh P, von Pawel J et al. Phase III study comparing cisplatin plus gemcitabine with cisplatin plus pemetrexed in chemotherapy-naive patients with advanced-stage non-small-cell lung cancer. J. Clin. Oncol. 26(21), 3543–3551 (2008).
32.
Sebastian M, Schmittel A, Reck M. First-line treatment of EGFR-mutated nonsmall cell lung cancer: critical review on study methodology. Eur. Respir. Rev. 23(131), 92–105 (2014).
33.
Amit O, Mannino F, Stone AM et al. Blinded independent central review of progression in cancer clinical trials: results from a meta-analysis. Eur. J. Cancer 47(12), 1772–1778 (2011).
34.
Stone AM, Bushnell W, Denne J et al. Research outcomes and recommendations for the assessment of progression in cancer clinical trials from a PhRMA working group. Eur. J. Cancer 47(12), 1763–1771 (2011).
35.
Hochmair M. Medical treatment options for patients with epidermal growth factor receptor mutation-positive non-small-cell lung cancer suffering from brain metastases and/or leptomeningeal disease. Target Oncol. 13(3), 269–285 (2018).
36.
Donegan S, Williamson P, D'Alessandro U, Tudur Smith C. Assessing key assumptions of network meta-analysis: a review of methods. Res. Synth. Methods 4(4), 291–323 (2013).
37.
Veroniki AA, Vasiliadis HS, Higgins JP, Salanti G. Evaluation of inconsistency in networks of interventions. Int. J. Epidemiol. 42(1), 332–345 (2013).
38.
Chaimani A, Caldwell DM, Li T, Higgins JPT, Salanti G. Chapter 11: undertaking network meta-analyses. In: Cochrane Handbook for Systematic Reviews of Interventions. Higgins JPT, Thomas J, Chandler J, Cumpston M, Page MJ, Welch VA. (Eds). John Wiley & Sons, UK (2019).
39.
Veroniki AA, Mavridis D, Higgins JP, Salanti G. Characteristics of a loop of evidence that affect detection and estimation of inconsistency: a simulation study. BMC Med. Res. Methodol. 14(1), 106 (2014).
40.
Song F, Clark A, Bachmann MO, Maas J. Simulation evaluation of statistical properties of methods for indirect and mixed treatment comparisons. BMC Med. Res. Methodol. 12(1), 138 (2012).
Information & Authors
Information
Published In
Pages: 1179 - 1194
PubMed: 33112179
Copyright
© 2020 Boehringer Ingelheim International GmbH. This work is licensed under the Attribution-NonCommercial-NoDerivatives 4.0 Unported License
History
Received: 2 September 2020
Accepted: 25 September 2020
Published online: 28 October 2020
Keywords:
Topics
Authors
Metrics & Citations
Metrics
Article Usage
Article usage data only available from February 2023. Historical article usage data, showing the number of article downloads, is available upon request.
Citations
How to Cite
Network meta-analyses for EGFR mutation-positive non-small-cell lung cancer: systematic review and overview of methods and shortcomings. (2020) Journal of Comparative Effectiveness Research. DOI: 10.2217/cer-2020-0189
Export citation
Select the citation format you wish to export for this article or chapter.