Social determinants of health affect unplanned readmissions following acute myocardial infarction
Publication: Journal of Comparative Effectiveness Research
Abstract
Background: Low socioeconomic status predicts inferior clinical outcomes in many patient populations. The effects of patient insurance status and hospital safety-net status on readmission rates following acute myocardial infarction are unclear. Materials & methods: A retrospective review of State Inpatient Databases for New York, California, Florida and Maryland, 2007–2014. Results: A total of 1,055,162 patients were included. Medicaid status was associated with 37.7 and 44.0% increases in risk-adjusted readmission odds at 30 and 90 days (p < 0.0001). Uninsured status was associated with reduced odds of readmission at both time points. High-burden safety-net status was associated with 9.6 and 9.5% increased odds of readmission at 30 and 90 days (p < 0.0003). Conclusion: Insurance status and hospital safety-net burden affect readmission odds following acute myocardial infarction.
Acute myocardial infarction (AMI) is a leading cause of morbidity among American adults, accounting for more than 194,000 hospital admissions each year in the USA [1]. Up to 14% of AMI patients undergo unplanned readmission within 30 days [2]. These recurrent hospitalizations indicate significant patient morbidity and possibly unmet patient care needs, and increase cumulative hospital costs for AMI care by as much as 50% [3]. Indeed, AMI is one of only six conditions or procedures specifically targeted by the Centers for Medicare and Medicaid Services Hospital Readmissions Reduction Program in an effort to improve healthcare quality for all Americans [4].
In addition to clinical risk factors such as diabetes, congestive heart failure and chronic kidney disease [2], low socioeconomic status (SES) has emerged as predictive of adverse clinical outcomes for patients with cardiovascular disease [5]. The clinical significance of SES has also been demonstrated in numerous other medical and surgical patient groups [6,7]. Among AMI patients, lower household income and education level have been associated with increased rates of unplanned readmission [8–10] and inpatient mortality [8]. Black race/ethnicity, as a proxy for social disadvantage, is also associated with decreased likelihood of revascularization [11] and increased odds of unplanned readmissions for patients with coronary artery disease [12], among other markers of inferior cardiac care [13–15]. Medicaid and uninsured status, as indicators of low SES, have also been linked to decreased rates of revascularization during AMI hospitalizations [5,16,17].
Safety-net hospitals (SNH) provide care to patients regardless of their ability to pay, and treat elevated percentages of uninsured and Medicaid patients [18]. Due to the increased burden of underinsured patients in their care, these institutions are often referred to as ‘high-burden hospitals’ (HBH) [19]. Although insurance status has been shown to predict inferior outcomes in many patient populations [20], the literature is mixed regarding the independent effects of hospital burden status on clinical outcomes and quality of care metrics [21–23]. Data are particularly limited regarding the impact of hospital safety-net status on readmission rates following AMI.
The goal of this study was to evaluate the independent effects of patient insurance status, among other social determinants of health, and hospital burden status on readmission rates following AMI among adult patients in the USA. We hypothesized that patient Medicaid or uninsured status, and HBH status, would be associated with increased risk of readmission at 30 and 90 days.
Materials & methods
Database & population
A retrospective study was performed on 2007–2014 data from California (2007–2011 only), Florida, New York and Maryland (2012–2014 only) from the State Inpatient Databases, Healthcare Cost and Utilization Project (HCUP), Agency for Healthcare Research and Quality. This database contains clinical inpatient insurance payer data from non-federal, non-psychiatric hospitals. Patients ≥18 years of age admitted for AMI, not coded as readmission or subsequent encounter (ICD-9 codes 410.00, 410.01, 410.10, 410.11, 410.20, 410.21, 410.30, 410.31, 410.40, 410.41, 410.50, 410.51, 410.60, 410.61, 410.70, 410.71, 410.80, 410.81, 410.90 and 410.91), were included in the study.
Patients were excluded for missing demographic and insurance variables (see Figure 1).
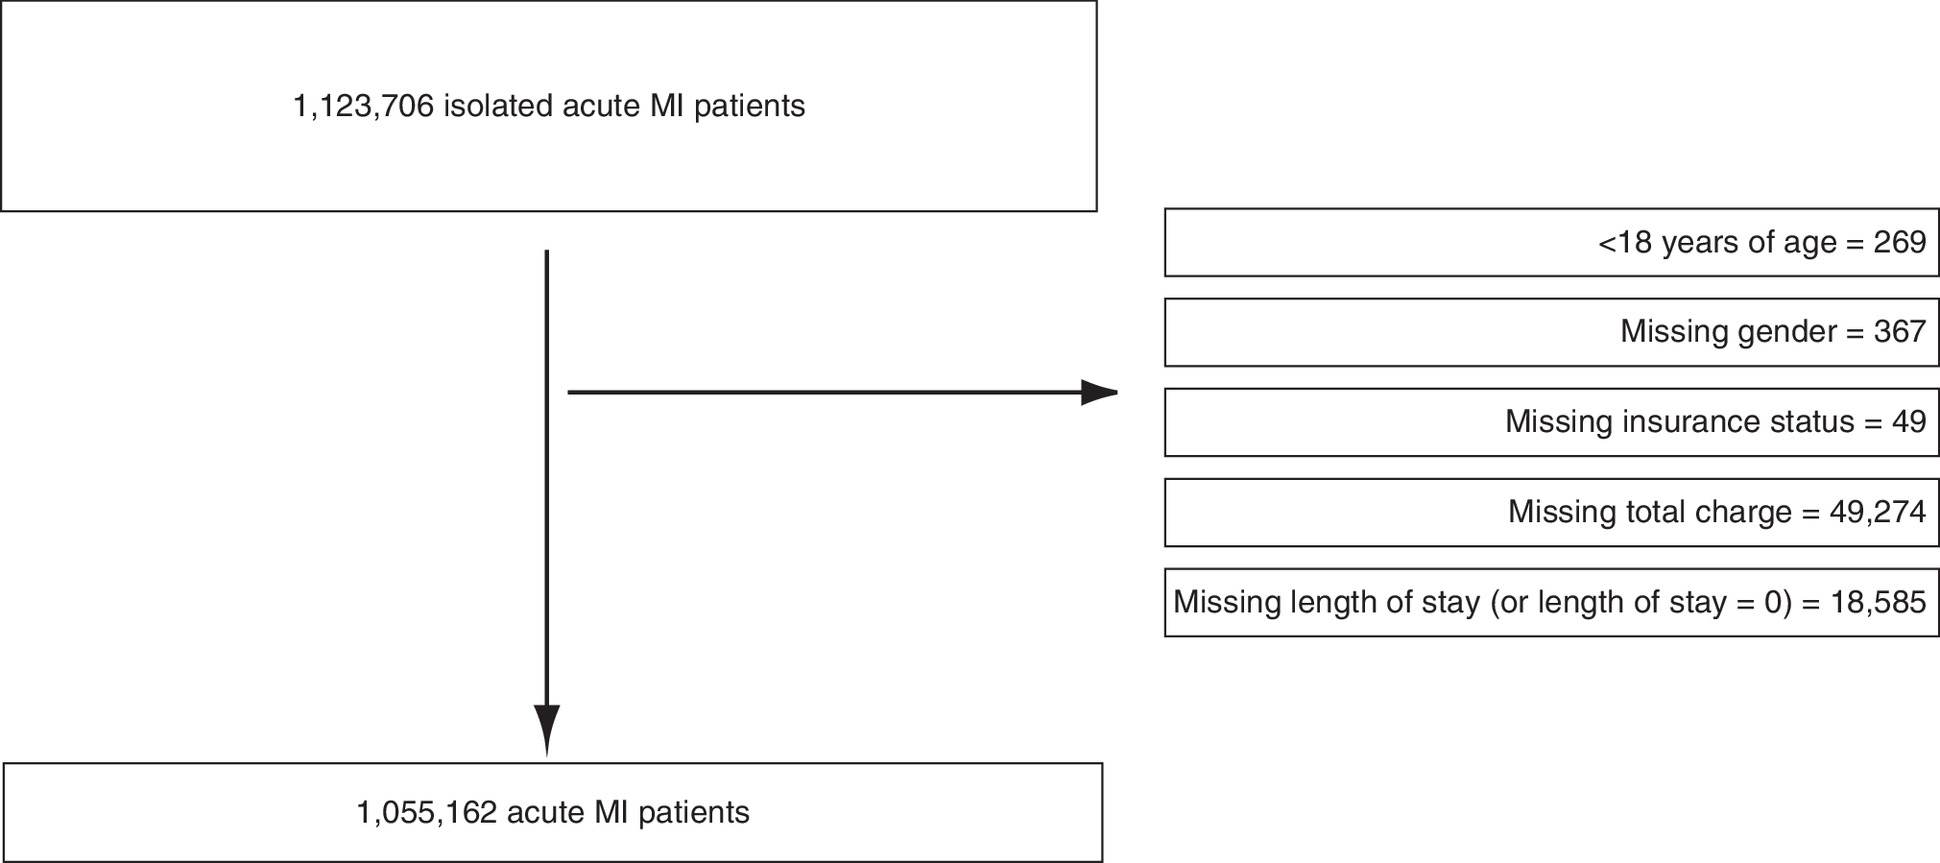
Figure 1. Consort diagram.
MI: Myocardial infarction.
Variables & outcomes
Patients were grouped based on insurance type into the following cohorts: Medicare, Medicaid, self-pay/no charge (no charge reported or self-pay status), other (worker’s compensation, CHAMPUS, CHAMPVA, Title V and other government programs) and Private insurance (Blue Cross, commercial carriers and private health maintenance organizations and preferred provider organizations). Variables extracted for each admission included patient demographic data (age, sex and race/ethnicity), ICD-9-CM diagnoses and procedure codes, insurance type, quartile of median state household income level based on zip code, length of stay, total hospital charges, admission and discharge dates, complications, and present on admission comorbidities. Readmissions were linked to the initial admission with a unique identification code to provide postdischarge time to readmission and were documented when occurring in the same state as the index admission [14,24].
Statistical analyses
Bivariate analysis was done for categorical variables using Pearson’s Chi square and for continuous variables using two-sample t-test or Wilcoxon sum-rank test as appropriate. Sample size with percentage was reported for categorical variables, mean with standard deviation or median with interquartile ranges was reported for continuous variables.
In multivariable analyses, to account for clustering effect on hospitals, generalized estimating equation with exchangeable correlation structure was used. Readmissions were modeled using logistic regression and adjusted odds ratios (ORs) were reported. The multivariate model was adjusted for primary insurance payer, safety-net burden, race/ethnicity, quartile of median income, sex, age, admission type (emergent, urgent and elective), select Elixhauser [25] comorbidities (overall percentage >1.0% in bivariate table), year of procedure, quartile of hospital volume, hospital state, logged measures of length of initial hospital stay and logged total charges of initial hospital stay in 2017 US dollars.
To assess potential effect measure modification, we fit models for our primary outcomes (30- and 90-day readmissions) with interaction terms between safety-net burden tertiles and, separately, primary insurance payer, race/ethnicity and median income quartile [19]. We conducted likelihood ratio tests to assess model fit between the original model without interaction terms and the interaction model. The overall effect of the interaction term was tested and the ORs were directly generated by fixing the burden level in comparison to race/insurance/income levels, and by fixing race/insurance/income at different burden levels. For any model pair with a likelihood ratio test p-value < 0.05, we conducted a Wald test to compare the significant interaction term variables against their main effects. In models where the likelihood ratio test and Wald statistics indicated that the model with interaction terms was superior to the original model, we calculated a linear combination of coefficients for significant interaction effects to derive ORs or incidence rate ratios.
Hospitals were cohorted into tertiles based on the proportion of inpatient cases billed to Medicaid or identified as unpaid (the latter labeled as uninsured). Lowest tertile hospitals served up to 16.83% Medicaid or uninsured patients; the highest reported at least 30.46% Medicaid or uninsured among all inpatient cases.
Due to the association between age ≥65 years and Medicare coverage, as well as possible heterogeneity between elderly and non-elderly patient groups, we performed exploratory analyses stratified by age <65 or ≥65 years (Supplementary Table 1). Additionally, due to possible patient heterogeneity across AMI subtypes, we performed analogous subgroup analyses of patients admitted with diagnoses of non-ST elevation MI (NSTEMI; 410.70, 410.71) versus STEMI (all other included ICD-9 codes; Supplementary Table 2). These analyses were exploratory, and outcomes should be regarded as hypothesis generating. All study activities were approved by the Weill Cornell Medicine Institutional Review Board.
Results
A total of 1,055,162 adult patients were admitted with AMI between 2007 and 2014 in the aforementioned four states and met inclusion criteria, as depicted in Figure 1.
Demographic characteristics & univariate analyses
The mean age of patients included in the study was 69.8 years; 68.7% were White, and 42.2% were females. Patient demographic and clinical characteristics, stratified by insurance and readmission status, are presented in Tables 1 and 2.
| Characteristic | All (n = 1,055,162) | Medicare (n = 677,332) | Medicaid (n = 85,618) | Private insurance (n = 210,561) | Other (n = 28,788) | Self-pay / no charge (n = 52,863) | p-value |
|---|---|---|---|---|---|---|---|
| Age in years Mean ± SD | 69.8 ± 14.4 | 76.9 ± 10.5 | 56.6 ± 12.0 | 58.0 ± 11.0 | 59.5 ± 12.5 | 53.5 ± 9.95 | <0.0001 |
| Sex (females) | 445,472 (42.2%) | 329,155 (48.6%) | 34,951 (40.8%) | 60,680 (28.8%) | 6679 (23.2%) | 14,007 (26.5%) | <0.0001 |
| Race/ethnicity | <0.0001 | ||||||
| – Black | 103,234 (9.78%) | 58,586 (8.65%) | 16,627 (19.4%) | 17,569 (8.34%) | 3101 (10.8%) | 7351 (13.9%) | |
| – Hispanic | 124,220 (11.8%) | 73,183 (10.8%) | 18,613 (21.7%) | 20,589 (9.78%) | 3659 (12.7%) | 8176 (15.5%) | |
| – Other | 83,636 (7.93%) | 44,097 (6.51%) | 15,108 (17.6%) | 17,448 (8.29%) | 1890 (6.57%) | 5093 (9.63%) | |
| – White | 724,371 (68.7%) | 49,1025 (72.5%) | 33,174 (38.7%) | 149,853 (71.2%) | 19,237 (66.8%) | 31,082 (58.8%) | |
| – Missing | 19,701 (1.87%) | 10,441 (1.54%) | 2096 (2.45%) | 5102 (2.42%) | 901 (3.13%) | 1161 (2.20%) | |
| State | <0.0001 | ||||||
| – California | 255,152 (24.2%) | 155,509 (23.0%) | 23,843 (27.8%) | 55,510 (26.4%) | 10,976 (38.1%) | 9314 (17.6%) | |
| – Florida | 427,900 (40.6%) | 287,554 (42.5%) | 23,641 (27.6%) | 73,862 (35.1%) | 12,115 (42.1%) | 30,728 (58.1%) | |
| – Maryland | 24,575 (2.33%) | 15,007 (2.22%) | 2254 (2.63%) | 5995 (2.85%) | 345 (1.20%) | 974 (1.84%) | |
| – New York | 347,535 (32.9%) | 219,262 (32.4%) | 35,880 (41.9%) | 75,194 (35.7%) | 5352 (18.6%) | 11,847 (22.4%) | |
| Hospital volume by quartile, lowest to highest | <0.0001 | ||||||
| – First | 7411 (0.70%) | 5598 (0.83%) | 551 (0.64%) | 925 (0.44%) | 147 (0.51%) | 190 (0.36%) | |
| – Second | 64,956 (6.16%) | 46,572 (6.88%) | 5012 (5.85%) | 9905 (4.70%) | 1580 (5.49%) | 1887 (3.57%) | |
| – Third | 218,890 (20.7%) | 146,294 (21.6%) | 18,656 (21.8%) | 38,383 (18.2%) | 6430 (22.3%) | 9127 (17.3%) | |
| – Fourth | 763,905 (72.4%) | 478,868 (70.7%) | 61,399 (71.7%) | 161,348 (76.6%) | 20,631 (71.7%) | 41,659 (78.8%) | |
| Patient zip code income quartile, lowest to highest | <0.0001 | ||||||
| – First | 280,821 (26.6%) | 181,242 (26.8%) | 33,190 (38.8%) | 42,066 (20.0%) | 8005 (27.8%) | 16,318 (30.9%) | |
| – Second | 276,421 (26.2%) | 180,359 (26.6%) | 21,038 (24.6%) | 52,653 (25.0%) | 7924 (27.5%) | 14,447 (27.3%) | |
| – Third | 252,790 (24.0%) | 161,504 (23.8%) | 16,271 (19.0%) | 55,666 (26.4%) | 6958 (24.2%) | 12,391 (23.4%) | |
| – Fourth | 216,773 (20.5%) | 139,191 (20.5%) | 8818 (10.3%) | 56,111 (26.6%) | 4970 (17.3%) | 7683 (14.5%) | |
| – Missing | 28,357 (2.69%) | 15,036 (2.22%) | 6301 (7.36%) | 4065 (1.93%) | 931 (3.23%) | 2024 (3.83%) | |
| Hospital burden, lowest to highest | <0.0001 | ||||||
| – Lowest | 223,384 (21.2%) | 155,279 (22.9%) | 8707 (10.2%) | 47,945 (22.8%) | 4327 (15.0%) | 7126 (13.5%) | |
| – Middle | 507,482 (48.1%) | 327,003 (48.3%) | 33,508 (39.1%) | 107,684 (51.1%) | 13,199 (45.8%) | 26,088 (49.4%) | |
| – Highest | 324,296 (30.7%) | 195,050 (28.8%) | 43,403 (50.7%) | 54,932 (26.1%) | 11,262 (39.1%) | 19,649 (37.2%) | |
| Year | <0.0001 | ||||||
| – 2007 | 151,842 (14.4%) | 95,421 (14.1%) | 10,776 (12.6%) | 34,324 (16.3%) | 4383 (15.2%) | 6938 (13.1%) | |
| – 2008 | 156,827 (14.9%) | 99,461 (14.7%) | 11,802 (13.8%) | 33,676 (16.0%) | 4495 (15.6%) | 7393 (14.0%) | |
| – 2009 | 152,015 (14.4%) | 96,215 (14.2%) | 12,286 (14.3%) | 31,619 (15.0%) | 4313 (15.0%) | 7582 (14.3%) | |
| – 2010 | 154,944 (14.7%) | 99,167 (14.6%) | 13,195 (15.4%) | 30,107 (14.3%) | 4670 (16.2%) | 7805 (14.8%) | |
| – 2011 | 140,322 (13.3%) | 90,868 (13.4%) | 12,184 (14.2%) | 26,005 (12.4%) | 4214 (14.6%) | 7051 (13.3%) | |
| – 2012 | 104,126 (9.87%) | 68,729 (10.1%) | 8561 (10.0%) | 18,776 (8.92%) | 2315 (8.04%) | 5745 (10.9%) | |
| – 2013 | 112,180 (10.6%) | 73,639 (10.9%) | 9195 (10.7%) | 20,527 (9.75%) | 2533 (8.80%) | 6286 (11.9%) | |
| – 2014 | 82,906 (7.86%) | 53,832 (7.95%) | 7619 (8.90%) | 15,527 (7.37%) | 1865 (6.48%) | 4063 (7.69%) | |
| Operative urgency | <0.0001 | ||||||
| – Emergency/urgent/trauma center/other | 756,766 (71.7%) | 493,011 (72.8%) | 59,207 (69.2%) | 145,783 (69.2%) | 16,801 (58.4%) | 41,964 (79.4%) | |
| – Elective | 42,978 (4.07%) | 28,663 (4.23%) | 2551 (2.98%) | 9181 (4.36%) | 1004 (3.49%) | 1579 (2.99%) | |
| – Missing | 255,418 (24.2%) | 155,658 (23.0%) | 23,860 (27.9%) | 55,597 (26.4%) | 10,983 (38.2%) | 9320 (17.6%) | |
| Comorbidities present on admission | |||||||
| – CHF | 360,101 (34.1%) | 281,425 (41.5%) | 26,346 (30.8%) | 36,570 (17.4%) | 6705 (23.3%) | 9055 (17.1%) | <0.0001 |
| – Valve disease | 154,258 (14.6%) | 123,514 (18.2%) | 7631 (8.91%) | 16,887 (8.02%) | 2607 (9.06%) | 3619 (6.85%) | <0.0001 |
| – Diseases of the pulmonary circulation | 58,964 (5.59%) | 47,271 (6.98%) | 3832 (4.48%) | 5585 (2.65%) | 962 (3.34%) | 1314 (2.49%) | <0.0001 |
| – Peripheral vascular disease | 128,498 (12.2%) | 102,182 (15.1%) | 7370 (8.61%) | 13,897 (6.60%) | 2499 (8.68%) | 2550 (4.82%) | <0.0001 |
| – HTN, uncomplicated | 527,522 (50.0%) | 325,901 (48.1%) | 44,035 (51.4%) | 113,320 (53.8%) | 15,709 (54.6%) | 28,557 (54.0%) | <0.0001 |
| – HTN, complicated | 252,604 (23.9%) | 200,577 (29.6%) | 17,352 (20.3%) | 24,920 (11.8%) | 4422 (15.4%) | 5333 (10.1%) | <0.0001 |
| – Paralysis | 14,269 (1.35%) | 10,785 (1.59%) | 1495 (1.75%) | 1466 (0.70%) | 245 (0.85%) | 278 (0.53%) | <0.001 |
| – Other neurological disease | 71,505 (6.78%) | 58,045 (8.57%) | 4979 (5.82%) | 6086 (2.89%) | 1154 (4.01%) | 1241 (2.35%) | <0.0001 |
| – Obesity | |||||||
| – Chronic pulmonary disease | 247,254 (23.4%) | 182,563 (27.0%) | 19,687 (23.0%) | 31,197 (14.8%) | 5750 (20.0%) | 8057 (15.2%) | <0.0001 |
| – Diabetes, without chronic complications | 317,615 (30.1%) | 210,942 (31.1%) | 29,805 (34.8%) | 54,717 (26.0%) | 8410 (29.2%) | 13,741 (26.0%) | <0.0001 |
| – Diabetes, with chronic complications | 76,737 (7.27%) | 55,371 (8.17%) | 7687 (8.98%) | 10,212 (4.85%) | 1684 (5.85%) | 1783 (3.37%) | <0.0001 |
| – Hypothyroidism | 120,533 (11.4%) | 97,378 (14.4%) | 4882 (5.70%) | 14471 (6.87%) | 1838 (6.38%) | 1964 (3.72%) | <0.0001 |
| – Renal failure | 243,634 (23.1%) | 197,592 (29.2%) | 15,886 (18.6%) | 22,363 (10.6%) | 3936 (13.7%) | 3857 (7.30%) | <0.0001 |
| – Liver disease | 18,600 (1.76%) | 10,282 (1.52%) | 2961 (3.46%) | 3525 (1.67%) | 792 (2.75%) | 1040 (1.97%) | <0.0001 |
| – Peptic ulcer disease | <497 | 354 (0.05%) | 49 (0.06%) | 62 (0.03%) | <11 | 21 (0.04%) | <0.001 |
| – HIV | 1813 (0.17%) | 959 (0.14%) | 461 (0.54%) | 230 (0.11%) | 60 (0.21%) | 103 (0.19%) | <0.001 |
| – Lymphoma | 7575 (0.72%) | 5857 (0.86%) | 365 (0.43%) | 1146 (0.54%) | 127 (0.44%) | 80 (0.15%) | <0.001 |
| – Metastatic tumor | 15,483 (1.47%) | 11,737 (1.73%) | 1053 (1.23%) | 2231 (1.06%) | 288 (1.00%) | 174 (0.33%) | <0.001 |
| – Solid tumor | 33,826 (3.21%) | 26,490 (3.91%) | 1960 (2.29%) | 4351 (2.07%) | 620 (2.15%) | 405 (0.77%) | <0.0001 |
| – Rheumatoid arthritis | 25,162 (2.38%) | 19,185 (2.83%) | 1502 (1.75%) | 3688 (1.75%) | 361 (1.25%) | 426 (0.81%) | <0.0001 |
| – Coagulation disorders | 44,848 (4.25%) | 32,832 (4.85%) | 3563 (4.16%) | 6097 (2.90%) | 1004 (3.49%) | 1352 (2.56%) | <0.0001 |
| – Obesity | 131,628 (12.5%) | 68,682 (10.1%) | 13,701 (16.0%) | 36,100 (17.1%) | 4413 (15.3%) | 8732 (16.5%) | <0.0001 |
| – Weight loss | 34,519 (3.27%) | 27,706 (4.09%) | 2641 (3.08%) | 2976 (1.41%) | 565 (1.96%) | 631 (1.19%) | <0.0001 |
| – Fluid and electrolyte disorders | 214,219 (20.3%) | 159,412 (23.5%) | 16,742 (19.6%) | 26,504 (12.6%) | 4393 (15.3%) | 7168 (13.6%) | <0.0001 |
| – Blood loss anemia | 12,891 (1.22%) | 10,207 (1.51%) | 816 (0.95%) | 1375 (0.65%) | 215 (0.75%) | 278 (0.53%) | <0.001 |
| – Deficiency anemia | 210,469 (19.9%) | 166,218 (24.5%) | 15,245 (17.8%) | 20,845 (9.90%) | 3671 (12.8%) | 4490 (8.49%) | <0.0001 |
| – Alcohol abuse | 35,698 (3.38%) | 14,671 (2.17%) | 6342 (7.41%) | 7870 (3.74%) | 2020 (7.02%) | 4795 (9.07%) | <0.0001 |
| – Drug abuse | 27,311 (2.59%) | 7054 (1.04%) | 8520 (9.95%) | 4748 (2.25%) | 1971 (6.85%) | 5018 (9.49%) | <0.0001 |
| – Psychosis | 27,561 (2.61%) | 18,818 (2.78%) | 4259 (4.97%) | 2725 (1.29%) | 778 (2.70%) | 981 (1.86%) | <0.0001 |
| – Depression | 77,080 (7.31%) | 54,375 (8.03%) | 6156 (7.19%) | 12,279 (5.83%) | 1956 (6.79%) | 2314 (4.38%) | <0.0001 |
| Smoking status | <0.0001 | ||||||
| – Non-smoker | 849,892 (80.5%) | 596,723 (88.1%) | 57,146 (66.7%) | 149,385 (70.9%) | 18,642 (64.8%) | 27,996 (53.0%) | |
| – Current | 189,294 (17.9%) | 70,197 (10.4%) | 27,541 (32.2%) | 57,376 (27.2%) | 9713 (33.7%) | 24,467 (46.3%) | |
| – Former | 15,976 (1.51%) | 10,412 (1.54%) | 931 (1.09%) | 3800 (1.80%) | 433 (1.50%) | 400 (0.76%) | |
| Length of stay (days [lowest quartile; highest quartile]) | 6.93 ± 8.86 | 7.47 ± 8.40 | 8.25 ± 14.1 | 5.29 ± 7.77 | 5.65 ± 7.47 | 5.00 ± 6.89 | <0.0001 |
| – Log of length of stay | 1.39 [0.69; 2.08] | 1.61 [1.10; 2.20] | 1.39 [0.69; 2.20] | 1.10 [0.69; 1.79] | 1.10 [0.69; 1.95] | 1.10 [0.69; 1.79] | <0.0001 |
| – Total charges (2017 Dollars [lowest quartile; highest quartile]) | 65,822 [34,351; 115,524] | 63,206 [32,668; 114,921] | 68,261 [35,070; 125,169] | 70,477 [38,924; 114,893] | 72,666 [38,493; 122,784] | 69,245 [38,998; 109,612] | <0.0001 |
| – Log of total charges | 11.1 [10.4; 11.7] | 11.1 [10.4; 11.7] | 11.1 [10.5; 11.7] | 11.2 [10.6; 11.7] | 11.2 [10.6; 11.7] | 11.1 [10.6; 11.6] | <0.0001 |
| – Any complication during admission | 271,751 (25.8%) | 196,294 (29.0%) | 21,818 (25.5%) | 39,580 (18.8%) | 5770 (20.0%) | 8289 (15.7%) | <0.0001 |
| – Blood transfusion | 150,567 (14.3%) | 113,909 (16.8%) | 11,137 (13.0%) | 19,316 (9.17%) | 2747 (9.54%) | 3458 (6.54%) | <0.0001 |
| Discharge disposition | <0.0001 | ||||||
| – Routine | 533,239 (50.5%) | 270,398 (39.9%) | 53,507 (62.5%) | 148,933 (70.7%) | 19,530 (67.8%) | 40,871 (77.3%) | |
| – To short-term hospital | 106,616 (10.1%) | 65,193 (9.62%) | 9231 (10.8%) | 23,920 (11.4%) | 3212 (11.2%) | 5060 (9.57%) | |
| – Home healthcare | 168,548 (16.0%) | 130,691 (19.3%) | 10,359 (12.1%) | 21,311 (10.1%) | 2652 (9.21%) | 3535 (6.69%) | |
| – Other | 246,759 (23.4%) | 211,050 (31.2%) | 12,521 (14.6%) | 16,397 (7.79%) | 3394 (11.8%) | 3397 (6.43%) | |
CHF: Congestive heart failure; HTN: Hypertension; SD: Standard deviation.
| Characteristic | 30-day readmission | Unadjusted OR of readmitted | p-value | 90-day readmission | Unadjusted OR of readmitted | p-value | ||
|---|---|---|---|---|---|---|---|---|
| Yes (n = 212,313) | No (n = 842,849) | Yes (n = 337,160) | No (n = 718,002) | |||||
| – Age in years | 72.0 ± 13.7 | 69.3 ± 14.5 | <0.001 | 74.0 [62.0; 83.0] | 69.0 [58.0; 81.0] | <0.001 | ||
| – Sex (females) | 97,264 (45.8%) | 348,208 (41.3%) | 1.20 (1.19–1.21) | <0.001 | 154,659 (45.9%) | 290,813 (40.5%) | 1.24 (1.23–1.26) | <0.001 |
| Race/ethnicity | <0.001 | <0.001 | ||||||
| – Black | 24,199 (11.4%) | 79,035 (9.38%) | 1.26 (1.24–1.28) | 38,889 (11.5%) | 64,345 (8.96%) | 1.35 (1.33–1.37) | ||
| – Hispanic | 27,177 (12.8%) | 97,043 (11.5%) | 1.16 (1.14–1.17) | 42,945 (12.7%) | 81,275 (11.3%) | 1.18 (1.17–1.20) | ||
| – Other | 16,568 (7.80%) | 67,068 (7.96%) | 1.02 (1.00–1.04) | 26,277 (7.79%) | 57,359 (7.99%) | 1.02 (1.01–1.04) | ||
| – White | 141,227 (66.5%) | 583,144 (69.2%) | Reference | 223,900 (66.4%) | 500,471 (69.7%) | Reference | ||
| – Missing | 3142 (1.48%) | 16,559 (1.96%) | 0.78 (0.75–0.81) | 5149 (1.53%) | 14,552 (2.03%) | 0.79 (0.77–0.82) | ||
| State | <0.001 | <0.001 | ||||||
| – California | 52,591 (24.8%) | 202,561 (24.0%) | 1.06 (1.04–1.07) | 82,958 (24.6%) | 172,194 (24.0%) | 1.07 (1.06–1.08) | ||
| – Florida | 84,352 (39.7%) | 343,548 (40.8%) | Reference | 133,131 (39.5%) | 294,769 (41.1%) | Reference | ||
| – Maryland | 4263 (2.01%) | 20,312 (2.41%) | 0.85 (0.83–0.88) | 6729 (2.00%) | 17,846 (2.49%) | 0.83 (0.81–0.86) | ||
| – New York | 71,107 (33.5%) | 276,428 (32.8%) | 1.05 (1.04–1.06) | 114,342 (33.9%) | 233,193 (32.5%) | 1.09 (1.08–1.10) | ||
| Payer group | <0.001 | <0.001 | ||||||
| – Medicare | 154,689 (72.9%) | 522,643 (62.0%) | 1.93 (1.91–1.96) | 245,512 (72.8%) | 431,820 (60.1%) | 2.12 (2.10–2.15) | ||
| – Medicaid | 18,964 (8.93%) | 66,654 (7.91%) | 1.86 (1.82–1.90) | 29,996 (8.90%) | 55,622 (7.75%) | 2.01 (1.98–2.05) | ||
| – Private insurance | 27,950 (13.2%) | 182,611 (21.7%) | Reference | 44,484 (13.2%) | 166,077 (23.1%) | Reference | ||
| – Other | 4235 (1.99%) | 24,553 (2.91%) | 1.13 (1.09–1.17) | 6741 (2.00%) | 22,047 (3.07%) | 1.14 (1.11–1.18) | ||
| – Self-pay/no charge | 6475 (3.05%) | 46,388 (5.50%) | 0.91 (0.89–0.94) | 10,427 (3.09%) | 42,436 (5.91%) | 0.92 (0.90–0.94) | ||
| – Hospital volume by quartile, lowest to highest | <0.001 | <0.001 | ||||||
| – First | 1918 (0.90%) | 5493 (0.65%) | 1.45 (1.37–1.52) | 2874 (0.85%) | 4537 (0.63%) | 1.41 (1.34–1.48) | ||
| – Second | 15,066 (7.10%) | 49,890 (5.92%) | 1.25 (1.23–1.28) | 23,554 (6.99%) | 41,402 (5.77%) | 1.27 (1.24–1.29) | ||
| – Third | 46,787 (22.0%) | 172,103 (20.4%) | 1.13 (1.11–1.14) | 73,796 (21.9%) | 145,094 (20.2%) | 1.13 (1.12–1.14) | ||
| – Fourth | 148,542 (70.0%) | 615,363 (73.0%) | Reference | 236,936 (70.3%) | 526,969 (73.4%) | Reference | ||
| Patient zip code income quartile, lowest to highest | <0.001 | <0.001 | ||||||
| – First | 60,906 (28.7%) | 219,915 (26.1%) | Reference | 96,895 (28.7%) | 183,926 (25.6%) | Reference | ||
| – Second | 55,260 (26.0%) | 221,161 (26.2%) | 0.90 (0.89–0.91) | 87,952 (26.1%) | 188,469 (26.2%) | 0.89 (0.88–0.90) | ||
| – Third | 49,493 (23.3%) | 203,297 (24.1%) | 0.88 (0.87–0.89) | 78,330 (23.2%) | 174,460 (24.3%) | 0.85 (0.84–0.86) | ||
| – Fourth | 40,817 (19.2%) | 175,956 (20.9%) | 0.84 (0.83–0.85) | 64,844 (19.2%) | 151,929 (21.2%) | 0.81 (0.80–0.82) | ||
| – Missing | 5837 (2.75%) | 22,520 (2.67%) | 0.94 (0.91–0.96) | 9139 (2.71%) | 19,218 (2.68%) | 0.90 (0.88–0.93) | ||
| Hospital burden, lowest to highest | <0.001 | <0.001 | ||||||
| – Lowest | 44,504 (21.0%) | 178,880 (21.2%) | Reference | 71,091 (21.1%) | 152,293 (21.2%) | Reference | ||
| – Middle | 97,995 (46.2%) | 409,487 (48.6%) | 0.96 (0.95–0.97) | 155,812 (46.2%) | 351,670 (49.0%) | 0.95 (0.94–0.96) | ||
| – Highest | 69,814 (32.9%) | 254,482 (30.2%) | 1.10 (1.09–1.12) | 110,257 (32.7%) | 214,039 (29.8%) | 1.10 (1.09–1.12) | ||
| Year | <0.001 | <0.001 | ||||||
| – 2007 | 31,509 (14.8%) | 120,333 (14.3%) | Reference | 49,771 (14.8%) | 102,071 (14.2%) | Reference | ||
| – 2008 | 32,962 (15.5%) | 123,865 (14.7%) | 1.02 (1.00–1.03) | 52,033 (15.4%) | 104,794 (14.6%) | 1.02 (1.00–1.03) | ||
| – 2009 | 31,441 (14.8%) | 120,574 (14.3%) | 1.00 (0.98–1.01) | 49,624 (14.7%) | 102,391 (14.3%) | 0.99 (0.98–1.01) | ||
| – 2010 | 31,626 (14.9%) | 123,318 (14.6%) | 0.98 (0.96–1.00) | 50,308 (14.9%) | 104,636 (14.6%) | 0.99 (0.97–1.00) | ||
| – 2011 | 28,289 (13.3%) | 112,033 (13.3%) | 0.96 (0.95–0.98) | 44,766 (13.3%) | 95,556 (13.3%) | 0.96 (0.95–0.98) | ||
| – 2012 | 20,311 (9.57%) | 83,815 (9.94%) | 0.93 (0.91–0.94) | 32,456 (9.63%) | 71,670 (9.98%) | 0.93 (0.91–0.94) | ||
| – 2013 | 21,002 (9.89%) | 91,178 (10.8%) | 0.88 (0.86–0.90) | 33,791 (10.0%) | 78,389 (10.9%) | 0.88 (0.87–0.90) | ||
| – 2014 | 15,173 (7.15%) | 67,733 (8.04%) | 0.86 (0.84–0.87) | 24,411 (7.24%) | 58,495 (8.15%) | 0.86 (0.84–0.87) | ||
| Operative urgency | <0.001 | <0.001 | ||||||
| – Emergency/urgent/ trauma center/other | 150,992 (71.1%) | 605,774 (71.9%) | 0.98 (0.96–1.01) | 240,558 (71.3%) | 516,208 (71.9%) | 1.01 (0.99–1.03) | ||
| – Elective | 8680 (4.09%) | 34,298 (4.07%) | Reference | 13,567 (4.02%) | 29,411 (4.10%) | Reference | ||
| – Missing | 52,641 (24.8%) | 202,777 (24.1%) | 1.03 (1.00–1.05) | 83,035 (24.6%) | 172,383 (24.0%) | 1.04 (1.02–1.07) | ||
| Comorbidities present on admission | ||||||||
| – CHF | 95,981 (45.2%) | 264,120 (31.3%) | 1.81 (1.79–1.83) | <0.001 | 151,108 (44.8%) | 208,993 (29.1%) | 1.98 (1.96–1.99) | <0.001 |
| – Valve disease | 37,137 (17.5%) | 117,121 (13.9%) | 1.31 (1.30–1.33) | <0.001 | 58,898 (17.5%) | 95,360 (13.3%) | 1.38 (1.37–1.40) | <0.001 |
| – Diseases of the pulmonary circulation | 15,444 (7.27%) | 43,520 (5.16%) | 1.44 (1.41–1.47) | <0.001 | 24,343 (7.22%) | 34,621 (4.82%) | 1.54 (1.51–1.56) | <0.001 |
| – Peripheral vascular disease | 33,393 (15.7%) | 95,105 (11.3%) | 1.47 (1.45–1.49) | <0.001 | 53,047 (15.7%) | 75,451 (10.5%) | 1.59 (1.57–1.61) | <0.001 |
| – HTN, uncomplicated | 93,303 (43.9%) | 434,219 (51.5%) | 0.74 (0.73–0.74) | <0.001 | 150,292 (44.6%) | 377,230 (52.5%) | 0.73 (0.72–0.73) | <0.001 |
| – HTN, complicated | 68,907 (32.5%) | 183,697 (21.8%) | 1.72 (1.71–1.74) | <0.001 | 108,429 (32.2%) | 144,175 (20.1%) | 1.89 (1.87–1.90) | <0.001 |
| – Paralysis | 3505 (1.65%) | 10,764 (1.28%) | 1.30 (1.25–1.35) | <0.001 | 5428 (1.61%) | 8841 (1.23%) | 1.31 (1.27–1.36) | <0.001 |
| – Other neurological disease | 16,607 (7.82%) | 54,898 (6.51%) | 1.22 (1.20–1.24) | <0.001 | 26,248 (7.79%) | 45,257 (6.30%) | 1.25 (1.24–1.27) | <0.001 |
| – Chronic pulmonary disease | 60,823 (28.6%) | 186,431 (22.1%) | 1.41 (1.40–1.43) | <0.001 | 96,002 (28.5%) | 151,252 (21.1%) | 1.49 (1.48–1.51) | <0.001 |
| – Diabetes, without chronic complications | 70,185 (33.1%) | 247,430 (29.4%) | 1.19 (1.18–1.20) | <0.001 | 111,937 (33.2%) | 205,678 (28.6%) | 1.24 (1.23–1.25) | <0.001 |
| – Diabetes, with chronic complications | 22,674 (10.7%) | 54,063 (6.41%) | 1.74 (1.72–1.77) | <0.001 | 35,542 (10.5%) | 41,195 (5.74%) | 1.94 (1.91–1.96) | <0.001 |
| – Hypothyroidism | 26,647 (12.6%) | 93,886 (11.1%) | 1.14 (1.13–1.16) | <0.001 | 42,540 (12.6%) | 77,993 (10.9%) | 1.18 (1.17–1.20) | <0.001 |
| – Renal failure | 68,937 (32.5%) | 174,697 (20.7%) | 1.84 (1.82–1.86) | <0.001 | 107,961 (32.0%) | 135,673 (18.9%) | 2.02 (2.00–2.04) | <0.001 |
| – Liver disease | 4818 (2.27%) | 13,782 (1.64%) | 1.40 (1.35–1.44) | <0.001 | 7423 (2.20%) | 11,177 (1.56%) | 1.42 (1.38–1.47) | <0.001 |
| – Peptic ulcer disease | 118 (0.06%) | 377 (0.04%) | 1.24 (1.01–1.53) | 0.045 | 199 (0.06%) | 296 (0.04%) | 1.43 (1.20–1.71) | <0.001 |
| – HIV | 486 (0.23%) | 1327 (0.16%) | 1.46 (1.31–1.61) | <0.001 | 777 (0.23%) | 1036 (0.14%) | 1.60 (1.46–1.75) | <0.001 |
| – Lymphoma | 2104 (0.99%) | 5471 (0.65%) | 1.53 (1.46–1.61) | <0.001 | 3260 (0.97%) | 4315 (0.60%) | 1.61 (1.54–1.69) | <0.001 |
| – Metastatic tumor | 4075 (1.92%) | 11,408 (1.35%) | 1.43 (1.38–1.48) | <0.001 | 6060 (1.80%) | 9423 (1.31%) | 1.38 (1.33–1.42) | <0.001 |
| – Solid tumor | 8739 (4.12%) | 25,087 (2.98%) | 1.40 (1.37–1.43) | <0.001 | 13,529 (4.01%) | 20,297 (2.83%) | 1.44 (1.41–1.47) | <0.001 |
| – Rheumatoid arthritis | 5936 (2.80%) | 19,226 (2.28%) | 1.23 (1.20–1.27) | <0.001 | 9431 (2.80%) | 15,731 (2.19%) | 1.28 (1.25–1.32) | <0.001 |
| – Coagulopathy | 11,010 (5.19%) | 33,838 (4.01%) | 1.31 (1.28–1.34) | <0.001 | 17,001 (5.04%) | 27,847 (3.88%) | 1.32 (1.29–1.34) | <0.001 |
| – Obesity | 24,989 (11.8%) | 106,639 (12.7%) | 0.92 (0.91–0.93) | <0.001 | 39,965 (11.9%) | 91,663 (12.8%) | 0.92 (0.91–0.93) | <0.001 |
| – Weight loss | 9475 (4.46%) | 25,044 (2.97%) | 1.53 (1.49–1.56) | <0.001 | 14,229 (4.22%) | 20,290 (2.83%) | 1.52 (1.48–1.55) | <0.001 |
| – Fluid and electrolyte disorders | 51,994 (24.5%) | 162,225 (19.2%) | 1.36 (1.35–1.38) | <0.001 | 80,751 (24.0%) | 133,468 (18.6%) | 1.38 (1.37–1.39) | <0.001 |
| – Blood loss anemia | 3303 (1.56%) | 9588 (1.14%) | 1.37 (1.32–1.43) | <0.001 | 5339 (1.58%) | 7552 (1.05%) | 1.51 (1.46–1.57) | <0.001 |
| – Deficiency anemia | 57,270 (27.0%) | 153,199 (18.2%) | 1.66 (1.64–1.68) | <0.001 | 89,752 (26.6%) | 120,717 (16.8%) | 1.79 (1.78–1.81) | <0.001 |
| – Alcohol abuse | 6796 (3.20%) | 28,902 (3.43%) | 0.93 (0.91–0.96) | <0.001 | 10,926 (3.24%) | 24,772 (3.45%) | 0.94 (0.92–0.96) | <0.001 |
| – Drug abuse | 5822 (2.74%) | 21,489 (2.55%) | 1.08 (1.05–1.11) | <0.001 | 9050 (2.68%) | 18,261 (2.54%) | 1.06 (1.03–1.08) | <0.001 |
| – Psychoses | 7560 (3.56%) | 20,001 (2.37%) | 1.52 (1.48–1.56) | <0.001 | 11,563 (3.43%) | 15,998 (2.23%) | 1.56 (1.52–1.60) | <0.001 |
| – Depression | 17,397 (8.19%) | 59,683 (7.08%) | 1.17 (1.15–1.19) | <0.001 | 27,814 (8.25%) | 49,266 (6.86%) | 1.22 (1.20–1.24) | <0.001 |
| Smoking habits | <0.001 | <0.001 | ||||||
| – Non-smoker | 178,240 (84.0%) | 671,652 (79.7%) | Reference | 282,218 (83.7%) | 567,674 (79.1%) | Reference | ||
| – Current | 30,852 (14.5%) | 158,442 (18.8%) | 0.73 (0.72–0.74) | 49,783 (14.8%) | 139,511 (19.4%) | 0.72 (0.71–0.73) | ||
| – Former | 3221 (1.52%) | 12,755 (1.51%) | 0.95 (0.92–0.99) | 5159 (1.53%) | 10,817 (1.51%) | 0.96 (0.93–0.99) | ||
| Length of stay (days [lowest quartile; highest quartile]) | 6.00 [3.00; 11.0] | 4.00 [2.00; 8.00] | <0.001 | 6.00 [3.00; 10.0] | 4.00 [2.00; 7.00] | <0.001 | ||
| – Log of length of stay | 1.79 [1.10; 2.40] | 1.39 [0.69; 2.08] | <0.001 | 1.79 [1.10; 2.30] | 1.39 [0.69; 1.95] | <0.001 | ||
| Total charges (2017 Dollars [lowest quartile; highest quartile]) | 70,022 [35,830; 130,286] | 64,916 [34,011; 112,336] | <0.001 | 68,345 [35,076; 125,997] | 64,804 [34,033; 111,228] | <0.001 | ||
| – Log of total charges | 11.2 [10.5;11.8] | 11.1 [10.4;11.6] | <0.001 | 11.1 [10.5;11.7] | 11.1 [10.4;11.6] | <0.001 | ||
| – Any complication during admission | 68,115 (32.1%) | 203,636 (24.2%) | 1.48 (1.47–1.50) | <0.001 | 104,515 (31.0%) | 167,236 (23.3%) | 1.48 (1.47–1.49) | <0.001 |
| – Blood transfusion | 41,022 (19.3%) | 109,545 (13.0%) | 1.60 (1.58–1.62) | <0.001 | 62,917 (18.7%) | 87,650 (12.2%) | 1.65 (1.63–1.67) | <0.001 |
| Discharge disposition | <0.001 | <0.001 | ||||||
| – Routine | 84,528 (39.8%) | 448,711 (53.2%) | Reference | 138,609 (41.1%) | 394,630 (55.0%) | Reference | ||
| – To short-term hospital | 21,301 (10.0%) | 85,315 (10.1%) | 1.33 (1.30–1.35) | 34,834 (10.3%) | 71,782 (10.0%) | 1.38 (1.36–1.40) | ||
| – Home healthcare | 40,570 (19.1%) | 127,978 (15.2%) | 1.68 (1.66–1.71) | 63,180 (18.7%) | 105,368 (14.7%) | 1.71 (1.69–1.73) | ||
| – Other | 65,914 (31.0%) | 180,845 (21.5%) | 1.93 (1.91–1.96) | 100,537 (29.8%) | 146,222 (20.4%) | 1.96 (1.94–1.98) | ||
CHF: Congestive heart failure; HTN: Hypertension; OR: Odds ratio.
Readmission rates varied significantly across insurance cohorts (p < 0.0001). Uninsured patients demonstrated the lowest readmission rates (12.2 and 19.7% at 30 and 90 days), followed by patients with private insurance (13.3 and 21.1% at 30 and 90 days). Readmission rates, by insurance status, are presented in Table 3; present-on-readmission diagnoses are summarized in Table 4.
| Insurance primary payer | 30-day readmission (p = 0) | 90-day readmission (p = 0) | ||
|---|---|---|---|---|
| Yes | No | Yes | No | |
| All (n = 1,055,162) | 212,313 (20.1%) | 842,849 (79.9%) | 337,160 (32.0%) | 718,002 (68.0%) |
| Medicare (n = 677,332) | 154,689 (22.8%) | 522,643 (77.2%) | 245,512 (36.2%) | 431,820 (63.8%) |
| Medicaid (n = 85,618) | 18,964 (22.1%) | 66,654 (77.9%) | 29,996 (35.0%) | 55,622 (65.0%) |
| Private insurance (n = 210,561) | 27,950 (13.3%) | 182,611 (86.7%) | 44,484 (21.1%) | 166,077 (78.9%) |
| Other (n = 28,788) | 4235 (14.7%) | 24,553 (85.3%) | 6741 (23.4%) | 22,047 (76.6%) |
| Self-pay/no charge (n = 52,863) | 6475 (12.2%) | 46,388 (87.8%) | 10,427 (19.7%) | 42,436 (80.3%) |
| Diagnosis | 30-day readmission | 90-day readmission | ||||||||||||
|---|---|---|---|---|---|---|---|---|---|---|---|---|---|---|
| All (n = 212,313) | Medicare (n = 154,689) | Medicaid (n = 18,964) | Private insurance (n = 27,950) | Other (n = 4235) | Self-pay/no charge (n = 6475) | p-value | All (n = 337,160) | Medicare (n = 245,512) | Medicaid (n = 29,996) | Private insurance (n = 44,484) | Other (n = 6741) | Self-pay/no charge (n = 10,427) | p-value | |
| Pneumonia | 28,828 (13.6%) | 23,595 (15.3%) | 2034 (10.7%) | 2365 (8.46%) | 416 (9.82%) | 418 (6.46%) | <0.001 | 42,684 (12.7%) | 35,066 (14.3%) | 2972 (9.91%) | 3423 (7.69%) | 596 (8.84%) | 627 (6.01%) | <0.0001 |
| Atrial fibrillation | 50,534 (23.8%) | 43,245 (28.0%) | 2162 (11.4%) | 3948 (14.1%) | 595 (14.0%) | 584 (9.02%) | <0.0001 | 78,537 (23.3%) | 67,209 (27.4%) | 3272 (10.9%) | 6179 (13.9%) | 932 (13.8%) | 945 (9.06%) | <0.0001 |
| Atelectasis | 5218 (2.46%) | 4042 (2.61%) | 355 (1.87%) | 596 (2.13%) | 115 (2.72%) | 110 (1.70%) | <0.001 | 7362 (2.18%) | 5753 (2.34%) | 479 (1.60%) | 822 (1.85%) | 151 (2.24%) | 157 (1.51%) | <0.001 |
| Empyema | <213 | 130 (0.08%) | 23 (0.12%) | 38 (0.14%) | <11 | <11 | 0.036 | <300 | 197 (0.08%) | 28 (0.09%) | 53 (0.12%) | <11 | <11 | 0.083 |
| Pleural | 11,226 (5.29%) | 8547 (5.53%) | 839 (4.42%) | 1360 (4.87%) | 200 (4.72%) | 280 (4.32%) | <0.001 | 15,672 (4.65%) | 12,072 (4.92%) | 1132 (3.77%) | 1824 (4.10%) | 274 (4.06%) | 370 (3.55%) | <0.001 |
| Pneumothorax | <308 | 220 (0.14%) | 27 (0.14%) | 39 (0.14%) | <11 | <11 | 0.531 | <465 | 336 (0.14%) | 42 (0.14%) | 64 (0.14%) | 12 (0.18%) | <11 | 0.686 |
| Deep vein thrombosis | 7391 (3.48%) | 5385 (3.48%) | 575 (3.03%) | 1105 (3.95%) | 140 (3.31%) | 186 (2.87%) | <0.001 | 10,185 (3.02%) | 7596 (3.09%) | 754 (2.51%) | 1405 (3.16%) | 184 (2.73%) | 246 (2.36%) | <0.001 |
| Hypoxia | 5041 (2.37%) | 4154 (2.69%) | 309 (1.63%) | 445 (1.59%) | 61 (1.44%) | 72 (1.11%) | <0.001 | 7581 (2.25%) | 6260 (2.55%) | 479 (1.60%) | 647 (1.45%) | 91 (1.35%) | 104 (1.00%) | <0.001 |
| Myocardial infarction | 79,232 (37.3%) | 55,821 (36.1%) | 6441 (34.0%) | 12,244 (43.8%) | 1779 (42.0%) | 2947 (45.5%) | <0.001 | 100,991 (30.0%) | 71,353 (29.1%) | 8227 (27.4%) | 15,316 (34.4%) | 2271 (33.7%) | 3824 (36.7%) | <0.001 |
| Stroke | 11,186 (5.27%) | 8818 (5.70%) | 704 (3.71%) | 1216 (4.35%) | 181 (4.27%) | 267 (4.12%) | <0.001 | 18,351 (5.44%) | 14,480 (5.90%) | 1188 (3.96%) | 1968 (4.42%) | 289 (4.29%) | 426 (4.09%) | <0.001 |
| Urinary tract infection | 26,730 (12.6%) | 22,726 (14.7%) | 1630 (8.60%) | 1838 (6.58%) | 293 (6.92%) | 243 (3.75%) | <0.0001 | 42,067 (12.5%) | 35,957 (14.6%) | 2492 (8.31%) | 2753 (6.19%) | 458 (6.79%) | 407 (3.90%) | <0.0001 |
| Wound infection | 5103 (2.40%) | 3310 (2.14%) | 577 (3.04%) | 910 (3.26%) | 121 (2.86%) | 185 (2.86%) | <0.001 | 6636 (1.97%) | 4338 (1.77%) | 718 (2.39%) | 1190 (2.68%) | 155 (2.30%) | 235 (2.25%) | <0.001 |
Multivariable analyses
Looking at patient-level social determinants of health, compared with private insurance status, Medicaid status was associated with a 37.7% increase in risk-adjusted odds of readmission at 30 days (OR: 1.377; 95% CI: 1.335–1.420; p < 0.0001] and 44.0% increase at 90 days (OR: 1.440; 95% CI: 1.401–1.481; p < 0.0001). Uninsured patients had significantly reduced odds of readmission at 30 days (OR: 0.915; 95% CI: 0.882–0.949; p < 0.0001) and 90 days (OR: 0.918, 95% CI: 0.888–0.959; p < 0.0001).
Relative to low-burden hospitals, HBH status was associated with significantly increased risk-adjusted odds of readmission at 30 days (OR: 1.096; 95% CI: 1.051–1.423; p < 0.0001) and 90 days (OR: 1.095; 95% CI: 1.042–1.151; p = 0.0003). The trend toward increased readmission odds was not significant among middle-burden hospitals at either time point (30-day OR: 1.025, 95% CI: 0.983–1.069, p = 0.24; 90-day OR: 1.020, 95% CI: 0.969–1.073, p = 0.454).
Compared with patients in the lowest income quartile by zip code, patients in the two highest quartiles showed significantly decreased odds of readmission at 30 days (3rd-quartile OR: 0.979, 95% CI: 0.962–0.997; 4th-quartile OR: 0.952, 95% CI: 0.934–0.971) and 90 days (3rd-quartile OR: 0.928, 95% CI: 0.911–0.945; 4th-quartile OR: 0.940, 95% CI: 0.912–0.989). Relative to White patients, Black patients showed 8.1 and 12.8% increases in odds of readmission at 30 and 90 days (p < 0.0001).
For both 30- and 90-day readmissions, there were no significant interactions between hospital burden tertile and race/ethnicity, insurance status or median income quartile, separately.
Results of multivariate analyses are presented in Table 5.
| Independent variables | (Odds ratios with 95% CIs) | |
|---|---|---|
| 30-day readmission | 90-day readmission | |
| Age (per one year increase) | 0.9992 (0.9985–0.9999) | 0.9977 (0.9970–0.9983)¶ |
| Female sex (reference: males) | 1.0303 (1.0186–1.0420)¶ | 1.0403 (1.0296–1.0510)¶ |
| State (reference: Florida) | ||
| – California | 0.9488 (0.6391–1.4086) | 1.0499 (0.7325–1.5048) |
| – Maryland | 0.8016 (0.7492–0.8576)¶ | 0.7704 (0.7117–0.8339)¶ |
| – New York | 0.9902 (0.9461–1.0362) | 1.0372 (0.9799–1.0978) |
| Year (Reference: 2007) | ||
| – 2008 | 0.9910 (0.9736–1.0087) | 0.9874 (0.9704–1.0047) |
| – 2009 | 0.9763 (0.9581–0.9948)† | 0.9700 (0.9528–0.9875)‡ |
| – 2010 | 0.9546 (0.9354–0.9742)¶ | 0.9565 (0.9379–0.9756)¶ |
| – 2011 | 0.9311 (0.9103–0.9524)¶ | 0.9204 (0.9006–0.9406)¶ |
| – 2012 | 0.9038 (0.8794–0.9288)¶ | 0.9006 (0.8773–0.9245)¶ |
| – 2013 | 0.8659 (0.8382–0.8945)¶ | 0.8691 (0.8420–0.8969)¶ |
| – 2014 | 0.8516 (0.8228–0.8814)¶ | 0.8513 (0.8248–0.8786) |
| Payor status (reference: private insurance) | ||
| – Medicaid | 1.3773 (1.3354–1.4204)¶ | 1.4403 (1.4010–1.4807)¶ |
| – Medicare | 1.3770 (1.3502–1.4043)¶ | 1.4786 (1.4532–1.5045)¶ |
| – Other | 1.0064 (0.9639–1.0507) | 1.0146 (0.9770–1.0537) |
| – Self-pay/no charge | 0.9149 (0.8819–0.9491)¶ | 0.9177 (0.8879–0.9486)¶ |
| Race/ethnicity (reference: White) | ||
| – Black | 1.0811 (1.0587–1.1039)¶ | 1.1281 (1.1087–1.1478)¶ |
| – Hispanic | 1.0412 (1.0213–1.0615)¶ | 1.0458 (1.0267–1.0652)¶ |
| – Missing | 0.7974 (0.7546–0.8427)¶ | 0.8190 (0.7769–0.8634)¶ |
| – Other | 0.9535 (0.9316–0.9759)¶ | 0.9423 (0.9206–0.9646)¶ |
| Median income level per zip code (reference: first quartile) | ||
| – Second quartile | 0.9858 (0.9715–1.0003) | 0.9798 (0.9665–0.9933)‡ |
| – Third quartile | 0.9790 (0.9616–0.9967)† | 0.9601 (0.9437–0.9767)¶ |
| – Fourth quartile | 0.9518 (0.9335–0.9705)¶ | 0.9278 (0.9106–0.9453)¶ |
| – Missing | 0.9782 (0.9470–1.0103) | 0.9400 (0.9124–0.9686)¶ |
| Hospital burden (reference: low burden) | ||
| – Middle | 1.0253 (0.9834–1.0689) | 1.0195 (0.9691–1.0726) |
| – High | 1.0955 (1.0506–1.1423)¶ | 1.0951 (1.0421–1.1507)§ |
| Hospital volume (reference: fourth quartile) | ||
| – First quartile | 1.0128 (0.9288–1.1045) | 0.8561 (0.7847–0.9341)§ |
| – Second quartile | 0.9797 (0.9403–1.0208) | 0.8709 (0.8332–0.9104)¶ |
| – Third quartile | 0.9601 (0.9276–0.9937)† | 0.8798 (0.8437–0.9174)¶ |
| Treatment type (reference: elective) | ||
| – Emergency/urgent/trauma center/other | 0.9732 (0.9463–1.0010) | 0.9872 (0.9616–1.0135) |
| – Missing | 1.0596 (0.7133–1.5740) | 0.9989 (0.6968–1.4319) |
| Length of stay (per one unit increase in log-transformed LOS) | ||
| 1.3925 (1.3709–1.4143)¶ | 1.4250 (1.4040–1.4463)¶ | |
| Total charges (per one unit increase in log-transformed total charge) | ||
| 0.8836 (0.8701–0.8974)¶ | 0.8445 (0.8318–0.8575)¶ | |
| Comorbidities (yes vs no) | ||
| – Congestive heart failure | 1.2576 (1.2432–1.2722)¶ | 1.3156 (1.3006–1.3308)¶ |
| – Valve disease | 1.0701 (1.0542–1.0863)¶ | 1.0928 (1.0773–1.1085)¶ |
| – Diseases of the pulmonary circulation | 1.0461 (1.0248–1.0678) | 1.0616 (1.0405–1.0833)¶ |
| – Peripheral vascular disease | 1.1650 (1.1476–1.1827)¶ | 1.2258 (1.2087–1.2431)¶ |
| – HTN, uncomplicated | 1.0075 (0.9956–1.0196) | 1.0310 (1.0197–1.0424)¶ |
| – HTN, complicated | 1.0249 (1.0042–1.0460)† | 1.0617 (1.0414–1.0824)¶ |
| – Paralysis | 1.0257 (0.9846–1.0686) | 1.0153 (0.9786–1.0534) |
| – Other neurological disease | 1.0015 (0.9823–1.0212) | 1.0105 (0.9926–1.0288) |
| – Chronic pulmonary disease | 1.1627 (1.1497–1.1760)¶ | 1.1995 (1.1880–1.2111)¶ |
| – Diabetes, without chronic complications | 1.1531 (1.1399–1.1664)¶ | 1.1877 (1.1766–1.1989)¶ |
| – Diabetes, with chronic complications | 1.2918 (1.2693–1.3146)¶ | 1.3768 (1.3543–1.3996)¶ |
| – Hypothyroid | 1.0103 (0.9950–1.0258) | 1.0249 (1.0112–1.0388)§ |
| – Renal failure | 1.2598 (1.2344–1.2856)¶ | 1.2935 (1.2683–1.3193)¶ |
| – Liver disease | 1.1990 (1.1570–1.2426)¶ | 1.2086 (1.1700–1.2486)¶ |
| – Metastatic tumors | 1.1350 (1.0882–1.1837)¶ | 1.0551 (1.0144–1.0975)‡ |
| – Solid tumors | 1.1568 (1.1245–1.1900)¶ | 1.2006 (1.1688–1.2333)¶ |
| – Rheumatoid arthritis | 1.1524 (1.1172–1.1887)¶ | 1.1870 (1.1538–1.2212)¶ |
| – Coagulation disorders | 1.0254 (1.0003–1.0511)† | 1.0158 (0.9932–1.0389) |
| – Obesity | 0.9317 (0.9185–0.9452)¶ | 0.9252 (0.9135–0.9369)¶ |
| – Weight loss | 1.0361 (1.0074–1.0657)† | 1.0008 (0.9736–1.0288) |
| – Fluid disease | 1.0048 (0.9925–1.0173) | 0.9843 (0.9722–0.9965)† |
| – Blood loss | 1.0498 (1.0089–1.0922)† | 1.1329 (1.0902–1.1773)¶ |
| – Iron deficiency anemia | 1.1456 (1.1308–1.1607)¶ | 1.1864 (1.1728–1.2003)¶ |
| – Alcohol abuse | 0.9603 (0.9311–0.9905)† | 0.9878 (0.9629–1.0133) |
| – Drug abuse | 1.2051 (1.1665–1.2450)¶ | 1.1793 (1.1457–1.2138)¶ |
| – Psychoses | 1.2763 (1.2414–1.3121)¶ | 1.2838 (1.2510–1.3176)¶ |
| – Depression | 1.0805 (1.0606–1.1006)¶ | 1.1114 (1.0935–1.1296)¶ |
Statistical significance is denoted as:
†
p < 0.05.
‡
p < 0.01.
§
p < 0.001.
¶
p < 0.0001.
HTN: Hypertension; LOS: Length of stay.
Exploratory analyses stratified by age (<65 or >65 years) and AMI subtype (STEMI vs NSTEMI) tended to be consistent with primary analyses (Supplementary Tables 1 & 2). Preliminary analyses stratified by age (Supplementary Table 2), the under-65 cohort showed a greater increase in risk-adjusted readmission odds in Medicaid and Medicare insurance groups compared with older patients.
Discussion
The results of this study indicate that both patient- and hospital-level social determinants of health – Medicaid insurance, Black race, median income and HBH status – are independent risk factors for 30- and 90-day readmission following hospitalization for AMI. However, uninsured status was not associated with increased odds of readmission. These findings indicate that patient- and hospital-level factors contribute to increased readmission risk in the AMI patient population; our analysis did not reveal any statistically significant two level interaction terms.
The results of this study were partially consistent with the hypothesis that uninsured and Medicaid status, as proxies for low SES, would have higher rates and risk-adjusted odds of readmission compared with patients with private insurance. This hypothesis was based on prior literature demonstrating the importance of insurance status, among other socioeconomic factors, in predicting clinical outcomes for patients with cardiovascular disease [5,26]. In a retrospective analysis of more than 210,000 STEMI patients under age 65, Patel and colleagues reported lower rates of revascularization, and higher rates of in-patient mortality, among Medicaid patients compared with those with private insurance [27]. Furthermore, a retrospective analysis of 198,420 non-elderly AMI patients in California found that, although Medicaid patients were more likely than private payer patients to be treated at facilities capable of performing cardiac catheterization and other percutaneous coronary interventions, they were less likely to receive percutaneous coronary interventions then were private insurance patients [16]. Finally, a review of 10,461 MI admissions by Foraker and colleagues [28] found that Medicaid patients were significantly less likely to be discharged with optimal medical therapy, including aspirin and β-blockers, than were patients with private insurance.
Nonetheless, the results of the current did not fully confirm our hypothesis that uninsured or Medicaid status, as a marker of lower SES, would predict higher readmission odds. Uninsured/self-pay status was instead associated with decreased risk-adjusted odds of unplanned readmission. Several factors may help explain this finding. For instance, the self-pay cohort may include relatively wealthy patients, such as those who are too affluent for Medicaid but who cannot afford to purchase private insurance, or highly affluent patients who opt to pay out-of-pocket for care at institutions of their choice. Perhaps more plausibly, uninsured patients may be more likely to be indigent or otherwise lost to follow-up; this explanation is consistent with prior research demonstrating poor continuity of care for patients without insurance coverage [20,29].
Superior care metrics among uninsured patients, relative to Medicaid patients, are not unprecedented in the medical literature. In an analysis of 17,600 patients from the National Registry of Myocardial Infarction, Sada and colleagues [5] found that uninsured patients were more likely to undergo both discretionary (for ‘low risk’ patients) and non-discretionary (for ‘high risk’ patients) angiography than were Medicaid patients. In addition, in a recent retrospective analysis of postAMI outcomes, Wadhera and colleagues [30] reported that Medicaid expansion under the Affordable Care Act was associated with lower percentages of uninsured patients but not with improved clinical outcomes, suggesting that insurance status was a less meaningful driver of postAMI complications than hypothesized [30]. Furthermore, in an analysis of Massachusetts patients before and after insurance reform and expansion, Albert et al. [31] found that increased insurance coverage did not significantly reduce disparities in rates of coronary revascularization according to non-White ethnicity and neighborhood education level, among other socioeconomic factors.
Indeed, the results of this study support the significance of non-insurance-based factors in predicting readmissions following AMI; these include hospital-level factors, such as high-burden status, and patient-level socioeconomic factors, including relative income and race/ethnicity. In the current study, high-burden status was associated with a 9.5 and 9.6% increase in risk-adjusted odds of readmission at 30 and 90 days, independent of patient insurance status. These findings are consistent with prior analyses demonstrating inferior outcomes for cardiovascular patients at HBH [32], including a review of over 2 million cases from the National Inpatient Databases, in which HBH status was associated with ‘failure to rescue’ after elective coronary artery bypass graft (CABG) and/or cardiac valve operations (OR: 1.12; 95% CI: 1.01–1.23) [33]. Similarly, an analysis of 116,857 Medicare admissions for AMI found higher risk-standardized mortality rates among patients treated at urban SNHs compared with non-SNHs (21.3 ± 0.2 vs 20.0 ± 0.1; p < 0.001) in addition to inferior reperfusion and non-reperfusion quality of care metrics [23]. HBHs have been associated with increased mortality following ST-elevation MI [32] and following percutaneous coronary intervention for AMI and non-AMI indications [21]. Hospital burden status may contribute to inferior outcomes due to financial strain from decreased revenue and limited flexibility to determining strategic care priorities in the setting of a universal care mandate [34]. Financial problems have been shown to be associated with lapses in quality of care [35]. By contrast, financial profitability is associated with increased patient satisfaction, potentially suggestive of higher quality care [36].
Our study also demonstrated a small but significant association decreased patient income by zip code, as an indicator of lower SES, and increased risk-adjusted readmission odds. Markers of community-level SES are known to predict clinical outcomes in medical and surgical fields [37]. Residence within a severely disadvantaged neighborhood [38] and exposure to higher rates of income inequality [39] have been shown to predict increased readmission rates following hospitalization for MI, pneumonia or heart failure in the Medicare population. Similarly, patients from lower income quartiles have been shown to have higher rates of 30-day readmission following AMI [10].
Finally, the present study also found increased odds of readmission among patients of black race/ethnicity, as a marker of social disadvantage, relative to White patients. These findings are consistent with prior literature describing racial disparities in cardiovascular disease outcomes, including lower rates of revascularization for Black and non-Hispanic White patients with coronary artery disease [31], and higher rates of unplanned readmissions [12]. Clinical variables are often posited as explaining the association between non-White race/ethnicity and inferior clinical outcomes among MI patients [11]. An analysis of 6402 patients admitted with AMI found that Black patients had significantly different clinical baseline characteristics, including cardiac history, comorbidities and overall health status, relative to White patients, and that these traits were independently associated increased mortality risk at 5 years [40]. However, in the current study, Black and Hispanic race/ethnicity were independently associated with increased risk-adjusted odds of readmission, even after adjusting for present-on-admission comorbidities. Of note, patients self-reported as ‘other’ demonstrated lower risk-adjusted odds, perhaps suggesting decreased readmission risk associated with racial and ethnic groups included in this cohort (e.g., Asian–American patients), or among patients who declined to specify their racial or ethnic category.
Multiple mechanisms may contribute to the SES disparities described above and observed in the current study. Less affluent patients may tend to have a greater number and severity of presenting comorbidities and modifiable risk factors, including increased rates of smoking, drug and alcohol abuse [41,42]. Among patients of low SES, reduced healthcare literacy or the ability to navigate the healthcare system and actively participate in one’s care, may adversely affect outcomes; reduced healthcare literacy has been shown to be an independent risk factor for 30-day readmission following AMI [43]. Finally, for low-SES patients who are able to access the healthcare system, quality of care may be inferior [17] due to facility- or provider-related factors [15,34–36].
Limitations
Our study is limited by its retrospective nature, which prevents us from determining causality of the readmissions disparities we observed. In addition, administrative data are inherently imperfect; coding errors and misclassification may have affected our results. Also, although we excluded patients coded as readmissions for AMI, we included patients whose admission status was ‘unknown’. It is therefore possible that our data includes unrecognized readmissions.
In addition, this study likely oversimplifies SES. While SES proxies such as income, insurance status and race/ethnicity are well established in the medical literature [6], the current study was unable to account for other variables, such as education level and financial insecurity, which may also affect the relationship between SES and healthcare outcomes [40]. Similarly, even patients with private payer insurance may qualify as ‘underinsured’, due to high deductibles and elevated out-of-pocket healthcare expenses relative to income [44]. The HCUP datasets preclude identification of ‘underinsured’ patients by these definitions.
Most significantly, the HCUP databases lack certain granular clinical information, such as the severity of patient comorbidities, which are known to affect readmission and mortality outcomes following major illness [1]. Relevant to MI, these databases do not capture procedural variables (e.g., procedure duration, estimated blood loss and number of vessels treated) for revascularized patients [26], hemodynamic or laboratory parameters (e.g., blood pressure on presentation and troponin levels), or standard-of-care discharge medications (e.g., beta-blockade, aspirin, etc.), among other potentially-significant data points [11,28].
Finally, our study included a heterogeneous patient population, including adult patients of all ages and AMIs of all subtypes and clinical severity. Exploratory analyses of patient subgroups by age and AMI subtype tended to confirm primary findings regarding readmission odds and risk factors, but also raised important questions that were beyond the scope of the present inquiry, For instance, exploratory analyses stratified by age suggested higher risk-adjusted readmission odds for Medicare and Medicaid patients <65 years, compared with older patients. Although prior research has identified a similar pattern among patients with congestive heart failure [45], and indicate that readmission is a major source of morbidity and healthcare spending for AMI patients across the age spectrum [10], these findings may warrant further study. Similarly, although exploratory analyses of NSTEMI and STEMI patient groups were reassuring regarding significant differences in readmission risk factors (Supplementary Table 2), a full analysis of readmission risk associated with AMI subtypes was beyond the scope of the current inquiry. This is an area ripe for further research.
Strengths of the current study include generalizability due to large sample size, and inclusion of patients from four geographically and demographically heterogeneous states over an 8-year time period. Readmission rates following AMI are known to vary widely across the nation [46], supporting the relevance and importance of a large and diverse sample, as included in the current study.
Conclusion
The findings of this study indicate that hospital high-burden safety-net status and patient Medicaid status, among multiple proxies of low SES, are associated with increased risk of readmission following AMI. More research is needed to help understand and ultimately mitigate the mechanisms that underlie these disparities. In addition, the current study raises important questions regarding lower readmissions odds among self-pay and uninsured patients, relative to those with Medicaid. If low admission rates are due to decreased follow-up and poor continuity of clinical care, further research may help inform interventions to reduce care disparities and ensure optimal outcomes for patients regardless of insurance status.
Future perspective
We anticipate that healthcare disparities, such as unplanned readmission following AMI, will be increasingly imported as matters of health policy and social justice in coming years. More research is needed to understand the mechanisms linking social determinants of health, such as insurance status and hospital safety-net status, to readmission rates and other metrics of inferior care. We anticipate that this research will become increasingly urgent in the coming decade due to ongoing implementation of Centers for Medicare and Medicaid Services Hospital Readmissions Reduction Program and due to increased awareness of socioeconomic, racial and health-related inequalities across the USA.
•
Unplanned hospital readmissions following acute myocardial infarction (AMI) are a significant source of patient morbidity and healthcare spending in the USA.
•
This study evaluated the independent effects of hospital safety-net burden status and patient insurance status, among other social determinants of health, on readmission rates following AMI.
•
This study entailed a retrospective analysis of 1,055,162 admissions from the State Inpatient Databases, Healthcare Cost and Utilization Project from 2007–2014 data from California, Florida, New York and Maryland.
•
Medicaid status was associated with 37.7 and 44.0% increases in risk-adjusted readmission odds at 30 and 90 days (p < 0.0001).
•
Uninsured status was associated with 8.5 and 8.2% reductions in risk-adjusted odds of readmission at 30 and 90 days, possibly reflecting lack of follow-up among uninsured patients.
•
High-burden safety-net status was associated with 9.6 and 9.5% increased odds of readmission at 30 and 90 days (p < 0.0003).
•
Lower median income by zip code and non-White race/ethnicity, as markers of social disadvantage, were associated with increased risk-adjusted readmission odds.
•
This study demonstrates that patient-level social determinants of health, as well as hospital-level factors, contribute to increased readmission risk following AMI.
•
More research is needed to understand and mitigate socioeconomic disparities in AMI care.
Author contributions
MM Hoyler, X Ma and RS White contributed to the conception and design of this project. X Ma and RS White conducted statistical analyses. MM Hoyler, MD Abramovitz, X Ma and RS White interpreted the data. MM Hoyler and MD Abramovitz drafted the manuscript. MM Hoyler, MD Abramovitz, D Khatib, JD Samuels, CW Tam, R Thalappillil and RS White critically revised the manuscript.
Financial & competing interests disclosure
The authors have no relevant affiliations or financial involvement with any organization or entity with a financial interest in or financial conflict with the subject matter or materials discussed in the manuscript. This includes employment, consultancies, honoraria, stock ownership or options, expert testimony, grants or patents received or pending, or royalties.
No writing assistance was utilized in the production of this manuscript.
Supplementary Material
References
Papers of special note have been highlighted as: • of interest; •• of considerable interest
1.
Benjamin EJ, Muntner P, Alonso A et al. Heart disease and stroke statistics – 2019 update: a report from the American Heart Association. Circulation 139(10), e56–e528 (2019).
2.
Wang H, Zhao T, Wei X, Lu H, Lin X. The prevalence of 30-day readmission after acute myocardial infarction: a systematic review and meta-analysis. Clin. Cardiol. 42(10), 889–898 (2019).
3.
Kim LK, Yeo I, Cheung JW et al. Thirty-day readmission rates, timing, causes, and costs after ST-segment-elevation myocardial infarction in the United States: a National Readmission Database analysis 2010–2014. J. Am. Heart Assoc. 7(18), e009863 (2018).
4.
Centers for Medicare and Medicaid. Hospital Readmissions Reduction Program (HRRP) (2020). www.cms.gov/Medicare/Medicare-Fee-for-Service-Payment/AcuteInpatientPPS/Readmissions-Reduction-Program.html
5.
Sada MJ, French WJ, Carlisle DM, Chandra NC, Gore JM, Rogers WJ. Influence of payor on use of invasive cardiac procedures and patient outcome after myocardial infarction in the United States. Participants in the National Registry of Myocardial Infarction. J. Am. Coll. Cardiol. 31(7), 1474–1480 (1998).
•• This review of 17,600 acute myocardial infarction (AMI) patients found that patients without insurance were more likely to undergo both discretionary (for ‘low risk’ patients) and non-discretionary (for ‘high risk’ patients) angiography than were Medicaid patients; high-risk patients with ‘fee-for-service’ insurance were most likely to receive percutaneous coronary interventions (PCI). These authors suggested that payer status affected appropriateness of coronary interventions.
6.
Kokabi N, Xing M, Duszak R Jr, Howard DH, Camacho JC, Kim HS. Sociodemographic disparities in treatment and survival of small localized renal cell carcinoma: surgical resection versus thermal ablation. J. Comp. Eff. Res. 5(5), 441–452 (2016).
7.
Maman SR, Andreae MH, Gaber-Baylis LK, Turnbull ZA, White RS. Medicaid insurance status predicts postoperative mortality after total knee arthroplasty in State Inpatient Databases. J. Comp. Eff. Res. 8(14), 1213–1228 (2019).
8.
Bernheim SM, Spertus JA, Reid KJ et al. Socioeconomic disparities in outcomes after acute myocardial infarction. Am. Heart J. 153(2), 313–319 (2007).
9.
Downing NS, Wang C, Gupta A et al. Association of racial and socioeconomic disparities with outcomes among patients hospitalized with acute myocardial infarction, heart failure, and pneumonia: an analysis of within- and between-hospital variation. JAMA Netw. Open 1(5), e182044 (2018).
10.
Khera R, Jain S, Pandey A et al. Comparison of readmission rates after acute myocardial infarction in 3 patient age groups (18 to 44, 45 to 64, and >/= 65 years) in the United States. Am. J. Cardiol. 120(10), 1761–1767 (2017).
11.
Pandey A, Keshvani N, Khera R et al. Temporal trends in racial differences in 30-day readmission and mortality rates after acute myocardial infarction among Medicare beneficiaries. JAMA Cardiol. (2020) (Epub ahead of print).
12.
Kaplan CM, Thompson MP, Waters TM. How have 30-day readmission penalties affected racial disparities in readmissions? An analysis from 2007 to 2014 in Five US States. J. Gen. Intern. Med. 34(6), 878–883 (2019).
13.
Feng TR, Hoyler MM, Ma X, Rong LQ, White RS. Insurance status and socioeconomic markers affect readmission rates after cardiac valve surgery. J. Cardiothorac. Vasc. Anesth. 34(3), 668–678 (2020).
14.
Feng TR, White RS, Gaber-Baylis LK, Turnbull ZA, Rong LQ. Coronary artery bypass graft readmission rates and risk factors: a retrospective cohort study. Int. J. Surg. 54(Pt A), 7–17 (2018).
15.
Trivedi AN, Sequist TD, Ayanian JZ. Impact of hospital volume on racial disparities in cardiovascular procedure mortality. J. Am. Coll. Cardiol. 47(2), 417–424 (2006).
16.
Niedzwiecki MJ, Hsia RY, Shen YC. Not all insurance is equal: differential treatment and health outcomes by insurance coverage among nonelderly adult patients with heart attack. J. Am. Heart Assoc. 7(11), (2018).
•• This analysis of non-elderly AMI patients in California found that Medicaid patients were more likely than patients with private insurance to be treated at facilities capable of performing cardiac catheterization and other PCI; however, they were less likely to receive PCI.
17.
Philbin EF, Mccullough PA, Disalvo TG, Dec GW, Jenkins PL, Weaver WD. Underuse of invasive procedures among Medicaid patients with acute myocardial infarction. Am. J. Public Health 91(7), 1082–1088 (2001).
18.
Popescu I, Fingar KR, Cutler E, Guo J, Jiang HJ. Comparison of 3 safety-net hospital definitions and association with hospital characteristics. JAMA Netw. Open 2(8), e198577 (2019).
19.
La M, Tangel V, Gupta S, Tedore T, White RS. Hospital safety net burden is associated with increased inpatient mortality and postoperative morbidity after total hip arthroplasty: a retrospective multistate review, 2007–2014. Reg. Anesth. Pain Med. 44, 839–846 (2019).
20.
Lapar DJ, Bhamidipati CM, Mery CM et al. Primary payer status affects mortality for major surgical operations. Ann. Surg. 252(3), 544–550 (2010).
21.
Acharya T, Salisbury AC, Spertus JA et al. In-hospital outcomes of percutaneous coronary intervention in America’s safety net: insights from the NCDR Cath-PCI registry. JACC Cardiovasc. Interv. 10(15), 1475–1485 (2017).
• A retrospective review of 3,746,961 PCI patients from the National Cardiovascular Data Registry at 282 safety-net and 1134 non-safety-net hospitals (SNHs). Safety-net status was associated with slightly higher risk of in-hospital mortality but similar rates of other postprocedure complications.
22.
Ando T, Akintoye E, Adegbala O et al. In-hospital outcomes of ST-segment elevation myocardial infarction complicated with cardiogenic shock at safety-net hospitals in the United States (from the Nationwide Inpatient Sample). Am. J. Cardiol. 124(4), 485–490 (2019).
• An evaluation of 23,229 STEMI patients in cardiogenic shock found that patients treated at SNHs had elevated in-hospital mortality rates and reduced PCI rates relative to patients at non-SNHs.
23.
Ross JS, Cha SS, Epstein AJ et al. Quality of care for acute myocardial infarction at urban safety-net hospitals. Health Aff. (Millwood) 26(1), 238–248 (2007).
•• This study of 151,172 hospitals reported broad variation in SNH performance and characteristics, as well as significant overlap in characteristics and patient outcomes across SNH and non-SNHs.
24.
White RS, Sastow DL, Gaber-Baylis LK, Tangel V, Fisher AD, Turnbull ZA. Readmission rates and diagnoses following total hip replacement in relation to insurance payer status, race and ethnicity, and income status. J. Racial Ethnic Health Disparities 5(6), 1202–1214 (2018).
25.
Elixhauser A, Steiner C, Harris DR, Coffey RM. Comorbidity measures for use with administrative data. Med. Care 36(1), 8–27 (1998).
26.
Canto JG, Rogers WJ, French WJ, Gore JM, Chandra NC, Barron HV. Payer status and the utilization of hospital resources in acute myocardial infarction: a report from the National Registry of Myocardial Infarction 2. Arch. Intern. Med. 160(6), 817–823 (2000).
27.
Patel N, Gupta A, Doshi R et al. In-hospital management and outcomes after ST-segment-elevation myocardial infarction in Medicaid beneficiaries compared with privately insured individuals. Circ. Cardiovasc. Qual. Outcomes 12(1), e004971 (2019).
28.
Foraker RE, Rose KM, Whitsel EA, Suchindran CM, Wood JL, Rosamond WD. Neighborhood socioeconomic status, Medicaid coverage and medical management of myocardial infarction: atherosclerosis risk in communities (ARIC) community surveillance. BMC Public Health 10, 632 (2010).
29.
Lapar DJ, Bhamidipati CM, Walters DM et al. Primary payer status affects outcomes for cardiac valve operations. J. Am. Coll. Surgeons 212(5), 759–767 (2011).
30.
Wadhera RK, Bhatt DL, Wang TY et al. Association of state Medicaid expansion with quality of care and outcomes for low-income patients hospitalized with acute myocardial infarction. JAMA Cardiol. 4(2), 120–127 (2019).
•• In this retrospective review of 325,343 patients, Medicaid expansion under the Affordable Care Act was associated with lower percentages of uninsured patients but not with improved clinical outcomes, suggesting that insurance status was a less meaningful driver of postAMI complications than hypothesized.
31.
Albert MA, Ayanian JZ, Silbaugh TS et al. Early results of Massachusetts healthcare reform on racial, ethnic, and socioeconomic disparities in cardiovascular care. Circulation 129(24), 2528–2538 (2014).
32.
Ando T, Adegbala O, Akintoye E, Briasoulis A, Takagi H. The impact of safety-net burden on in-hospital outcomes after surgical aortic valve replacement. J. Card. Surg. 34(11), 1178–1184 (2019).
33.
Sanaiha Y, Rudasill S, Sareh S et al. Impact of hospital safety-net status on failure to rescue after major cardiac surgery. Surgery 166(5), 778–784 (2019).
34.
Burstin HR, Lipsitz SR, Udvarhelyi IS, Brennan TA. The effect of hospital financial characteristics on quality of care. JAMA 270(7), 845–849 (1993).
35.
Bazzoli GJ, Chen HF, Zhao M, Lindrooth RC. Hospital financial condition and the quality of patient care. Health Econ. 17(8), 977–995 (2008).
36.
Akinleye DD, Mcnutt LA, Lazariu V, Mclaughlin CC. Correlation between hospital finances and quality and safety of patient care. PLoS ONE 14(8), e0219124 (2019).
37.
Mehaffey JH, Hawkins RB, Charles EJ et al. Distressed communities are associated with worse outcomes after coronary artery bypass surgery. J. Thorac. Cardiovasc. Surg. 160(2), 425–432 (2019).
38.
Kind AJ, Jencks S, Brock J et al. Neighborhood socioeconomic disadvantage and 30-day rehospitalization: a retrospective cohort study. Ann. Intern. Med. 161(11), 765–774 (2014).
39.
Lindenauer PK, Lagu T, Rothberg MB et al. Income inequality and 30 day outcomes after acute myocardial infarction, heart failure, and pneumonia: retrospective cohort study. BMJ 346, f521 (2013).
40.
Graham GN, Jones PG, Chan PS, Arnold SV, Krumholz HM, Spertus JA. Racial disparities in patient characteristics and survival after acute myocardial infarction. JAMA Netw. Open 1(7), e184240 (2018).
41.
Barnard J, Grant SW, Hickey GL, Bridgewater B. Is social deprivation an independent predictor of outcomes following cardiac surgery? An analysis of 240,221 patients from a national registry. BMJ Open 5(6), e008287 (2015).
42.
Digiorgi PL, Baumann FG, O'leary AM et al. Mitral valve disease presentation and surgical outcome in African-American patients compared with White patients. Ann. Thorac. Surg. 85(1), 89–93 (2008).
43.
Bailey SC, Fang G, Annis IE, O'conor R, Paasche-Orlow MK, Wolf MS. Health literacy and 30-day hospital readmission after acute myocardial infarction. BMJ Open 5(6), e006975 (2015).
44.
Collins SR, Bhupal HK, Doty MM. Health insurance coverage eight years after the ACA: fewer uninsured Americans and shorter coverage gaps, but more underinsured (2019). www.commonwealthfund.org/publications/issue-briefs/2019/feb/health-insurance-coverage-eight-years-after-aca
45.
Ranasinghe I, Wang Y, Dharmarajan K, Hsieh AF, Bernheim SM, Krumholz HM. Readmissions after hospitalization for heart failure, acute myocardial infarction, or pneumonia among young and middle-aged adults: a retrospective observational cohort study. PLoS Med. 11(9), e1001737 (2014).
46.
Krumholz HM, Merrill AR, Schone EM et al. Patterns of hospital performance in acute myocardial infarction and heart failure 30-day mortality and readmission. Circ. Cardiovasc. Qual. Outcomes 2(5), 407–413 (2009).
Information & Authors
Information
Published In
Pages: 39 - 54
PubMed: 33438461
Copyright
© 2020 Future Medicine Ltd.
History
Received: 3 July 2020
Accepted: 26 October 2020
Published online: 13 January 2021
Keywords:
Topics
Authors
Metrics & Citations
Metrics
Article Usage
Article usage data only available from February 2023. Historical article usage data, showing the number of article downloads, is available upon request.
Citations
How to Cite
Social determinants of health affect unplanned readmissions following acute myocardial infarction. (2021) Journal of Comparative Effectiveness Research. DOI: 10.2217/cer-2020-0135
Export citation
Select the citation format you wish to export for this article or chapter.
Citing Literature
- Koby K. Amankwah, Orysya Soroka, Laura Pinheiro, Madeline R. Sterling, Ernest K. Amankwah, Zaid Almarzooq, Tracy Paul, Parag Goyal, Monika M. Safford, Social Determinants of Health and 30-Day Readmission After Acute Myocardial Infarction in the REGARDS Study, JACC: Advances, 10.1016/j.jacadv.2025.101584, 4, 3, (101584), (2025).
- Samuel G. Reyes, Pranav M. Bajaj, Bejan A. Alvandi, Steven S. Kurapaty, Alpesh A. Patel, Srikanth N Divi, Impact of Social Determinants of Health in Spine Surgery, Current Reviews in Musculoskeletal Medicine, 10.1007/s12178-022-09811-1, 16, 1, (24-32), (2022).
- Tamra Keeney, Minji K. Lee, Jeffrey R. Basford, Andrea Cheville, Association of Function, Symptoms, and Social Support Reported in Standardized Outpatient Clinic Questionnaires With Subsequent Hospital Discharge Disposition and 30-Day Readmissions, Archives of Physical Medicine and Rehabilitation, 10.1016/j.apmr.2022.06.004, 103, 12, (2383-2390), (2022).
- Laura Dormer, Introducing Volume 10 of the Journal of Comparative Effectiveness Research, Journal of Comparative Effectiveness Research, 10.2217/cer-2020-0244, 10, 1, (1-4), (2021).
- Kellas Cameron, Deepti Singh, When to Account for the Patient? The Effect of Clinical Treatment of Social Determinants of Health on Patient Health Outcomes, SSRN Electronic Journal, 10.2139/ssrn.3778987, (undefined).