Real-world evidence and nonrandomized data in health technology assessment: using existing methods to address unmeasured confounding?
Publication: Journal of Comparative Effectiveness Research
Health Technology Assessment (HTA) bodies are increasingly presented with submissions containing nonrandomized measures of treatment effect, including real-world evidence. The consideration of such evidence has been hampered by uncertainty surrounding the potential impact of unmeasured confounding – often leading to such data being disregarded in the decision-making process. Methods to quantitatively explore the potential impact of unmeasured confounding on estimated treatment effects exist and offer potential to support the use of nonrandomized data in HTA. This article provides an overview of these methods, highlights their underutilization in HTA and considers the steps that would be required to increase their use in this field.
Nonrandomized measures of treatment effect are increasingly being submitted to HTA bodies in the form of unanchored indirect treatment comparisons and real-world evidence (RWE) of comparative effectiveness. It is well known that the key issue with such evidence is the potential for unmeasured confounding to bias the effects observed. That is, as treatment allocation is not randomized, individuals receiving different treatments may systematically differ in ways that impact their risk of the outcome(s) under study, thereby biasing comparisons of these groups. Where these factors have been measured, confounding can be accounted for through appropriate study design and analysis. However real-world data sources are often not fit for purpose in this regard, lacking complete, high-quality measurements of all important confounders. As a result, when faced with these data, HTA bodies commonly provide qualitative descriptions of their concerns regarding the uncertainty unmeasured confounding introduces into the decision-making process and highlight concerns about the extent to which this complicates the interpretation of quantitative assessments of clinical and cost–effectiveness. In many cases the uncertainty raised can contribute to negative decisions regarding reimbursement, thereby impacting patient access to potentially cost-effective treatments.
In a field in which the quantitative synthesis of diverse data to inform decision-making is commonplace, the limited discussion of quantitative methods to explore the issue of unmeasured confounding in HTA submissions is surprising. For example, in their very useful guidelines regarding ‘the use of observational data to inform estimates of treatment effectiveness in technology appraisal’ and ‘methods for population-adjusted indirect comparisons in submissions with NICE’ the NICE Decision Support Unit gives very limited advice about how to address unmeasured confounding quantitatively, highlighting this as an area for future research [1,2]. In Germany, IQWIG’s methods guidance allows for the consideration of treatment effects from nonrandomized studies where ‘dramatic effects’ are observed, citing a relative risk of greater than 10 and statistical significance at the 1% level as an effect broadly in a range dramatic enough to be unlikely to be due to unmeasured confounding. However, IQWIG state that this is not a rigid threshold and provide little further guidance on this topic [3]. The concept of ‘dramatic effects’ appears more readily acceptable for decision-making by the German Federal Joint Committee (G-BA) than statistical adjustment methods. An analysis of past dossiers showed that, based on the argument of ‘dramatic effects’, G-BA accepted a larger proportion of unadjusted (naive) comparisons than adjusted indirect comparisons [4]. The lack of specific guidance on approaches to quantitatively explore unmeasured confounding is not limited to the UK and German guidelines [5–8].
The lack of consideration given to this area is particularly notable given that approaches to quantify the potential impact of hypothetical unmeasured confounders exist and have been under development in the field of (pharmaco)epidemiology for decades. Multiple potential approaches have been proposed over this time period, however the majority of them represent variations on a similar approach in which one assesses the impact of a suspected or hypothetical unmeasured confounder on the results observed [9]. The approaches proposed have differed in several ways. Some used external data from another source to define the strength of a suspected confounder, some assessed the impact of confounders of different strengths on the treatment effect, and still others focused on identifying the minimum strength of a confounder required to adjust an observed treatment effect to the null [9–11]. Analytic approaches have also varied. Some being deterministic, others probabilistic, some implemented in a frequentist, others in a Bayesian framework [9,12,13]. In terms of the types of treatment effects, confounders and outcomes, methods have been developed (among others) for relative risks, odds ratios, risk differences and hypothetical binary and continuous confounders [9,11,13,14]. Similar ideas have also been proposed in other areas of evidence synthesis research, quantifying for example the (hypothetical) level of bias needed to change a treatment recommendation resulting from a network meta-analysis [15].
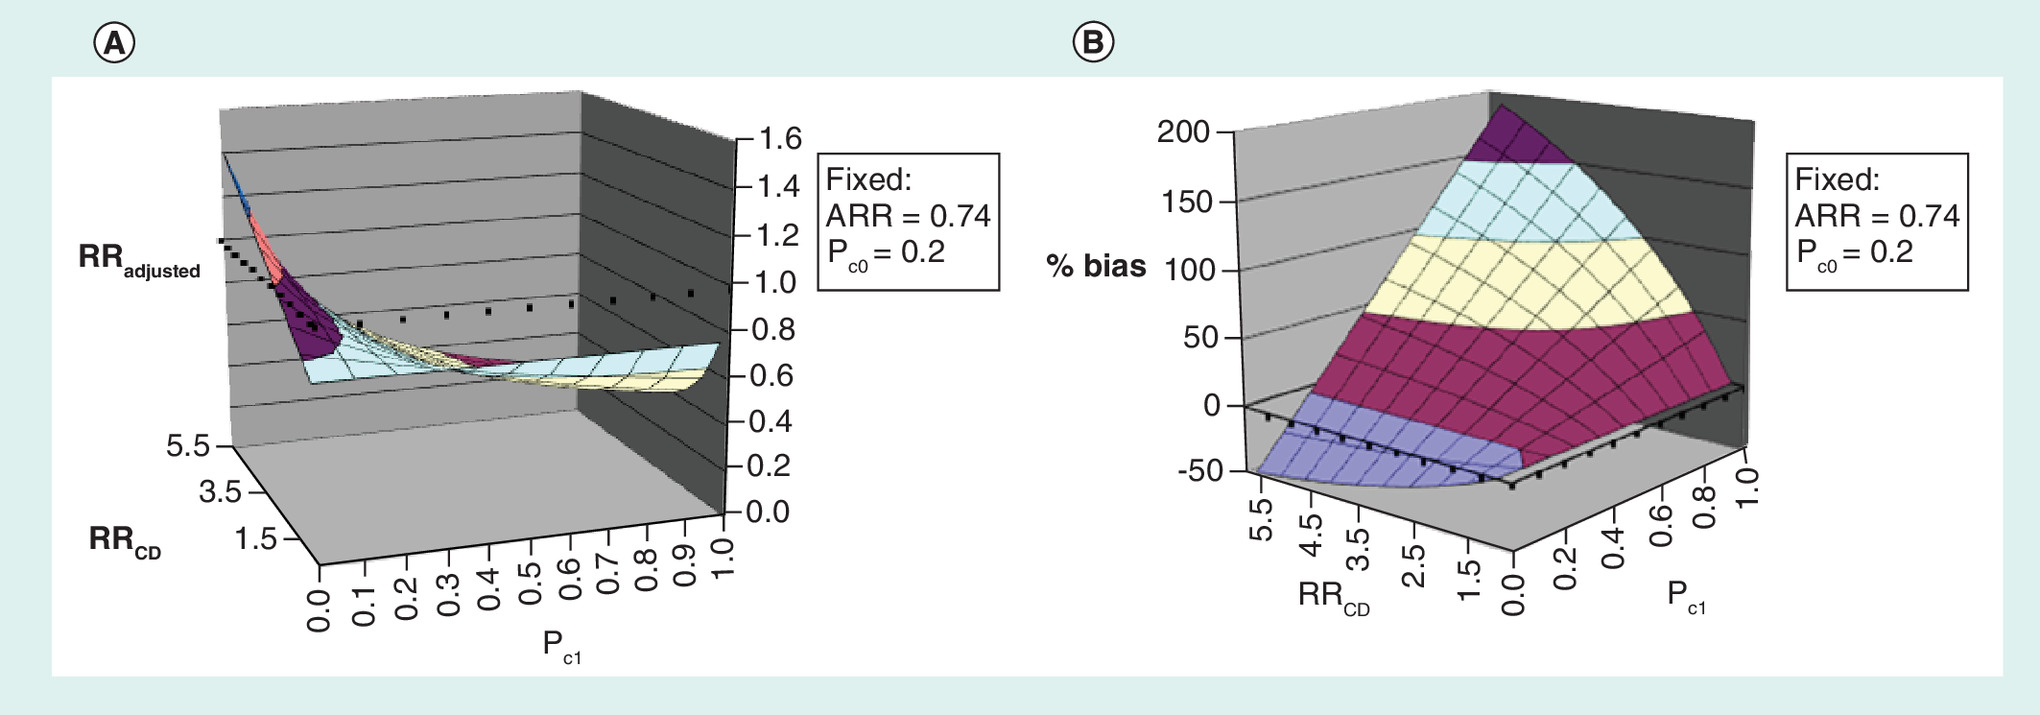
As an example of how these types of methods work, we use two of the most simple approaches mentioned above to illustrate the potential impact of unmeasured confounding in a nonrandomized study comparing the overall survival of anaplastic lymphoma kinase-positive non-small-cell lung cancer patients who received alectinib with those who received ceritinib [16]. In the study, single-arm trial data on alectinib treated patients were compared against real-world data on ceritinib treated patients from an electronic health record database. A doubly robust approach was used to account for measured confounders resulting in an adjusted hazard ratio of 0.65 (CI: 95% 0.48–0.88). In the discussion, the authors noted that unmeasured confounding may be an issue, for example, due to the absence of complete information on a key prognostic score in the electronic health record database. Since these sensitivity analysis methods are typically applied on the relative risk scale, the first step in applying them is to approximate the adjusted risk ratio (ARR) using the square-root transformation [17]. Applying the transformation to the hazard ratio (HR), we obtain an estimated ARR of 0.74. To then apply the array approach described in [9], one could assume that the prevalence of a hypothetical confounder in the unexposed group is 0.2 (20%), then for varying strengths of association between the hypothetical confounder and the disease outcomes and prevalence of the confounder in the exposed group, a fully adjusted exposure RR can be estimated (Figure 1). Additionally, the E-value as described in [11] can be calculated as, E-value = , where since ARR <1. In this example, the E-value is 2.03.This means that to explain away the ARR of 0.74 there would need to be an unmeasured confounder associated with at least 2.03-times the risk of both mortality and alectinib treatment, above and beyond the measured covariates [11]. Notably, one could also carry out the same procedures on the upper or lower bound of the CI [11].
Given the existence of these methods, the question that begs is where the hurdles lie in implementing them in existing HTA frameworks? Programmatically, operationalizing the tools should not be a major hurdle. Those HTA bodies whose decisions are based on relative effectiveness assessments could utilize one of the existing tools discussed above to pressure-test the nonrandomized measures of relative effect presented to them to an extent they are comfortable with. Those HTA bodies that use cost–effectiveness frameworks could use a similar approach or could potentially look to build the probabilistic or Bayesian sensitivity analysis approaches, mentioned above, directly into the probabilistic sensitivity analysis already found in most cost–effectiveness models submitted to HTA bodies. This would allow for the uncertainty due to unmeasured confounding to be captured alongside all of the other sources of uncertainty thereby fitting with the current decision-making framework. Some additional work may be required to ensure the outcome types typically encountered in HTA submissions can be adjusted using the appropriate methods but given the stage of development of the methodological field, one would not expect this to be an issue.
It appears that the bigger hurdle may be in setting out the framework required to govern how to parametrize the chosen tools, that is, providing answers to questions along the lines of how big of a confounder can be considered ‘unrealistic’ or ‘unlikely’? Should this be determined on an assessment-specific basis, an indication-specific basis or overall for all submissions? Should there be an onus on manufacturers to capture data from external sources in order to better inform the parameters of these analyses? Should there be an onus on the HTA bodies side to have their clinical experts determine the parameters of these sensitivity analyses? If the latter, how should expert elicitation best be carried out in practice?
Answering these questions will require careful thought on the part of multiple stakeholders and likely some sort of consultation process, however we believe that any reimbursement body committed to utilizing single-arm data and/or RWE to accelerate patient access to therapy needs to find a way to align on these questions. This may require a programme of work focused on reviewing and publicizing the tools available to quantitatively explore unmeasured confounding to the HTA audience, as we seek to begin to do with this article, and carrying out any additional methodological and conceptual work required to allow for their incorporation into decision-making frameworks. Given recent initiatives by a number of HTA bodies to better consider the potential use of RWE for HTA, now may be a pertinent time for greater focus on this area [18–22].
Financial & competing interests disclosure
This work was funded by FH-La Roche Ltd; S Ramagopalan and S Gsteiger are employees of FH-La Roche Ltd. The authors have no other relevant affiliations or financial involvement with any organization or entity with a financial interest in or financial conflict with the subject matter or materials discussed in the manuscript apart from those disclosed.
No writing assistance was utilized in the production of this manuscript.
Open access
This work is licensed under the Attribution-NonCommercial-NoDerivatives 4.0 Unported License. To view a copy of this license, visit http://creativecommons.org/licenses/by-nc-nd/4.0/
References
1.
Faria R, Hernadez Alava M, Manca A, Wailoo A. The use of observational data to inform estimates of treatment effectiveness in technology appraisal: methods for comparative individual patient data. (2015). NICE Decision Support Unit, Technical Support Document 17. http://nicedsu.org.uk/technical-support-documents/observational-data-tsd/
2.
Phillippo DM, Ades AE, Dias S, Palmer S, Abrams KR, Welton NJ. Methods for population-adjusted indirect comparisons in health technology appraisal. Med. Decis. Making 38(2), 200–211 (2018).
3.
Institute for Quality and Efficiency in Health Care. General methods (2015). https://www.iqwig.de/en/methods/methods-paper.3020.html
4.
Eichinger B, Ecker C. Indirekte Vergleiche in der frühen Nutzenbewertung in Deutschland–Erfahrungen aus den ersten 5 Jahren. Gesundh. Ökon Qual. Manag. 21(06), 279–287 (2016).
5.
Health Information and Quality Authority. Guidelines for evaluating the clinical effectiveness of health technologies in Ireland (2019). https://www.hiqa.ie/reports-and-publications/health-technology-assessment/guidelines-evaluating-clinical-effectiveness
6.
Wells G, Sultan S, Chen L. Indirect evidence: indirect treatment comparisons in meta-analysis. The Canadian agency for drugs and technologies in health (CADTH) report (2009). https://www.cadth.ca/sites/default/files/pdf/H0462_itc_tr_e.pdf
7.
Institute for Clinical and Economic Review. 2020–2023 Value Assessment Framework (2020). https://icer-review.org/wp-content/uploads/2019/05/ICER_2020_2023_VAF_013120-1.pdf
8.
Australian Department of Health. Guidelines for preparing a submission to the Pharmaceutical Benefits Advisory Committee (2016). https://pbac.pbs.gov.au/content/information/files/pbac-guidelines-version-5.pdf
9.
Schneeweiss S. Sensitivity analysis and external adjustment for unmeasured confounders in epidemiologic database studies of therapeutics. Pharmacoepidemiol. Drug Saf. 15(5), 291–303 (2006).
10.
Stürmer T, Glynn RJ, Rothman KJ, Avorn J, Schneeweiss S. Adjustments for unmeasured confounders in pharmacoepidemiologic database studies using external information. Med. Care 45(Suppl. 10), S158 (2007).
11.
Vanderweele TJ, Ding P. Sensitivity analysis in observational research: introducing the E-value. Ann. Intern. Med. 67(4), 268–274 (2017).
12.
Barrowman MA, Peek N, Lambie M, Martin GP, Sperrin M. How unmeasured confounding in a competing risks setting can affect treatment effect estimates in observational studies. BMC Med. Res. Methodol. 19(1), 166 (2019).
13.
Lash TL, Fox MP, Fink AK. Applying Quantitative Bias Analysis to Epidemiologic Data. Springer Publishing Company, Inc, NY, USA (2009).
14.
Vanderweele TJ, Arah OA. Bias formulas for sensitivity analysis of unmeasured confounding for general outcomes, treatments, and confounders. Epidemiology 22(1), 42–52 (2011).
15.
Phillippo DM, Dias S, Ades A, Didelez V, Welton NJ. Sensitivity of treatment recommendations to bias in network meta‐analysis. J. R. Stat. Soc. Ser. A Stat. Soc. 181(3), 843–867 (2018).
16.
Davies J, Martinec M, Delmar P et al. Comparative effectiveness from a single-arm trial and real-world data: alectinib versus ceritinib. J. Comp. Eff. Res. 7(9), 855–865 (2018).
17.
Vanderweele T. On a square-root transformation of the odds ratio for a common outcome. Epidemiology 28(6), e58 (2017).
18.
Murphy G. Use of real-world evidence in single-drug assessments. CADTH, Ottawa, Canada (2018). https://www.cadth.ca/use-real-world-evidence-single-drug-assessments-environmental-scan
19.
NICE. Increasing use of health and social care data in guidance development. https://www.nice.org.uk/about/what-we-do/our-programmes/nice-guidance/nice-guidelines/how-we-develop-nice-guidelines/data-and-analytics-statement-of-intent
20.
Institute for Quality and Efficiency in Health Care. Concepts for the generation of routine practice data and their analysis for the benefit assessment of drugs according to §35a Social Code Book V (2020). https://www.iqwig.de/download/A19-43_Routine-practice-data-for-the-benefit-assessment-of-drugs_Rapid-report_V1-0.pdf
21.
Hampson G, Towse A, Dreitlein WB, Henshall C, Pearson SD. Real-world evidence for coverage decisions: opportunities and challenges. J. Comp. Eff. Res. 7(12), 1133–1143 (2018).
22.
French National Authority for Health. Innovative medicines assessment action plan (2020). https://www.has-sante.fr/upload/docs/application/pdf/2020-03/innovative_medicine_action_plan_27.01.20.pdf
Information & Authors
Information
Published In
Pages: 969 - 972
PubMed: 32757772
Copyright
© 2020 Sammon et al. This work is licensed under the Attribution-NonCommercial-NoDerivatives 4.0 Unported License
History
Received: 16 June 2020
Accepted: 21 July 2020
Published online: 6 August 2020
Keywords:
Topics
Authors
Funding Information
Metrics & Citations
Metrics
Article Usage
Article usage data only available from February 2023. Historical article usage data, showing the number of article downloads, is available upon request.
Citations
How to Cite
Real-world evidence and nonrandomized data in health technology assessment: using existing methods to address unmeasured confounding?. (2020) Journal of Comparative Effectiveness Research. DOI: 10.2217/cer-2020-0112
Export citation
Select the citation format you wish to export for this article or chapter.
Citing Literature
- Alison Antoine, Katia Desroziers, Julien Dupin, David Pérol, Rémy Choquet, Enhancing confidence in complex health technology assessments by using real-world evidence: highlighting existing strategies for effective drug evaluation, BMC Medical Research Methodology, 10.1186/s12874-025-02683-2, 25, 1, (2025).
- Steven Soutar, Amy Macdougall, Jamie Wallis, Joseph E. O’Reilly, Lewis Carpenter, Flexible quantitative bias analysis for unmeasured confounding in subject-level indirect treatment comparisons with proportional hazards violation, BMC Medical Research Methodology, 10.1186/s12874-025-02551-z, 25, 1, (2025).
- Thomas P. Leahy, Isabelle Durand-Zaleski, Laura Sampietro-Colom, Seamus Kent, York Zöllner, Doug Coyle, Gianluigi Casadei, The role of quantitative bias analysis for nonrandomized comparisons in health technology assessment: recommendations from an expert workshop, International Journal of Technology Assessment in Health Care, 10.1017/S0266462323002702, 39, 1, (2023).
- Ben Bray, Sreeram V Ramagopalan, R WE ready for reimbursement? A round up of developments in real-world evidence relating to health technology assessment: part 12, Journal of Comparative Effectiveness Research, 10.57264/cer-2023-0092, 12, 7, (2023).
- Alison Antoine, David Pérol, Mathieu Robain, Suzette Delaloge, Christine Lasset, Youenn Drouet, Target trial emulation to assess real-world efficacy in the Epidemiological Strategy and Medical Economics metastatic breast cancer cohort, JNCI: Journal of the National Cancer Institute, 10.1093/jnci/djad092, 115, 8, (971-980), (2023).
- Catherine Lau, George Dranitsaris, Impact of Regulatory Approval Status on CADTH Reimbursement of Oncology Drugs and Role of Real-World Evidence on Conditional Approvals from 2019 to 2021, Current Oncology, 10.3390/curroncol29110635, 29, 11, (8031-8042), (2022).
- Alex Simpson, Sreeram V Ramagopalan, R WE ready for reimbursement? A round up of developments in real-world evidence relating to health technology assessment: part 8, Journal of Comparative Effectiveness Research, 10.2217/cer-2022-0103, 11, 13, (915-917), (2022).
- Thomas P Leahy, Stephen Duffield, Seamus Kent, Cormac Sammon, Dimitris Tzelis, Joshua Ray, Rolf HH Groenwold, Manuel Gomes, Sreeram Ramagopalan, Richard Grieve, Application of quantitative bias analysis for unmeasured confounding in cost–effectiveness modelling, Journal of Comparative Effectiveness Research, 10.2217/cer-2022-0030, 11, 12, (861-870), (2022).
- Thomas P Leahy, Seamus Kent, Cormac Sammon, Rolf HH Groenwold, Richard Grieve, Sreeram Ramagopalan, Manuel Gomes, Unmeasured confounding in nonrandomized studies: quantitative bias analysis in health technology assessment, Journal of Comparative Effectiveness Research, 10.2217/cer-2022-0029, 11, 12, (851-859), (2022).
- Frank Griesinger, Oliver Cox, Cormac Sammon, Sreeram V Ramagopalan, Sanjay Popat, Health technology assessments and real-world evidence: tell us what you want, what you really, really want, Journal of Comparative Effectiveness Research, 10.2217/cer-2021-0296, 11, 5, (297-299), (2022).