Reliability of quantitative ultrasound measurement of flexor digitorum superficialis and profundus muscles in stroke
Publication: Journal of Comparative Effectiveness Research
Abstract
Aim: This study aims to investigate reliability of quantitative ultrasound measurement of the flexor digitorum superficialis (FDS) and flexor digitorum profundus (FDP) muscles in stroke. Materials & methods: Patients with a history of stroke were recruited. FDP and FDS muscles on both upper extremities were investigated with ultrasound. Two independent assessors acquired images and analyzed them using a program and Heckmatt scale. Results: Forty-eight patients were included. The inter-rater intraclass correlation coefficient for echo intensities was calculated as 0.91 while intrarater intraclass correlation coefficient as 0.80. For Heckmatt scale, the inter-rater reliability for FDS was Kw = 0.74 (p < 0.0005) and for FDP it was Kw = 0.73 (p < 0.0005). Mean echo intensity values showed significant strong correlations with Heckmatt scores (r = 0.663 and r = 0.633 with both p values <0.001). Conclusion: Quantitative ultrasound imaging of FDS and FDP is a reliable method to demonstrate echo intensity changes of muscles in stroke.
Spasticity, which is defined as a disordered sensori-motor control, resulting from an upper motoneuron lesion, presenting as intermittent or sustained involuntary activation of muscles is one of the major causes of musculoskeletal disability in patients with chronic stroke [1]. It causes significant pain, tendon retraction or muscle weakness in patients, which significantly limits the rehabilitation potential of the patient [2]. The assessment of muscle spasticity using tools with satisfactory psychometric properties is crucial to demonstrate the outcome of interventions. Three methods exist for this purpose: assessing the resistance to passive muscle stretch, neurophysiological tests and functional outcome scales. However, none of these methods is entirely satisfactory [3].
There is growing interest in the use of quantitative high-resolution neuro muscular sonography to evaluate the textural and greyscale changes in skeletal muscles in patients with neurologic disabilities [4]. It is known that spasticity increases the adipose tissue and connective tissue within the muscle increasing echo intensity, causing the muscle to appear brighter, in the ultrasound imaging [5]. It is also a potential outcome measurement to evaluate the effectiveness of any intervention for spasticity such as botulinum toxin, and it may be more objective than subjective clinical examination or subjective patient-reported outcomes. It has been previously shown that in the lower extremity, the increased echo intensity of the muscle seems to affect the outcome of the botulinum toxin injections as well, with higher spasticity, the response to botulinum toxin decreases [6]. However, previous studies have focused on the decreased elasticity of the muscle, rather than the increase in echo intensity [7,8]. To the best of our knowledge, flexor digitorum superficialis (FDS) and flexor digitorum profundus (FDP) muscles have never been investigated within the context of quantitative ultrasound. These muscles both cause significant spasticity in finger flexors, decreasing patients’ functionality immensely. It is essential to define the extent of changes in these muscles with ultrasonography to see if they can be measured reliably, and if the prediction about the increase in their echo intensity is correct. The aim of this study is to investigate the inter-rater and intrarater reliability of quantitative sonographic analysis of the FDS and FDP muscles in stroke.
Materials & methods
Study design
This study was designed as a prospective longitudinal study with two time points for data collection.
Sample size
Power analyses were made by using G-power version 3.1 (University of Kiel, Kiel, Germany) [9]. A statistical power analysis was performed for sample size estimation, based on the pilot data of echo intensity difference from a sample of ten patients. The effect size in this study was 0.8. With an alpha = 0.05 and power = 0.80, the projected sample size needed with this effect size is approximately 45 patients, namely 45 affected and unaffected upper extremities.
Patients & setting
The study was undertaken in a tertiary rehabilitation clinic between September 2018 and December 2018. Forty-eight patients between the ages of 18–75 who have undergone a cerebrovascular event like ischemia or a hemorrhage that affected one side of the body had been included in the study. Characteristics of the patients are presented in Table 1. Patients who had received any injection to the upper extremity within the last 3 months, patients with trunk control problems that impede with sitting, patients who had symptoms of complex regional pain syndrome in the upper extremity and patients who had concomitant neuromuscular diseases that may affect echo intensity of muscles had been excluded. All the patients have given their written consent. The local ethical committee approved the study with the reference number of 09.2018.464.
| Modified Ashworth scale | Movement resistance |
|---|---|
| 0 | No increased resistance |
| 1 | Minimal resistance at the end of range of motion |
| 1+ | Minimal resistance throughout less than half of the range of motion |
| 2 | Clear resistance throughout most of the range of motion |
| 3 | Strong resistance, passive movement is difficult |
| 4 | Rigid finger flexion |
Outcome assessments
Evaluation of patient characteristics
Patients’ age, sex, weight, height, etiology of the stroke, dominant upper extremity and period since the cerebrovascular event were recorded. Patients’ finger flexor spasticity was measured by the modified Ashworth scale (MAS). MAS was chosen on the basis of its practicality. MAS is described as the degree of quick passive movement and its evaluation is given in Table 1 [10]. Patients’ motor recovery was assessed by the Fugl–Meyer upper extremity assessment scale. This scale consists of seven subscales, one of them is a scale that evaluates hand function over a score of 14, which assess each movement as 0: no movement, 1: partial movement and 2: full movement. Patients can have a maximum of 66 from this assessment, which indicates a full motor recovery in the upper extremity [11]. The clinical evaluations were performed by a single physical medicine and rehabilitation physician who has at least 10 years of experience, blind to the ultrasonographic assessments.
Ultrasonographic assessment
The same ultrasound system (General Electric Logiq 5, IL, USA, pro machine with a 6–18 MHz linear array probe) had been used for all ultrasonographic measurements. The image settings, time gain compensation, depth and sector size were kept constant for all analyses. The probe preset was general. Gain was set at 64%, depth at 6 cm. Patients were seated on the examination table with a standardized resting position of the upper extremity, without any movement in the finger flexors. B-mode ultrasound measurements were done bilaterally, in the same cross-sectional transverse plane for both FDS and FDP, mid-forearm, halfway from the ventral midline to the medial border of the forearm in the anterior aspect with minimal pressure [8]. The cross-sectional areas were obtained from images taken from this spot. The probe was placed perpendicular to the skin achieving full contact for optimal view of the muscles underneath. For inter-rater and intrarater reliability, two physical medicine and rehabilitation physician with at least 5 years of experience in musculoskeletal ultrasonography who were blind to the clinical assessment and blind to each other’s assessments have performed two separate measurements on the same day an hour apart, and the first clinician performed the measurements 24 h after the initial assessment. The arithmetic means of these three measurements for echo intensity were used in the final analyses.
For echo intensity analyses, FDP and FDS were visually cut out separately as region of interests in the exported jpg files of all three measurements (Figure 1). The fascia between the two muscles that contains the median nerve was used as an anatomical reference point, depicting the muscle above is FDS and the muscle below is FDP. Quantitative echo intensity measurements were done by Matlab 2016b (The MathWorks, Inc., MA, USA) using these image files with a specific algorithm designed for this purpose based on the method developed by Nielsen et al. [12]. First, the obtained images underwent a noise-reduction procedure to reduce single-pixel noise with this algorithm. Then, the images’ echo intensity were calculated based on the fact that each image consisted of 512 × 512 pixels with grey-scale values ranging from 0 to 255, 0 marking the darkest pixel and 255 marking the brightest pixel. Mean echo intensity values were calculated based on this analysis for each image, higher values indicating higher echo intensity.

Heckmatt scale
The muscle echo intensity was also qualitatively evaluated using the Heckmatt scale by the same clinicians who performed the ultrasound. Developed in 1982, Heckmatt scale evaluates the echo intensity of the muscle as follows: grade I is normal, grade II represents an increase while bone echo is still distinct, grade III indicates a marked increase, with a reduced bone echo and grade IV indicates a very high echo intensity and a complete loss of bone echo (Figure 2) [13].
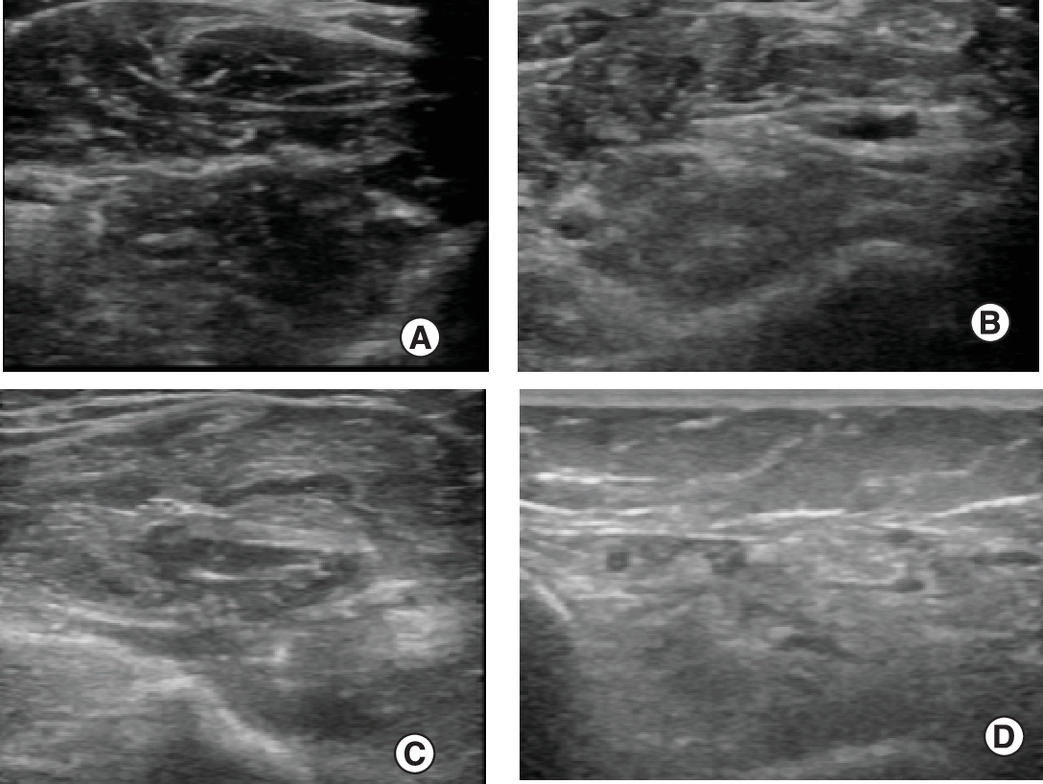
Figure 2. Heckmatt scale.
(A) Grade I. (B) Grade II. (C) Grade III. (D) Grade IV.
Statistical analyses
All statistical tests were performed using IBM SPSS® statistics software program (IBM Corp., NY, USA; formerly SPSS, Inc., IL, USA) for Mac v. 20.0. Descriptive statistics were performed to describe patients’ characteristics. Histogram and normality plots and Shapiro–Wilk test were used to test the normality of data. The inter-rater and intrarater reliability of echo intensity measurements were estimated using the two-way mixed intraclass correlation coefficient (ICC) since the raters are the same for every patient. Let MSBP and MSRes be the respective between-people mean squares and residual mean squares. Then the formula for the ICC would be [14]. The values of the ICC ranged from 0 to 1 with a higher value indicating better reliability. The ICC < 0.40 was considered as poor; 0.40–0.59 as fair; 0.60–0.74 as good; and 0.75–1.00 as excellent [15]. The inter-rater correlation of Heckmatt scores was analyzed by using weighted Kappa since Heckmatt score is a categorical value and weighted Kappa is suitable for measuring reliability in categorical items [16]. Independent samples t-test was used for between group comparisons. For between group comparisons for echo intensity values, Heckmatt scales 1 & 2 and 3 & 4 were grouped together. This grouping was preferred because in patients with Heckmatt 3 and 4, the visible contrast significantly increases and bone reflection starts to decrease. This will help separate patients with more prominent changes from patients with more subtle changes [13]. Since Heckmatt scale is a subjective measurement, we wanted to investigate its correlation to the objective quantitative analyses’ measurements. For this purpose Heckmatt stages and echo intensity, Spearman correlation analysis was used.
Results
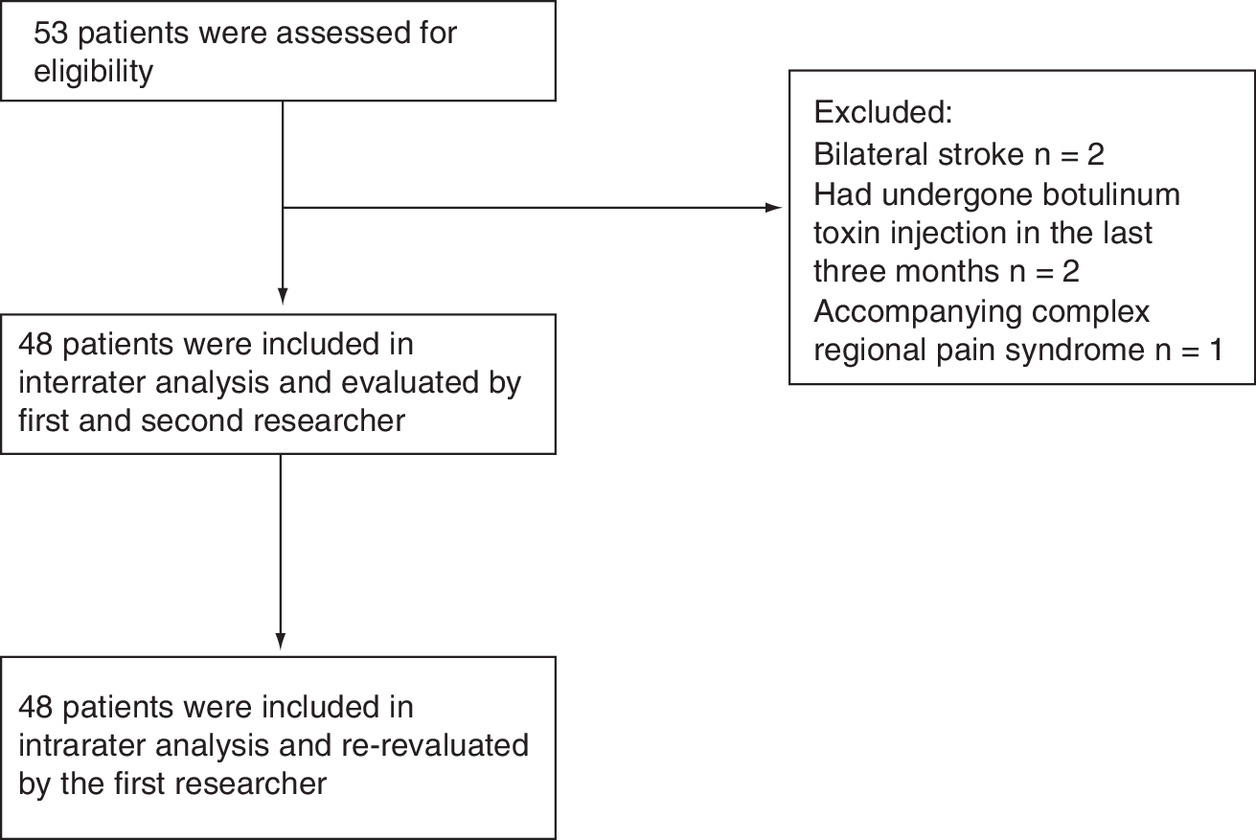
Among 53 patients, 48 met inclusion criteria and were included in the study (Figure 3). Spasticity and motor involvement status of the patients are given in Table 2. Ultrasonographic characteristics of the patients are given in Table 3. There were significant differences between the cross-sectional area and echo intensity values between affected and unaffected sites (p > 0.005) and are given in Table 4.
| Characteristic | Patients (n = 48) |
|---|---|
| Mean age ± SD (min–max) (years) | 55 ± 13.70 (18–75) |
| Male n (%) | 30 (62.5%) |
| Mean BMI ± SD (min–max) (kg/m2) | 26.89 ± 4.23 (18.37–38.28) |
| Ischemic n (%) | 38 (79.2%) |
| Right side involvement n (%) | 23 (47.9%) |
| Mean time since stroke ± SD (min–max) (months) | 40.17 ± 34.44 (3–144) |
Max: Maximum; Min: Minimum; SD: Standard deviation.
| Spasticity degree according to MAS | Patients n (%) |
|---|---|
| 0 | 6 (12.5%) |
| 1 | 7 (14.6%) |
| 1+ | 6 (12.5%) |
| 2 | 6 (12.5%) |
| 3 | 23 (47.9%) |
| Mean Fugl–Meyer total score ± SD (min–max) | 27.74 ± 20.05 (0–66) |
| Mean Fugl–Meyer hand function score ± SD (min–max) | 5.70 ± 4.52 (0–14) |
MAS: Modified Ashworth scale; Max: Maximum; Min: Minimum; SD: Standard deviation.
| Ultrasonographic measurement | Normal side | Affected side | p-value |
|---|---|---|---|
| Mean echo intensity of FDS ± SD (95% CI) | 82.47 ± 17.99 (77.02–87.09) | 97.1 ± 18.10 (92.12–102.52) | p < 0.001 |
| Mean echo intensity of FDP ± SD (95% CI) | 82.59 ± 23.56 (76.06–89.54) | 97.48 ± 22.83 (91.54 ± 104.02) | p < 0.001 |
| Mean CSA of FDS ± SD (95% CI) mm2 | 450.72 ± 79.00 (428.95–472.19) | 382.56 ± 186.50 (336. 26–446.17) | p < 0.001 |
| Mean CSA of FDP ± SD (95% CI) mm2 | 530.98 ± 122.19 (496.86–566.63) | 468.27 ± 152.18 (425.57–510.11) | p < 0.001 |
CSA: Cross-sectional area; FDP: Flexor digitorum profundus; FDS: Flexor digitorum superficialis; SD: Standard deviation.
The inter-rater reliability ICC was calculated as 0.91 (95% CI: 0.87–0.95), while intrarater reliability ICC as 0.80 (95% CI: 0.68–0.88) showing both excellent correlations between all of the quantitative ultrasonographic measurements performed. The inter-rater reliability for affected FDS ICC was 0.76 (95% CI: 0.56–0.86), while intrarater reliability ICC was 0.82 (95% CI: 0.68–0.90). These values were ICC = 0.95 (95% CI: 0.91–0.97) and ICC = 0.95 (95% CI: 0.92–0.98) for the unaffected side FDS. For the affected FDP the inter-rater reliability ICC was 0.96 (95% CI: 0.93–0.98) and the intrarater reliability ICC was 0.96 (95% CI: 0.94–0.98). For the unaffected side these values were ICC = 0.96 (95% CI: 0.92–0.98) and ICC = 0.97 (95% CI: 0.94–0.98).
For Heckmatt scale, the inter-rater reliability for FDS was calculated as Kw = 0.74 (95% CI: 0.59–0.89; p < 0.0005) and for FDP it was Kw = 0.73 (95% CI: 0.58–0.89; p < 0.0005) showing good to very good agreement between evaluators.
Mean echo intensity values of FDS and FDP showed significant strong correlations with Heckmatt scores (r = 0.663 and r = 0.633 with both p values <0.001, respectively).
Table 5 shows mean differences of quantitative muscle sonographic analysis values among Heckmatt stages 1 & 2 and 3 & 4. Statistically significant differences were detected between Heckmatt stages 1 & 2 and 3 & 4 in terms of echo intensity (p > 0.05).
| Ultrasonographic measurement | Heckmatt 1 and 2 | Heckmatt 3 and 4 | Mean difference | Standard error of difference | p-value and 95% CI |
|---|---|---|---|---|---|
| Mean FDS echo intensity (SD) | n = 19 85.49 (9.34) | n = 25 104.57 (19.13) | 18.08 | 4.77 | p < 0.0005 (8.43–27.72) |
| Mean FDP echo intensity (SD) | n = 13 77.81 (18.65) | n = 31 106.20 (19.82) | 28.39 | 6.44 | p < 0.0005 (15.39–41.39) |
FDP: Flexor digitorum profundus; FDS: Flexor digitorum superficialis; SD: Standard deviation.
Discussion
Echo intensity is an apparent change that is seen on ultrasonographic assessment but quantifying the exact amount of deviation from normal have been challenging. Heckmatt score is a reliable and easy method of documenting muscular architecture in ultrasound, but although it is traditionally classified as a semiquantitative score, it is subjective in nature [17]. This study had demonstrated that in patients with stroke, the echo intensity of the FDS and FDP muscles were affected, it can be measured in a reliable manner, and this could be demonstrated quantitatively. Quantitative measurements strongly correlate with qualitative Heckmatt scores as well.
Previous reliability studies about quantitative muscle echo intensity were done with patients with other neuromuscular diseases such as Duchenne muscular dystrophy and patients with critical illness myopathy and showed similar high intrarater and inter-rater ICC values for echo intensity measurements [4,18]. Echo intensity has been less studied in patients with chronic stroke, and it was not studied for FDS and FDP muscles. Previous literature about patients with stroke who were evaluated with Heckmatt scale involves only the gastrocnemius muscle without a reliability study or correlation with quantitative ultrasound [19]. Other studies that evaluated the upper extremities in patients with chronic stroke focused on the quantification of elastography with methods like sonoelastography and shear wave elastography, and investigated the biceps brachii alone [20–22]. These studies did not utilize Heckmatt scores and did not investigate its relationship with echo intensity parameters. This study can be considered a pioneer in this regard. FDS and FDP muscles were chosen according to the clinical observations during US-guided botulinum toxin injections due to their noticeable intensity changes. Moreover, they are essential targets in improving hand function and are frequent targets in such injections. Other common targets like flexor carpi radialis, flexor carpi ulnaris and pronator teres muscles did show similar changes albeit on a lesser scale according to observation. But according to the results of this study, these commonly involved muscles must also be investigated in the future for potential changes. The relationship of the echo intensity properties of the muscles in chronic stroke and clinical parameters is not studied extensively either, rather, relationships with clinical parameters such as spasticity levels and functional impairment and elastographic measurements have been shown [21]. The population of this study is not enough to determine if there are any relationships of echo intensity with clinical parameters exist. A wider population study should be helpful in this regard.
Another distinguishing feature of this study is that a simple B-mode ultrasonographic image had been used for analysis. With the help of a simple, yet useful computer code, anyone can perform a quantified analysis of the images obtained from an ultrasound device, without the need for purchasing another expensive software developed specifically for an ultrasound machine unlike elastography. It is an easy and reliable method and can be easily adapted to any muscle that can be investigated via ultrasound. Heckmatt scores can also be used according to the results of this study since they are reliable and correlate well with quantitative ultrasound, but it must be kept in mind that it may fall short in documenting subtle changes in muscle after an intervention, due to its cruder nature. In the end, it only has four subcategories to evaluate muscle echo intensity, and it is still decided with naked eye. One advantage of Heckmatt score is that it does not need any further offline analyses such as quantitative echo intensity and therefore is more practical in a daily, clinical basis. With these properties it can be helpful for both clinicians and researchers alike.
This study has several limitations. First, it is aimed to determine the inter-rater and intrarater reliability and therefore designed as a cross-sectional study. The ability to show longitudinal differences in muscle cannot be determined for neither quantitative echo intensity nor Heckmatt scale with such a design. Prospective studies would be helpful in this regard. Also, due to the subjective and categorical nature of the Heckmatt scale, and the impossibility to eliminate rater bias, only a single image was evaluated for inter-rater and intrarater echo intensity analyses and repeatability was aimed with an intrarater analysis. This was not an ideal approach but was necessary. Second, the ability of ultrasonographic investigations to show clinical changes were considered beyond the concept of this study. Larger population studies involving patients with several stages of stroke will be helpful to show if ultrasonography can help to determine the clinical staging of the patients’ spasticity or functional levels. Last but not least, the use of MAS as a spasticity assessment is not ideal due to its low reliability and validity [23,24]. However, it is still widely accepted as a practical spasticity evaluation method. This study has focused on an imaging modality and its reliability, so a more practical spasticity assessment was chosen as a descriptive measurement. However, to increase the reliability of ultrasonographic measurements and their relationship, a more valid spasticity assessment can be investigated in the future.
Conclusion
The echo intensities of FDS and FDP muscles can be reliably measured with both Heckmatt scale and quantitative ultrasonography in patients with chronic stroke.
Future Perspective
Heckmatt scale and quantitative ultrasound analyses can be a useful adjunct in assessing spasticity and documenting changes in muscle in patients with stroke.
•
Quantitative ultrasound is a direct measurement of the architecture of muscle, different from the existing subjective spasticity evaluation methods. Therefore, it is an objective candidate for evaluating the effectiveness of any intervention for spasticity such as botulinum toxin injections.
•
Forty-eight patients with a history of chronic stroke were recruited and their forearms were investigated via ultrasound by two independent researchers.
•
Obtained images were analyzed quantitatively using computer analyses and Heckmatt scale.
•
The inter-rater reliability intraclass correlation coefficient was calculated as 0.91 (95% CI: 0.87–0.95), while intrarater reliability intraclass correlation coefficient as 0.80 (95% CI: 0.68–0.88) showing both excellent correlations between quantitative ultrasonographic measurements for all muscles measured.
•
For Heckmatt scale, the inter-rater reliability for flexor digitorum superficialis was calculated as Kw = 0.74 (95% CI: 0.59–0.89; p < 0.0005) and for flexor digitorum profundus it was Kw = 0.73 (95% CI: 0.58–0.89; p < 0.0005) showing good to very good agreement between evaluators.
•
Flexor digitorum superficialis and flexor digitorum profundus muscles have higher echo intensities in patients with chronic stroke, which can be quantitatively measured with both computerized systems and Heckmatt scoring in a reliable and easy fashion.
Author contributions
Authors E Karadag-Saygi, O Kenis-Coskun, I Yagci, E Giray and K Gencer-Atalay were responsible for study conception and design. Authors I Yagci and O Kenis-Coskun were responsible for acquisition of data. Authors E Giray, E Karadag-Saygi and K Gencer-Atalay were responsible for data analysis, and drafting and revision of the manuscript.
Acknowledgments
We want to thank B Kenis for his help in developing the code required for echo intensity analyses and his support throughout the process.
Financial & competing interests disclosure
The authors have no relevant affiliations or financial involvement with any organization or entity with a financial interest in or financial conflict with the subject matter or materials discussed in the manuscript. This includes employment, consultancies, honoraria, stock ownership or options, expert testimony, grants or patents received or pending, or royalties.
No writing assistance was utilized in the production of this manuscript.
Ethical conduct of research
All procedures followed were in accordance with the ethical standards of the responsible committee on human experimentation (institutional and national) and with the Helsinki Declaration of 1964 and later versions. All the patients have given their written consent. The local ethical committee approved the study with the number of 09.2018.464.
References
1.
Pandyan AD, Gregoric M, Barnes MP et al. Spasticity: clinical perceptions, neurological realities and meaningful measurement. Disabil. Rehabil. 27(1–2), 2–6 (2005).
2.
Duncan PW, Zorowitz R, Bates B et al. Management of adult stroke rehabilitation care: a clinical practice guideline. Stroke 36(9), e100–e143 (2005).
3.
Bakheit AM, Maynard VA, Curnow J, Hudson N, Kodapala S. The relation between Ashworth scale scores and the excitability of the alpha motor neurones in patients with post-stroke muscle spasticity. J. Neurol. Neurosurg. Psych. 74(5), 646–648 (2003).
4.
Sarwal A, Parry SM, Berry MJ et al. Interobserver reliability of quantitative muscle sonographic analysis in the critically Ill population. J. Ultrasound Med. 34(7), 1191–1200 (2015).
5.
Pillen S, Van Keimpema M, Nievelstein RA, Verrips A, Van Kruijsbergen-Raijmann W, Zwarts MJ. Skeletal muscle ultrasonography: visual versus quantitative evaluation. Ultrasound Med. Biol. 32(9), 1315–1321 (2006).
6.
Picelli A, Bonetti P, Fontana C et al. Is spastic muscle echo intensity related to the response to botulinum toxin type A in patients with stroke? A cohort study. Arch. Phys. Med. Rehab. 93(7), 1253–1258 (2012).
7.
Wu CH, Ho YC, Hsiao MY, Chen WS, Wang TG. Evaluation of post-stroke spastic muscle stiffness using shear wave ultrasound elastography. Ultrasound Med. Biol. 43(6), 1105–1111 (2017).
8.
Yaşar E, Adigüzel E, Kesikburun S et al. Assessment of forearm muscle spasticity with sonoelastography in patients with stroke. Br. J. Radiol. 89(1068), 20160603 (2016).
9.
Faul F, Erdfelder E, Lang AG, Buchner A. G*Power 3: a flexible statistical power analysis program for the social, behavioral, and biomedical sciences. Behav. Res. Methods 39(2), 175–191 (2007).
10.
Bohannon RW, Smith MB. Interrater reliability of a modified Ashworth scale of muscle spasticity. Phys. Ther. 67(2), 206–207 (1987).
11.
Sullivan KJ, Tilson JK, Cen SY et al. Fugl-Meyer assessment of sensorimotor function after stroke: standardized training procedure for clinical practice and clinical trials. Stroke 42(2), 427–432 (2011).
12.
Nielsen PK, Jensen BR, Darvann T, Jørgensen K, Bakke M. Quantitative ultrasound tissue characterization in shoulder and thigh muscles--a new approach. BMC Musculoskelet. Disord. 7, 2 (2006).
13.
Heckmatt JZ, Leeman S, Dubowitz V. Ultrasound imaging in the diagnosis of muscle disease. J. Pediatrics 101(5), 656–660 (1982).
14.
Shrout PE, Fleiss JL. Intraclass correlations: uses in assessing rater reliability. Psychol. Bull. 86(2), 420–428 (1979).
15.
Gstoettner M, Sekyra K, Walochnik N, Winter P, Wachter R, Bach CM. Inter- and intraobserver reliability assessment of the Cobb angle: manual versus digital measurement tools. Eur. Spine J. 16(10), 1587–1592 (2007).
16.
Mchugh ML. Interrater reliability: the kappa statistic. Biochem. Med. (Zagreb) 22(3), 276–282 (2012).
17.
Brockmann K, Becker P, Schreiber G, Neubert K, Brunner E, Bönnemann C. Sensitivity and specificity of qualitative muscle ultrasound in assessment of suspected neuromuscular disease in childhood. Neuromusc. Disord. 17(7), 517–523 (2007).
18.
Zaidman CM, Wu JS, Wilder S, Darras BT, Rutkove SB. Minimal training is required to reliably perform quantitative ultrasound of muscle. Muscle Nerve 50(1), 124–128 (2014).
19.
Cho KH, Lee HJ, Lee WH. Intra- and inter-rater reliabilities of measurement of ultrasound imaging for muscle thickness and pennation angle of tibialis anterior muscle in stroke patients. Topics Stroke Rehab. 24(5), 368–373 (2017).
20.
Gao J, He W, Du LJ et al. Quantitative ultrasound imaging to assess the biceps brachii muscle in chronic post-stroke spasticity: preliminary observation. Ultrasound Med. Biol. 44(9), 1931–1940 (2018).
21.
Lee SS, Spear S, Rymer WZ. Quantifying changes in material properties of stroke-impaired muscle. Clin. Biomechanics 30(3), 269–275 (2015).
22.
Aşkın A, Kalaycı ÖT, Bayram KB et al. Strain sonoelastographic evaluation of biceps muscle intrinsic stiffness after botulinum toxin-A injection. Topics Stroke Rehab. 24(1), 12–17 (2017).
23.
Ansari NN, Naghdi S, Moammeri H, Jalaie S. Ashworth Scales are unreliable for the assessment of muscle spasticity. Physiother. Theory Pract. 22(3), 119–125 (2006).
24.
Fleuren JF, Voerman GE, Erren-Wolters CV et al. Stop using the Ashworth scale for the assessment of spasticity. J. Neurol. Neurosurg. Psych. 81(1), 46–52 (2010).
Information & Authors
Information
Published In
Pages: 1293 - 1300
PubMed: 33325276
Copyright
© 2020 Future Medicine Ltd.
History
Received: 12 June 2020
Accepted: 22 September 2020
Published online: 16 December 2020
Keywords:
Topics
Authors
Metrics & Citations
Metrics
Article Usage
Article usage data only available from February 2023. Historical article usage data, showing the number of article downloads, is available upon request.
Citations
How to Cite
Reliability of quantitative ultrasound measurement of flexor digitorum superficialis and profundus muscles in stroke. (2020) Journal of Comparative Effectiveness Research. DOI: 10.2217/cer-2020-0105
Export citation
Select the citation format you wish to export for this article or chapter.
Citing Literature
- Yu-Ying Li, Wei Liu, Chang-Liang Luo, Shi-Fu Feng, Hui-Dong Wu, Lu Li, Shao-Chun Chen, Christina Zong-Hao Ma, Reliability of muscle architecture assessment using clinical ultrasound in post-stroke patients: a systematic review, BMC Musculoskeletal Disorders, 10.1186/s12891-025-09294-4, 26, 1, (2025).
- Ève Boissonnault, April Hyon, Michael C. Munin, Mirko Filippetti, Alessandro Picelli, Chloe Haldane, Rajiv Reebye, Assessing muscle architecture with ultrasound: implications for spasticity, European Journal of Translational Myology, 10.4081/ejtm.2024.12397, (2024).
- Omid Nabavizadeh, Ashley A. Herda, Sex-Related Differences of Weight Bearing and Non-Weight Bearing Muscle Properties, Muscles, 10.3390/muscles2040031, 2, 4, (400-412), (2023).
- Phongpan Tantipoon, Nuttaporn Praditpod, Markus Pakleppa, Chunhui Li, Zhihong Huang, Characterization of Flexor Digitorum Superficialis Muscle Stiffness Using Ultrasound Shear Wave Elastography and MyotonPRO: A Cross-Sectional Study Investigating the Correlation between Different Approaches, Applied Sciences, 10.3390/app13116384, 13, 11, (6384), (2023).
- Preeti Raghavan, Alexandra Gordon, Ryan Roemmich, Antonio Stecco, Treatment of Focal Muscle Stiffness with Hyaluronidase Injections, Spasticity and Muscle Stiffness, 10.1007/978-3-030-96900-4_13, (263-286), (2022).