Assessing the robustness of direct meta-analysis in the presence of heterogeneity
Abstract
Aim: To assess robustness of findings in recent systematic reviews of atypical antipsychotics in schizophrenia patients in the presence of heterogeneity. Methods: Relative efficacy was measured in seven direct comparisons of mean difference (MD) in average positive and negative syndrome scale total score and comparisons between conventional meta-analysis results and four alternate meta-analytic strategies using the difference in MD (ΔMD). Results: MDs in positive and negative syndrome scale total score were smaller in the conventional meta-analyses than those for three of the four analytic strategies. Such differences were small (all ΔMD <4). No considerable differences in effect size were observed in the limit meta-analysis comparison (|ΔMD| <1). Conclusion: The analyses validated the systematic review results and demonstrate the value of confirmatory sensitivity analysis.
Schizophrenia is a chronic and disabling severe mental disorder affecting more than 21 million people worldwide [1]. There are, however, effective treatments for schizophrenia, and people affected by it can lead a productive life and be integrated in society [1]. Second-generation (‘atypical’) antipsychotics (SGAs) have become ever more popular as the first-line drug treatment for people with schizophrenia [2]. However, there is continuing debate as to how far the SGAs improve these outcomes compared with conventional antipsychotics [2–4]. Previous reviews have noted considerable heterogeneity in analyses of SGAs [5–7]. In addition, substantial heterogeneity has been documented between the results of trials evaluating the same atypical antipsychotic and comparator drugs [2,8,9].
Where heterogeneity exists, including all trials may produce a biased estimate. Deeks and colleagues [10] highlight the importance of considering the appropriateness of combining studies in meta-analysis in order to produce an unbiased summary statistic for the overall effectiveness of treatment, a sentiment shared by many researchers [11–15]. Furthermore, the Cochrane Collaboration recommends restricting meta-analyses to trials at low risk of bias, which may result in an imprecise estimate, or stratifying meta-analyses according to risk of bias [14,16]. However, Dechartres and colleagues [17] highlighted a recent study which revealed that these recommendations are rarely followed, with only 11% of systematic reviews considering assessment of bias risk in meta-analyses.
A further problem, known as the file-drawer effect, refers to the susceptibility of meta-analysis to publication bias. That is, the concern that some studies remain unpublished or are published in lower impact, less traceable journals, particularly those studies which did not achieve statistical significance [18–21]. Small studies are more vulnerable to such bias than larger studies since they require observation of a larger treatment effect to be declared statistically significant [21]. The greater expense and time invested in larger studies, utilizing a higher standard of methodology, may increase the likelihood of their publication, even if they observe a negative treatment effect. This adds further to the bias problem [21]. Small-study effects is a term which has been used to describe the tendency of small studies to show larger treatment effects than those in larger studies [14,20–23]. Dechartres et al. [17] noted a recent study which found that this tendency also concerned moderate-sized trials both when considering trial absolute sample size and relative sample size, raising the question of whether meta-analyses should be restricted to larger trials (or even to the largest trial). The authors highlight an alternative approach to deal with small-study effects, using meta-analysis models adjusted for small-study effects by predicting treatment outcomes for a trial of infinite size within a meta-analysis, called ‘limit meta-analysis’.
Although some reviewers attempted to understand the origins of this heterogeneity by performing subset analyses or meta-regression, sensitivity analyses are not routinely performed. Recently, Dechartres and colleagues [17] used a four-pronged assessment implementing the approaches discussed above to assess the robustness of the findings in a large body of meta-analyses. The purpose of this study is to apply the approaches of Dechartres et al. [17] to recent systematic literature reviews investigating the effects of atypical antipsychotics in schizophrenia to assess the robustness of findings and subsequent conclusions.
Methods
Data
An initial search of the Cochrane Database of Systematic Reviews was conducted using the terms ‘schizophrenia’ and ‘atypical antipsychotics’. Of interest were reviews containing greater than five trials, in other words, of sufficient size to apply the analytic approaches described in Dechartres et al. [17]. Six reviews [2–4,24–26] were selected as potentially suitable, each comparing one atypical antipsychotic (clozapine, quetiapine, aripiprazole, ziprasidone, olanzapine or risperidone) to other atypical antipsychotics available at the time of review. End point availability was cross-referenced between the studies for each direct comparison. Where direct comparisons overlapped between reviews, for example, risperidone versus olanzapine [4] and olanzapine versus risperidone [25], the comparison in the most recent review was selected for analysis (i.e., in this example, Komossa et al. [4]), assuming that this approach should include a more complete representation of the available evidence. Excluding those comparisons with less than five studies, seven unique direct comparisons from three Cochrane reviews qualified for analysis. These include aripiprazole versus clozapine, quetiapine, risperidone, ziprasidone, and olanzapine; quetiapine versus risperidone; and risperidone versus olanzapine.
Outcome definition
The positive and negative syndrome scale (PANSS) [27] was chosen as the end point of interest for analysis, given its clinical importance in the area of schizophrenia, its use of a standardized scoring system, and its popularity in the field. This schizophrenia scale has 30 items, each defined on a seven-point scoring system (1 = absent; 7 = extreme) [2]. It constitutes four scales measuring positive and negative syndromes, their differential, and general severity of illness. A low score indicates lesser severity.
The extracted data used for this analysis (presented in Supplementary Tables 1–7) are the average end point PANSS total scores in the short term, defined as 12 weeks or less [2–4].
Statistical analysis
All analyses were performed by using R statistical software [28]. As well as the conventional random-effects meta-analysis of all trials that was reproduced using R, four approaches used to assess the robustness of meta-analysis in the presence of heterogeneity were also applied to each direct comparison [17]. The analytic approaches (described in Table 1) and all comparisons of results between approaches were defined a priori.
| Strategy | Overview of analytic strategy | Additional methods detail | Advantages | Disadvantages |
|---|---|---|---|---|
| Conventional meta-analysis | Includes all trials identified for each Cochrane direct treatment comparison, respectively | N/A | Includes the complete evidence base | Results may be influenced by heterogeneity and/or bias |
| Single most precise trial | Analyzes only the trial with the narrowest CI | N/A | Most precise estimate available from identified trials Can be informative when limited resources are available to conduct a systematic review, providing the trial is adequately powered [29] | Reduced evidence base, may introduce bias and lose precision in the estimation of the true treatment effect Can result in a much smaller sample size Focuses on population/setting for only one trial |
| Restricted to largest trials | A conventional meta-analysis restricted to include only the trials with the largest 25% of sample size within a meta-analysis. | Includes only trials within quarter four when all trials are placed in sample size order. | Less likely to be influenced by bias which may be observed within smaller trials Treatment effect estimates reported in large trial may be closer to the real life true treatment effect because they are likely to be more pragmatic, have wider eligibility criteria, and have greater variability in interventions [30] | Reduced evidence base, may introduce bias and lose precision |
| Limit meta-analysis | A limit meta-analysis that includes all trials and adjusts for small-study effects, as described by Rucker et al. [31] and implemented in R by Schwarzer et al. [32]. | Briefly, the methods are based on regression tests whereby the intercept of the regression line is used to estimate treatment effect for a hypothetical study of infinite size (in other words, with infinite precision), thus adjusted for small-study effects [17,22] Rucker and colleagues combined this approach with a shrinkage procedure [22,31]. The underlying model is an extended random-effects model which allows the effect to be influenced by the standard error and so accounts for possible small-study effects [22]. | Includes the complete evidence base Adjusts for small-study effects | Works poorly with respect to both size and power for treatment comparisons including a low number of trials [23] |
| Restricted to trials at a low risk of bias | A conventional meta-analysis restricted to trials with a low risk of attrition bias (incomplete outcome data) according to the Cochrane risk of bias tool. | Dechartres et al. [17] classified studies based on key domains to give an overall risk of bias for the trials. However, under such classifications, all the trials for all direct treatment comparisons identified for inclusion in these analyses were classified as at a high or unclear overall risk of bias. Thus, the approach to restrict the meta-analysis to trials with a low overall risk of bias was not viable. For this reason, the individual domains of the Cochrane risk of bias assessment were considered for classification purposes. Although the quality of trial publications has improved in recent years, often the details of randomization, allocation concealment and blinding remain unclear, so classification on these first three domains (selection bias, and performance and detection bias of subjective outcomes) can be uninformative. Given that the outcome of interest for this study is subjective, the fourth domain (performance and detection bias of objective outcomes) is also uninformative. Similarly, since the analysis in this study is considering only one outcome, the assessment of selective reporting of outcomes (reporting bias domain) is uninformative. In addition, the most common reason for high risk of bias in the ‘other bias’ domain for the trials in this study is that most are funded by industry; a restriction on this domain would reduce the number of included studies almost to none It was decided to include studies in this restricted analysis based on their attrition bias assessment: that is, the risk of incomplete outcome data, for example, the handling of missing data and withdrawals in the analysis. This is particularly important in the field of schizophrenia given the major challenges of nonadherence in this population [33,34]. The Cochrane reviewers risk of attrition bias assessment is presented alongside the extracted outcome data presented in Supplementary Tables 1–7. | Cochrane collaboration recommends restricting primary meta-analysis to study at a low risk of bias or to present meta-analyses stratified according to the risk of bias [14,16] | Reduced evidence base, may introduce bias and lose precision |
N/A: Not applicable.
Treatment outcomes for each direct comparison were estimated as mean differences (MDs) in PANSS total end point score. Clinical interpretation of PANSS total score is mixed, as discussed in detail later in this paper. One approach previously utilized to interpret the between-group differences in PANSS total end point score is through effect size calculation [35]; that is, the MD between groups divided by the corresponding standard deviation (SD). Between-group effect size can then be interpreted using the thresholds 0.2, 0.5 and 0.8 to correspond to small, medium and large effects, respectively. Between-group effect sizes were calculated for each direct comparison. The difference in treatment outcomes between a meta-analysis of all trials and each of the four approaches described above was assessed using the difference in mean difference (ΔMD). A ΔMD greater than 0 indicates larger treatment outcomes with the meta-analysis of all trials than with the alternative strategy. Further, the interpretation of between-group effect sizes under each strategy was compared.
The I 2 statistic and the p-value for the heterogeneity χ2 statistic were used to investigate heterogeneity between trials for each direct treatment comparison. I 2 describes the percentage of total variation across studies that is due to heterogeneity rather than chance [36]. A value of 0% indicates no observed heterogeneity, and larger values show increasing heterogeneity. Under the limited meta-analysis approach, G 2 was used to measure the level of heterogeneity that remains after small-study effects are accounted for [31]. Funnel plots and radial plots were used to investigate reporting biases and potential outliers.
Results
From the Cochrane reviews described previously, seven direct meta-analyses (143 randomized controlled trials [RCTs]) were selected for further analysis. The characteristics of these reviews are summarized in Table 2, and the corresponding results for each direct meta-analysis are presented in Table 3. Briefly, the median number of contributing trials was ten (range: 7–78), with a median total sample size of 1232 (range: 689–5733). In the original analysis of all trials as reported by the review authors, no significant difference between treatments in PANSS total end point score up to 12 weeks was observed for any of the direct treatment comparisons. However, when repeating the analysis of all trials in R, an error was identified in the meta-analysis of aripiprazole compared with risperidone. In short, after removing a duplicate trial and repeating the analysis, the magnitude of the treatment effect increased by 0.11 to an MD of -0.80 (95% CI: -1.58 to -0.02; p = 0.045), a significant effect in favor of aripiprazole.
| Cochrane review Study (year) | Selection criteria | Outcome measure | Ref. | ||
|---|---|---|---|---|---|
| Studies | Participants | Interventions | |||
| Khanna et al. (2014) | Both open and double-blinded, RCTs were included. Quasi-randomized studies were excluded | People with schizophrenia and other types of schizophrenia-like psychosis (e.g., schizophreniform and schizoaffective disorders) were included, irrespective of the diagnostic criteria used | Aripiprazole: any oral form of application, any dose. Other atypical antipsychotic drugs: amisulpride, clozapine, olanzapine, quetiapine, risperidone, sertindole, ziprasidone, zotepine: any oral or parenteral form of application, any dose | Mental state: general average end point score (PANSS total, high = poor), short term (up to 12 weeks). End point data were primarily used, change data were only used if the former was not available. MDs rather than SMDs were used throughout | [2] |
| Asmal et al. (2013) | RCTs that were at least single-blind were included. Randomized crossover studies also were included, but only data up to the point of first crossover were examined. Quasi-randomized studies and open-label trials were excluded | People with schizophrenia and other types of schizophrenia-like psychosis (e.g., schizophreniform and schizoaffective disorders) were included, irrespective of the diagnostic criteria used | Quetiapine: any oral form of application, any dose. Other atypical antipsychotic drugs: amisulpride, aripiprazole, clozapine, olanzapine, risperidone, sertindole, ziprasidone, zotepine: any oral form of application, any dose | Mental state: general average end point score (PANSS total, high = poor), short term (up to 12 weeks). End point data were primarily used, change data were used only if the former were not available. MDs rather than SMDs were used throughout | [3] |
| Komossa et al. (2011) | RCTs which were at least single-blind (blind raters) were included. Randomized crossover studies were also included, but only data up to the first point of crossover were examined. Quasi-randomized studies were excluded | People with schizophrenia and other types of schizophrenia-like psychosis (e.g., schizophreniform and schizoaffective disorders) were included, irrespective of the diagnostic criteria used | Risperidone: any oral form of application, any dose. Other atypical antipsychotic drugs: amisulpride, aripiprazole, clozapine, olanzapine, quetiapine, sertindole, ziprasidone, zotepine: any oral form of application, any dose | Mental state: general average end point score (PANSS total, high = poor), short term (up to 12 weeks). Continuous outcomes were estimated by MD between groups. Both end point data and change data were combined | [4] |
MD: Mean difference; PANSS: Positive and negative syndrome scale; RCT: Randomized controlled trial; SMD: Standardised mean difference.
| Study (year) Cochrane review | Intervention (n) | Comparator (n) | PANSS total score, MD (95% CI) | Test for overall effect | Random-effects model heterogeneity statistics | Ref. |
|---|---|---|---|---|---|---|
| Khanna et al. (2014) | Aripiprazole (n = 820) | Clozapine (n = 818) | -0.10 (-1.41–1.22) | p = 0.88 | τ2 = 5.86; χ2 = 61.84, df = 22; p < 0.001; I 2 = 64% | [2] |
| Aripiprazole (n = 417) | Quetiapine (n = 414) | -0.88 (-3.15–1.40) | p = 0.45 | τ2 = 7.02; χ2 = 21.14, df = 9; p = 0.01; I 2 = 57% | ||
| Aripiprazole (n = 2890) | Risperidone (n = 2903) | -0.69 (-1.49–0.11) | p = 0.091 | τ2 = 5.93; χ2 = 161.88, df = 77; p < 0.001; I 2 = 52% | ||
| Aripiprazole (n = 754) | Olanzapine (n = 746) | 0.61 (-0.23–1.46) | p = 0.15 | τ2 = 0.41; χ2 = 12.87, df = 10; p = 0.23; I 2 = 22% | ||
| Aripiprazole (n = 347) | Ziprasidone (n = 342) | -1.74 (-3.68–0.20) | p = 0.079 | τ2 = 0.0; χ2 = 1.03, df = 6; p = 0.98; I 2 = 0.0% | ||
| Asmal et al. (2013) | Quetiapine (n = 624) | Risperidone (n = 608) | 1.37 (-0.28–3.01) | p = 0.10 | τ2 = 1.0; χ2 = 8.53, df = 7; p = 0.29; I 2 = 18% | [3] |
| Komossa et al. (2011) | Risperidone (n = 360) | Olanzapine (n = 368) | 0.97 (-1.10–3.05) | p = 0.36 | τ2 = 0.0; χ2 = 2.33, df = 6; p = 0.89; I 2 = 0.0% | [4] |
MD: Mean difference; PANSS: Positive and negative syndrome scale.
The subsections below present a summary of the differences in results between analysis strategies for each direct comparison. In general, where differences between strategies were observed, MD in PANSS total score was smaller in the conventional meta-analysis than that for the single most precise trial, meta-analysis restricted to the largest trials, and meta-analysis restricted to trials at a low risk of attrition bias (Figures 1 & 2). Of note, such differences were small. The ΔMD in the primary analysis tended to be less than two points for all comparisons (Table 4). No considerable differences in effect size were observed in the comparison with a limit meta-analysis (|ΔMD| <1). However, it is important to consider the clinical relevance of these differences. Between-group effect sizes for the direct comparisons analyzed in this study are presented in Figures 1–3. In general, effect sizes for all direct treatment comparisons indicated small to no effects (|effect size| <0.2), regardless of analytic strategy. Where differences in effect size interpretation between strategies were observed, these have been highlighted in the subsections which follow.
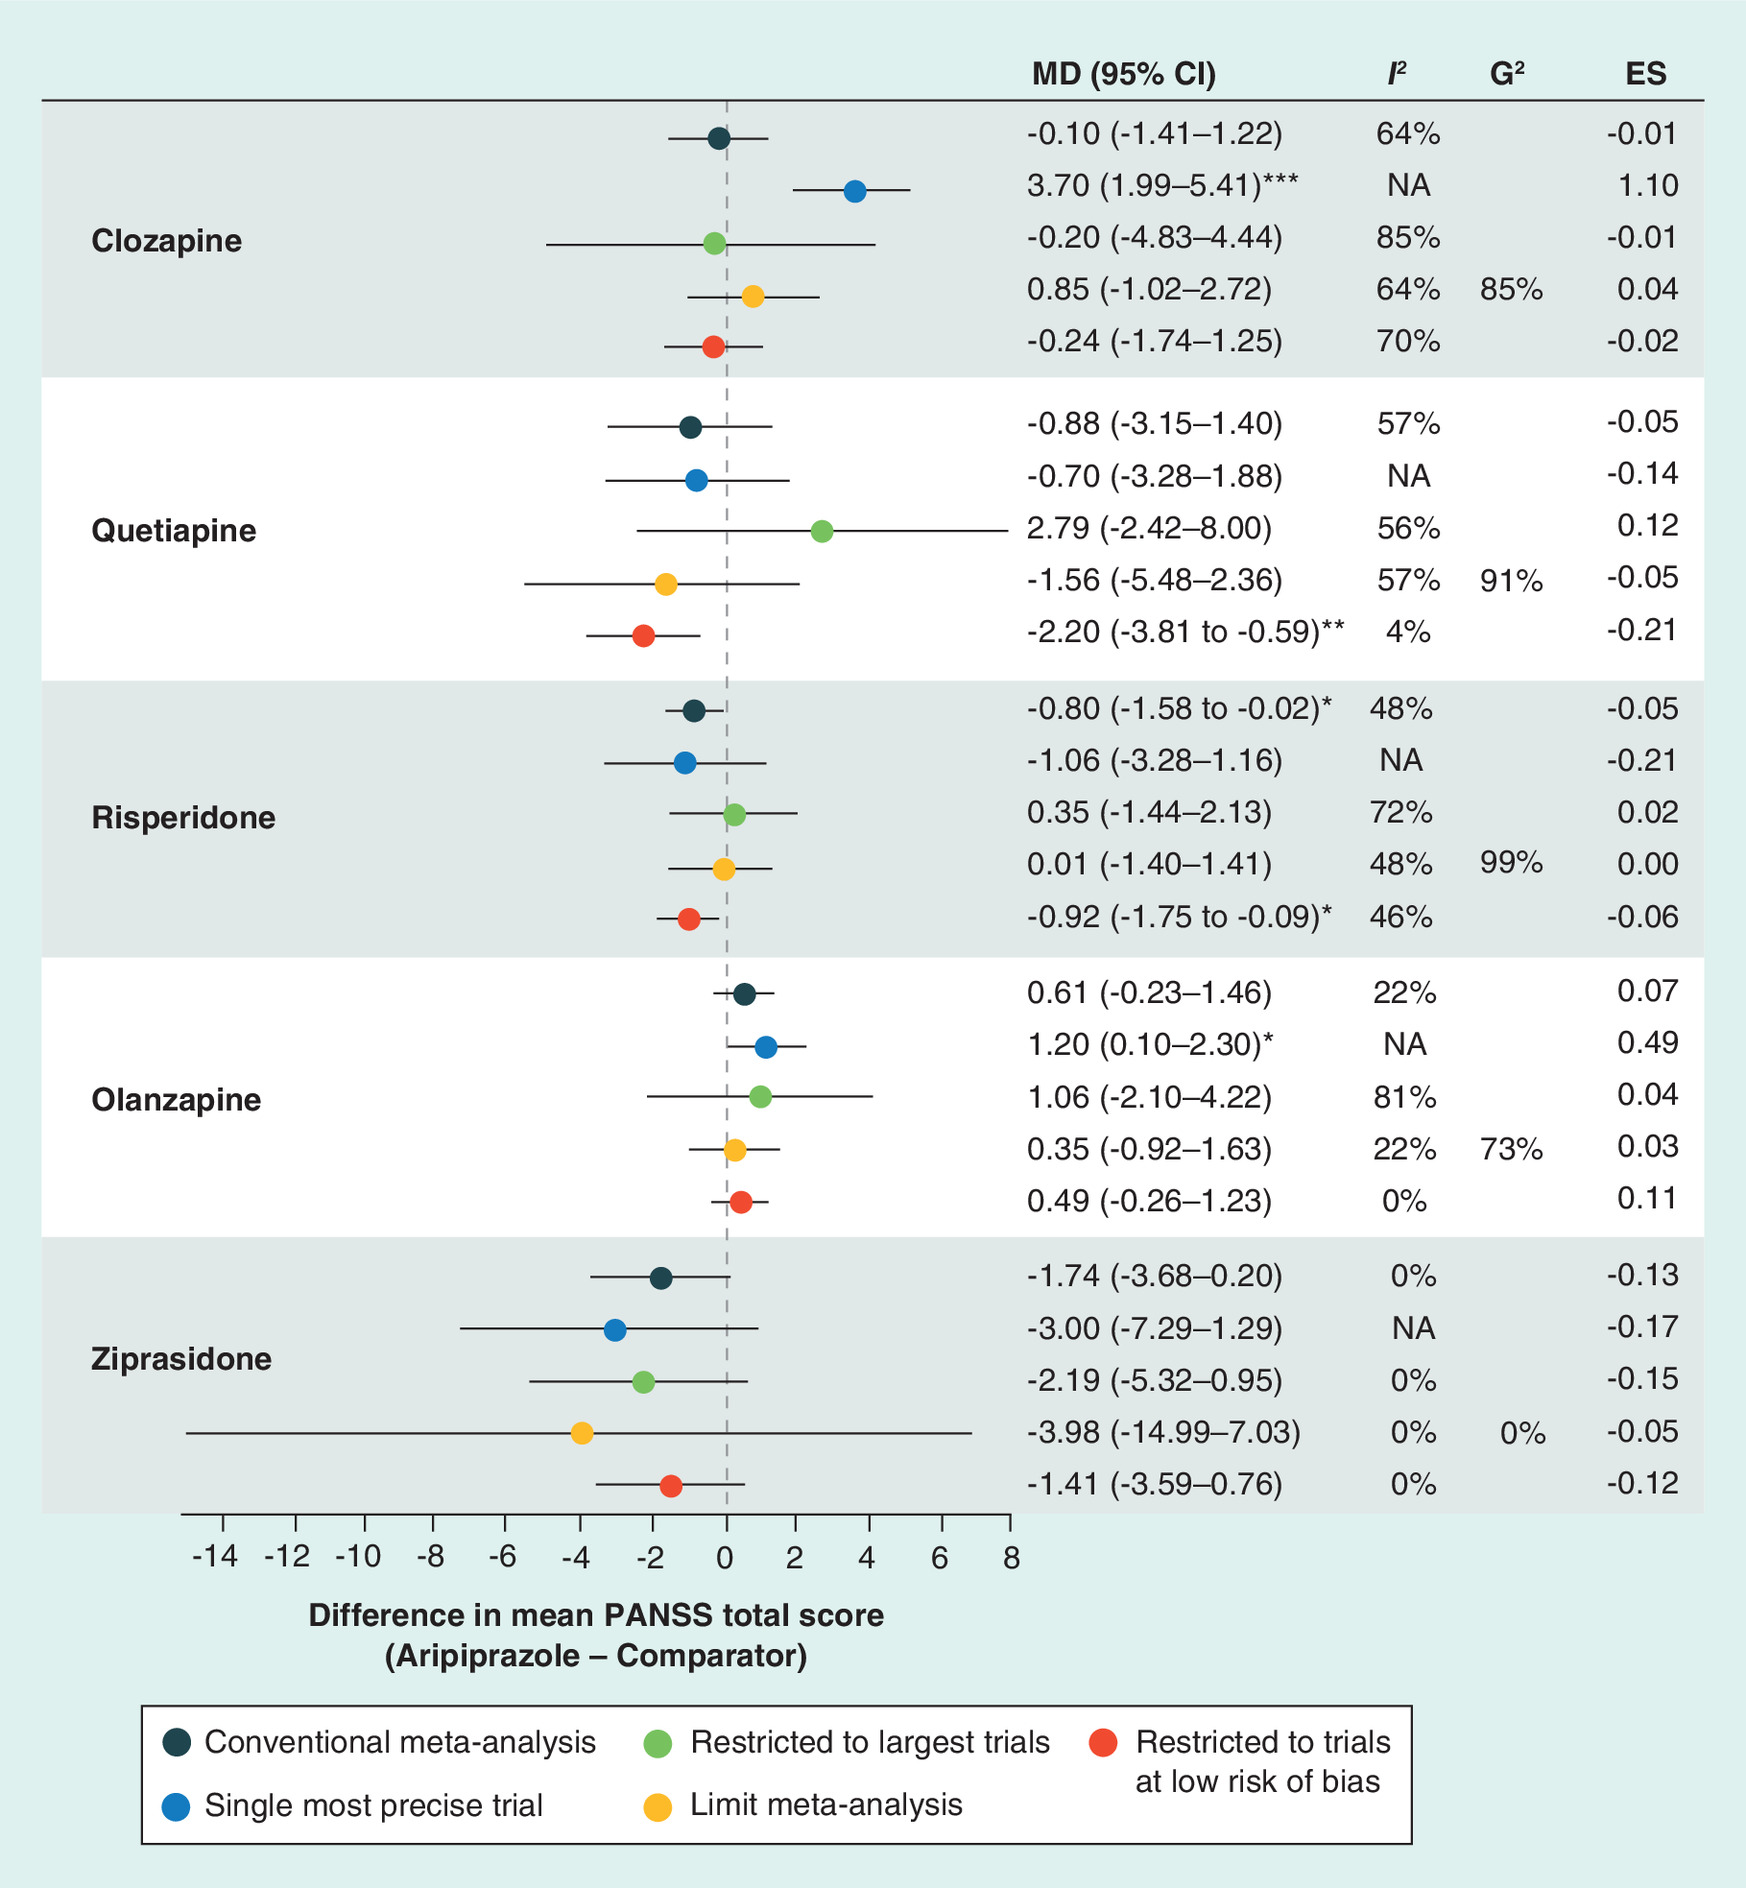
Figure 1. Forest plot of results under each analysis strategy, aripiprazole versus comparators.
*p < 0.05; **p < 0.01; ***p < 0.001.
ES: Effect size; MD: Mean difference; NA: Not applicable; PANSS: Positive and negative syndrome scale.
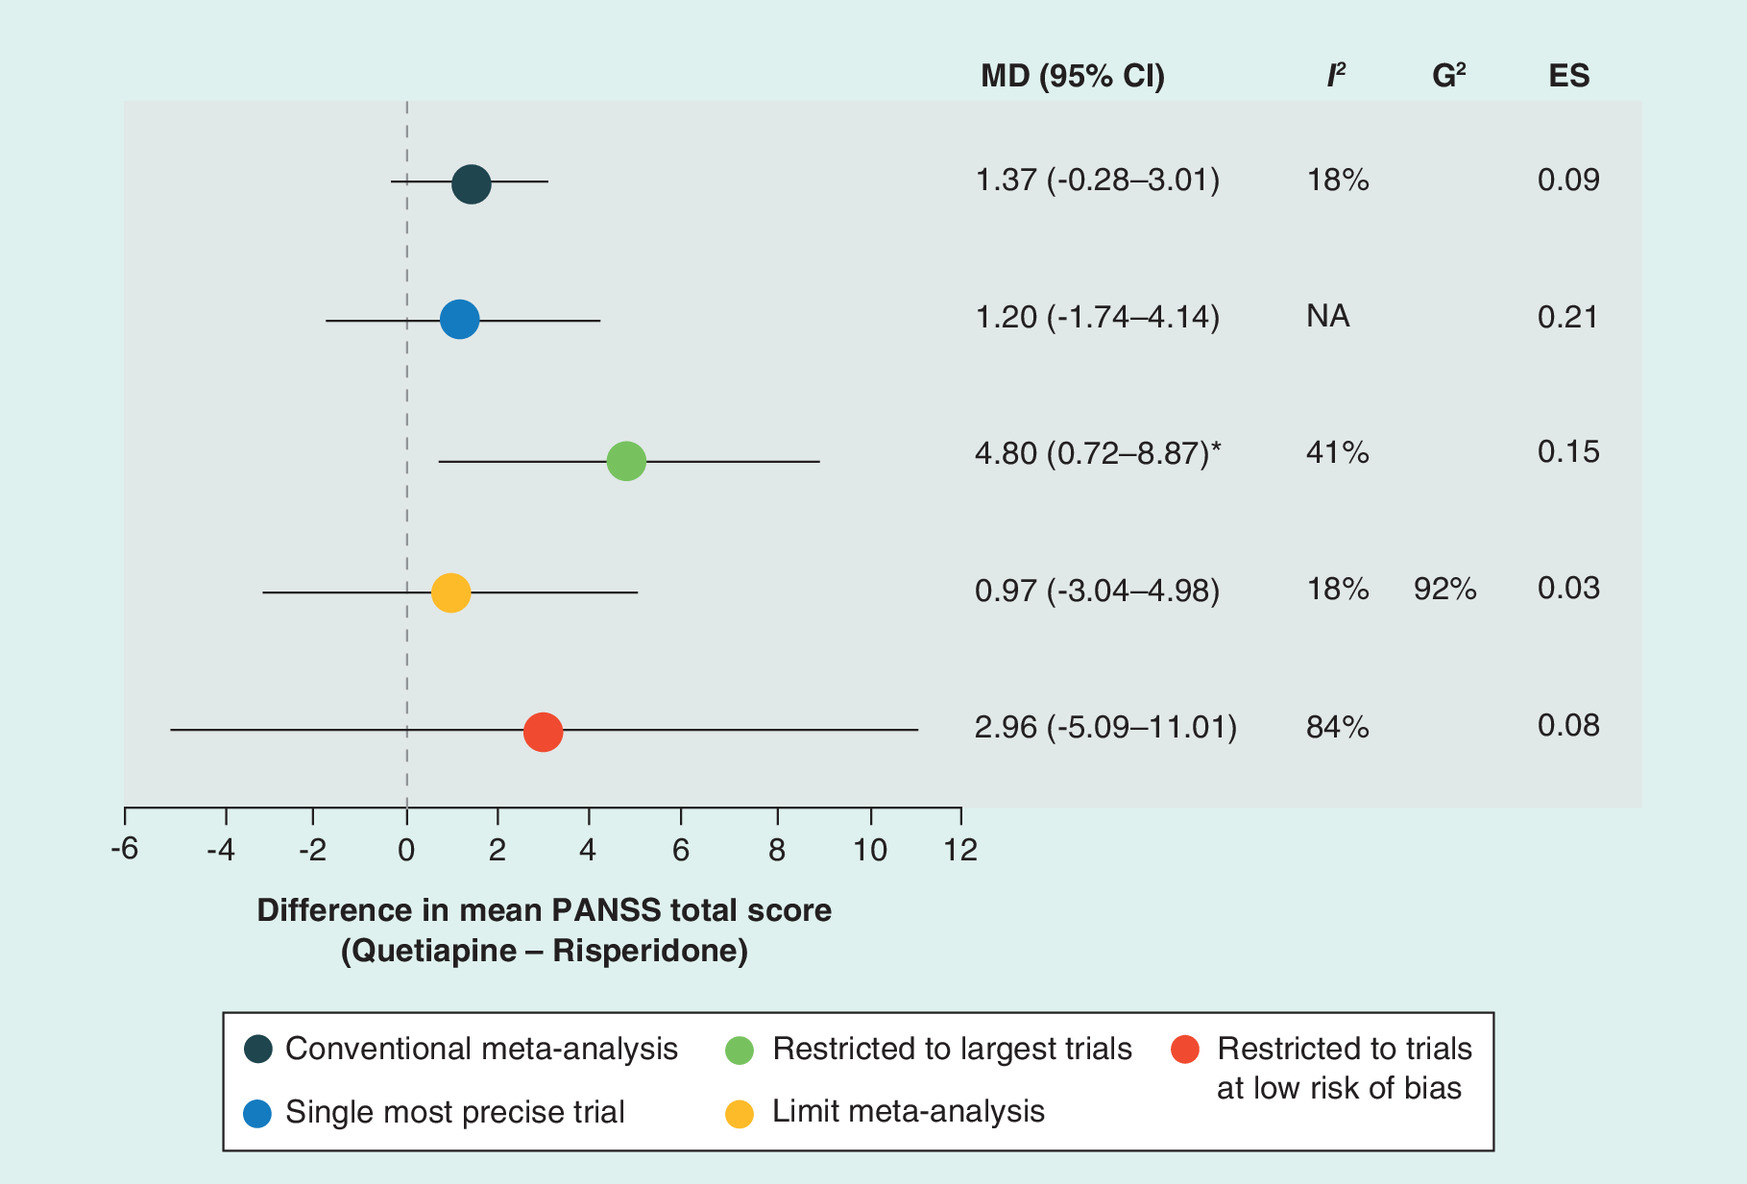
Figure 2. Forest plot of results under each analysis strategy, quetiapine versus risperidone.
*p < 0.05; **p < 0.01; ***p < 0.001.
ES: Effect size; MD: Mean difference; NA: Not applicable; PANSS: Positive and negative syndrome scale.
| Meta-analysis strategy | Difference in mean difference† | ||||||
|---|---|---|---|---|---|---|---|
| Aripiprazole vs clozapine (23 RCTs [n = 1638]) | Aripiprazole vs quetiapine (10 RCTs [n = 831]) | Aripiprazole vs risperidone (77 RCTs [n = 5.733]) | Aripiprazole vs olanzapine (11 RCTs [n = 1500]) | Aripiprazole vs ziprasidone (7 RCTs [n = 689]) | Quetiapine vs risperidone (8 RCTs [n = 1232]) | Risperidone vs olanzapine (7 RCTs [n = 728]) | |
| Conventional meta-analysis | – | – | – | – | – | – | – |
| Single most precise trial | -3.80 | -0.18 | 0.26 | -0.59 | 1.26 | 0.17 | 0.87 |
| Restricted to the largest trials‡ | 0.10 | -3.66 | -1.14 | -0.45 | 0.45 | -3.43 | 0.90 |
| Limit meta-analysis | -0.95 | 0.68 | -0.80 | 0.26 | 2.24 | 0.40 | -0.99 |
| Restricted to trials at low risk of bias | 0.15 | 1.33 | 0.12 | 0.13 | -0.32 | -1.59 | -2.43 |
†A difference in mean difference greater than 0 indicates larger treatment outcomes with the meta-analysis of all trials than with the alternative strategy.
‡The largest trials are defined as those in quarter four of sample size within each meta-analysis.
n: Number of patients; RCT: Randomized controlled trial.
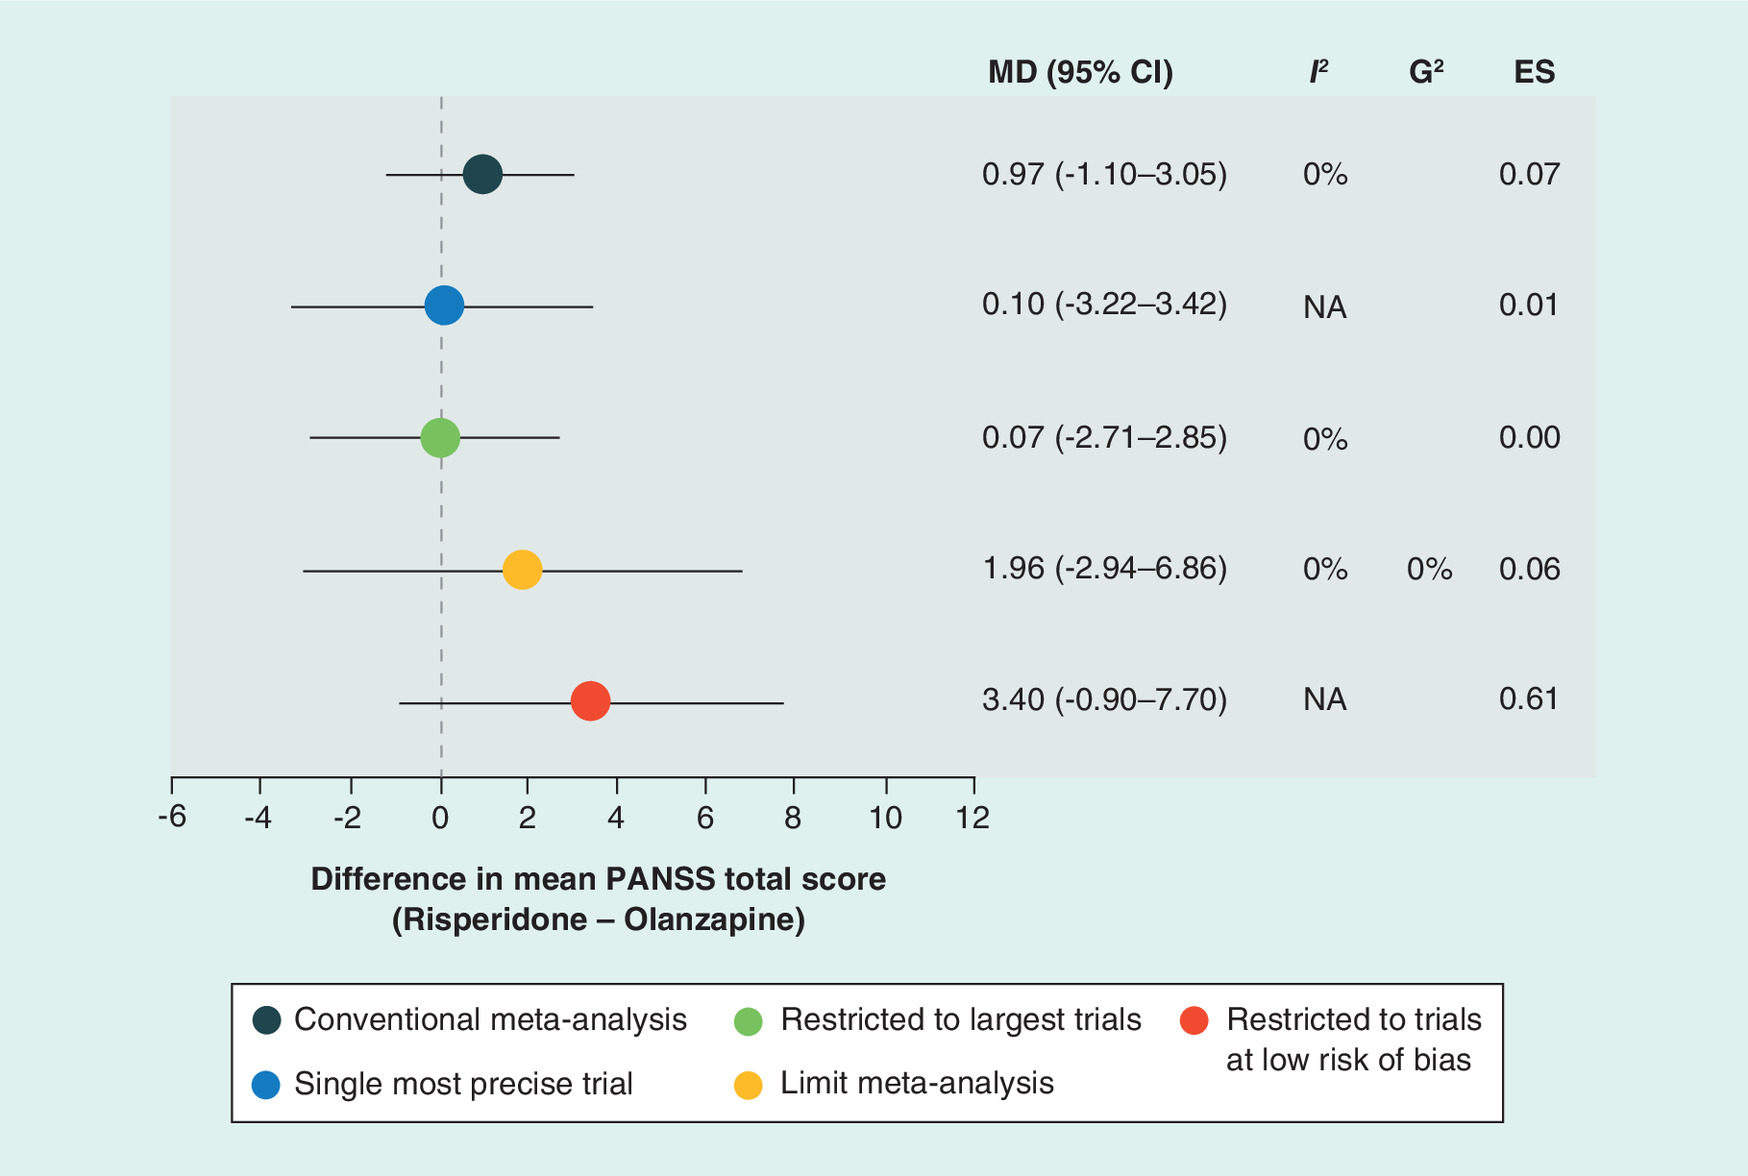
Figure 3. Forest plot of results under each analysis strategy, risperidone versus olanzapine.
*p < 0.05; **p < 0.01; ***p < 0.001.
ES: Effect size; MD: Mean difference; NA: Not applicable; PANSS: Positive and negative syndrome scale.
Moderate to high levels of statistical heterogeneity were observed for several treatment comparisons. Mostly, the level of heterogeneity increased when analysis was restricted to the largest trials and decreased when restricted to trials at a low risk of attrition bias (Figures 1 & 2), with dramatic differences in some comparisons (e.g., I 2 = 81 vs 0%, respectively, in the comparison of aripiprazole with olanzapine). G2 values measuring levels of heterogeneity after accounting for possible small-study effects [31] under the limit meta-analysis approach are also presented (Figures 1–3). Results for this measure suggest that much of the between-study heterogeneity is unexplained after allowing for possible small-study effects.
Aripiprazole versus clozapine
In the analysis of all trials (23 RCTs, n = 1638), no significant difference in mean PANSS total score was observed (MD [95% CI] = -0.10 [-1.41–1.22]; p = 0.884; Figure 1; Supplementary Figure 1) and substantial heterogeneity was present (I 2 = 64%; p < 0.0001). Similarly, in the analysis restricted to larger trials, limit meta-analysis, and analysis restricted to trials at a low risk of bias, no significant difference was seen between treatments (Figure 1). In addition, the use of these strategies did not reduce the amount of heterogeneity present (I 2 = 85, 64 and 70%, respectively). On the other hand, the single most precise trial (study identifier: Liu 2006 [37]) reported a significant difference in PANSS total score in favor of clozapine (MD [95% CI] = 3.70 [1.99–5.41]; p < 0.0001), a ΔMD of -3.80 when compared with the meta-analysis of all trials (Table 4). Moreover, the between-group effect size calculation for the single most precise trial (1.10) suggests large effects in favor of clozapine, whereas the meta-analytic results under each of the other strategies demonstrated no between-group differences (effect sizes from -0.01 to 0.04; Figure 1). Interestingly, study identifier Liu 2006 [37] was not the largest trial included in the comparison of aripiprazole versus clozapine. Furthermore, this trial evaluated efficacy and safety in patients with first-episode schizophrenia, whereas the largest trial in this comparison (study identifier Zhang 2010 [38]) was one of two trials (also, study identifier Zhang 2009 [39]) conducted in patients with refractory schizophrenia. This difference in patient population may be an explanatory factor for the difference in results observed.
Aripiprazole versus quetiapine
In the analysis of all trials (10 RCTs, n = 831), no significant difference in mean PANSS total score was observed (MD [95% CI] = -0.88 [-3.15–1.40]; p = 0.450; Figure 1; Supplementary Figure 2), with considerable heterogeneity present (I 2 = 57%; p = 0.012). Similarly, no significant differences were seen between treatments in the single most precise trial, meta-analysis restricted to the largest trials and limit meta-analysis. However, the meta-analysis restricted to trials at a low risk of bias observed a significant difference in mean PANSS score in favor of aripiprazole (MD [95% CI] = -2.20 [-3.81 to -0.59]; p = 0.008; ΔMD = 1.33; Figure 1; Table 4). Further, the between-group effect size under this analytic strategy suggested small clinical effects in favor of aripiprazole (-0.21), whereas the results under the other strategies did not suggest any between-group differences in effect (effect sizes from -0.05 to 0.12; Figure 1). In addition, applying this restriction to the trials analyzed reduced the degree of heterogeneity from I 2 = 57% (p = 0.012) to I 2 = 4% (p = 0.398). Although this strategy only removed two trials (study identifiers Ge 2009 [40], Liu 2009b [41]), the difference in conclusions stems from the removal of study identifier Liu 2009b [41], the largest trial in this comparison (n = 120), with the largest treatment effect and the only trial in the comparison significantly in favor of quetiapine (MD [95% CI] = 6.90 [2.34–11.46]). Funnel and radial plots of all trials included in this analysis (not presented) suggest that this trial may be one of two potential outliers; however, no considerable differences in methods or participants were identified from the review paper.
Aripiprazole versus risperidone
As mentioned previously, while performing the analysis described in this manuscript, an error in the review publication for the comparison aripiprazole versus risperidone was discovered. Khanna and colleagues [2] report no significant difference between treatments (MD [95% CI] = -0.69 [-1.49–0.11]; p = 0.091; Table 3 ) in their analysis of 78 RCTs (n = 5793), with considerable heterogeneity present (I 2 = 52%; p < 0.00001). However, after closer inspection of the 78 RCTs listed in the forest plot for this analysis (see Analysis 3.6.2.2, page 403 in Khanna et al. [2]) and the corresponding characteristics of studies tables, it is believed that one trial has been included in this analysis in error. The trial in question, study identifier Zhang 2009 [39], is a randomized parallel group trial comparing aripiprazole and clozapine. As such, it should not be included in the direct treatment comparisons of aripiprazole versus risperidone. Moreover, it appears that the data entered in this direct treatment comparison for Zhang 2009 [39] are in fact a duplication of data in study identifier Zhang 2009a [42]. In light of this, the analysis was replicated, removing study identifier Zhang 2009 [39]; the resulting comparison of 77 RCTs was used when applying the four alternative analysis strategies.
The revised analysis of all trials (77 RCTs, n = 5733) indicated a significant difference in mean PANSS score in favor of aripiprazole (MD [95% CI] = -0.80 [-1.58 to -0.02]; p = 0.045; Figure 1; Supplementary Figure 3), with substantial heterogeneity present (I 2 = 48%; p < 0.0001). Although this change in MD in the revised analysis was minor (MD = -0.80 vs -0.69 in the original analysis), it was large enough to conclude that the result was statistically significant rather than non-significant (p = 0.045 vs p = 0.091) according to the conventional 5% (or p < 0.05) threshold for indicating statistical significance.
Unlike the conventional meta-analysis of all trials, the single most precise trial, analysis restricted to the largest trials, and limit meta-analysis did not detect significant difference in mean PANSS score between treatments (Figure 1). However, the between-group effect size suggests small differences between treatments in favor of aripiprazole in the single most precise trial (-0.21), whereas between-group differences were not observed under the other strategies (effect sizes from -0.06 to 0.02; Figure 1). This result is not unexpected since, the |MD| between treatments is the largest observed from the five strategies, and since this is the single most precise trial, the SD is correspondingly small. However, no considerable differences in methods or participants were identified from the review paper for this trial, study identifier Luo 2009 [43].
The analysis restricted to the largest trials saw an increase in the degree of heterogeneity present (I 2 = 72%). Whereas the analysis restricted to trials at a low risk of bias showed a slight decrease in the degree of heterogeneity (I 2 = 46%), with results in line with the conventional meta-analysis, a significant improvement in mean PANSS score was observed for patients who received aripiprazole over patients treated with risperidone (MD [95% CI] = -0.92 [-1.75 to -0.09]; p = 0.030; Figure 1).
Aripiprazole versus olanzapine
In the analysis of all trials (11 RCTs, n = 1500), no significant difference between treatments in mean PANSS total score was observed (MD [95% CI] = 0.61 [-0.23–1.46]; p = 0.153; Figure 1; Supplementary Figure 4), with a low degree of heterogeneity present (I 2 = 22%; p = 0.231). Similarly, in the analysis restricted to larger trials, limit meta-analysis and analysis restricted to trials at a low risk of bias, no significant difference was seen between treatments (Figure 1). Interestingly, a much larger degree of heterogeneity was present when restricting the meta-analysis to the three largest trials (I 2 = 81%; p = 0.0048), whereas, like the findings in the comparison of aripiprazole and quetiapine, restricting the meta-analysis to trials at a low risk of bias removed all statistical evidence of heterogeneity (I 2 = 0%; p = 0.689). The single most precise trial (study identifier Chen 2009a [44]) detected a significant difference in the mean PANSS total score in favor of olanzapine (MD [95% CI] = 1.20 [0.10–2.30]; p = 0.032; ΔMD -0.59), and the corresponding between-group effect size (0.49) suggests moderate differences between treatments. This trial was one of the smaller trials in the comparison and so was unlikely to influence the pooled result despite the very small variance around the mean PANSS total score estimates (SD = 2.2 for aripiprazole and 2.6 for olanzapine; Supplementary Figure 4). Notedly, this trial included a washout period before the intervention period, which may explain the more precise results observed. None of the three remaining alternative strategies indicated results considerably different than the conventional meta-analysis of all trials (Table 4), and between-group effect sizes under these strategies did not suggest clinical differences between treatments (effect sizes from 0.03 to 0.11; Figure 1).
Aripiprazole versus ziprasidone
In the conventional meta-analysis of all trials (seven RCTs, n = 689), no significant difference in mean PANSS total score was observed between treatments (MD [95% CI] = -1.74 [-3.68–0.20]; p = 0.079; Figure 1; Supplementary Figure 5), and no heterogeneity was observed (I 2 = 0%, p = 0.984). Similar results were observed when reproducing the analysis using each alternative strategy (Figure 1). Although the MD appears considerably larger for the limit meta-analysis (MD [95% CI] = -3.98 [-14.99–7.03], ΔMD = 2.24; Table 4), the CI is very wide, and these results should be interpreted with caution, given the low number of trials included in this comparison. Under such conditions, this approach, as with all funnel plot methods, works poorly with respect to both size and power [23]. In this comparison, study identifier Zimbroff 2007 [45] was both the largest and most precise trial, as well as the only trial judged to be at an unclear risk of attrition bias. Interestingly, however, it had minor impact on the results when observed alone (MD [95% CI] = -3.00 [-7.29–1.29]; ΔMD = 1.26) or when excluded from the analysis restricted to trials at a low risk of bias (MD [95% CI] = -1.41 [-3.59–0.76]; ΔMD = -0.32). Between-group effect sizes did not suggest differences between treatment outcomes, regardless of the meta-analytic strategy employed (effect sizes from -0.05 to -0.17, Figure 1).
Quetiapine versus risperidone
In the analysis of all trials (8 RCTs, n = 1232), no significant difference between treatments in mean PANSS total score was detected (MD [95% CI] = 1.37 [-0.28–3.01]; p = 0.104; Figure 2 ; Supplementary Figure 6), with a low degree of heterogeneity present (I 2 = 18%; p = 0.288). However, the meta-analysis restricted to the two largest trials realized a significant result in favor of risperidone (MD [95% CI] = 4.80 [0.72–8.87]; p = 0.021; ΔMD = -3.43; Figure 2 ; Table 4), with the two trials (study identifiers Potkin 2006 [46] and Zhong 2006 [47]) demonstrating differences in MD (I 2 = 41%; p = 0.193; Supplementary Figure 7).
Conversely, restricting the meta-analysis to trials at a low risk of bias increased the degree of heterogeneity substantially (I 2 = 84%; p = 0.012) with two trials (study identifiers Atmaca 2003 [48] and Potkin 2006 [46]) presenting very different results (MD [95% CI] = -1.02 [-5.08–3.04] vs 7.20 [2.22–12.18], respectively). Of note, study identifier Potkin 2006 [46], although an outlying result (Supplementary Figure 8), was the second-largest trial and one of the two trials judged to be at a low risk of attrition bias. Asmal and colleagues [3] judged this trial to be at a high risk of bias in the ‘other bias’ domain given that it was sponsored by the manufacturer of risperidone. Indeed, study identifier Potkin 2006 [46] identified a significant result in favor of risperidone. When observing the extracted study characteristics in the review report, no outlying differences appear to be exhibited in methods or participants when compared with the other studies included in this comparison. However, there appears to be a difference in the mean dosage of comparators. Specifically, the second highest mean dose of quetiapine is compared with the lowest mean dose of risperidone. Removing this trial realized a similar result to the primary analysis, in other words, no significant difference in mean PANSS total score between treatments (seven RCTs, n = 924; MD [95% CI] = 0.78 [-0.73–2.28]; p = 0.311), and all heterogeneity was removed (I 2 = 0%; p = 0.848).
Study identifier Atmaca 2003 [48], the second trial at a low risk of attrition bias was the smallest trial in this comparison. When considering the findings above alongside the near significant result from the largest trial in this comparison (study identifier Zhong 2006 [47]; MD [95% CI] = 3.00 [-0.88–6.88]), a qualitative assessment may favor risperidone, contradictory to the quantitative synthesis of the trials. Further, the between-group effect sizes for the conventional meta-analysis, meta-analysis restricted to the largest trials, limit meta-analysis and meta-analysis restricted to trials at a low risk of attrition bias did not suggest differences in clinical outcomes between treatments (effect sizes from 0.03 to 0.1; Figure 2), whereas the effect size for the single most precise trial (study identifier Atmaca 2003 [48]) suggests a small clinical benefit in favor of risperidone. One possible explanatory reason for this may be the heterogenous study population; of the 54 participants spread across the five intervention arms, 19 participants had never taken any psychotropic drugs, while most of the remaining participants had extensive previous treatment [3].
Risperidone versus olanzapine
No significant difference between treatments in mean PANSS total score was detected in the conventional meta-analysis of all trials (seven RCTs, n = 728; MD [95% CI] = 0.97 [-1.10–3.05]; p = 0.357; Figure 3; Supplementary Figure 9), with no observed heterogeneity (I 2 = 0%; p = 0.887). Similar results were seen when replicating the analysis using the single most precise trial, restricting the analysis to only the larger trials and performing a limit meta-analysis. Again, the results of the limit meta-analysis should be interpreted with caution given the low number of trials included in this comparison. Only one trial (study identifier Atmaca 2003 [48]) in this comparison was judged to be at a low risk of attrition bias. This trial was the second smallest (n = 26) in the comparison and reported considerably different results than those in the conventional meta-analysis (ΔMD = -2.43), although these were still nonsignificant (MD [95% CI] = 3.40 [-0.90–7.70]; p = 0.121; Table 4). Interestingly, however, the between-group effect size for this trial suggested moderate effects in favor of risperidone (0.61), whereas no differences between treatment effects were suggested from the effect size under the other meta-analytic strategies (effect sizes from 0.00 to 0.07; Figure 3). As noted in the previous section, study identifier Atmaca 2003 [48] recruited a heterogenous population with respect to their treatment history, which could explain the difference in result observed.
Discussion
This study assessed the robustness of meta-analyses comparing atypical antipsychotics in schizophrenia by comparing their findings to those using alternative strategies based on trial precision, size and risk of bias. Although several different comparisons were performed, all analyses were determined a priori. Despite the multiple comparisons performed, the overall conclusion was that the Cochrane review results are robust.
In general, the MDs in PANSS total score were similar under each alternative strategy to those from a conventional meta-analysis of all trials. Where differences between strategies were observed, the MD in PANSS total score between treatments was smaller in the conventional meta-analysis of all trials than those for the single most precise trial, in the meta-analysis restricted to the largest trials, and in the meta-analysis restricted to trials at a low risk of attrition bias. Considering the different approaches and focusing on only point estimates may suggest differences which are qualitatively different. However, there is no statistically significant evidence to suggest that the published Cochrane review results are not robust. As for all meta-analyses, it is important to highlight that comparisons should not only focus solely on the point estimates, but also consider the CIs for those comparisons. Furthermore, any observed differences in results were small. The ΔMD tended to be less than two points and all ΔMD values were less than four points. No considerable differences in effect size between the conventional meta-analysis of all trials and the limit meta-analysis were observed.
Although some of the ΔMD between strategies observed in this study altered the statistical significance of the results for some treatment comparisons, statistically significant differences do not always correspond to clinically significant differences. The interpretation of clinically meaningful schizophrenia outcomes varies widely [49]. There is continued debate in the literature on what constitutes a clinically important difference in PANSS score [50–52]. Further, none of this research explores the threshold for a clinically relevant difference in PANSS score between treatments. Leucht and colleagues [50] argue that the clinical implications of PANSS score are unclear. Although clinical studies define response using a percentage reduction in PANSS total score from baseline, it remains unclear what these thresholds mean from a global ‘clinical’ perspective. The authors compared PANSS with simultaneous ratings of clinical global impressions (CGI) and considered ‘mildly ill’ to correspond with PANSS total score of 58; similarly, they considered ‘moderately ill’ to correspond with a PANSS of 75, ‘markedly ill’ to a PANSS of 95, and ‘severely ill’ to a PANSS of 116. Leucht et al. [50] suggested that studies use at least a 50% reduction threshold to define response, corresponding with a ‘much improved’ CGI rating; and a lower threshold (25% reduction, ‘minimally improved’) may be appropriate in treatment-resistant populations. More recently, Hermes and colleagues [51] linked CGI and PANSS data from the Clinical Antipsychotic Trials of Intervention Effectiveness (CATIE) schizophrenia trial and determined similar ratings to those presented by Leucht et al. [50]. In addition, the authors estimated the minimum clinically important difference (MCID) in PANSS using two methods. The first, using the CGI-linked scale, equated MCID with a 15.3 point (34%) change from baseline. The second, investigating the size of the standard error measurement, corresponded MCID with a 16.5 point (36.2%) changes from baseline. Conversely, Leddy-Stacy and Rosenheck [52] used employment as an objective anchor for estimating the MCID in change in average PANSS total scores. The authors estimated an MCID estimate to be a change between 4.25 and 8.30 total points on the PANSS, much lower than previously published estimates. Notably, Leucht and colleagues [50] cautioned that MCID varied considerably when stratified or anchored by baseline psychopathology and illness severity.
Typically, trials of antipsychotics in schizophrenia report mean PANSS total score at baseline and end point, as well as the change from baseline at end point, for each treatment group [53–55]. Conclusions for each treatment group are based on whether the change from baseline is statistically significant and clinically significant with regards to point change or percentage change thresholds [50–52], as described above. Treatments are then compared with one another by tests for statistically significant differences in their mean end point PANSS total score and/or mean change from baseline PANSS total score. The Cochrane reviews included in the present study did not present an analysis of short-term PANSS change from baseline [2–4]; instead the reviewers analyzed average end point PANSS total score, as used in this study. Without change from baseline data available for the two treatment arms, it is difficult to interpret what a clinically meaningful difference between treatments might be. However, in the present study we used between-group effect sizes to compare the clinical relevance of differences in PANSS total end point score, an approach previously applied by Furukawa and colleagues [35]. Clinical conclusions for each of the approaches were generally robust, with selected exceptions highlighted in the Results subsections. Where differences in results did arise, the differing conclusion was usually the strategy analyzing the single most precise trial. Where possible from the information provided in the Cochrane review papers, potential reasons for the difference in results have been noted.
The findings in the current study are in contrast to those presented by Dechartres and colleagues [17]. Specifically, the authors in that study reported that estimates of treatment outcomes differed depending on the analytic strategy used, in particular estimates were larger with meta-analysis of all trials than with the single most precise trial, meta-analysis of the largest trials and limit meta-analysis. Whereas they did not observe a difference in treatment outcomes by overall risk of bias. The differing results may be explained by the body of evidence analyzed. Dechartres et al. [17] examined a much larger sample of meta-analyses, assessing a broader range of therapeutic interventions in subjective and objective binary outcomes. Conversely, the meta-analyses used in the present study assessed the effect of drugs from the same treatment class in a similar population, using the same outcome at a commonly defined time point. In this sense, the meta-analyses in this study are somewhat homogenous despite the significant heterogeneity observed in the tests of heterogeneity and the corresponding trial differences described previously.
The similarity in the trial populations, treatment and outcome definition stems from the specific research question and selection criteria used in the Cochrane reviews. Often systematic reviews address a broader research question. Trials evaluating the effect of drug treatments typically follow a protocol, designed by a pharmaceutical company, which are likely to be consistent in their approach to study design (for example, in blinding, concealment of intervention allocation, and treatment delivery) to align with strict good clinical practice guidelines and ethics requirements. Conversely, trials of nonpharmaceutical interventions, such as psychological interventions, or those in other therapeutic areas, such as surgery or technical procedures, may be more prone to bias given the difficulties they present with regards to blinding. In addition, description of such interventions in trial publications is reportedly poor [56], limiting reliable comparison. Clinical and methodological heterogeneity may be more prominent in reviews of such studies, with potential to consequently increase the degree of statistical heterogeneity. In this regard, one can recognize that although heterogeneity between the trials synthesized in this study is evident (for example, in dosing and study setting differences), it is evidently less given that the trials evaluated pharmacological interventions only.
Similarly, trials conducted outside the pharmaceutical industry (for example, in academic institutions) will follow protocols whose methods and organization may vary by institution. It is likely that such trials have less consistency in their approach than that within the pharmaceutical industry. The trials included in the analysis in the present study were largely reported to be pharmaceutical industry-sponsored trials. Thus, for the reasons previously mentioned, they may be less heterogeneous than a meta-analysis of trials conducted in various settings.
With regards to analysis of continuous outcomes, analysts can calculate the magnitude of treatment effects using a standardized mean difference (SMD). The use of an SMD to estimated treatment effects enables studies evaluating total symptoms using different symptom scales to be compared. Khanna and colleagues [2] presented such an approach in their review of aripiprazole versus other atypical antipsychotics. The authors synthesized studies reporting average end point total score as measured by the CGI, PANSS and brief psychiatric rating scale to give a global state estimate. However, this approach was used for only one comparison (aripiprazole vs quetiapine). Estimating treatment effects using an SMD is common in meta-analysis. Understandably, the measurement differences for each of these scales can introduce heterogeneity, despite the attempts made to standardize their results.
Similarly, outcomes not measured using a validated scale (e.g., relapse, response and remission) may vary in their definitions and thresholds. Under such circumstances, clinical heterogeneity is expected. Such differences in definition, variety in scales and inconsistency in measurement time were not of concern in the analysis in this study. However, through the examples described above, one can understand the difficulties they may present in meta-analysis and appreciate the value of sensitivity analyses to assess the robustness of results.
Clinical heterogeneity presents difficulties when combining and interpreting results, as discussed above. However, the presence of clinical heterogeneity is not necessarily disadvantageous. If one can demonstrate that results are robust in the presence of clinical heterogeneity, then an argument can be made for a positive treatment effect across a range of clinical settings, for example, different countries and patient risk groups. In this regard, we see the advantage of sensitivity analyses to assess the robustness of results.
Limitations
As discussed previously, the Cochrane reviews included in the present study did not present an analysis of short-term PANSS total score change from baseline [2–4]; instead the reviewers analyzed average end point PANSS total score. This limits our understanding of the clinical implications of the analyses presented in this manuscript. Collection and analysis of change from baseline data may be of interest for further study.
This sample of meta-analyses is not representative of all published meta-analyses of atypical antipsychotics or, indeed, of all published meta-analyses of interventions for the treatment of schizophrenia. Only seven direct comparisons of atypical antipsychotics were analyzed. As discussed in the paragraphs above, although moderate to high levels of statistical heterogeneity were observed for several of the comparisons included in this analysis, a potential limitation of the analysis is the less clinical and methodologically heterogeneous nature of the reviews. Specifically, all trials evaluated pharmacological interventions in similarly defined patient populations (Table 2) using the same total symptom scale (PANSS).
Reflecting on the approach to restrict the meta-analysis to the largest trials, the trials within each comparison were of similar size. For example, in the comparison of aripiprazole versus clozapine, the five largest studies were at most twice the size of the other studies (range of sample size, n = 78–120 vs n = 46–74, respectively). Again, similar sample sizes were seen in the comparison of aripiprazole versus quetiapine (range of sample size, n = 108–120 vs n = 60–88) and the comparison of aripiprazole versus risperidone (range of sample size, n = 86–140 vs n = 38–84). The comparison of aripiprazole versus olanzapine included one trial which was notably larger (study identifier Fleischhacker 2008 [57]; n = 703); however, the remaining studies were all of similar size (n = 48–102). Similar appreciations of sample size were seen in the comparison of aripiprazole versus ziprasidone (range of sample size, n = 247 vs n = 60–86). The comparisons of quetiapine versus risperidone and risperidone versus olanzapine observed two studies with a sample size notably larger than the other included studies (quetiapine vs risperidone: range of sample size, n = 308–646 vs n = 27–66; risperidone vs olanzapine: range of sample size, n = 171–356 vs n = 23–71).
The purpose of the strategy to restrict the meta-analysis to the largest trials is to assess the robustness of findings after previous reports of discordances between large RCTs and meta-analyses [17]. Dechartres and colleagues [17] report that several studies have found that small and moderate-sized trials have indicated larger treatment outcomes when compared with larger trials in meta-analysis. One possible reason for this observation is that these differences in treatment outcomes may be related to reporting bias. Another reason may be that they are a consequence of methodological differences between small and large trials or the differences in the populations they recruit, namely, the tendency for smaller trials to recruit more homogeneous populations [17]. In those comparisons described above which included trials all of similar size, the differences that are expected between large and small studies may be less prominent. As a result, the analysis of these comparisons is likely to be less revealing. Similarly, implementing the limit meta-analysis approach for these analyses was not nearly as informative as that found in Dechartres et al. [17].
Although the use of meta-analyses including a relatively large number of less heterogeneous trials in this study has been discussed as a limitation, it can also be viewed as a ‘best case scenario’ for testing the alternative strategies proposed by Dechartres et al. [17]. The comparisons presented here were selected because they synthesized results from no less than five trials, with the anticipation that those reviews evaluating a larger number of trials may be more prone to variable settings, methodological differences or both. However, as discussed previously, some of the comparisons demonstrated little differences in sample size and precision. Under such circumstances the approaches to assess the robustness of results based on sample size and precision, in other words, meta-analysis restricted to the largest trials and evaluation of the single most precise trial, do not identify distinguishable results to those from a conventional meta-analysis. These results suggest that one should not blindly apply all four approaches as sensitivity analyses irrespective of the review. Instead, reviewers should consider the appropriateness of implementing each approach dependent on the review setting.
A further limitation of the current study was the lack of differentiation in the assessment of the risk of bias on a number of domains for the trials included in the analyses. Consequently, analysis was possible using only the attrition bias (or selective reporting) domain from the Cochrane risk of bias tool.
A number of limitations arise as a result of using previously published reviews for this analysis rather than conducting a new systematic review. Specifically, the reviews provided minimal information on the individual trial characteristics. Consequently, limited assessment of the clinical and methodological heterogeneity between trials was possible. This assessment relied on the summary of study characteristics tables presented in the review papers. However, when conducting a new review, one has access to a wider body of evidence and the opportunity to investigate other potential sources of heterogeneity. In this setting, an example of another potential source of heterogeneity may be the use of concomitant medications, but this detail is not provided in the review papers. Another example is the timing of the PANSS measurement end point. All three reviews [2–4] analyze data for this end point ‘up to 12 weeks’, but it is not clear from trial to trial what time point was used. Previous reviews have reported short-term trial durations ranging from 4 to 12 weeks [58,59]. Depending on the individual antipsychotic's mechanism of action, the impact of treatment on PANSS total score realized at week 4 may be substantially different from that at week 12. In fact, recent reports have suggested that antipsychotic drugs may exert their largest clinical effects during the first 4 weeks, with smaller improvements in later weeks [60,61]. Yet, even if one conducts their own review, the problem of poor, and often incomplete, reporting of trial data still exists [62]. In this regard, there is always the potential for unobserved heterogeneity, that is, heterogeneity arising from a variable which is not reported in the trial publication or is unavailable. Analysis of individual patient data can be advantageous in such circumstances, but even then the underlying cause of patient heterogeneity may stem from an unmeasured confounding variable.
Recommendations & further work
Researchers conducting meta-analysis are recommended to conduct routine sensitivity analyses to assess the robustness of their results. They should reflect carefully on any discrepancies in results. Where possible, further analyses on the influence of each domain from the Cochrane risk of bias tool on the robustness of treatment outcomes are also recommended.
Further research into the application of these strategies to a review with increased clinical and methodological heterogeneity, as well as statistical heterogeneity, would be of value. Further understanding into the implication of these methods in network meta-analysis rather than direct meta-analysis alone, and the repercussions on routine sensitivity analysis in this setting, is also needed.
Conclusion & future perspective
Overall, the results presented in this study show that estimates of the MD in PANSS total score in meta-analyses of atypical antipsychotics in the patients with schizophrenia are robust under alternative analysis strategies. Further, the results demonstrate the value of confirmatory sensitivity analysis. Routine sensitivity analyses are recommended to assess the robustness of findings and validate conclusions in the presence of heterogeneity. However, such strategies may not be as informative in reviews of drugs trials with similar sample sizes analyzing the same symptom outcome scale as they would be in more heterogeneous settings. Reviewers should consider the appropriateness of applying each of the approaches explored in this study, on a case-by-case basis, depending on the review setting.
Background
Systematic reviews and meta-analyses have become an indispensable tool for practitioners, researchers and decision makers to remain up to date with an ever-expanding volume of health evidence. However, between-study heterogeneity (e.g., differences in population, methodology or results) can limit the reliability of results from meta-analyses.
Atypical antipsychotics have become increasingly popular as the first-line drug treatment for people with schizophrenia. However, previous reviews have noted considerable heterogeneity in analyses of atypical antipsychotics, and sensitivity analyses are not routinely performed.
This study assessed robustness of findings in three recent Cochrane systematic reviews investigating the effects of atypical antipsychotics in patients with schizophrenia by applying current proposed methods to address the difficulties presented by heterogeneity.
Methods
Seven unique direct comparisons of mean difference (MD) in positive and negative syndrome scale (PANSS) total score were analyzed.
As well as a conventional random-effects meta-analysis of all trials, the following approaches were applied to each direct comparison: analysis of the single most precise trial, analysis restricted to only the largest trials, a limit meta-analysis that includes all trials and adjusts for small-study effects, and analysis restricted to trials with a low risk of attrition bias (incomplete outcome data) according to the Cochrane risk of bias tool.
Results
In general, where differences between strategies were observed, the MD in PANSS total score was smaller in the conventional meta-analysis than that for the single most precise trial, meta-analysis restricted to the largest trials, and meta-analysis restricted to trials at a low risk of attrition bias.
Of note, such differences were small. The difference in MD in the primary analysis tended to be less than two points for all comparisons, which is unlikely to correspond to a clinically significant difference.
No considerable differences in effect size were observed in the comparison with a limit meta-analysis.
Conclusion
The results of this study show that estimates of the MD in PANSS total score in meta-analyses of atypical antipsychotics in schizophrenia patients are generally robust under alternative analysis strategies. Further, the results demonstrate the value of confirmatory sensitivity analysis.
Routine sensitivity analyses are recommended to assess the robustness of findings and validate conclusions in the presence of heterogeneity. However, such strategies may not be as informative in reviews of drug trials with similar sample sizes as they would be in more heterogeneous settings.
Supplementary data
To view the supplementary data that accompany this paper please visit the journal website at: Supplementary Material
Acknowledgements
These results were previously presented as a poster at the International Society of Pharmacoeconomics and Outcomes Research 20th Annual European Congress, 4–8 November 2017, Glasgow, Scotland. Editorial assistance was provided by John Forbes of RTI Health Solutions. Graphical services were provided by Jason Mathes and Theresa Lingenfelser of RTI Health Solutions. C Ainsworth would like to thank Mike Bradburn for supervising the dissertation preceding this manuscript. C Ainsworth would also like to thank her colleagues Jean-Gabriel Le Moine, Emma Hawe, and Katherine Houghton for their critical review of the dissertation and/or manuscript.
Author contributions
C Ainsworth was responsible for all aspects of this manuscript, including the analysis, and drafting of the work and subsequent revisions. C Ainsworth will be responsible for approving the final version to be published and agrees to be accountable for all aspects of the work.
Financial & competing interest disclosure
C Ainsworth is an employee of RTI Health Solutions. The author has no other relevant affiliations or financial involvement with any organization or entity with a financial interest in or financial conflict with the subject matter or materials discussed in the manuscript apart from those disclosed.
No writing assistance was utilized in the production of this manuscript.
Supplementary Material
File (supplementarymaterial.docx)
- Download
- 1.47 MB
References
Papers of special note have been highlighted as: • of interest; •• of considerable interest
1.
WHO. Schizophrenia (2015). www.who.int/mental_health/management/schizophrenia/en/.
2.
Khanna P, Suo T, Komossa K et al. Aripiprazole versus other atypical antipsychotics for schizophrenia. Cochrane Database Syst. Rev. 1, CD006569 (2014).
• Reports the Cochrane systematic review of aripiprazole versus comparators upon which this analysis was conducted.
3.
Asmal L, Flegar SJ, Wang J, Rummel-Kluge C, Komossa K, Leucht S. Quetiapine versus other atypical antipsychotics for schizophrenia. Cochrane Database Syst. Rev. 11, CD006625 (2013).
• Reports the Cochrane systematic review of quetiapine versus risperidone upon which this analysis was conducted.
4.
Komossa K, Rummel-Kluge C, Schwarz S et al. Risperidone versus other atypical antipsychotics for schizophrenia. Cochrane Database Syst. Rev. 19(1), CD006626 (2011).
• Reports the Cochrane systematic review of risperidone versus olanzapine upon which this analysis was conducted.
5.
Leucht S, Corves C, Arbter D, Engel RR, Li C, Davis JM. Second-generation versus first-generation antipsychotic drugs for schizophrenia: a meta-analysis. Lancet 373(9657), 31–41 (2009).
6.
Citrome L. A systematic review of meta-analyses of the efficacy of oral atypical antipsychotics for the treatment of adult patients with schizophrenia. Expert Opin. Pharmacother. 13(11), 1545–1573 (2012).
7.
Leucht S, Tardy M, Komossa K et al. Antipsychotic drugs versus placebo for relapse prevention in schizophrenia: a systematic review and meta-analysis. Lancet 379(9831), 2063–2071 (2012).
8.
Geddes J, Freemantle N, Harrison P, Bebbington P. Atypical antipsychotics in the treatment of schizophrenia: systematic overview and meta-regression analysis. BMJ 321(7273), 1371–1376 (2000).
9.
Bartoli F, Crocamo C, Clerici M, Carra G. Second-generation antipsychotics and adiponectin levels in schizophrenia: a comparative meta-analysis. Eur. J. Neuropsychopharmacol. 25(10), 1767–1774 (2015).
10.
Deeks JJ, Altman DG, Bradburn MJ. Statistical methods for examining heterogeneity and combining results from several studies in meta-analysis. In: Systematic Reviews in Health Care: Meta-Analysis in Context. Egger M, Davey Smith G, Altman DG (Eds). BMJ Books, London, UK, 285–311 (2001).
11.
Thompson SG. Why sources of heterogeneity in meta-analysis should be investigated. BMJ 309(6965), 1351–1355 (1994).
12.
Eysenck HJ. Problems with meta-analysis. In: Systematic Reviews. Chalmers I, Altman DG (Eds). BMJ Publishing Group, London, UK, 64–74 (1995).
13.
Borenstein M, Hedges LV, Higgins JPT, Rothstein HR. Heterogeneity: overview. In: Introduction to Meta-Analysis. John Wiley & Sons, Ltd, Chichester, UK, 105–106 (2009).
14.
Cochrane Handbook for Systematic Reviews of Interventions. Higgins JPT, Green S (Eds). Version 5.1.0 [updated March 2011] (2011). www.cochrane-handbook.org.
15.
Fletcher J. What is heterogeneity and is it important? BMJ 334(7584), 94–96 (2007).
16.
Higgins JPT, Altman DG, Gøtzsche PC et al. The Cochrane Collaboration's tool for assessing risk of bias in randomised trials. BMJ 343, d5928 (2011).
17.
Dechartres A, Altman DG, Trinquart L, Boutron I, Ravaud P. Association between analytic strategy and estimates of treatment outcomes in meta-analyses. JAMA 312(6), 623–630 (2014).
•• Presents the sensitivity approaches applied in this study. Reports general results across a large sample of meta-analyses.
18.
Egger M, Dickersin K, Davey Smith G. Problems and limitations in conducting systematic reviews. In: Systematic Reviews in Health Care: Meta-analysis in Context. Egger M, Davey Smith G, Altman DG (Eds). BMJ Books, London, UK, 43–68 (2001).
19.
Borenstein M, Hedges LV, Higgins JPT, Rothstein HR. Criticisms of meta-analysis. In: Introduction to Meta-Analysis. John Wiley & Sons, Ltd, Chichester, UK, 377–387 (2009).
20.
Borenstein M, Hedges LV, Higgins JPT, Rothstein HR. Publication bias. In: Introduction to Meta-Analysis. John Wiley & Sons, Ltd, Chichester, UK, 277–292 (2009).
21.
Sterne JAC, Egger M, Davey Smith G. Investigating and dealing with publication and other biases. In: Systematic Reviews in Health Care: Meta-Analysis in Context. Egger M, Davey Smith G, Altman DG (Eds). BMJ Books, London, UK, 189–208 (2001).
22.
Schwarzer G, Carpenter JR, Rucker G. Small-study effects in meta-analysis. In: Meta-Analysis With R. Springer International Publishing, Cham, Switzerland, 107–141 (2015).
• Describes the implementation of limit meta-analysis in R, as applied in this study.
23.
Rucker G, Carpenter JR, Schwarzer G. Detecting and adjusting for small-study effects in meta-analysis. Biomed. J. 53(2), 351–368 (2011).
•• Details the methodology underpinning the limit meta-analysis applied in the current study.
24.
Asenjo Lobos C, Komossa K, Rummel-Kluge C et al. Clozapine versus other atypical antipsychotics for schizophrenia. Cochrane Database Syst. Rev. 10(11), CD006633 (2010).
25.
Komossa K, Rummel-Kluge C, Hunger H et al. Olanzapine versus other atypical antipsychotics for schizophrenia. Cochrane Database Syst. Rev. 17(3), CD006654 (2010).
26.
Komossa K, Rummel-Kluge C, Hunger H et al. Ziprasidone versus other atypical antipsychotics for schizophrenia. Cochrane Database Syst. Rev. 7(4), CD006627 (2009).
27.
Kay SR, Opler LA, Fiszbein A. Positive and Negative Syndrome Scale (PANSS) Manual. Multi-Health Systems, NY, USA (1986).
28.
R Development Core Team. R version 3.0.1: a language and environment for statistical computing (2013). http://CRAN.R-project.org.
29.
Glasziou PP, Shepperd S, Brassey J. Can we rely on the best trial? A comparison of individual trials and systematic reviews. BMC Med. Res. Methodol. 10, 23 (2010).
30.
Dechartres A, Trinquart L, Boutron I, Ravaud P. Influence of trial sample size on treatment effect estimates: meta-epidemiological study. BMJ 346, f2304 (2013).
31.
Rucker G, Schwarzer G, Carpenter JR, Binder H, Schumacher M. Treatment-effect estimates adjusted for small-study effects via a limit meta-analysis. Biostatistics 12(1), 122–142 (2011).
32.
Schwarzer G, Carpenter JR, Rucker G. Advanced statistical methods to model and adjust for bias in meta-analysis (2014). http://cran.r-project.org/web/packages/metasens/metasens.pdf.
33.
Haddad PM, Brain C, Scott J. Nonadherence with antipsychotic medication in schizophrenia: challenges and management strategies. Patient Relat. Outcome Meas. 5, 43–62 (2014).
34.
Acosta FJ, Hernández JL, Pereira J, Herrera J, Rodríguez CJ. Medication adherence in schizophrenia. World J. Psych. 2(5), 74–82 (2012).
35.
Furukawa TA, Levine SZ, Tanaka S et al. Initial severity of schizophrenia and efficacy of antipsychotics: participant-level meta-analysis of 6 placebo-controlled studies. JAMA Psych. 72(1), 14–21 (2015).
36.
Higgins JP, Thompson SG, Deeks JJ, Altman DG. Measuring inconsistency in meta-analyses. BMJ 327(7414), 557–560 (2003).
37.
Liu S, Ren C, Song X. Comparative study between aripiprazole and clozapine in the treatment of first-episode schizophrenia. Chin. J. Health Psychol. 14(6), 658–659 (2006). Cited in: Khanna P, Suo T, Komossa K et al. Aripiprazole versus other atypical antipsychotics for schizophrenia. Cochrane Database Syst. Rev. 1, CD006569 (2014).
38.
Zhang Q-l, Zhai J. Aripiprazole and clozapine in treatment refractory schizophrenia. West China Med. J. 25(6), 1033–1035 (2010). Cited in: Khanna P, Suo T, Komossa K et al. Aripiprazole versus other atypical antipsychotics for schizophrenia. Cochrane Database Syst. Rev. 1, CD006569 (2014).
39.
Zhang Y, Yu Z. Aripiprazole and clozapine in the treatment refractory schizophrenia comparative observation. People's Military Surgeon 52(12), 822–823 (2009). Cited in: Khanna P, Suo T, Komossa K et al. Aripiprazole versus other atypical antipsychotics for schizophrenia. Cochrane Database Syst. Rev. 1, CD006569 (2014).
40.
Yuan Cl. Quetiapine and aripiprazole in the treatment of first episode schizophrenia. Chinese Modern Medicine Application 2(3), 71 (2009). Cited in: Khanna P, Suo T, Komossa K et al. Aripiprazole versus other atypical antipsychotics for schizophrenia. Cochrane Database Syst. Rev. 1, CD006569 (2014).
41.
Wei L, Zhu H, Zhao Q, Quan T. Aripiprazole and quetiapine in the treatment of schizophrenia. Shandong Archive of Psychiatry 22(1), 42–43 (2009). Cited in: Khanna P, Suo T, Komossa K et al. Aripiprazole versus other atypical antipsychotics for schizophrenia. Cochrane Database Syst. Rev. 1, CD006569 (2014).
42.
Zhang D, Gan JL, Gao C, Duan H. Aripiprazole and risperidone on glucose and lipid. Linchuang Jinghen Yixue Zazhi 19(5), 343–345 (2009). Cited in: Khanna P, Suo T, Komossa K et al. Aripiprazole versus other atypical antipsychotics for schizophrenia. Cochrane Database Syst. Rev. 1, CD006569 (2014).
43.
Luo L. Aripiprazole and risperidone in the treatment of schizophrenia efficacy analysis. Contemporary Medicine 15(170), 101–102 (2009). Cited in: Khanna P, Suo T, Komossa K et al. Aripiprazole versus other atypical antipsychotics for schizophrenia. Cochrane Database Syst. Rev. 1, CD006569 (2014).
44.
Chen Y, Huang W, Ye X. Comparative study between aripiprazole and olanzapine in the treatment of agitated schizophrenia. Linchuang Jingshen Tizue Zazhi 19(4), 261–262 (2009). Cited in: Khanna P, Suo T, Komossa K et al. Aripiprazole versus other atypical antipsychotics for schizophrenia. Cochrane Database Syst. Rev. 1, CD006569 (2014).
45.
Zimbroff D, Warrington L, Loebel A, Yang R, Siu C. Comparison of ziprasidone and aripiprazole in acutely ill patients with schizophrenia or schizoaffective disorder: a randomized, double-blind, 4-week study. Int. Clin. Psychopharmacol. 22(6), 363–370 (2007). Cited in: Khanna P, Suo T, Komossa K et al. Aripiprazole versus other atypical antipsychotics for schizophrenia. Cochrane Database Syst. Rev. 1, CD006569 (2014).
46.
Potkin SG, Gharabawi GM, Greenspan AJ et al. A double-blind comparison of risperidone, quetiapine and placebo in patients with schizophrenia experiencing an acute exacerbation requiring hospitalization. Schizophr. Res. 85(1-3), 254–265 (2006). Cited in: Asmal L, Flegar SJ, Wang J, Rummel-Kluge C, Komossa K, Leucht S. Quetiapine versus other atypical antipsychotics for schizophrenia. Cochrane Database Syst. Rev. 11, CD006625 (2013).
47.
Zhong KX, Sweitzer DE, Hamer RM, Lieberman JA. Comparison of quetiapine and risperidone in the treatment of schizophrenia: A randomized, double-blind, flexible-dose, 8-week study. J. Clin. Psych. 67(7), 1093–1103 (2006). Cited in: Asmal L, Flegar SJ, Wang J, Rummel-Kluge C, Komossa K, Leucht S. Quetiapine versus other atypical antipsychotics for schizophrenia. Cochrane Database Syst. Rev. 11, CD006625 (2013).
48.
Atmaca M, Kuloglu M, Tezcan E, Ustundag B. Serum leptin and triglyceride levels in patients on treatment with atypical antipsychotics. J. Clin. Psych. 64(5), 598–604 (2003). Cited in: Komossa K, Rummel-Kluge C, Schwarz S et al. Risperidone versus other atypical antipsychotics for schizophrenia. Cochrane Database Syst. Rev. CD006626 (2011).
49.
Kilburg A, Galani Berardo C, Souto D, Llorca PM. Outcomes in schizophrenia: what does ‘clinically meaningful’ mean to payers? Value Health 17(3), A57 (2014).
50.
Leucht S, Kane JM, Kissling W, Hamann J, Etschel E, Engel RR. What does the PANSS mean? Schizophr. Res. 79(2–3), 231–238 (2005).
51.
Hermes EDA, Sokoloff DM, Stroup TS, Rosenheck RA. Minimum clinically important difference in the positive and negative syndrome scale using data from the CATIE schizophrenia trial. J. Clin. Psych. 73(4), 526–532 (2012).
52.
Leddy-Stacy MA, Rosenheck R. Obtaining employment as an anchor for estimating the minimum clinically important difference on the Positive and Negative Syndrome Scale (PANSS) in schizophrenia. Psychiatry Res. 238, 304–309 (2016).
53.
Meltzer HY, Risinger R, Nasrallah HA et al. A randomized, double-blind, placebo-controlled trial of aripiprazole lauroxil in acute exacerbation of schizophrenia. J. Clin. Psych. 76(8), 1085–1090 (2015).
54.
Kane JM, Potkin SG, Daniel DG, Buckley PF. A double-blind, randomized study comparing the efficacy and safety of sertindole and risperidone in patients with treatment-resistant schizophrenia. J. Clin. Psych. 72(2), 194–204 (2011).
55.
Shah S, Joshi D. Tolerability and efficacy of paliperidone ER compared to olanzapine in the treatment of schizophrenia: a randomized, double–blind, multicentric trial. Ind. Psychiatry J. 20(1), 25–31 (2011).
56.
Hoffmann TC, Erueti C, Glasziou PP. Poor description of non-pharmacological interventions: analysis of consecutive sample of randomised trials. BMJ 347, f3755 (2013).
57.
Bristol-Myers Squibb. A multicenter, double-blind, randomized, comparative study of aripiprazole and olanzapine in the treatment of patients with acute schizophrenia. Clinical Study Report CN138003 (2005). Cited in: Khanna P, Suo T, Komossa K et al. Aripiprazole versus other atypical antipsychotics for schizophrenia. Cochrane Database Syst. Rev. 1, CD006569 (2014).
58.
Stafford MR, Mayo-Wilson E, Loucas CE et al. Efficacy and safety of pharmacological and psychological interventions for the treatment of psychosis and schizophrenia in children, adolescents and young adults: a systematic review and meta-analysis. PLoS ONE 10(2), e0117166 (2015).
59.
Hrdlicka M, Dudova I. Atypical antipsychotics in the treatment of early-onset schizophrenia. Neuropsychiatr. Dis. Treat. 11, 907–913 (2015).
60.
Suzuki T, Remington G, Arenovich T et al. Time course of improvement with antipsychotic medication in treatment-resistant schizophrenia. Br. J. Psych. 199(4), 275–280 (2011).
61.
Sherwood M, Thornton AE, Honer WG. A meta-analysis of profile and time-course of symptom change in acute schizophrenia treated with atypical antipsychotics. Int. J. Neuropsychopharmacol. 9(3), 357–366 (2006).
62.
Goldacre B. Missing data. In: Bad Pharma: How Medicine is Broken, and How We Can Fix it. Fourth Estate, London, UK, 1–100 (2013).
Information & Authors
Information
Published In
Copyright
© 2018 Future Medicine Ltd.
History
Received: 12 March 2018
Accepted: 30 July 2018
Published online: 22 August 2018
Keywords:
Topics
Authors
Metrics & Citations
Metrics
Article Usage
Article usage data only available from February 2023. Historical article usage data, showing the number of article downloads, is available upon request.
Citations
How to Cite
Assessing the robustness of direct meta-analysis in the presence of heterogeneity. (2018) Journal of Comparative Effectiveness Research. DOI: 10.2217/cer-2018-0024
Export citation
Select the citation format you wish to export for this article or chapter.