Relative effectiveness of sunitinib versus everolimus in advanced pancreatic neuroendocrine tumors: an updated matching-adjusted indirect comparison
Abstract
Aim: A matching-adjusted indirect comparison (MAIC) of sunitinib and everolimus has been previously reported based on the RADIANT-3 everolimus trial. We performed an analysis using updated overall survival (OS) data based on sunitinib's trial (A6181111). Methods: The MAIC matched on all baseline characteristics available from both studies. An anchored MAIC was performed for progression-free survival (PFS); an unanchored analysis was deemed more appropriate for OS due to crossover in both trials. A hazard ratio for sunitinib versus everolimus was derived from adjusted (weighted) sunitinib effects compared with the observed results for everolimus. Results: The adjusted hazard ratio for sunitinib versus everolimus was 0.85 (0.39–1.89) for PFS and 0.82 (0.53–1.27) for OS. Conclusion: Findings indicate comparable PFS and OS with sunitinib and everolimus.
Neuroendocrine neoplasms of the pancreas account for a minority (<5%) of pancreatic malignancies; their clinical behavior, driven by their pathology, ranges from aggressive malignancy (poorly differentiated, grade 3 neuroendocrine carcinomas) to a more indolent spectrum (well-differentiated [grade 1 and 2] neuroendocrine tumors [NETs]) [1]. Although, a small proportion of patients with pancreatic NET (panNET) harbors an inherited predisposition, most are sporadic. Additionally, most are nonfunctional, although some patients have discrete clinical syndromes due to hormonal hypersecretion (e.g., insulinomas, glucagonomas, etc.) [2].
Surgery for patients with early-stage disease is the cornerstone of therapy for patients with well-differentiated NETs; in advanced disease, chemotherapy (with older agents such as streptozocin, 5-fluorouracil and doxorubicin) had been used for decades in the absence of new therapies [3]. More recently, both sunitinib and everolimus have been approved for the treatment of patients with advanced, progressive, well-differentiated panNET, changing the treatment paradigm. Their approval was based on the evidence of efficacy in prolonging progression-free survival (PFS) compared with best supportive care (BSC + placebo) shown in their respective Phase III trials (A6181111 [4] compared BSC + sunitinib vs BSC + placebo, and RADIANT-3 [5] compared BSC + everolimus vs placebo). At the first analysis, the A6181111 trial also suggested an overall survival (OS) benefit, although this failed to reach statistical significance, most likely due to the small sample size and the confounding effect of crossover from the BSC + placebo arm to sunitinib.
Given the simultaneous emergence of these two therapies (both published in 2011), there are no head-to-head studies comparing sunitinib and everolimus; therefore, evidence of their relative effectiveness needs to be derived through indirect comparisons of outcomes. Typically, this would be handled using a network meta-analysis (NMA) [6–8] since the trials share common reference treatments. An NMA may be unreliable, however, when the design and/or population of the studies in the network differ in a significant way. A specific challenge in the context of the sunitinib and everolimus trials is crossover from placebo to respective active drug. That is, patients who progress with BSC + placebo could crossover and receive sunitinib or everolimus in an open-label, extended follow-up phase of the studies. Although, this has no impact on the assessment of PFS (since progression precedes crossover), comparison of OS is distorted, as outcomes in the BSC + placebo arms reflect a mixture of the effects of BSC and sunitinib or everolimus after progression. If these treatments have a differential effect on OS, the BSC + placebo arms of the two trials cannot be considered comparable. Furthermore, crossover may have occurred differently in the two trials in terms of the extent and timing of crossover, as well as the characteristics of patients who crossover. Thus, an NMA, which would rely on the BSC + placebo arms as an anchor for the comparison, may be unreliable as the arms may not be comparable across the trials due to the effects of crossover.
An indirect comparison is possible without an anchor arm by utilizing techniques such as a matching-adjusted indirect comparison (MAIC) [9]. An MAIC was previously performed for sunitinib and everolimus based on the A6181111 [4] trial (sunitinib vs BSC + placebo) and the RADIANT-3 trial [5] for everolimus [10]. The authors concluded that both PFS and OS were similar for the two treatments. More mature OS data have become available for both sunitinib [11] and everolimus [12] trials since the publication of the aforementioned MAIC; the data provide additional follow-up for OS and allow for the incorporation of additional baseline variables in the matching. An updated MAIC of sunitinib and everolimus was, therefore, carried out to assess relative OS using the data that included longer follow-up.
Methods
Overview of the A6181111 & RADIANT-3 trials
The A6181111 and RADIANT-3 studies are both Phase III randomized trials in patients with advanced, progressive and well-differentiated panNETs. Both studies had a similar design (placebo control, PFS as the primary end point and BSC in the control arms). Although the planned sample sizes of the studies were comparable at design, the studies differed in terms of final recruited population size, with A6181111 recruiting 171 patients (of 340 planned; with early closure on the advice of the Independent Safety Monitoring Committee) and RADIANT-3 recruited 410 patients, as planned. The inclusion and exclusion criteria were generally similar between the trials; both recruited patients with well-differentiated (grade 1 and 2) panNETs with radiological progression documented within the prior 12 months. A notable difference between the studies exists in the performance status (PS) of patients at enrollment; A6181111 included patients with a PS score of 0 or 1, while RADIANT-3 allowed patients with a score of 2. Only 3% of patients had a score of 2, however, which is likely to have had only a slight impact, if any, on the results from the trial. The characteristics of the two populations are summarized in Table 1.
| Baseline characteristics | A6181111 unmatched | A6181111 matched to RADIANT-3 | RADIANT-3 | ||||
|---|---|---|---|---|---|---|---|
| Sunitinib | BSC + placebo | Sunitinib | BSC + placebo matched to everolimus† | BSC + placebo matched to BSC + placebo‡ | Everolimus | BSC + placebo | |
| N/ESS | 86 | 85 | 43 | 31 | 37 | 207 | 203 |
| Age ≥58 (median in everolimus arm) | 0.44 | 0.47 | 0.50 | 0.50 | 0.50 | 0.50 | 0.50 |
| Age ≥65 | 0.26 | 0.27 | 0.27 | 0.27 | 0.27 | 0.27 | 0.27 |
| Female | 0.51 | 0.53 | 0.47 | 0.47 | 0.42 | 0.47 | 0.42 |
| Race: white | 0.56 | 0.63 | 0.79 | 0.79 | 0.79 | 0.79 | 0.79 |
| ECOG PS: 0 | 0.62 | 0.48 | 0.67 | 0.67 | 0.66 | 0.67 | 0.66 |
| ECOG PS: 1, 2 | 0.38 | 0.52 | 0.33 | 0.33 | 0.34 | 0.33 | 0.34 |
| Time since diagnosis ≥3 years | 0.40 | 0.56 | 0.47 | 0.47 | 0.47 | 0.47 | 0.47 |
| Number of sites: 0–1 | 0.36 | 0.28 | 0.25 | 0.25 | 0.31 | 0.25 | 0.31 |
| Number of sites: 2 | 0.36 | 0.33 | 0.41 | 0.41 | 0.32 | 0.41 | 0.32 |
| Number of sites: ≥3 | 0.28 | 0.39 | 0.34 | 0.34 | 0.38 | 0.34 | 0.38 |
| Metastasis site: liver | 0.92 | 0.92 | 0.92 | 0.92 | 0.92 | 0.92 | 0.92 |
| Metastasis site: pancreas | 0.41 | 0.36 | 0.44 | 0.44 | 0.41 | 0.44 | 0.41 |
| Metastasis site: lymph nodes | 0.34 | 0.48 | 0.33 | 0.33 | 0.36 | 0.33 | 0.36 |
| Metastasis site: lung | 0.10 | 0.18 | 0.14 | 0.14 | 0.15 | 0.14 | 0.15 |
| Presence of distant metastases | 0.95 | 0.94 | 0.96 | 0.96 | 0.96 | 0.96 | 0.96 |
| Prior use of somatostatin analogs | 0.35 | 0.38 | 0.49 | 0.49 | 0.50 | 0.49 | 0.50 |
| Concurrent use of somatostatin analogs | 0.27 | 0.29 | 0.40 | 0.40 | 0.40 | 0.40 | 0.40 |
| Prior use of systemic chemotherapy | 0.66 | 0.72 | 0.50 | 0.50 | 0.50 | 0.50 | 0.50 |
| Prior use of radiotherapy | 0.10 | 0.14 | 0.23 | 0.23 | 0.20 | 0.23 | 0.20 |
†Used in anchored MAIC for PFS.
‡Used in analyses to assess residual confounding and potential study effects (unanchored PFS comparison of BSC + placebo arms).
BSC: Best standard of care; ECOG PS: Eastern Cooperative Oncology Group performance status; ESS: Effective sample size; MAIC: Matching-adjusted indirect comparison; PFS: Progression-free survival.
The A6181111 study terminated early on the recommendation of the safety monitoring committee due to “the greater number of deaths and serious adverse events in the placebo group and the difference in PFS favor of sunitinib” [4] at an interim analysis of the data. As a result, follow-up for PFS was shorter in A6181111, although OS follow-up continued beyond the end of both trials. The studies also differed with respect to the schedule for radiological assessment based on interpretation of CT scans in accordance with RECIST evaluation, which was every 8 weeks in A6181111 and every 12 weeks in RADIANT-3. This implies that progression may have been detected earlier in A6181111.
Both studies demonstrated PFS gain when either sunitinib or everolimus was initiated versus BSC + placebo, with hazard ratios (HR) indicating an approximate 60% reduction in risk (0.42 [0.26–0.66] for sunitinib and 0.35 [0.27–0.45] for everolimus). Crossover from the BSC + placebo arm to the experimental arm occurred in both studies. In A6181111, 69% of patients in the BSC + placebo group crossed over at progression or early termination of the trial. In RADIANT-3, 85% of the reference group had crossed over at progression at the latest data cut [12]. The HRs for OS from the latest data cuts were 0.73 (0.50–1.06) for sunitinib and 0.94 (0.73–1.20) for everolimus.
Statistical methods
Overview of analytic approaches
The primary approach for indirect comparison was based on a MAIC; a traditional comparison using Bucher's approach was also applied as a reference. This was derived as the ratio of the HRs for PFS and OS in each of the trials, with confidence intervals (CIs) reflecting uncertainty from both results. That is, the standard error (SE) of the log of the ratio of HRs was calculated as the sum of the SEs of each of the study-specific log HRs.
The MAIC analyses used patient-level data from A6181111 (index trial) and aggregate data reported in publications for the comparator trial (RADIANT-3) [5,12]. The A6181111 data are analyzed to derive weights for each of the patients in the trial – this yields weighted average values of baseline characteristics (which include proportions for categorical variables) that match those of the RADIANT-3 population. The weights were derived from a propensity score–type equation (logistic regression) that predicts the odds that a patient is from the A6181111 or the RADIANT-3 trial. Since only aggregate data are available for the comparator trial, the coefficients of the equation must be estimated using the method of moments [9].
Success of matching was verified by comparing weighted mean characteristics of the index groups to match their target values. The effective sample size (ESS; the ESS is given by [∑wi ]2/[∑wi 2], where wi are the individual weights derived for patients in the index trial) of the index population after weighting was calculated to reflect the number of patients contributing to calculations where the weights are used. The ESS is determined by the extent of differences between the populations being matched – the larger the discrepancy between the populations, the lower the ESS. The ESS was also used to adjust the SEs and CIs of measures of relative effectiveness so that these reflect the actual extent of data contributing to the analyses. This is done by normalizing the weights to add up to the ESS for the group; as these weights are applied in calculations of weighted outcomes, SEs are also adjusted accordingly to reflect the ESS rather than the original sample size.
The balancing weights were applied to derive adjusted measures of outcomes with the index treatments in the comparators population. Two possible approaches are possible: one is an anchor-based analysis, which can be used when the treatments used in the reference arms are the same in the two trials. In this approach, the effect within the index trial (i.e., sunitinib vs BSC + placebo) is recalculated after applying the balancing weights to the two arms. This adjusts the HR to the characteristics of the comparator's population while preserving randomization within the index trial. A Bucher-type analysis was then applied to the adjusted HR and the reported HR for the comparator to obtain an estimate of relative effectiveness. An anchor-based analysis is possible for PFS in this MAIC, but not for OS since the BSC + placebo arms are contaminated by crossover. The second approach, which involves an arm-to-arm comparison after matching, is necessary to compare OS. In this case, weights were applied to sunitinib patients to derive an adjusted OS distribution (or Kaplan–Meier curve), which can be compared with the OS distribution of everolimus to derive an HR. The specific approach used in these analyses, including the arms being matched and how balancing weights were applied to derive adjusted outcomes, are described in the sections below.
The key features and assumptions of each approach and their appropriateness in this analysis are summarized in Table 2. The Bucher approach relies on the key assumption that the common BSC arms of the studies are comparable, and that there are no effect modifiers (i.e., subgroups within which the effect of sunitinib or everolimus varies). The anchored MAIC relaxes this requirement by matching on baseline characteristics, assuming that all effect modifiers are captured in the matching. The unanchored MAIC overcomes any issues of comparability of the BSC arms by deriving effects directly from the sunitinib and everolimus arms after adjustment for potential predictors and effect modifiers. By doing so, this approach breaks randomization and is susceptible to residual confounding if some predictors or effect modifiers are not included in the matching. Both MAIC-based analyses adjust to the population of RADIANT-3 and thus invoke an added assumption that the derived relative effects are applicable to the sunitinib population, as this is the basis of the comparison.
Variables included in matching
All commonly available variables from A6181111 and RADIANT-3 were included in the MAIC to ensure as close a match of the populations as possible. More specifically, the following variables were included: median age; the proportion >64 years; gender; race (white vs other); Eastern Cooperative Oncology Group (ECOG) PS; proportion of time since diagnosis of more than 3 years; number of disease sites (1, 2, 3+); presence of metastases in the liver, lymph nodes and lung; prior use of somatostatin analogs; concurrent use of somatostatin analogs; and prior treatment with systemic chemotherapy or prior radiotherapy treatment. Although arm-specific characteristics were available for almost all variables, the distribution of race, time since diagnosis and concurrent use of somatostatin analogs were only known for the combined population of the RADIANT-3 trial. These, therefore, had to be used in matching; given randomization, it is assumed that these values are very close to the arm-specific values and using them for matching should not impact results.
Comparison of progression-free survival
The MAIC of PFS was carried out as an anchor-based analyses; an arm-to-arm comparison was also performed to assess robustness of results.
For anchor-based analyses, weights were derived to match the sunitinib and BSC + placebo arms in A6181111 to the characteristics of the everolimus arm. Matching to a common target ensures that the weighted groups are comparable. Sensitivity analyses were performed to match the two index trial arms to the BSC + placebo group in RADIANT-3 to rule out any influence from residual differences in the everolimus and reference groups (which is unlikely given randomization).
A Cox proportional hazards model was fitted to the A6181111 data using the normalized weights to match each of the two arms to the characteristics of the everolimus group. This produces the expected HR for sunitinib versus BSC + placebo in a RADIANT-3-like population. The SE for the HR is adjusted to the ESS after matching due to use of the normalized weights. The relative effectiveness of sunitinib versus everolimus was then calculated as the ratio of the adjusted HR for sunitinib versus BSC + placebo and the HR for everolimus versus BSC + placebo reported in RADIANT-3 (0.35 [0.27–0.45]). A 95% CI was derived for this estimate using the square root of the sum of the variances of the two log-HRs used in the calculation. The variance of the adjusted HR was produced directly from the analyses, while the variance of the HR for everolimus was approximated from its 95% CI: log(upper bound/point estimate)/1.96.
As crossover does not impact on PFS, a standard Bucher calculation was applied on the published HRs for each of the treatments in their respective trials. This represents an unweighted analysis and served as a reference for MAIC-based calculations. An arm-to-arm comparison of PFS between sunitinib versus everolimus was also carried out; this used balancing weights to match the two arms in the comparison and followed the approach described in the next section for OS.
Comparison of overall survival
For OS comparisons, updated survival data for everolimus were taken from a poster presented at the American Society of Clinical Oncology (ASCO) conference in 2015 [12], and the most recent data cut of the A6181111 trial was used for OS with sunitinib. Since the BSC + placebo arms are contaminated by crossover, an arm-to-arm comparison was carried out between sunitinib and everolimus to compare OS. These analyses used weights derived from matching the sunitinib arm to the characteristics of the everolimus arm.
The Kaplan–Meier curve for OS for everolimus was digitized using (ENGAUGE software [13]), and converted to virtual patient-level (VPL) data using the approach of Hoyle and Henley [14]. This produces a sample of the same size as the everolimus group, with individuals assigned a time of death or censoring with an appropriate indicator based on the approximated counts of events and patients at risk [14]. These VPL data for everolimus are assigned a weight of 1 and combined with the patients from the sunitinib group who are assigned the normalized weights derived from the matching step.
A Cox proportional hazards model is then fitted to the index and VPL data, including an indicator for treatment group for sunitinib versus everolimus to capture the relative effect of sunitinib and everolimus. This is expressed as an HR with a 95% CI.
Residual confounding & potential study effects
MAICs rely on the assumption that all potential confounders are included in the matching and that other differences between studies (i.e., study effects) do not further distort comparisons. Anchor-based analyses, as described above for PFS, inherently account for this by using a relative effect estimate as the basis for comparison. This is not the case in arm-to-arm comparisons (as for OS), which are susceptible to potential biases due to missing matching variables or other differences. When the trials have common reference treatment arms, this assumption can be assessed by matching the reference arms and assessing any differences in outcomes. Similar results in the common arms after matching would support the validity of the results.
The BSC + placebo arms in the trials in this MAIC can be used to assess potential biases (due to residual confounding and study effects) in arm-to-arm comparisons. Given contamination by crossover, such an assessment is not possible based on OS in the BSC + placebo arms. It was, therefore, executed based on PFS, with the caveat that observed differences may not necessarily extrapolate to a bias in OS. For instance, imaging in A6181111 was carried out every 8 weeks, while RADIANT-3 followed a 12-week interval. This affects the timing of detection of progression, and as a result, affects the comparison of PFS curves, but it would not affect OS since that is assessed based on actual dates of death.
Balancing weights were derived for the BSC + placebo arm in A6181111, matching it directly to the BSC + placebo arm for RADIANT-3. An HR-quantifying differences in PFS was derived following the approach described for OS analyses. This involved converting the RADIANT-3 PFS curve to VPL, combining these data with the weighted patient-level data from A6181111, and applying a Cox model to obtain the adjusted HR.
Results
Matching of populations
Table 1 summarizes the baseline characteristics of the two arms of the sunitinib trial before and after matching to the everolimus arm in RADIANT-3. The most notable differences between the populations are in terms of race (the proportion of white patients is lower in A6181111), ECOG = 0 in the BSC + placebo arm (higher in A6181111), number of metastatic sites (lower in A6181111), concurrent use of somatostatin analog use (lower in A6181111), prior use of systemic chemotherapy (higher in A6181111) and prior use of radiotherapy (lower in A6181111). After matching, the populations have identical values for these characteristics.
| Features | Bucher comparison | Anchored MAIC | Unanchored MAIC |
|---|---|---|---|
| How does it work? | Comparison derived from ratio of HRs for sunitinib vs BSC and everolimus vs BSC | Adjusted HR for sunitinib vs BSC derived after matching population to RADIANT-3. Comparison derived from adjusted HR vs RADIANT-3 in Bucher analysis | Comparison derived without use of BSC arms. Compares outcomes (Kaplan–Meier curves) between sunitinib and everolimus, after matching the sunitinib population to RADIANT-3 |
| Key assumption | The common BSC arms are comparable between studies. The effect of each treatment is constant across different subgroups (i.e., no effect modification) | All potential effect modifiers are included in matching. Effect derived by matching to RADIANT-3 is applicable to the original sunitinib population | All predictors and effect modifiers of outcomes are included in the matching. Effect derived by matching to RADIANT-3 is applicable to the original sunitinib population |
| Appropriateness for PFS comparison | Appropriate, assuming no effect modifiers | Appropriate, and accounts for possible effect modification | Possible but susceptible to bias due to missing predictors or effect modifiers |
| Appropriateness for OS comparison | BSC arms not comparable due to possibly differential crossover patterns in the two trials | BSC arms not comparable due to possibly differential crossover patterns in the two trials | Necessary, to avoid using BSC arms. Susceptible to residual confounding bias |
BSC: Best supportive care; HR: Hazard ratio; MAIC: Matching-adjusted indirect comparison; OS: Overall survival; PFS: Progression-free survival.
The table also highlights some notable differences between the arms in the A6181111 trial itself, despite randomization. In particular, the sunitinib and BSC + placebo arms differed at baseline in terms of ECOG PS, time since diagnosis and metastasis sites. This implies that comparisons within the trial are susceptible to confounding by these differences.
The ESS after matching was 43 in the sunitinib arm and 31 in the BSC + placebo arm. The smaller ESS in the BSC + placebo arm is due to the larger differences in the proportion of patents with ECOG PS = 0, disease duration and metastasis of lymph nodes. Matching was also done between the two BSC + placebo arms to assess residual confounding, which led to an ESS of 37.
Comparison of progression-free survival
Both sunitinib and everolimus demonstrated improvement in PFS, with trials showing HRs in the order of 0.40 and reaching statistical significance (Table 3). A Bucher analysis applied to published results yields a relative HR of 1.20 (0.72–2.01), indicating no statistically significant difference between sunitinib and everolimus.
| Methods and comparison | Hazard ratio | 95% CI |
|---|---|---|
| Based on reported HRs | ||
| Sunitinib vs BSC + placebo | 0.42 | 0.26–0.66 |
| Everolimus vs BSC + placebo | 0.35 | 0.27–0.45 |
| Bucher: sunitinib vs everolimus | 1.20 | 0.72–2.01 |
| Anchor-based MAIC | ||
| Sunitinib vs BSC + placebo – weighted to RADIANT-3 | 0.30 | 0.14–0.63 |
| Everolimus vs BSC + placebo – observed | 0.35 | 0.27–0.45 |
| Bucher: sunitinib vs everolimus | 0.85 | 0.39–1.89 |
BSC: Best standard of care; HR: Hazard ratio; MAIC: Matching-adjusted indirect comparison
The weighted HR for sunitinib versus BSC + placebo for the anchor-based MAIC was 0.30 (0.14–0.63), which implies a stronger effect than the unweighted HR (0.42 [0.26–0.66]). A comparison with the HR observed in RADIANT-3 for everolimus versus BSC + placebo (0.35 [0.27–0.45]), yields a relative HR of 0.85 (0.39–1.89) for sunitinib versus everolimus.
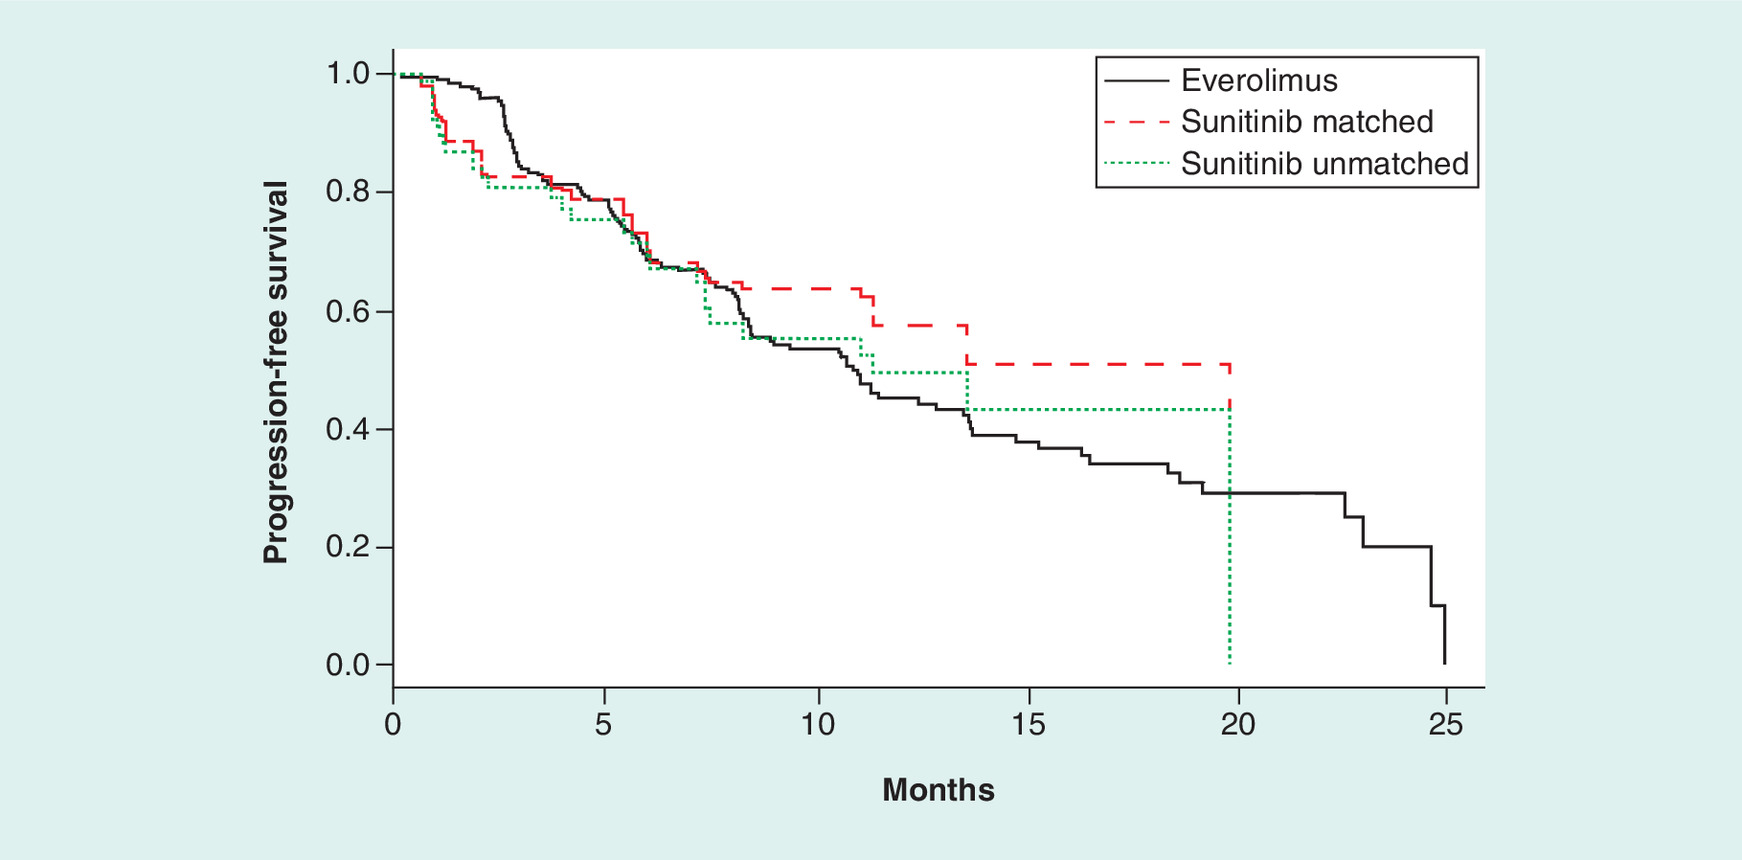
An arm-to-arm comparison of PFS was also carried out in sensitivity analyses – Figure 1 illustrates the observed PFS curves for sunitinib and everolimus as wel as the sunitinib curve after weighting to the everolimus curve. Comparison of the sunitinib-matched and everolimus curves yielded an HR of 0.86 (0.48–1.55), which is consistent with anchor-based analyses.
Comparison of overall survival
The OS data used in these analyses included 55 deaths in the sunitinib group, representing 64% of patients in the arm, and 126 deaths (60.9%) for everolimus. Figure 2 shows the observed OS curves based on the most recently available data cuts for sunitinib and everolimus, as well as the curve obtained from the everolimus-matched population for sunitinib. The effect of matching to the everolimus population profile is most apparent after around month 20, where the matched curve separates from the original (unmatched OS curve) and is characterized by relatively long flat periods. This reflects the combined effect of the drop in ESS after matching and greater weight being assigned to long-term survivors with sunitinib after matching.
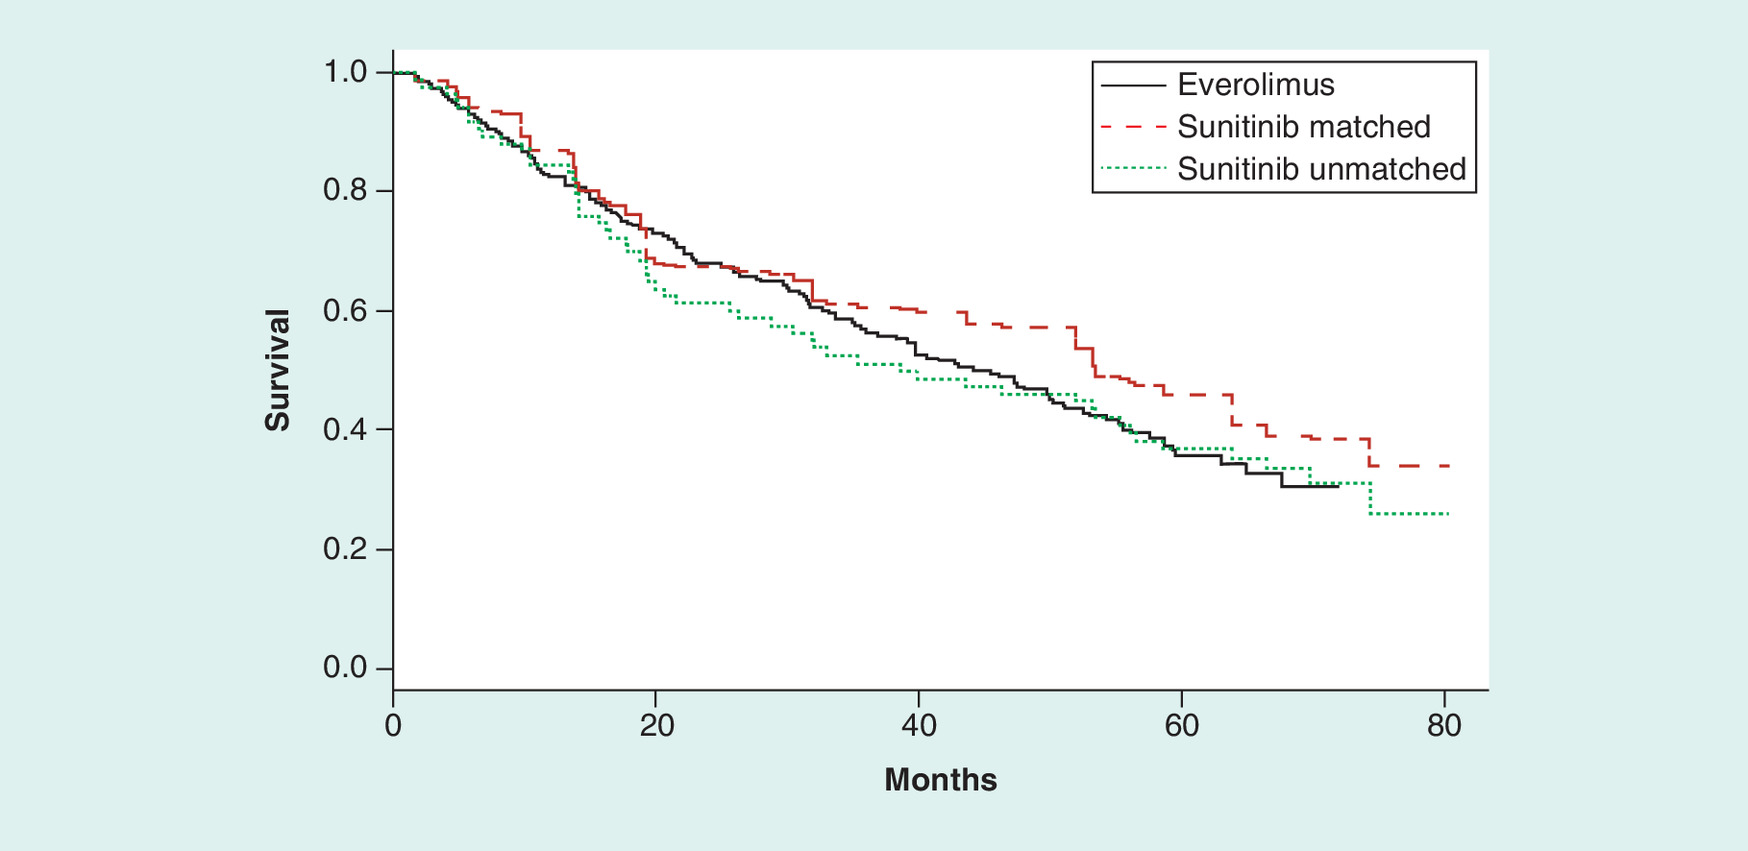
A combined analysis of the patient-level data for sunitinib and the VPL for everolimus produced an HR of 1.03 (0.75–1.42) when the populations were not matched. Applying the balancing weights (and hence matching the populations) yields an HR of 0.82 (0.53–1.27) – the median survival with sunitinib after matching was 53.4 months (38.6 months unmatched) and 44.0 months with everolimus.
Residual confounding & study effects (based on PFS)
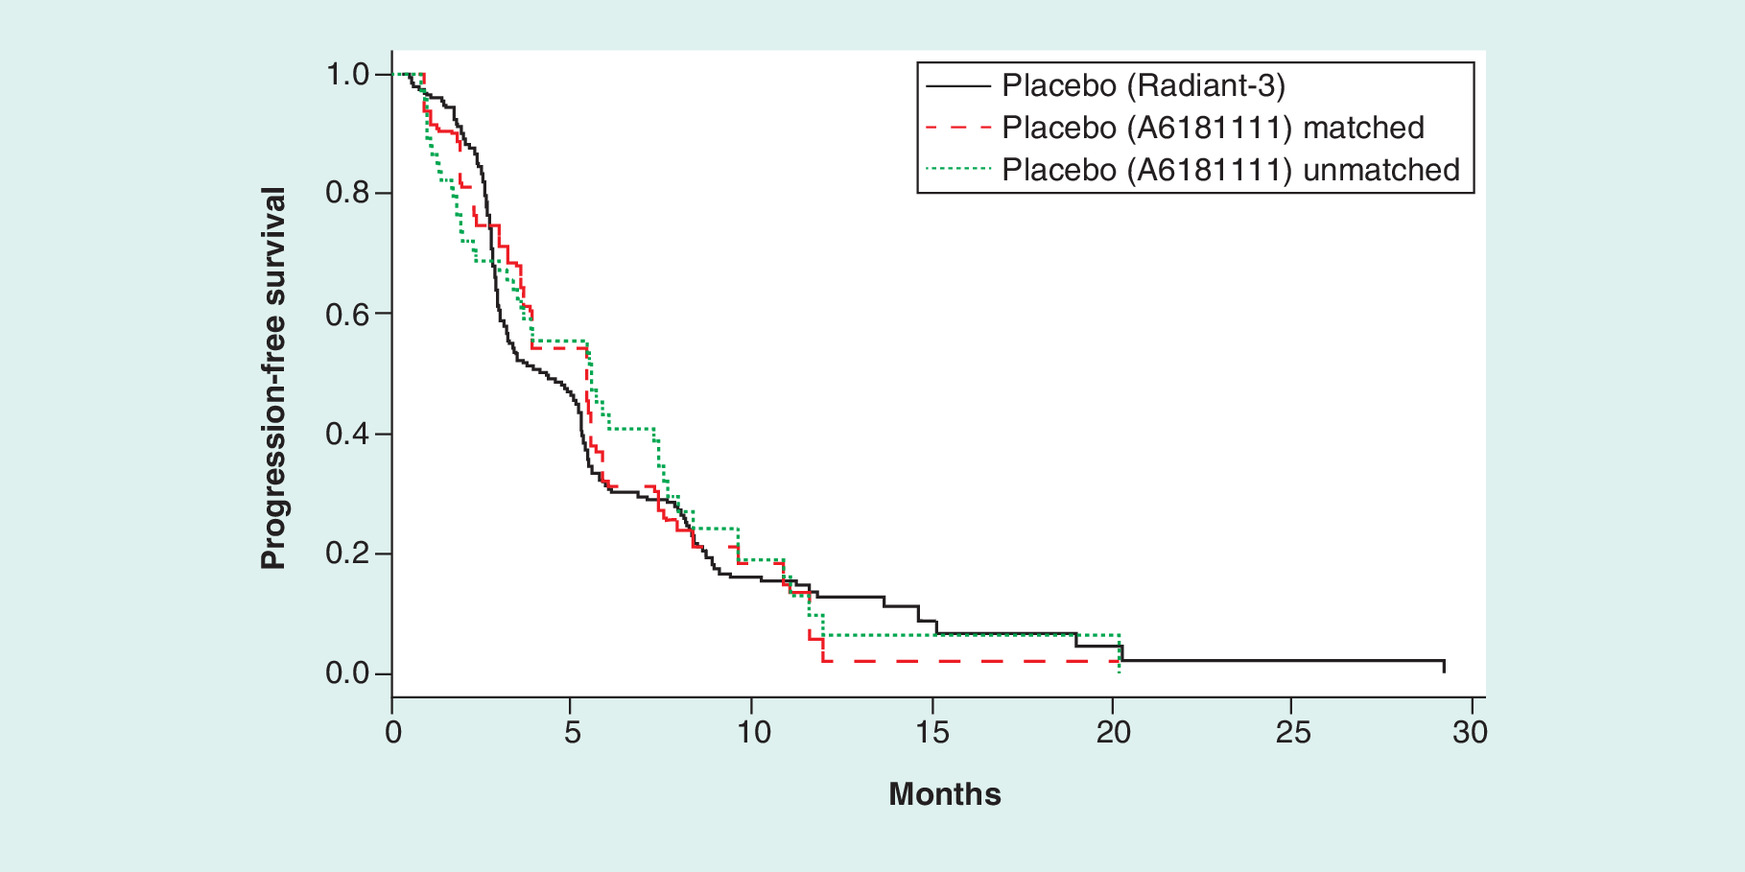
Residual confounding (i.e., unbalanced differences between populations) or bias due to other differences between the studies (i.e., study effects) was assessed by comparing the BSC + placebo arms of the A6181111 and RADIANT-3 trials (Figure 3). Although some early separation can be seen between the curves, this may be due to differences in the assessment cycles in the two trials. The curves otherwise overlap closely, indicating similar PFS with BSC + placebo in the two trials after matching. This is confirmed by the HR derived from comparing these curves (0.98 [0.62–1.54]).
Discussion
The A6181111 and RADIANT-3 trials have demonstrated similar clinical benefit with a reduction of 58 and 65% in the risk of progression or death with sunitinib and everolimus, respectively, compared with BSC. This MAIC of sunitinib and everolimus in patients with well-differentiated panNETs showed comparable PFS and OS, with relative effect estimates (i.e., HRs) that were statistically significant (since the CIs included the null HR: 1). This may be due in part to the relatively small sample size of the sunitinib trial and the further reduction in ESS after matching, which can limit the power to detect significance. A comparison of PFS in the BSC + placebo curves of the two trials after matching suggested very similar outcomes, with an HR of 0.98. This supports the reliability of these analyses, as it suggests that there is no evidence of residual confounding or study effects that may distort the results for comparisons of sunitinib and everolimus.
Our results agree with those from the prior MAIC by Signorovitch et al., [10] which found sunitinib and everolimus to be comparable in terms of PFS and OS. The methods in the two analyses followed the same general approaches. A difference of note is in the variables included in matching; this MAIC included all the same variables used previously and supplemented them with race, prior to radiotherapy treatment, and concurrent use of somatostatin analogs and replaced presence of distant metastases with specific sites of metastases (liver, pancreas, lymph node, lung). The aim was to ensure a close match between the populations being compared. The HR for PFS for everolimus versus BSC + placebo used by Signorovitch et al. differed from the result reported by Yao et al. [5] in the trial publication (0.38 vs 0.35) – this may have been due to exclusion of observations due to missing data in baseline characteristics.
Although the general conclusions from the analyses agreed, some differences were noted in the point estimates obtained. For instance, both yielded CIs suggesting no statistically significant differences between treatments, but the point estimates went in opposite directions, with the current analyses favoring sunitinib. For PFS, this MAIC yielded an HR of 0.85 (0.39–1.89) for sunitinib versus everolimus, while the prior analyses found an HR of 1.20 (0.65–2.17) [10] for the same comparison. The reversal of direction of the estimate is due to a notable change in the sunitinib versus BSC + placebo HR, which went from 0.42–0.30 after matching. This change in HR is because of the baseline imbalances between the sunitinib and BSC + placebo arms in the A6181111 trial noted above – in particular, in the proportion of patients with ECOG PS = 0, disease duration of 3 or more years and number of sites. Since both groups are matched to the characteristics of the same comparator population, the weighting of patients in the calculation of the HR effectively balances out the baseline differences (in addition to matching the groups to the comparator population). Thus, if the prior MAIC [10] had used an adjusted HR for sunitinib versus BSC + placebo, results should have aligned in direction. To verify this, we derived the HR for sunitinib versus BSC + placebo after adjusting for baseline variables included in the MAIC; this gave an HR of 0.32 (0.19–0.53), which contrasted with the weighted HR for everolimus versus BSC + placebo, which yielded a relative HR: 0.91 (0.48–1.74) for sunitinib versus everolimus.
The direction of the point estimates from OS analyses also differed in a similar way, suggesting a potential signal of improved survival with sunitinib (HR: 0.82 [0.53–1.27]) versus everolimus, while the analyses by Signorovitch et al. [10] yielded an HR of 1.23 (0.76–2.04). This may be due to changes in survival in the more recent cuts of OS used in the current analyses, or possibly the fact that more variables are included in the matching. The latter was assessed by repeating analyses using the same matching variables as those used in the prior MAIC; the HR derived from these analyses was 0.80 (0.54–1.19), which is nearly identical to the one obtained with all variables. Therefore, the results are likely reflective of changes in the updated OS data.
The direction of HR derived in these analyses appears to be mostly driven by a separation of the OS curves after 30 months. This may reflect a delayed benefit for sunitinib, but may also be spurious due to the relatively small sample size in the sunitinib group (particularly after matching). Results may also be impacted by differences in long-term treatment choices between the groups. This is not factored into the current analyses and may influence the shape of the curves over the longer term. Therefore, relying on the earlier OS patterns where the data are richer provides a conservative assessment of the analyses that would conclude comparable survival.
The key limitation in these analyses is the small sample size of the sunitinib trial. Although more mature data on OS were available for these analyses, the sample provided only 55 deaths. This limits the possibility of detecting significant differences, as well as of exploring and capturing time-varying effects between the arms. Analyses matched on a broad range of variables; however, some minor differences remained. For instance, the RADIANT-3 trial included patients with ECOG level 2, while A6181111 excluded these patients; it is therefore impossible to balance out this difference. Given that this only represents 3% of patients in RADIANT-3, its impact is deemed to be minimal. Similarly, two patients in the sunitinib trial had no metastases, while all in RADIANT-3 had at least one. Given the very low count, this difference is also considered inconsequential.
The studies may have also differed in terms of other factors that were not available from the two trials, like the presence of syndrome and the presence of inherited genetic conditions. Tumor differentiation is another potential source of residual confounding; all patients in A6181111 had well-differentiated tumors based on the WHO classification, of which 18% corresponded to the well-differentiated definition used in RADIANT-3 (based on the American classification) and 82% would be considered moderately differentiated. The composition of the RADIANT-3 population was predominantly well differentiated (83%). Given the large discrepancy between studies, adjustment for this factor would lead to significant reductions in the ESS after matching. The PFS comparisons in our analyses should not be affected as these were anchored to the BSC arms; OS analyses are subject to residual confounding, however. We believe the impact may be limited since subgroup analyses in this trial [5] did not detect any differential effect in subgroups; furthermore, our assessment of residual confounding based on PFS in the BSC arms did not reveal any significant differences in outcomes after matching on other factors. Another limitation is the role of subsequent therapies in each arm that may have impacted OS (including chemotherapy, somatostatin analogs, peptide receptor radionuclide therapy, etc.). Matching included prior and concurrent use of somatostatins; however, subsequent treatment options may vary depending on patient-specific factors, but will also vary by region based on availability and reimbursement of each therapy option, but cannot be included in the matching to balance the comparison.
Sensitivity analyses were carried out to assess the robustness of results to assumptions. Anchor-based PFS analyses weighted the two arms of the A6181111 trial to the characteristics of the everolimus arm. We repeated the anchor-based MAIC matching the A6181111 groups to the characteristics of BSC + placebo arm of RADIANT-3 and obtained consistent results. The weighted HR for sunitinib versus BSC + placebo was 0.32 (0.16–0.65; compared with 0.30 [0.14–0.63]), and the indirect comparison of sunitinib versus everolimus was 0.93 (0.44–1.94; compared with 0.85 [0.39–1.89]). We also performed an arm-to-arm MAIC for PFS, as in the OS analyses. The HR obtained from this comparison was 0.86 (0.48–1.55), which is consistent with anchor-based analyses.
We also assessed whether the variables included in the matching affected the results; in particular, matching on a relatively large number of variables when the sample size of the index trial is relatively small was a potential concern as it may make the analyses susceptible to spurious results and limit generalizability. We repeated analyses matching only on variables previously used in the MAIC by Signorovitch et al. [10]. These produced very similar results to those from the full set of matched variables. For instance, the MAIC of PFS for sunitinib versus everolimus was 0.95 (0.49–1.83) with the reduced set compared with 0.85 (0.39–1.89) when including all available variables. The difference may be indicative of additional adjustment provided by the variables added in the matching in the current analyses. Similarly, OS comparison with the reduced set of variables was 0.80 (0.54–1.19) compared with 0.82 (0.53–1.27) with all available variables matched. The effect of matching on additional variables can be seen on the width of the CIs, however, which are wider when all variables are included.
The lack of an anchor for OS comparisons is another limitation of these analyses, as it forces breaking randomization when comparing across trials. This potentially leaves the comparisons susceptible to confounding due to variables that are not available for matching or differences in study design or execution that may have affected results. No specific issues that may cause such distortions were identified. Furthermore, an assessment of potential residual confounding based on PFS compared across the two BSC + placebo arms after matching showed nearly identical outcomes. This suggests no evidence of residual confounding or study effects in PFS. It must be noted, however, that this assessment would not identify potential biases that may affect only OS and not PFS.
Conclusion & future perspective
In conclusion, based on the latest available clinical data from the A6181111 and RADIANT-3 trials, this MAIC showed similar PFS and OS between sunitinib and everolimus in patients with advanced panNETs. Given the differing mechanism of action, patients should have access to both active agents during the course of their treatment, along with awareness of their respective toxicity profiles. There are relatively limited data on the use of and outcomes with these treatments outside of the regulatory setting; a few studies have examined their use and found both to be safe and effective in actual practice [15–17]. Future research is needed to understand the optimal sequencing of these therapies (with respect to each other and other treatment options) as well as identification of biomarkers of benefit (or lack of benefit) and emergence of resistance.
Phase III trials for sunitinib (A6181111) and everolimus (RADIANT-3) have demonstrated efficacy for the treatment of patients with advanced, progressive, well-differentiated pancreatic neuroendocrine tumors when added to best supportive care; there are no head-to-head studies comparing these treatments.
A matching-adjusted indirect comparison (MAIC) has been previously performed based on the RADIANT-3 trial and found comparable progression-free survival (PFS) and overall survival (OS) with sunitinib and everolimus. More recent data cuts from these trials have become available, allowing an updated comparison of OS.
Our MAIC was based on the A6181111 trial but otherwise followed a similar methodology to that applied in the previous analysis, matching on all commonly available baseline characteristics of the study populations (including a few that were not considered in the previous MAIC).
PFS was analyzed with an anchored MAIC using the studies’ common best supportive care arms as an anchor. A6181111 and RADIANT-3 allowed crossover, so an unanchored comparison of OS was deemed more appropriate for this outcome since crossover may have affected OS differentially in the two trials.
The analyses yielded hazard ratios for sunitinib versus everolimus of 0.85 (0.48–1.55) and 0.82 (0.53–1.27) for PFS and OS, respectively. Confidence intervals of both hazard ratios include null, indicating comparable outcomes after matching, consistent with findings from the previous MAIC.
The main limitation of these analyses relates to the smaller size of the A6181111 trial, which after matching on baseline characteristics, leaves a smaller effective sample size and wider confidence intervals from comparative analyses.
Another limitation is the possibility of residual confounding due to factors that were not available for matching; sensitivity analyses did not yield evidence to suggest this was likely.
Given the differing mechanism of action and the comparable PFS and OS of sunitinib and everolimus, patients should have access to both active agents during the course of their treatment, along with awareness of their respective toxicity profiles.
Financial & competing interests disclosure
This research was sponsored by Pfizer Ltd. All authors participated in the development of this manuscript and in the decision to submit this manuscript for publication. This analysis was designed and conducted by J Ishak and M Rael, who, also provided editorial and medical writing support, which was funded by Pfizer Ltd. J Ishak and M Rael are employees of Evidera who were paid consultants to Pfizer Ltd in connection with the development of this manuscript. M Hicks is an employee for Pfizer Ltd, and S Mittal was an employee of Pfizer Ltd at the time of development of this publication. M Hicks, S Mittal, J Valle and M Eatock had a role in formulating the concept, and editing and reviewing the manuscript. J Valle reports Consulting/Advisory role and Speakers’ Bureau for Novartis and Pfizer Ltd; Institutional Research Funding from Novartis; and non-financial support from Novartis, outside the submitted work. The authors have no other relevant affiliations or financial involvement with any organization or entity with a financial interest in or financial conflict with the subject matter or materials discussed in the manuscript apart from those disclosed.
References
Papers of special note have been highlighted as: • of interest
1.
Klimstra DS, Arnold R, Capella C et al. Neuroendocrine neoplasms of the pancreas. In: WHO Classification of Tumours of the Digestive System. Bosman FT, Carniero F, Hruban RH, Theise N (Eds). IARC, France, 322–326 (2010).
2.
De Wilde RF, Edil BH, Hruban RH, Maitra A. Well-differentiated pancreatic neuroendocrine tumors: from genetics to therapy. Nat. Rev. Gastroenterol. Hepatol. 9, 199–208 (2012).
3.
Wong MH, Chan DL, Lee A et al. Systematic review and meta-analysis on the role of chemotherapy in advanced and metastatic neuroendocrine tumor (NET). PLoS ONE 11(6), e0158140 (2016).
4.
Raymond E, Dahan L, Raoul JL et al. Sunitinib malate for the treatment of pancreatic neuroendocrine tumors. N. Engl. J. Med. 364(6), 501–513 (2011).
• Original publication of the A6181111 trial findings for sunitinib.
5.
Yao JC, Shah MH, Ito T et al. Everolimus for advanced pancreatic neuroendocrine tumors. N. Engl. J. Med. 364(6), 514–523 (2011).
• Original publication of the RADIANT-3 trial findings for everolimus.
6.
Bucher HC, Guyatt GH, Griffith LE, Walter SD. The results of direct and indirect treatment comparisons in meta-analysis of randomized controlled trials. J. Clin. Epidemiol. 50(6), 683–691 (1997).
7.
Glenny AM, Altman DG, Song F et al. Indirect comparisons of competing interventions. Health Technol. Assess. 9(26), 1–134, iii–iv (2005).
8.
Sutton A, Ades AE, Cooper N, Abrams K. Use of indirect and mixed treatment comparisons for technology assessment. Pharmacoeconomics 26(9), 753–767 (2008).
9.
Signorovitch JE, Wu EQ, Yu AP et al. Comparative effectiveness without head-to-head trials: a method for matching-adjusted indirect comparisons applied to psoriasis treatment with adalimumab or etanercept. Pharmacoeconomics 28(10), 935–945 (2010).
10.
Signorovitch J, Swallow E, Kantor E et al. Everolimus and sunitinib for advanced pancreatic neuroendocrine tumors: a matching-adjusted indirect comparison. Exp. Hematol. Oncol. 2(1), 32 (2013).
• Publication based on the previous matching-adjusted indirect comparison based on the RADIANT-3 trial.
11.
Raymond E, Niccoli P, Castellano DE et al. Sunitinib in patients with advanced, progressive pancreatic neuroendocrine tumors: final overall survival results from a Phase III randomized study, including adjustment for crossover. Presented at: American Society of Clinical Oncology – Gastrointestinal Cancers Symposium. CA, USA, 21–23 January 2016.
• Updated data from the A6181111 trial for sunitinib.
12.
Pavel ME, Lombard-Bohas C, Van Cutsem E et al. Everolimus in patients with advanced, progressive pancreatic neuroendocrine tumors: overall survival results from the Phase III RADIANT-3 study after adjusting for crossover bias. Presented at: American Society of Clinical Oncology Annual Meeting. IL, USA, 29 May–2 June 2015.
• Updated data from the RADIANT-3 trial for everolimus.
13.
Mitchell M, Muftakhidinov B, Winchen T. Enguage Digitizer software. http://markummitchell.github.io/engauge-digitizer.
14.
Hoyle MW, Henley W. Improved curve fits to summary survival data: application to economic evaluation of health technologies. BMC Med. Res. Methodol. 11, 139 (2011).
15.
Rinzivillo M, Fazio N, Pusceddu S et al. Sunitinib in patients with pre-treated pancreatic neuroendocrine tumors: a real-world study. Pancreatology 18(2), 198–203 (2018).
16.
Panzuto F, Rinzivillo M, Fazio N et al. Real-world study of everolimus in advanced progressive neuroendocrine tumors. Oncologist 19(9), 966–974 (2014).
17.
Yoo C, Cho H, Song MJ et al. Efficacy and safety of everolimus and sunitinib in patients with gastroenteropancreatic neuroendocrine tumor. Cancer Chemother. Pharmacol. 79(1), 139–146 (2017).
Information & Authors
Information
Published In
Copyright
© 2018 Future Medicine Ltd.
History
Received: 2 March 2018
Accepted: 6 August 2018
Published online: 31 August 2018
Keywords:
Topics
Authors
Metrics & Citations
Metrics
Article Usage
Article usage data only available from February 2023. Historical article usage data, showing the number of article downloads, is available upon request.
Citations
How to Cite
Relative effectiveness of sunitinib versus everolimus in advanced pancreatic neuroendocrine tumors: an updated matching-adjusted indirect comparison. (2018) Journal of Comparative Effectiveness Research. DOI: 10.2217/cer-2018-0020
Export citation
Select the citation format you wish to export for this article or chapter.
Citing Literature
- Giovanni Conzo, Federico Maria Mongardini, Maddalena Paolicelli, Michele Klain, Giuseppe Bellastella, Alessandra Conzo, Zhou Bo, Eduardo Lanza, Leandra Piscopo, Renato Patrone, Pancreatic Neuroendocrine Tumors: From Benchside to Surgical Treatment, Medicina, 10.3390/medicina62030479, 62, 3, (479), (2026).
- Yulia V. Mikheeva, Pavel O. Rumyantsev, Konstantin K. Puzakov, Konstantin Yu. Slashchuk, Daniil D. Omelchuk, Anastasia V. Potapenko, Sergey P. Medvedev, Current Management Strategies for Patients with Gastrointestinal and Pulmonary Neuroendocrine Tumors, Russian Journal of Oncology, 10.17816/onco642734, 30, 1, (41-60), (2025).
- Cecília Menezes Farinasso, Vinícius Lins Ferreira, Flávia Cordeiro Medeiros, Aline Pereira da Rocha, Patrícia do Carmo Silva Parreira, Layssa Andrade Oliveira, Lays Pires Marra, Rosa Camila Lucchetta, Haliton Alves de Oliveira, Matching-Adjusted Indirect Comparison Studies in Oncology: A Scoping Review Focused on Reporting Quality, Value in Health Regional Issues, 10.1016/j.vhri.2025.101088, 47, (101088), (2025).
- Owen Cassidy, Marie Harte, Lea Trela-Larsen, Cathal Walsh, Arthur White, Laura McCullagh, Joy Leahy, A Comparison of Relative-Efficacy Estimate(S) Derived From Both Matching-Adjusted Indirect Comparisons and Standard Anchored Indirect Treatment Comparisons: A Review of Matching-Adjusted Indirect Comparisons, Value in Health, 10.1016/j.jval.2023.07.001, 26, 11, (1665-1674), (2023).
- Stanley Cohan, Tom Tencer, Stella Arndorfer, Xuelian Zhu, Marko Zivkovic, Jinender Kumar, Matching-adjusted indirect treatment comparison of ozanimod versus teriflunomide for relapsing multiple sclerosis, Multiple Sclerosis and Related Disorders, 10.1016/j.msard.2021.102972, 52, (102972), (2021).
- Stanley Cohan, Jinender Kumar, Stella Arndorfer, Xuelian Zhu, Marko Zivkovic, Tom Tencer, Comparative Efficacy and Safety of Ozanimod and Dimethyl Fumarate for Relapsing-Remitting Multiple Sclerosis Using Matching-Adjusted Indirect Comparison, CNS Drugs, 10.1007/s40263-021-00805-0, 35, 7, (795-804), (2021).
- Jayne Palmer, Oscar R Leeuwenkamp, Cost-effectiveness of lutetium ( 177 Lu) oxodotreotide vs everolimus in gastroenteropancreatic neuroendocrine tumors in Norway and Sweden , World Journal of Clinical Cases, 10.12998/wjcc.v8.i20.4793, 8, 20, (4793-4806), (2020).
- Yawen Jiang, Weiyi Ni, Performance of unanchored matching-adjusted indirect comparison (MAIC) for the evidence synthesis of single-arm trials with time-to-event outcomes, BMC Medical Research Methodology, 10.1186/s12874-020-01124-6, 20, 1, (2020).