Pretreatment costs of care and time to initial treatment for patients with cancer of unknown primary
Abstract
Aim: Time to treatment and pretreatment costs may be affected by unknown primary tumor site. Methods: This retrospective study used electronic medical record data from patients in ten US community oncology practices. Eligible patients were ≥18 years, diagnosed with cancer of unknown primary (CUP) or known metastatic solid tumor, and presented between 1 January 2012 and 30 June 2014. Results: Patients with CUP (n = 294) had a longer interval than non-CUP patients (n = 92) from presentation to treatment initiation (1.18 vs 0.49 months, p < 0.0001), and had higher pretreatment costs (US$27,882 vs US$20,449, p = 0.0075). When analyzed as monthly cost, the difference between groups in log-cost per month was nonsignificant. Conclusion: Higher pretreatment costs in CUP patients appeared attributable to significantly longer time to initiation of therapy.
Cancer of unknown primary (CUP) is a diagnosis given to the patients with histologically confirmed metastatic disease for which the primary origin of metastases has not been identified, despite adequate examinations [1,2]. The extent of evaluation that is conducted may vary, but a general stepwise approach is recommended [3]. CUP is a heterogeneous group of neoplasms, but most are carcinomas, and most of those are adenocarcinomas [1]. Stepwise evaluation therefore involves seeking to identify the broad tumor type (i.e., carcinoma vs other tumor types), followed by the tumor subtype, and if the subtype is adenocarcinoma, the likely site of origin [3]. Patients with CUP commonly present with a shorter history of symptoms, an aggressive clinical course, and an atypical metastatic pattern with multiple sites of involvement [1,4]. The biological basis of CUP is unknown, but evidence strongly linking a history of heavy smoking to CUP suggests that at least some of these tumors may originate in a smoking-related site [5].
CUP is the fourth-leading cause of cancer death in both men and women, and the patients with CUP typically have a poor prognosis with a median survival of approximately 6–10 months [6]. CUP represents a significant unmet need due to the difficulty of diagnosis, limited treatment guidelines and lack of approved targeted therapies. The age-adjusted incidence of CUP in the US is 4.1 per 100,000 person-years, with a higher incidence in men and African-Americans [7]. The number of new patients who are diagnosed with CUP has steadily decreased an average of 3.6% per year over the past two decades, largely due to advances in diagnostic technologies and approaches. Nonetheless, 24% of patients are not investigated microscopically, and 21% of patients with microscopically-investigated disease have vague results, suggesting that diagnostic inquiry in patients with CUP remains insufficient [7]. There is some indication that insights from comprehensive genomic profiling (CGP) may lead to further advances in diagnosis and identification of heretofore unknown targets for treatment [8]. More than 30,000 patients per year currently receive a diagnosis of CUP in the US [9,10] but one analysis suggests that CUP may be under-reported, with an estimated true incidence of 53,000 patients each year, based on claims data from the Centers for Medicare and Medicaid Services (CMS) [11], perhaps because some CUP patients are treated as if the primary sites were known [10].
Identification of the primary tumor is historically a critical component of treatment selection as this forms the framework for evidence-based treatment algorithms considering all available treatment options. When the primary tumor is not identified, time to treatment initiation may be longer and it is difficult to know how to optimally treat patients, especially if targeted therapies would be an option were the primary tumor's location known. Currently, there are no US FDA approved treatments specifically for the patients with CUP. However, treatment guidelines for certain categories of CUP considered ‘favorable-risk’ have been developed [12]. Unfortunately, approximately 85% of patients with CUP do not belong to one of these subsets, and therefore have a very poor prognosis. Development of methods that would inform selection of therapies is badly needed.
The economic burden of CUP is significant, despite the smaller numbers of patients with this diagnosis. Based on a report from 2006, Medicare payments averaged US$38,000 per patient per year, which extrapolated to US$2 billion per year for all patients [11], the equivalent of US$44,676 per patient per year and 2.4 billion in 2015 dollars. It is unclear from this study whether the challenges in identifying the primary tumor sites in patients eventually diagnosed with CUP lead to higher medical costs than for patients whose primary tumors are more easily identified. Furthermore, the extent to which patients with CUP experience delays in receiving treatment, perhaps due to a potentially more exhaustive and lengthier diagnostic investigation in these patients, is not well understood. One small study of 70 patients who presented with liver metastases reported a median time to treatment initiation of 29 days in the subgroup of patients with CUP (n = 25) compared with 17 days in the subgroup of patients in whom a primary diagnosis was identified (n = 45) [13]. In these patients, the mean diagnostic cost was approximately US$2000 per patient and was not significantly different between those with and without a known primary tumor diagnosis. The extent of diagnostic testing and other pretreatment procedures in this study was not described. Furthermore, the generalizability of these results to other clinical presentations is not known.
The present study was designed to assess the pretreatment costs of care and the time to initiation of first-line treatment in the patients with CUP in the absence of CGP compared with patients with a diagnosis of a known de novo metastatic solid tumor. The study examined these questions in a sample of patients drawn from ten real-world, community oncology settings.
Patients & methods
Study design
This was a retrospective, observational study using data from the Vector Oncology Data Warehouse, a repository of electronic medical record (EMR) data and healthcare provider notes for the patients treated in community-based medical oncology practices in the US. Data for the study were collected using computerized queries of structured data fields and through manual review of the provider notes by experienced Clinical Research Nurses (CRNs). The protocol for this study was approved by IntegReview Institutional Review Board in Austin, TX, USA.
Patients
Patients in the Vector Oncology Data Warehouse were identified for the study based on the following criteria: initial presentation any time between 1 January 2012 and 30 June 2014; 18 years or older at the time of diagnosis, and; either a diagnosis of CUP or de novo metastatic (stage IV) solid tumor without a diagnosis of CUP. Patients were excluded if there was any documentation that a CGP technology had been used. The reason for this exclusion was that one aim of the study was to evaluate the potential utility of CGP testing in the patients with CUP. Patients were also excluded if the primary tumor was identified within 6 days of the initial CUP diagnosis, because this suggests that the CUP diagnosis itself may have been preliminary. The patients without CUP were chosen in a stratified fashion from the practices in which the patients with CUP were identified, and the distribution of tumor types was prespecified to match previously published data on the distribution of tumor types in the patients with CUP [14]. The study planned to accrue 375 patients, including 300 patients with CUP and 75 non-CUP patients. The intentional imbalance in cohort size reflected the priority of generating information about the patients with CUP.
Procedures
Computerized queries were used to identify potentially eligible patients. The patients with CUP were identified based on International Classification of Diseases, Ninth Revision (ICD-9) diagnostic codes of 199.0 (disseminated malignant neoplasm without specification of site) or 199.1 (other malignant neoplasm without specification of site). The patients without CUP were identified based on corresponding ICD-9 codes for the qualifying non-CUP tumors. Each diagnosis was confirmed by CRN review of the patient record. Following review of each record, eligible patients were enrolled until the accrual targets were met within the CUP and non-CUP cohort. Relevant data for all enrolled patients were extracted by CRNs onto an electronic case report form for the study. All data underwent an independent quality assurance review to confirm accuracy and completeness.
Study measures
The following data were collected: patient demographics, clinical characteristics and both health resource utilization and cost of care prior to initiation of treatment. The patient demographics included age, race, sex, US census region and insurance status. Clinical characteristics included dates of initial presentation at an oncologist, diagnosis (primary solid tumor or CUP, and site of primary tumor where an unknown primary was subsequently identified), and date of last known office visit. Health resource utilization and cost examined all diagnostic testing, office visits and all procedures conducted in the medical oncology setting, and hospitalization and emergency department (ED) visits, between initial presentation and initiation of treatment. Assessment of diagnostic testing was limited to diagnostic radiology tests, genomic tests (e.g., tissue of origin), and biopsies (including type of biopsy and biopsy-related adverse event information). Among patients with CUP, the study also assessed treatment through up to two lines of therapy, additional biomarker testing though one line of therapy, and date of disease progression, but the focus of the current report is limited to what occurred in the pretreatment period.
Utilization related to infused drugs and procedures delivered in the medical oncology setting were drawn from the structured EMR data. Hospitalizations, ED visits, oral medications and diagnostic tests were identified through abstraction of the unstructured EMR data by the CRNs. Hospitalization and ED visit costs were estimated using the median cost of case-matched hospitalizations and ED visits for cancer patients in the Healthcare Cost and Utilization Project (HCUP) Nationwide Inpatient Sample (NIS) [15]. Matching used diagnoses, length of stay (for hospitalizations), age range, sex and race as key match criteria. The cost of procedures was determined by matching the Healthcare Common Procedure Coding System/Current Procedural Terminology (HCPCS/CPT) code in structured EMR data to the national median paid amount listed in the CMS fee schedule [16]. To determine the costs of infused and injected medications, the median charge-to-cost ratio for procedures was applied to the billed amount for each infused or injected medication. Unit costs of oral medications were calculated based on the average wholesale price [17]. The costs of each diagnostic test were determined by matching the HCPCS/CPT code from data abstracted by CRNs to the CMS national median paid amounts. When no other information on the cost of a diagnostic test could be located, the overall median cost estimate across all other tests was used. Costs were adjusted to the year 2015 price value using inflation rates of the US consumer price index.
Statistical methods
Descriptive statistics were generated for the demographic and clinical characteristics of interest. The time between initial presentation at an oncologist and initiation of first-line cancer therapy was analyzed using the Kaplan–Meier product limit estimator and compared between the CUP and non-CUP cohorts using the log rank test. The patients who did not initiate first-line therapy were censored as of the date of their last clinic visit. Cox proportional hazard regression was used to compare time to treatment initiation across groups, with demographic and clinical variables as co-variates in the model.
The total cost of care in the pretreatment period was defined as the sum of costs for the individual cost categories of hospitalizations, ED visits, medical procedure costs, medication costs and diagnostic testing costs in the pretreatment period. The pretreatment period was defined as the period from the date of initial presentation to the date of treatment initiation. For the patients who had neither disease progression nor systemic therapy, costs were summarized through the end of the record or through 12 months from initial presentation at an oncologist, whichever came first. Costs were analyzed as the total cost over the entire pretreatment period and as cost per month during the pretreatment period (defined as total cost divided by total duration of the covered period). Unadjusted pairwise comparisons between the total cost and each cost category were performed with a t-test using log-transformed costs, assuming an underlying skewed distribution of cost data. Adjusted comparisons between cohorts used generalized linear regression models with a log link function and gamma distribution, controlling for co-variates including demographic characteristics such as age, sex, race and baseline clinical characteristics such as performance status.
Results
Patient accrual & characteristics
The enrollment targets were modified after the study began because of a slight shortfall in the number of available CUP patients. A total of 1257 patient records were screened for inclusion (Figure 1). The study accrued a total of 386 patients, including 294 patients with a diagnosis of CUP and 92 patients with a diagnosis of a de novo metastatic solid tumor (non-CUP cohort).

Figure 1. Patient selection.
CUP: Cancer of unknown primary; NGS: Next generation sequencing.
There were no important differences in demographic characteristics between the CUP and non-CUP cohorts (Table 1). Overall, the mean age of patients at the time of initial presentation was 65 years and 75% of the study sample was Caucasian, with approximately equal numbers of men and women. Insurance coverage included a mixture of public (38%), private (27%) and combined public/private (30%); 6% of patients were uninsured. Most patients were from the south of the US (71%), with fewer patients from the midwest (29%) and other regions, consistent with the makeup of the Vector Oncology Data Warehouse. However, the geographic distribution of patients differed between the CUP and non-CUP cohorts, with CUP patients more likely than expected to be from the midwest (p = 0.0012). The distribution of primary solid tumor types in the non-CUP cohort matched the distribution prespecified by the protocol, with lung (29%) and pancreatic (25%) tumors being the most common in the sample. A primary cancer was eventually identified in 88 (30%) patients with CUP, of which lung (34%) and other (30%) tumors were the most common types. The difference in tumor type distributions between the non-CUP cohort and the identifiable cancers in patients with CUP was statistically significant (p < 0.001), but selection of the non-CUP cohort was prespecified in a way that excluded any patients with ‘other’ primary tumor sites. Except for pancreatic tumors, for which the non-CUP cohort had 25% compared with 6% for the CUP cohort, the distribution of tumor types was similar. Tumor histology was generally similar between the CUP and non-CUP cohorts, except that more patients with CUP had squamous cell carcinoma (16 vs 2%, p < 0.001). Performance status at the time of diagnosis was similar between the cohorts.
| Variable | CUP (n = 294) | Non-CUP (n = 92) | Overall (n = 386) | p-value‡ |
|---|---|---|---|---|
| Age (years) at initial clinical presentation: | ||||
| – Mean ± SD | 66.1 ± 12.90 | 64.5 ± 10.82 | 65.7 ± 12.45 | 0.2583 |
| Sex, n (%): | ||||
| – Female | 151 (51.4%) | 40 (43.5%) | 191 (49.5%) | 0.1915 |
| – Male | 143 (48.6%) | 52 (56.5%) | 195 (50.5%) | |
| Race, n (%): | ||||
| – Caucasian | 227 (77.2%) | 64 (69.6%) | 291 (75.4%) | 0.1651 |
| – Minority/unknown | 67 (22.8%) | 28 (30.4%) | 95 (24.6%) | |
| BMI (pounds/inch2) at initial clinical presentation: | ||||
| – Mean ± SD | 27.9 ± 6.49 | 26.6 ± 7.70 | 27.6 ± 6.82 | 0.1355 |
| Insurance category, n (%): | ||||
| – Neither | 20 (6.8%) | 3 (3.3%) | 23 (6.0%) | 0.1919 |
| – Private only | 61 (20.7%) | 25 (27.2%) | 86 (22.3%) | |
| – Public only | 94 (32.0%) | 35 (38.0%) | 129 (33.4%) | |
| – Private and public | 114 (38.8%) | 28 (30.4%) | 142 (36.8%) | |
| – Unknown | 5 (1.7%) | 1 (1.1%) | 6 (1.6%) | |
| Region of residence, n (%): | ||||
| – Northeast | 0 | 1 (1.1%) | 1 (0.3%) | 0.0012 |
| – Midwest | 96 (32.7%) | 15 (16.3%) | 111 (28.8%) | |
| – South | 198 (67.3%) | 76 (82.6%) | 274 (71.0%) | |
| Primary solid tumor diagnosis, n (%†): | ||||
| – Prostate | 1 (1.1%) | 0 | 1 (0.3%) | <0.0001 |
| – Esophagus | 2 (2.37%) | 0 | 2 (0.5%) | |
| – Kidney | 2 (2.3%) | 6 (6.5%) | 8 (2.1%) | |
| – Stomach | 2 (2.3%) | 8 (8.7%) | 10 (2.6%) | |
| – Ovary | 4 (4.5%) | 6 (6.5%) | 10 (2.6%) | |
| – Breast | 4 (4.5%) | 6 (6.5%) | 10 (2.6%) | |
| – Liver | 3 (3.4%) | 7 (7.6%) | 10 (2.6%) | |
| – Colorectal | 9 (10.2%) | 9 (9.8%) | 18 (4.7%) | |
| – Other | 26 (29.5%) | 0 | 26 (6.7%) | |
| – Pancreas | 5 (5.7%) | 23 (25.0%) | 28 (7.3%) | |
| – Lung | 30 (34.1%) | 27 (29.3%) | 57 (14.8%) | |
| – Sub-total | 88 | 92 | 180 | |
| Tumor histology, n (%): | ||||
| – Neuroendocrine carcinoma | 12 (4.1%) | 0 | 12 (3.1%) | 0.3856 |
| – Adenocarcinoma | 144 (49.0%) | 58 (63.0%) | 202 (52.3%) | 0.0677 |
| – Poorly differentiated carcinoma | 35 (11.9%) | 4 (4.3%) | 39 (10.1%) | 0.0517 |
| – Undifferentiated carcinoma | 4 (1.4%) | 0 | 4 (1.0%) | 1.0000 |
| – Squamous cell carcinoma | 48 (16.3%) | 2 (2.2%) | 50 (13.0%) | 0.0002 |
| – Carcinoma, not otherwise specified | 4 (1.4%) | 3 (3.3%) | 7 (1.8%) | 0.3665 |
| – Undocumented | 2 (0.7%) | 6 (6.5%) | 8 (2.1%) | 0.0031 |
| – Other | 66 (22.4%) | 23 (25.0%) | 89 (23.1%) | 0.6915 |
| Composite performance status, n (%): | ||||
| – Impaired | 46 (5.6%) | 17 (18.5%) | 63 (16.3%) | 0.5206 |
| – Not impaired | 248 (84.4%) | 75 (81.5%) | 323 (3.7%) | |
†Percentage was calculated based on the sub-total (n = 88 or 92) rather than on the group sample sizes.
‡p-values: t-test for continuous variables, Fisher’s exact test for categorical variables, except for χ2 test for primary solid tumor diagnosis.
CUP: Cancer unknown primary; ND: Not determined; SD: Standard deviation.
Time to treatment initiation
The median time to initiation of first-line treatment was significantly longer in the patients diagnosed with CUP compared with patients with a primary solid tumor diagnosis (1.18 months [95% CI: 1.1–1.4] vs 0.49 months [95% CI: 0.5–0.7]; p < 0.0001; Figure 2). A Cox regression analysis showed that, after controlling for demographic and clinical factors, the patients with CUP were 62% less likely than non-CUP patients to initiate systemic cancer treatment at any point in time (p < 0.001; see Table 2), highlighting the health disparities and unmet medical need with this group of patients. Demographic and clinical co-variates were nonsignificant in predicting time to treatment initiation. However, higher BMI tended to be associated with shorter time to treatment initiation (p = 0.051), though the effect was small, and impaired performance status at baseline tended to be associated with a longer time to treatment initiation (p = 0.067).
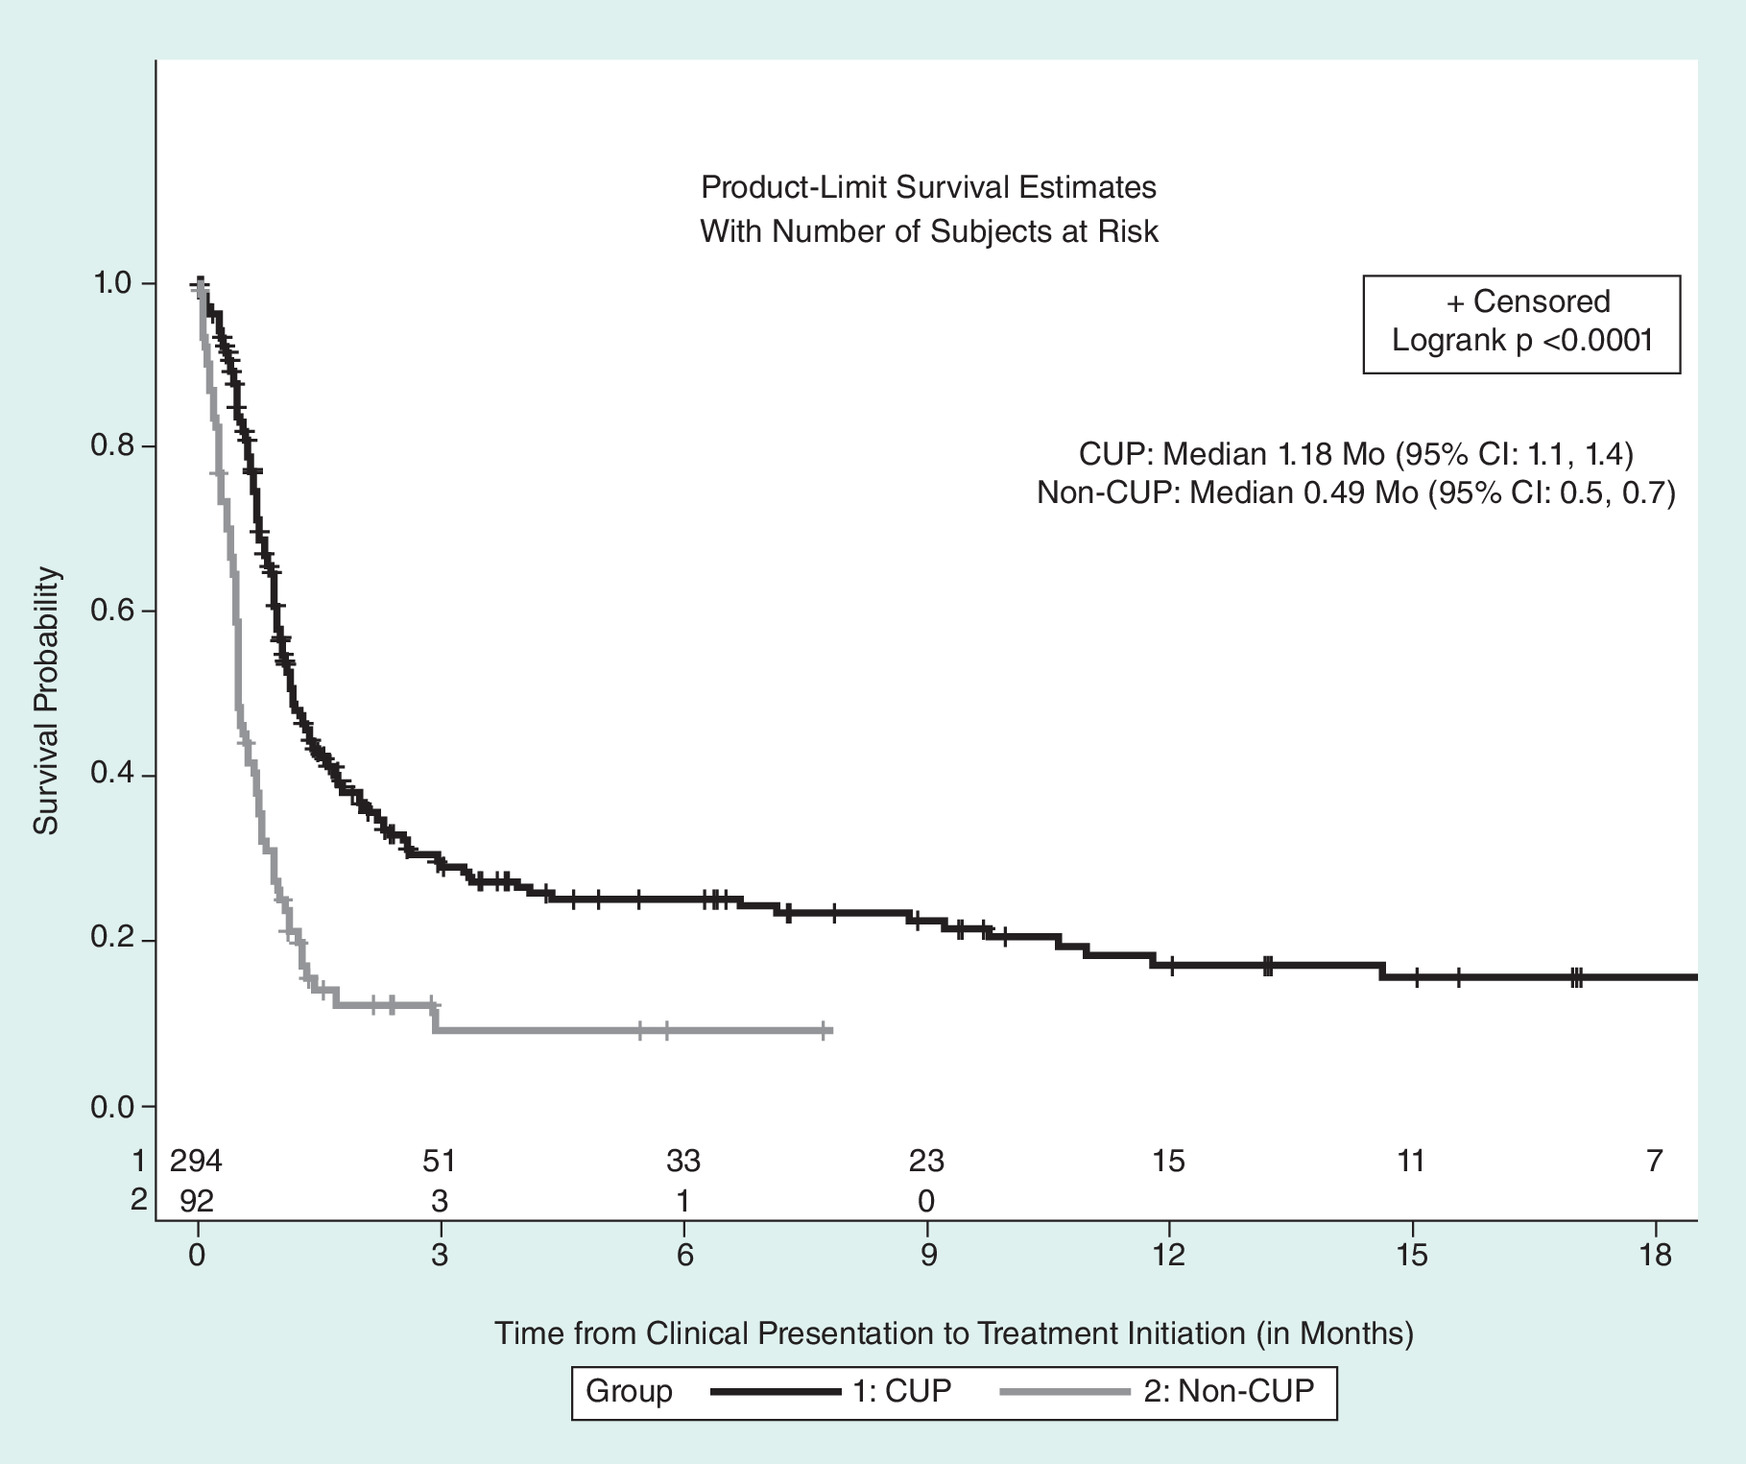
Figure 2. Kaplan–Meier analysis of time from initial clinical presentation to initiation of first-line treatment (months).
CUP: Cancer unknown primary.
| Parameter | Estimate | Hazard Ratio | 95% CI | χ2 p-value |
|---|---|---|---|---|
| CUP (n = 294) vs non-CUP (n = 92) | -0.969 | 0.379 | (0.28–0.51) | <0.001 |
| Age category overall: | 0.289 | |||
| – (40–65) vs (18–39) | -0.572 | 0.564 | (0.29–1.10) | 0.092 |
| – (65–80) vs (18–39) | -0.513 | 0.599 | (0.31–1.16) | 0.130 |
| – (80+) vs (18–39) | -0.743 | 0.476 | (0.22–1.03) | 0.059 |
| Sex (male vs female) | 0.006 | 1.006 | (0.78–1.29) | 0.963 |
| Race (minority vs white) | -0.080 | 0.923 | (0.67–1.26) | 0.617 |
| Insurance (any private vs others) | 0.074 | 1.077 | (0.83–1.39) | 0.571 |
| Composite performance status (impaired vs not impaired) | -0.334 | 0.716 | (0.50–1.02) | 0.067 |
| Region (other vs south) | -0.071 | 0.931 | (0.70–1.24) | 0.630 |
| BMI | 0.020 | 1.020 | (1.00–1.04) | 0.051 |
CUP: Cancer unknown primary.
Pretreatment costs of care
Table 3 presents the pretreatment costs of care for the patients with CUP or with a primary solid tumor diagnosis. The costs are presented as a total cost for this interval as well as on a per month basis given variable lengths of the pretreatment interval for each patient. Compared with the non-CUP cohort, the patients with CUP had significantly higher costs over the entire pretreatment period for medical procedures (US$1250 vs US$267; p = 0.0015), diagnostic tests (US$835 vs US$446; p < 0.0001), ED visits (US$3176 vs US$652; p = 0.0427) and total cost (US$27,882 vs US$20,449; p = 0.0075). Hospitalization costs were the primary driver of the total cost for both cohorts. Across all patients, medication costs were the smallest component of the total cost. When examined on a per month basis, patients with CUP had significantly higher monthly costs for medical procedures (p = 0.0165), but slightly lower costs for diagnostic tests (p = 0.0046) and marginally lower costs for ED visits. However, there was no difference between cohorts in overall monthly cost of care.
| Cost category | Cost over entire period | Monthly cost | ||
|---|---|---|---|---|
| CUP (n = 294) | Non-CUP (n = 92) | CUP (n = 294) | Non-CUP (n = 92) | |
| Medical procedures: | ||||
| – Mean ± SD | US$1250 ± US$2750 | US$267 ± US$479 | US$961 ± US$2036 | US$830 ± US$1847 |
| – p-value† | 0.0015 | 0.0165 | ||
| Diagnostic tests: | ||||
| – Mean ± SD | US$835 ± US$1105 | US$446 ± US$728 | US$814 ± US$1423 | US$853 ± US$1368 |
| – p-value† | <0.0001 | 0.0046 | ||
| Emergency department visits: | ||||
| – Mean ± SD | US$3176 ± US$12,213 | US$652 ± US$3588 | US$2733 ± US$14,108 | US$3909 ± US$29,211 |
| – p-value† | 0.0427 | 0.0693 | ||
| Hospitalizations: | ||||
| – Mean ± SD | US$21,724 ± US$57,310 | US$17,833 ± US$65,699 | US$31,473 ± US$159,222 | US$55,073 ± US$208,633 |
| – p-value† | 0.3966 | 0.5859 | ||
| Oral and infused medications: | ||||
| – Mean ± SD | US$896 ± US$2543 | US$1251 ± US$3843 | US$1570 ± US$11,562 | US$3113 ± US$8956 |
| – p-value† | 0.3688 | 0.7758 | ||
| Total costs: | ||||
| – Mean ± SD | US$27,882 ± US$61,546 | US$20,449 ± US$66,192 | US$37,550 ± US$163,049 | US$63,777 ± US$215,339 |
| – p-value† | 0.0075 | 0.2844 | ||
† t-test on natural log transformed cost data.
CUP: Cancer unknown primary; SD: Standard deviation.
The total costs of care over the entire pretreatment period were analyzed using a generalized linear model (Table 4) and confirmed that the patients with CUP had significantly higher total costs of medical care compared with patients with a primary solid tumor diagnosis, after controlling for demographic and baseline characteristics and accounting for the non-normal distribution of the cost data by log transformation (p = 0.0134). In addition, the model showed that minority race (p = 0.003) and having impaired performance status (p = 0.0013) were associated with higher total medical costs over the entire pretreatment period. Having private insurance was marginally associated with higher cost of medical care in the entire pretreatment period (p = 0.0547). In a similar generalized linear model for the monthly pretreatment costs between cohorts (data not shown), minority race (p < 0.0001) and having private insurance (p = 0.0171) were associated with higher monthly total costs, and impaired performance status at baseline was marginally associated with higher monthly total cost (p = 0.0787). However, there was no significant difference in monthly costs for CUP versus non-CUP patients (p = 0.748).
| Predictors | Estimate | Standard error | p-value |
|---|---|---|---|
| Intercept | 8.658 | 0.659 | <0.0001 |
| CUP (n = 294) vs non-CUP (n = 92) | 0.631 | 0.255 | 0.0134 |
| Age category: | |||
| – (40–65) vs (18–39) | 0.353 | 0.581 | 0.5441 |
| – (65–80) vs (18–39) | 0.146 | 0.576 | 0.8001 |
| – (80+) vs (18–39) | 0.001 | 0.633 | 0.9983 |
| Sex (male vs female) | 0.187 | 0.223 | 0.4000 |
| Race (minority/unknown vs white) | 0.772 | 0.260 | 0.0030 |
| Insurance (any private vs others) | 0.442 | 0.230 | 0.0547 |
| Composite performance status (impaired vs not impaired) | 0.926 | 0.288 | 0.0013 |
General linear model analysis was performed using proc GENMOD with gamma distribution and log-link function.
CUP: Cancer unknown primary.
Discussion
This was a retrospective, observational study that examined time to initiation of therapy and medical costs of care in cohorts of real-world, community oncology patients diagnosed with CUP or with a known metastatic solid tumor. This study results showed that the time to initiation of first-line therapy among CUP patients was longer, and was associated with significantly higher total pretreatment medical costs, compared with patients with a de novo metastatic primary tumor diagnosis. This study adds to the literature in examining the question of treatment delay and of cost specifically in real-world patients.
The significant delay in receiving treatment seen in this study is consistent with the results of a small, previously published study of patients presenting with metastatic liver cancer [13], and suggests that delays in starting first-line cancer treatment may be observed across a range of clinical presentations in the patients with CUP. The previous study did not examine costs other than diagnostic costs, and did not demonstrate a significant difference in diagnostic costs between patients with primary identified versus primary unknown status. In contrast, our study evaluated a range of costs associated with care during the pretreatment period, including diagnostic, procedural, hospitalization and ED visits costs, and found that the total pretreatment costs were significantly higher in the patients with CUP. Our findings regarding higher diagnostic costs in the CUP cohort are consistent with a recent retrospective study of CUP versus non-CUP patients conducted in Canada where investigators noted that CUP patients had higher rates of a number of diagnostic procedures (e.g., colonoscopy; CT scans of neck, abdomen and spine; MRI scans of spine, ultrasound and Doppler studies) compared with non-CUP patients [18].
Although total overall pretreatment costs were shown to be higher in CUP compared with non-CUP patients, monthly overall pretreatment costs did not differ across the cohorts. This pattern may indicate that higher total overall pretreatment costs in the CUP cohort were driven by the longer pretreatment period for this group. Although the findings are consistent with this conclusion, the study was not designed to directly evaluate the reasons why patients with CUP have higher pretreatment costs, or how these costs were distributed overtime in the pretreatment period. Factors other than a longer pretreatment period may be responsible for the higher total pretreatment costs, such as greater complexities in diagnosing or managing patients with CUP immediately after presentation, or other unidentified factors not evaluated in this study. Separately, however, the monthly cost relative to the overall cost as shown in Table 3 suggests that patients with shorter time to initiation of treatment may have had higher relative cost, a pattern that appears to hold across groups.
As shown in Table 3, hospitalization was the primary cost component for both cohorts. It represented about 78% of total costs for the CUP group, and 87% for the non-CUP group. Along with the cost of chemotherapy, hospitalization may often be a major cost component in studies of cancer cost. Based on the Medical Expenditures Panel Survey, hospitalization costs formed 35% of the total healthcare expenditures for cancer care in the US in 2011 [19]. This cost category represents a disproportionately large cost in this study because the period of interest excludes chemotherapy as a cost of care. Although this may raise a question about the sensitivity of group differences to this component of cost, hospitalization cost and oral and infused medication cost were the only categories in which CUP and non-CUP patients did not significantly differ in total costs. This suggests that hospitalization cost, although a major component of cost in this study, is not the source of differences in cost of care among these groups.
The results of this study provide evidence that patients with CUP experience delays in receiving treatment relative to non-CUP patients, and this appears consistent with findings from at least one other study [13]. However, it is not known if the longer time to initiation of treatment is a contributing factor to the poor outcomes typically seen in patients with CUP, and consequently whether shortening this time interval can improve outcomes. Nonetheless, with these findings in mind, care providers may wish to seek advanced or alternative techniques to shorten the time to diagnosis, or to guide selection of an appropriate treatment as early as possible. This may include matching patients to treatments based on genomic profile, an approach that recent evidence suggests may improve outcomes [20,21]. Also, a recent cost–effectiveness modeling examination of a 2000 gene-expression profiling test has suggested that it may be of large social benefit to deploy such testing with CUP patients [22]. It has also been reported that patients with CUP face more disruptions in their continuity of care; and experience greater uncertainty, anxiety and frustration in relation to care, and to treatment plans that may seem ambiguous [23]. Shortening the time to diagnosis may therefore also be beneficial in dispelling ambiguity related to treatment and in improving the overall experience of care in the patients with CUP.
The results of this study may also provide encouraging supportive evidence to insurers that the expense of advanced techniques for identification of primary tumor sites in patients with CUP may be worthwhile. Indeed, recent decision-tree simulation studies have suggested the cost–effectiveness benefit of PET-CT techniques in the diagnosis of patients with CUP [24,25]. In addition, a recent genomic profiling study in 200 CUP patients showed that one or more potentially targetable alterations were identified in 169 of 200 (85%) CUP specimens. The most common clinically relevant alterations that could affect treatment decisions included KRAS (40 [20%]), CDKN2A (37 [19%]), MCL1 (19 [10%]), PIK3CA (17 [9%]), ERBB2 (16 [(7%]), PTEN (14 [7%]), BRAF (11 [4%]), RICTOR (12 [4%]) and NF1 (8 [3%]) [8]. As targeted therapies gain more extensive use and efficacy support, genomic profiling may speed treatment decision making for CUP patients.
There were several limitations to this study. First, the size of the non-CUP cohort limited the power of the statistical comparisons. Second, this study findings rest heavily on the selection of the sample of patients in the non-CUP comparator group. The comparator group was selected to match a prespecified tumor distribution based on published data regarding CUP that was later identified. However, it may not reflect the distribution in the CUP patients in our sample whose tumors remained unknown, and may not reflect the composition and characteristics observed in a general population. Third, the study did not examine failure models other than Cox proportional hazard regression. Other models, such accelerated failure time, might be appropriate for assessing the effect of CUP on time to initiation of therapy. Fourth, the study was conducted in patients from a community oncology setting and may not generalize to patients treated in other settings. And last, this study was limited to evaluating time to initiation of treatment and the costs of care in the pretreatment period. The impact of a CUP diagnosis on more distal outcomes is an important topic, but was beyond the scope of the current study.
Conclusion
The results of this study suggest that patients with a diagnosis of CUP initiate treatment significantly later and have significantly greater pretreatment total costs than patients with de novo metastatic disease and a known primary tumor. The higher total cost of pretreatment care in patients with CUP may be due to the longer time it took for these patients to initiate first-line treatment. The use of advanced molecular information techniques to more quickly identify tumors or to guide selection of therapy may reduce the adverse impact of a diagnosis of CUP.
Patients with cancer of unknown primary site (CUP) may experience delays in starting treatment and increased costs during the pretreatment period.
We conducted a retrospective study using electronic medical record data from ten community oncology sites to investigate this question.
Data were collected through structured query language and human curation of unstructured electronic medical record data.
Cost and time to treatment were compared between CUP patients (n = 294) and patients with a known metastatic primary tumor (n = 92).
Eligible patients presented between 1 January 2012 and 30 June 2014.
The patients with CUP had a longer median time from presentation to start of first-line treatment than non-CUP patients (1.18 vs 0.49 months, p < 0.0001).
The patients with CUP had higher total pretreatment medical costs than non-CUP patients (US$27,882 vs US$20,449, p = 0.0075).
Increased pretreatment costs appeared attributable to the significantly longer time to initiation of therapy in CUP patients.
Acknowledgements
The authors thank D Galipeau for providing professional medical writing and editing assistance with this manuscript.
Author’s contributions
MS Walker: contributed substantially to the conception and design of the work, and to the interpretation of the data; revised the work critically; approved the final version; and agrees to be accountable for all aspects of the work. L Weinstein: contributed substantially to the conception and design of the work, and to the interpretation of the data; revised the work critically; approved the final version; and agrees to be accountable for all aspects of the work. R Luo: contributed to the interpretation of the data; revised the work critically; approved the final version; and agrees to be accountable for all aspects of the work. I Marino: contributed to the interpretation of the data; revised the work critically; approved the final version; and agrees to be accountable for all aspects of the work. Part of this research was presented at the Association for Value-Based Cancer Care conference, 27–28 September 2016, Washington, DC, USA.
Financial & competing interests disclosure
Foundation Medicine Inc. sponsored the study reported in this paper and provided financial support to Vector Oncology for the conduct of the research and for preparation of the article. MS Walker is an employee of Vector Oncology, and R Luo was an employee of Vector Oncology at the time of the research. L Weinstein was an employee at Foundation Medicine during the conduct of the study. I Marino is an employee of Foundation Medicine and received stock as part of her compensation. The authors have no other relevant affiliations or financial involvement with any organization or entity with a financial interest in or financial conflict with the subject matter or materials discussed in the manuscript apart from those disclosed.
Medical writing and editing assistance was provided by D Galipeau and was funded by Vector Oncology.
Ethical conduct of research
The authors state that they have obtained appropriate institutional review board approval or have followed the principles outlined in the Declaration of Helsinki for all human or animal experimental investigations. In addition, for investigations involving human subjects, informed consent has been obtained from the participants involved.
References
Papers of special note have been highlighted as: • of interest
1.
Pavlidis N, Pentheroudakis G. Cancer of unknown primary site. Lancet 379(9824), 1428–1435 (2012).
2.
Varadhachary GR, Raber MN. Carcinoma of unknown primary site. N. Engl. J. Med. 371(21), 2040 (2014).
3.
Oien K, Dennise JL. Diagnostic work-up of carcinoma of unknown primary: from immunohistochemistry to molecular profiling. Ann. Oncol. 23(Suppl. 10), 271–277 (2012).
• Provides a good overview of the general approach to assessment that has prevailed in management of patients with cancer of unknown primary (CUP).
4.
Massard C, Loriot Y, Fizazi K. Carcinomas of an unknown primary origin – diagnosis and treatment. Nat. Rev. Clin. Oncol. 8(12), 701–710 (2011).
5.
Kaaks R, Sookthai D, Hemminki K et al. Risk factors for cancers of unknown primary site: results from the prospective EPIC cohort. Int. J. Cancer 135(10), 2475–2481 (2014).
• In depth discussion of the behavioral and physiological risk factors for CUP from an international sample.
6.
Pavlidis N, Fizazi K. Carcinoma of unknown primary (CUP). Crit. Rev. Oncol. Hematol. 69(3), 271–278 (2009).
7.
Mnatsakanyan E, Tung WC, Caine B, Smith-Gagen J. Cancer of unknown primary: time trends in incidence, United States. Cancer Causes Control 25(6), 747–757 (2014).
8.
Ross JS, Wang K, Gay L et al. Comprehensive genomic profiling of carcinoma of unknown primary site: new routes to targeted therapies. JAMA Oncol. 1(1), 40–49 (2015).
• Discusses the opportunities for gene profiling in CUP patients, and notes that most patients have at least one genetic alteration.
9.
American Cancer Society. Cancer Facts & Figures 2016. (2016). www.cancer.org/content/dam/cancer-org/research/cancer-facts-and-statistics/annual-cancer-facts-and-figures/2016/cancer-facts-and-figures-2016.pdf
10.
Greco FA, Oien K, Erlander M et al. Cancer of unknown primary: progress in the search for improved and rapid diagnosis leading toward superior patient outcomes. Ann. Oncol. 23(2), 298–304 (2012).
11.
Tong KB, Becker SH, Anderson GG. Incidence, costs of care and mortality of medicare beneficiaries diagnosed with cancer of unknown primary (CUP). JMD 8(5), 659 (2006).
12.
Fizazi K, Greco FA, Pavlidis N, Daugaard G, Oien K, Pentheroudakis G. Cancers of unknown primary site: ESMO Clinical Practice Guidelines for diagnosis, treatment and follow-up. Ann. Oncol. 26(Suppl. 5), v133–v138 (2015).
• Provides recent treatment guidelines for CUP patients.
13.
Saif Ur Rehman S, Ahluwalia MS, Mashtare TL et al. Cancer of unknown primary presenting with liver metastasis: a cost, time to treatment and outcome analysis. Clin. Oncol. 25(11), 684–685 (2013).
14.
Briasoulis E, Pavlidis N. Cancer of unknown primary origin. Oncologist 2(3), 142–152 (1997).
15.
Barrett M, Steiner C, Sheng M, Bailey M. Healthcare Cost and Utilization Project HCUP) External Cause of Injury Code (E Code) Evaluation Report (Updated with 2013 HCUP Data). 2016. HCUP Methods Series Report # 2016–03 ONLINE. July 26, 2016. U.S. Agency for Healthcare Research and Quality. www.hcup-us.ahrq.gov/reports/methods/methods.jsp
16.
United States Centers for Medicare & Medicaid Services (CMS). Physician Fee Schedule. 2016 July 26 (2014). www.cms.gov/medicare/medicare-fee-for-service-payment/physicianfeesched/index.html
17.
Truven Health Analytics. RED BOOK from Micromedex Solutions. 2016 July 26 (2015). http://micromedex.com/redbook
18.
Hannouf MB, Winquist E, Mahmud SM et al. The potential clinical and economic value of primary tumour identification in metastatic cancer of unknown primary tumour: a population-based retrospective matched cohort study. Pharmacoecon Open (2017) (Epub ahead of print).
• Discusses a recent analysis within the Canadian healthcare system regarding clinical and economic impact of a CUP diagnosis.
19.
Soni A. Trends in use and expenditures for cancer treatment among adults 18 and older, U.S. civilian noninstitutionalized population, 2001 and 2011. Statistical Brief #443 (2014). https://meps.ahrq.gov/data_files/publications/st443/stat443.pdf
20.
Schwaederle M, Zhao M, Lee JJ et al. Impact of precision medicine in diverse cancers: a meta-analysis of Phase II clinical trials. J. Clin. Oncol. 33(32), 3817–3825 (2015).
21.
Wheler JJ, Janku F, Naing A et al. Cancer therapy directed by comprehensive genomic profiling: a single center study. Cancer Res. 76(13), 3690–3701 (2016).
22.
Hannouf MB, Winquist E, Mahmud SM et al. Cost–effectiveness of using a gene expression profiling test to aid in identifying the primary tumour in patients with cancer of unknown primary. Pharmacogenomics J. 17(3), 286–300 (2017).
23.
Richardson A, Wagland R, Foster R et al. Uncertainty and anxiety in the cancer of unknown primary patient journey: a multiperspective qualitative study. BMJ Support Palliat. Care 5(4), 366–372 (2015).
24.
Gracia A, Balana C, Kaskens L et al. Economic analysis of epicup, an epigenetic test to predict the tissue of origin in cancer of unknown primary site, the USA payors perspective. Value Health 18(7), A356 (2015).
25.
Smith KA, Dort JC, Hall SF, Rudmik L. Cost-effectiveness of positron emission tomography-CT in the evaluation of cancer of unknown primary of the head and neck. Head Neck 37(12), 1781–1787 (2015).
Information & Authors
Information
Published In
Copyright
© 2018 Future Medicine Ltd.
History
Received: 19 December 2017
Accepted: 26 March 2018
Published online: 1 June 2018
Keywords:
Topics
Authors
Metrics & Citations
Metrics
Article Usage
Article usage data only available from February 2023. Historical article usage data, showing the number of article downloads, is available upon request.
Citations
How to Cite
Pretreatment costs of care and time to initial treatment for patients with cancer of unknown primary. (2018) Journal of Comparative Effectiveness Research. DOI: 10.2217/cer-2017-0104
Export citation
Select the citation format you wish to export for this article or chapter.
Citing Literature
- Tobias Martinot, Lydia H.N. Schonewille, Dina Ruano, Elisabeth M.P. Steeghs, Tom van Wezel, Willemijn S.M.E. Theelen, Vincent T.H.B.M. Smit, Petur Snaebjornsson, Egbert F. Smit, Kim Monkhorst, Danielle Cohen, Enrichment of SMARCA4 mutations in lung carcinomas presenting as cancer of unknown primary, Lung Cancer, 10.1016/j.lungcan.2026.109502, 218, (109502), (2026).
- A. Waye, N. Thanh, A. Scott, T. Bond, D. Stewart, Diagnostic Costs of Metastatic and Unknown Primary Cancers in Alberta, Canada, 2017–2021, Cancer Investigation, 10.1080/07357907.2025.2599381, (1-9), (2025).
- Nosheen Fatima, Mina Laiq, Muhammad Rafay, Sara Muhammad Azam, Maseeh uz Zaman, Role of 18FDG PET/CT in Detecting Primary Tumors in Patients with Carcinoma of Unknown Primary: Single-Center Cross-Sectional Study from 2017 to 2023 (Extension Study), World Journal of Nuclear Medicine, 10.1055/s-0044-1795101, 24, 01, (057-063), (2024).
- Arielle van Mourik, Gina Tonkin-Hill, John O’Farrell, Shohei Waller, Lavinia Tan, Richard W. Tothill, David Bowtell, Stephen Fox, Andrew Fellowes, Clare Fedele, Penelope Schofield, Tharani Sivakumaran, Hui-Li Wong, Linda Mileshkin, Six-year experience of Australia’s first dedicated cancer of unknown primary clinic, British Journal of Cancer, 10.1038/s41416-023-02254-6, 129, 2, (301-308), (2023).
- Ella Nissan, Uri Amit, Leo Baron, Amit Zabatani, Damien Urban, Iris Barshack, Tima Davidson, The usefulness of [18F]FDG-PET/CT in detecting and managing cancers with unknown primary site depends on histological subtype, Scientific Reports, 10.1038/s41598-021-96451-z, 11, 1, (2021).
- Mitchell Reitsma, John Fox, Pierre Vanden Borre, Matthew Cavanaugh, Yakov Chudnovsky, Rachel L. Erlich, Thomas E. Gribbin, Rachel Anhorn, Effect of a Collaboration Between a Health Plan, Oncology Practice, and Comprehensive Genomic Profiling Company from the Payer Perspective, Journal of Managed Care & Specialty Pharmacy, 10.18553/jmcp.2019.18309, 25, 5, (601-611), (2019).