Development and validation of a claims-based approach to proxy ECOG performance status across ten tumor groups
Abstract
Aim: To develop a claims-based prediction model of poor performance status (PS) in commercially insured and Medicare supplemental beneficiaries with cancer. Patients & methods: Retrospective analysis was conducted of electronic medical records (EMR) from community oncology practices linked to MarketScan claims. Multivariable logistic regression predicted PS scores from the EMR using claims-based diagnostic and procedure codes. Results: The study included 8442 patients diagnosed with cancer from 2007 to 2015. Overall, 8.1% of patients had poor EMR-based PS. Bootstrapping results from the final model showed sensitivity and specificity of approximately 75% with a predicted probability cutpoint = 0.078, c-statistic = 0.821 and pseudo-R2 = 0.25. Conclusion: Patients with poor PS can be identified in claims data. This prediction model enables future studies evaluating cancer treatments and outcomes to account for PS.
High costs of cancer care have stimulated a national conversation and focus on value in oncology [1]. There is considerable interest from payers, providers, industry and academic researchers in ‘real-world’ evidence demonstrating the clinical and economic outcomes associated with cancer treatment. Secondary data sources, such as administrative claims data and electronic medical records (EMR) data, are increasingly used to describe population-based patterns of treatment, assess costs and quality of care and evaluate the comparative effectiveness and safety of different treatments or healthcare processes in oncology [2,3]. These studies may influence clinical decision-making, coverage and reimbursement decisions [4] and clinical treatment guidelines and pathways.
Treatment selection bias and residual unmeasured confounding are key concerns with observational studies examining treatment outcomes in cancer because secondary data sources often lack complete information on factors, such as performance status (PS), that influence treatment selection and health outcomes [2,5,6]. PS is a physician-assessed measure of functional capacity obtained from reports of activity levels and observation of patient mobility during the clinical encounter [7]. Patients may have poor PS due to cancer-related symptoms, age, other chronic conditions unrelated to cancer or some combination of these factors. Patients with poor PS are more likely to experience unacceptable toxicities and reduced survival benefit from aggressive treatment than those with good PS [8–10]. Eastern Cooperative Oncology Group (ECOG) and Karnofsky PS measures are not available in administrative claims data or tumor registries [11], and comorbidity indices based on claims data do not capture functional status [7,12,13]. EMR data from outpatient community or hospital-affiliated oncology practices have PS measures in their structured data, but the field is often underpopulated [11]. Therefore, this dimension of patient health status remains a gap in most health services research studies using oncology EMR and/or administrative claims data.
The development and use of a claims-based measure of PS may enable partial control for confounding by PS in multivariable analyses or the ability to restrict or stratify a study population based on PS. Previous work in this area led to the development of a claims-based predictor for poor functional status for inclusion in studies of treatment patterns. Davidoff et al. [7] developed a multivariate model to predict poor PS in older adults using data from the Medicare Current Beneficiary Survey (MCBS) linked with Medicare claims data. Self-reported functional status information was used to construct a proxy for poor PS. Stepwise regression was used to select variables for model inclusion from a set of healthcare services defined using procedure codes. This claims-based measure of PS was a significant predictor of survival within a validation sample from the MCBS [7], and receipt of cancer-directed treatment in Suveillance, Epidemiology, and End Results Program (SEER)-Medicare patients with breast and lung cancer and myelodysplastic syndromes [14].
There were two key limitations to the prior work. Davidoff et al. [7] did not have physician-reported PS, instead constructing a proxy from functional status measures, and the study was limited to older adults enrolled in Medicare. Because younger adults generally start out with better functional status, it is not clear whether the associations between poor PS and claims-based measures of service use are similar across age groups. The purpose of this study is to address these limitations by using physician-reported PS from oncology EMR data and including patients within a broader age spectrum. We developed and internally validated a multivariable prediction model of poor PS using claims data for commercially insured and Medicare supplemental beneficiaries linked with EMR data from outpatient oncology practices. The aim was to produce a model that can predict dichotomized ECOG PS value (PS 0–1 vs PS ≥2) using demographic variables, healthcare services indicators and diagnoses from the previous 12 months of claims. A secondary objective was to identify the probability cutpoints that maximize performance of the PS prediction model across tumor types with specific focus in patients with breast, lung, colorectal and pancreatic cancers.
Methods
Data
Patients were identified from the MarketScan oncology claims–EMR-linked database, which contains data records from the Truven Health Analytics MarketScan research databases and the MarketScan oncology EMR database. The MarketScan research databases contain claims data sourced from large employers, health plans and government organizations. The commercial claims database contains claims of patients covered by employer-sponsored health plans, and the Medicare supplemental database contains Medicare supplemental claims and coordination of benefits for employer-sponsored supplemental plans. These databases include integrated enrollment, inpatient, outpatient and prescription drug claims data, as well as carve-out services for eligible beneficiaries and their dependents.
The MarketScan oncology EMR database contains de-identified EMR data from patients seen in 108 community oncology practices in all geographic regions in the USA. The database captures information from contributing practices’ EMR systems, including demographics, tumor type, histology, stage, PS and ordered and administered medications. The MarketScan oncology claims–EMR-linked database contains data records from the claims databases and EMR database that were linked using a deterministic methodology. Linkage is conducted by a third-party vendor, and the linked database contains only de-identified records. The resulting linked database contains healthcare and cost data for over 50,000 unique patients who have received cancer treatment in community oncology practices. This study used only de-identified patient records and did not involve the collection, use or transmittal of individually identifiable data, so Institutional Review Board approval was not necessary.
Study cohort
The sample included patients with an encounter in the EMR from 2007 to 2015 with an International Classification of Diseases, Ninth Revision, Clinical Modification (ICD-9-CM) diagnosis code for breast, colorectal, lung, gastric, bladder, liver, skin (melanoma), hematological/lymphatic, pancreatic or other solid tumor cancers, and at least one additional encounter recorded in the EMR for the same cancer type any time thereafter. Patients were required to have a PS measure recorded in the EMR on or within 30 days of the earliest encounter with a relevant cancer diagnosis. The earliest PS measure during this time window was the index date for the study. Finally, the sample was required to have linkage to the MarketScan claims data and continuous enrollment with medical and pharmacy benefits eligibility during the 12 months prior to the index date. Table 1 shows sample attrition based on selection criteria. Pharmacy benefits were required because previous research has suggested that healthcare utilization and outcomes may differ between patients with and without prescription drug coverage [15].
| Inclusion criteria | Bladder cancer (n) | Breast cancer (n) | Colorectal cancer (n) | Gastric cancer (n) | Liver cancer (n) | Lung cancer (n) | Hematologic/lymph cancers (n) | Other neoplasms (n) | Pancreatic cancer (n) | Skin cancer (n) |
|---|---|---|---|---|---|---|---|---|---|---|
| Patients with a cancer diagnosis in the EMR | 8288 | 200,104 | 61,008 | 5701 | 5883 | 61,693 | 105,355 | 135,698 | 12,107 | 13,732 |
| And at least two visits/services/encounters recorded in the EMR for the diagnosis | 6872 | 177,977 | 53,850 | 4916 | 4589 | 53,972 | 94,671 | 119,987 | 10,314 | 10,568 |
| And a performance status on or within 30 days of cancer diagnosis† | 2392 | 54,090 | 17,313 | 1663 | 1713 | 18,755 | 30,892 | 25,551 | 3906 | 3375 |
| And linked to MarketScan | 201 | 6094 | 1658 | 144 | 119 | 1551 | 3303 | 2234 | 375 | 366 |
| And continuous enrollment in claims 12-month preindex | 111 | 3082 | 846 | 71 | 77 | 875 | 1776 | 1194 | 219 | 191 |
†Days measured from first visit in the EMR; this diagnosis is not necessarily the patient's initial diagnosis.
EMR: Electronic medical record.
Variables
PS measures
PS was obtained from the EMR using the earliest ECOG (scored from 0 to 5) [16] or Karnofsky PS (scored from 0 to 100) [17] value recorded within 30 days of the initial cancer encounter. Karnofsky scores were converted to ECOG-equivalent scores using a crosswalk [18]. The ECOG PS measure was then dichotomized into good (ECOG 0–1) and fair/poor (ECOG ≥2) because this categorization is clinically meaningful based on prior research. Patients with PS of 2 have been shown to have significantly shorter survival [19,20] and higher rates of serious adverse events compared with patients with PS of 1 [21].
Healthcare services
The claims data were searched to identify diagnoses and indicators for healthcare services received in the 12 months prior to the date of the EMR PS measure. A 12-month preindex period was chosen for consistency with previous research and to provide a sufficient time window in which to observe healthcare services and diagnosis codes. We included all healthcare services indicators as defined by Davidoff et al. [7] and used Berenson-Eggers Type of Service codes to group Current Procedural Terminology and Healthcare Common Procedure Coding System codes into clinical categories [22], following their approach while adapting the codes for MarketScan data. Indicators were grouped into the following categories: evaluation and management visits, other visit types, minor or ambulatory procedures, major procedures, imaging, durable medical equipment (DME) use and other (see Supplementary Tables 1–4 for Berenson-Eggers Type of Service groupings and procedure codes). We also tested additional diagnostic and healthcare service indicators identified from the literature as significant positive or negative predictors of functional dependence [23,24]. These additional indicators included diagnoses for rehabilitation services, procedure codes for nursing or personal care services and diagnoses for podiatric care. In contrast with Davidoff et al. [7] but consistent with Faurot et al. [24], we also included diagnostic codes for arthritis, diabetes mellitus complications, dementias, difficulty walking, fall, heart failure, lipid abnormality, paralysis, Parkinson's disease, psychiatric illness, sepsis, skin ulcer, stroke/brain injury, vertigo and weakness as defined by Faurot et al. and Kim and Schneeweiss (see Supplementary Table 5 for ICD-9-CM diagnosis codes) [23].
Patient characteristics
The following patient characteristics were obtained from the EMR, where populated: year of encounter, race/ethnicity, tumor type, stage and advanced stage of disease. Patients were classified as having advanced stage of disease if they had stage IV listed in the EMR or ICD-9 diagnosis codes (196.xx–199.xx) indicating secondary malignant neoplasm of lymph nodes, respiratory and digestive systems and other specified sites in the EMR or in the claims data within 30 days of PS measurement. Other variables were obtained from the claims data, including age, sex, US geographic region, health plan type, commercial plan or Medicare supplemental beneficiary, urban or rural location and National Cancer Institute adaptation of the Deyo-Charlson Comorbidity Index, excluding claims for malignancies from the score [25,27].
Statistical analysis
Descriptive statistics were used to summarize the demographic and clinical characteristics of the study population. The frequency of healthcare service and diagnostic measures were described for the overall study population, as well as by the dichotomized measure of ECOG PS (PS 0–1 vs PS ≥2). Bivariate associations between ECOG PS and demographics, healthcare services and diagnostic indicators were evaluated using χ2 tests.
The aim of the study was to produce a model that can predict the dichotomized PS value (PS 0–1 vs PS ≥2) using the available measured demographic and clinical characteristics. A staged approach involving a series of cross-validated stepwise multivariate logistic regressions was used to arrive at a final model consisting only of explanatory variables significantly impacting PS value. The cross-validation of individual stepwise regressions used a training sample of 70% and a validation sample of 30%, representing 5909 and 2533 patients, respectively. Candidate variables for the regressions included demographic variables (age, sex, region and payer) and diagnostic and healthcare services indicators described above. Age was categorized into less than 55 years (reference), 55–64 years, 65–74 years and ≥75 years. Region was originally defined according to US Census region; however, it was collapsed into south versus all other regions because these categories provided the most discrimination. Primary payer was categorized as Medicare or commercial. Healthcare services and diagnoses were defined as binary indicator variables, with the exception of the number of evaluation and management office visits (categorized as 0–2, 3–6, ≥7; see Supplementary Table 6 for the full list of healthcare services and diagnostic variables considered for model inclusion). 92 candidate variables were considered during the stepwise selection process. The stepwise logistic regressions used a 5% significance level for both variable entry and exit. In addition to the main effects only model, pairwise interactions were tested between region and payer type and the significant covariates in the model. Having decided from the series what explanatory variables were in the final model, this model was fitted to all the data to obtain the final coefficients. Further validation of the distributions of the coefficients of the final model was performed by bootstrapping [28]. The bootstrapping to validate the final model from the series of stepwise logistic regressions used 1000 samples with replacement to estimate means and 95% CIs and other distributional statistics for model coefficients, with variables having zero outside the central 95% range of their bootstrap distribution indicated.
Logistic regression model fits were assessed using the available goodness-of-fit test, and C and pseudo-R2 statistics. Regression coefficients from the final model were used to generate receiver-operating characteristic curves followed by predicted probabilities of poor PS for each patient. The continuous predicted probability was converted to a discrete indicator by selecting a cutpoint that resulted in approximately equal sensitivity and specificity. This cutpoint may be applied in future research that employs this multivariate logistic regression model to categorize patients as having good or poor PS. The concordance between the EMR- (as observed) and claims-based (as predicted by the model) measures of PS was evaluated in terms of sensitivity and specificity in the overall sample. Previous research has shown that sensitivity and specificity may be affected by sources of variation related to the study population, such as demographics or disease severity [29,30]. In this study, demographic characteristics, underlying health status, stage of disease and the prevalence and severity of poor PS are likely to vary across tumor types. For this reason, we also identified cutpoints specific to breast, lung, colorectal and pancreatic cancers to maximize sensitivity and specificity for these subgroups. All analyses were performed using SAS version 9.4 software (SAS Institute Inc., NC, USA).
Results
The study cohort included 8442 patients diagnosed with breast, colorectal, lung, gastric, bladder, liver, skin (melanoma), hematological/lymphatic, pancreatic or other solid tumor cancers. Table 2 shows demographic and clinical characteristics of the eligible study population. Mean age was 64 years (standard deviation = 12.7 years) and 54% of patients (n = 4526) were aged less than 65 years. Approximately 65% of patients were female, and the majority was white. Payer type was commercial for 52% of patients and Medicare supplemental for 48%, with Exclusive Provider Organization/Preferred Provider Organization being the most common insurance plan type overall.
| Patient characteristics | n = 8442 | |
|---|---|---|
| n or mean | % or SD | |
| Age, years (mean, SD) | 64.0 | 12.7 |
| Age group (n, %): | ||
| – <55 years | 1853 | 21.9% |
| – 55–64 years | 2673 | 31.7% |
| – 65–74 years | 1992 | 23.6% |
| – >74 years | 1924 | 22.8% |
| Sex (n, %): | ||
| – Male | 2917 | 34.6% |
| – Female | 5525 | 65.4% |
| Race (n, %): | ||
| – White | 6162 | 73.0% |
| – Black | 572 | 6.8% |
| – Hispanic | 62 | 0.7% |
| – Other | 756 | 9.0% |
| – Unknown | 890 | 10.5% |
| Geographic region (n, %): | ||
| – North-east | 2257 | 26.7% |
| – North-central | 2585 | 30.6% |
| – South | 2745 | 32.5% |
| – West | 851 | 10.1% |
| – Unknown | 4 | 0.0% |
| Population density (n, %): | ||
| – Urban | 7295 | 86.4% |
| – Rural | 1145 | 13.6% |
| – Unknown | 2 | 0.0% |
| Insurance plan type (n, %): | ||
| – Fee for service | 2192 | 26.0% |
| – EPO/PPO | 4212 | 49.9% |
| – POS (with and without capitation) | 496 | 5.9% |
| – HMO | 680 | 8.1% |
| – CDHP/HDHP | 447 | 5.3% |
| – Unknown | 415 | 4.9% |
| Payer (n, %): | ||
| – Commercial | 4427 | 52.4% |
| – Medicare | 4015 | 47.6% |
| Tumor type (n, %) | ||
| – Breast | 3082 | 36.5% |
| – Colorectal | 846 | 10.0% |
| – Lung | 875 | 10.4% |
| – Gastric | 71 | 0.8% |
| – Bladder | 111 | 1.3% |
| – Liver | 77 | 0.9% |
| – Melanoma | 191 | 2.3% |
| – Hematologic/lymphatic | 1776 | 21.0% |
| – Pancreatic | 219 | 2.6% |
| – Other neoplasms | 1194 | 14.1% |
| Performance status ECOG (n, %): | ||
| – 0 | 5638 | 66.8% |
| – 1 | 2116 | 25.1% |
| – 2 | 542 | 6.4% |
| – 3 | 136 | 1.6% |
| – 4 | 10 | 0.1% |
| NCI CCI (mean, SD) | 0.84 | 1.28 |
| NCI CCI categories (n, %): | ||
| – 0 | 4735 | 56.1% |
| – 1 | 1938 | 23.0% |
| – 2 | 900 | 10.7% |
| – 3+ | 869 | 10.3% |
| Disease stage (n, %): | ||
| – Stage 0 | 101 | 1.2% |
| – Stage 1 | 1192 | 14.1% |
| – Stage 2 | 1062 | 12.6% |
| – Stage 3 | 889 | 10.5% |
| – Stage 4 | 986 | 11.7% |
| – Unknown | 4212 | 49.9% |
| Advanced disease (n, %) | ||
| All cancers: | 2611 | 30.9% |
| – Breast | 632 | 20.5% |
| – Colorectal | 310 | 36.6% |
| – Lung | 505 | 57.7% |
| – Pancreatic | 129 | 58.9% |
| – Gastric | 46 | 64.8% |
| – Bladder | 53 | 47.7% |
| – Liver | 43 | 55.8% |
| – Melanoma | 57 | 29.8% |
| – Hematologic/lymphatic | 278 | 15.7% |
| – Other neoplasm | 558 | 46.7% |
CDHP/HDHP: Consumer-driven health plan/high-deductible health plan; ECOG: Eastern cooperative oncology group; EPO/PPO: Exclusive provider organization/preferred provider organization; HMO: Health maintenance organization; NCI CCI: National Cancer Institute Charlson Comorbidity Index; POS: Point of service; SD: Standard deviation.
In the overall cohort, 8.1% of patients (688/8442) had PS ≥2 (poor PS), but the prevalence of poor PS differed by cancer type, ranging from 3.3% for breast cancer (101/3082) to 20.1% for pancreatic cancer (44/219). Stage of disease was not reported in the EMR for 49.9% of patients. However, 30.9% of patients had evidence of advanced disease based on secondary neoplasm ICD-9 codes in the EMR or claims data.
Table 3 shows the frequency counts of EMR ECOG PS category and the levels of the healthcare services and diagnostic indicators that were selected in the stepwise logistic regression model (see Supplementary Table 6 to see frequencies and χ2 tests for all healthcare services and diagnostic indicators). Patients with poor PS were more likely to have had neurology and pulmonary evaluations, nursing home stays, hospital and emergency room visits, endoscopic procedures (bronchoscopy and upper gastrointestinal), use of wheelchairs, other DME and ambulance services in the 12 months prior to a patient's first EMR oncology diagnosis. Diagnostic codes in the 12 months before EMR oncology diagnosis associated with poor PS included difficulty walking, sepsis, stroke/brain injury and weakness.
| Patient characteristics | All patients | ECOG ≤1 | ECOG ≥2 | p-value | |||
|---|---|---|---|---|---|---|---|
| n = 8442 | n = 7754 | n = 688 | |||||
| n | % | n | % | n | % | ||
| Age group (n, %): | |||||||
| – <55 years | 1853 | 21.9% | 1795 | 23.1% | 58 | 8.4% | <0.001 |
| – 55–64 years | 2673 | 31.7% | 2511 | 32.4% | 162 | 23.5% | |
| – 65–74 years | 1992 | 23.6% | 1831 | 23.6% | 161 | 23.4% | |
| – >74 years | 1924 | 22.8% | 1617 | 20.9% | 307 | 44.6% | |
| Geographic region (n, %): | |||||||
| – Northeast | 2257 | 26.7% | 2129 | 27.5% | 128 | 18.6% | <0.001 |
| – North central | 2585 | 30.6% | 2385 | 30.8% | 200 | 29.1% | |
| – South | 2745 | 32.5% | 2450 | 31.6% | 295 | 42.9% | |
| – West | 851 | 10.1% | 787 | 10.1% | 64 | 9.3% | |
| – Unknown | 4 | 0.0% | 3 | 0.0% | 1 | 0.1% | |
| Healthcare services and diagnostic indicators | |||||||
| E&M and other visits (n, %): | |||||||
| – Dermatology | 1437 | 17.0% | 1341 | 17.3% | 96 | 14.0% | 0.025 |
| – Neurology | 511 | 6.1% | 429 | 5.5% | 82 | 11.9% | <0.001 |
| – Pulmonary | 608 | 7.2% | 519 | 6.7% | 89 | 12.9% | <0.001 |
| Other visits (n, %): | |||||||
| – Nursing home visit | 422 | 5.0% | 296 | 3.8% | 126 | 18.3% | <0.001 |
| – Hospital visit – initial | 2236 | 26.5% | 1814 | 23.4% | 422 | 61.3% | <0.001 |
| – Emergency room visit | 2653 | 31.4% | 2244 | 28.9% | 409 | 59.4% | <0.001 |
| BETOS preventive services (n, %): | |||||||
| – Screenings | 2941 | 34.8% | 2794 | 36.0% | 147 | 21.4% | <0.001 |
| BETOS major procedures (n, %): | |||||||
| – Cholecystectomy | 25 | 0.3% | 17 | 0.2% | 8 | 1.2% | 0.001 |
| BETOS endoscopy (n, %): | |||||||
| – Bronchoscopy | 1021 | 12.1% | 874 | 11.3% | 147 | 21.4% | <0.001 |
| – Colonoscopy | 1483 | 17.6% | 1377 | 17.8% | 106 | 15.4% | 0.120 |
| – Upper gastrointestinal | 1069 | 12.7% | 926 | 11.9% | 143 | 20.8% | <0.001 |
| BETOS durable medical equipment (n, %): | |||||||
| – Other DME | 887 | 10.5% | 755 | 9.7% | 132 | 19.2% | <0.001 |
| – Wheelchairs | 99 | 1.2% | 50 | 0.6% | 49 | 7.1% | <0.001 |
| BETOS other (n, %): | |||||||
| – Ambulance | 790 | 9.4% | 579 | 7.5% | 211 | 30.7% | <0.001 |
| – Other tests – cardiovascular stress tests | 1018 | 12.1% | 923 | 11.9% | 95 | 13.8% | 0.141 |
| Frailty indicators (n, %): | |||||||
| – Difficulty walking, abnormality of gait | 1267 | 15.0% | 1038 | 13.4% | 229 | 33.3% | <0.001 |
| – Lipid abnormality | 4368 | 51.7% | 4031 | 52.0% | 337 | 49.0% | 0.131 |
| – Sepsis | 2179 | 25.8% | 1891 | 24.4% | 288 | 41.9% | <0.001 |
| – Stroke/brain injury | 903 | 10.7% | 735 | 9.5% | 168 | 24.4% | <0.001 |
| – Vertigo | 1308 | 15.5% | 1189 | 15.3% | 119 | 17.3% | 0.173 |
| – Weakness | 3015 | 35.7% | 2610 | 33.7% | 405 | 58.9% | <0.001 |
BETOS: Berenson-Eggers Type of Service; DME: Durable medical equipment; E&M: Evaluation and management; ECOG: Eastern Cooperative Oncology Group.
Table 4 shows the final multivariable model from the series of stepwise logistic regressions that identified a subset of predictors consistently associated with poor PS. The fit statistics for the final model indicated a reasonable model fit: Hosmer–Lemeshow statistic χ2 = 11.689, df = 8, p-value = 0.166; R2 = 0.245; c-statistic = 0.821. The bootstrap distributions from 1000 resamples had a mean R2 of 0.250 (95% CI = 0.223, 0.279) and a mean c-statistic of 0.824 (95% CI = 0.808, 0.839). A probability cutpoint of ≥0.078 was selected to balance sensitivity and specificity at approximately 75% across all tumors (Figure 1). Supplementary Table 7 shows the values for sensitivity and (1-specificity) for all possible cutpoints.
| Variable | Coefficient | Odds ratio | 95% CI | p-value |
|---|---|---|---|---|
| Intercept | -4.3599 | 0.0128 | 0.0092, 0.0178 | <0.0001 |
| Age 55–64 | 0.7957 | 2.2160 | 1.6028, 3.0639 | <0.0001 |
| Age 65–74 | 0.9950 | 2.7047 | 1.9376, 3.7756 | <0.0001 |
| Age 75+ | 1.5879 | 4.8932 | 3.5433, 6.7575 | <0.0001 |
| South region | 0.7050 | 2.0238 | 1.6973, 2.4132 | <0.0001 |
| Dermatology E&M visit | -0.2962 | 0.7437 | 0.5820, 0.9503 | 0.0179 |
| Neurology E&M visit | 0.5050 | 1.6570 | 1.2435, 2.2080 | 0.0006 |
| Pulmonary E&M visit | 0.3267 | 1.3864 | 1.0591, 1.8148 | 0.0174 |
| Nursing home visit | 0.4887 | 1.6301 | 1.2317, 2.1575 | 0.0006 |
| Hospital visit – initial | 0.8042 | 2.2350 | 1.7884, 2.7931 | <0.0001 |
| Emergency room visit | 0.3477 | 1.4158 | 1.1411, 1.7566 | 0.0016 |
| Preventive screenings | -0.2568 | 0.7735 | 0.6279, 0.9529 | 0.0158 |
| Major procedure – cholecystectomy | 1.3198 | 3.7426 | 1.4727, 9.5109 | 0.0055 |
| Endoscopy – bronchoscopy | 0.3699 | 1.4477 | 1.1529, 1.8177 | 0.0014 |
| Endoscopy – sigmoidoscopy, colonoscopy | -0.4190 | 0.6577 | 0.5135, 0.8425 | 0.0009 |
| Endoscopy – upper gastrointestinal | 0.3307 | 1.3920 | 1.1020, 1.7582 | 0.0055 |
| Durable medical equipment other | 0.3800 | 1.4623 | 1.1592, 1.8446 | 0.0013 |
| Durable medical equipment wheelchair | 1.2126 | 3.3621 | 2.1130, 5.3496 | <0.0001 |
| Ambulance | 0.4414 | 1.5548 | 1.2276, 1.9693 | 0.0003 |
| Electrocardiography monitoring and cardiovascular stress tests | -0.5370 | 0.5845 | 0.4511, 0.7574 | <0.0001 |
| Difficulty walking, abnormality of gait | 0.4235 | 1.5273 | 1.2387, 1.8832 | <0.0001 |
| Lipid abnormality | -0.4604 | 0.6310 | 0.5277, 0.7547 | <0.0001 |
| Sepsis | 0.2230 | 1.2498 | 1.0401, 1.5018 | 0.0173 |
| Stroke/brain injury | 0.2778 | 1.3202 | 1.0564, 1.6499 | 0.0146 |
| Vertigo | -0.4097 | 0.6639 | 0.5246, 0.8401 | 0.0007 |
| Weakness | 0.3457 | 1.4129 | 1.1698, 1.7066 | 0.0003 |
E&M: Evaluation and management.
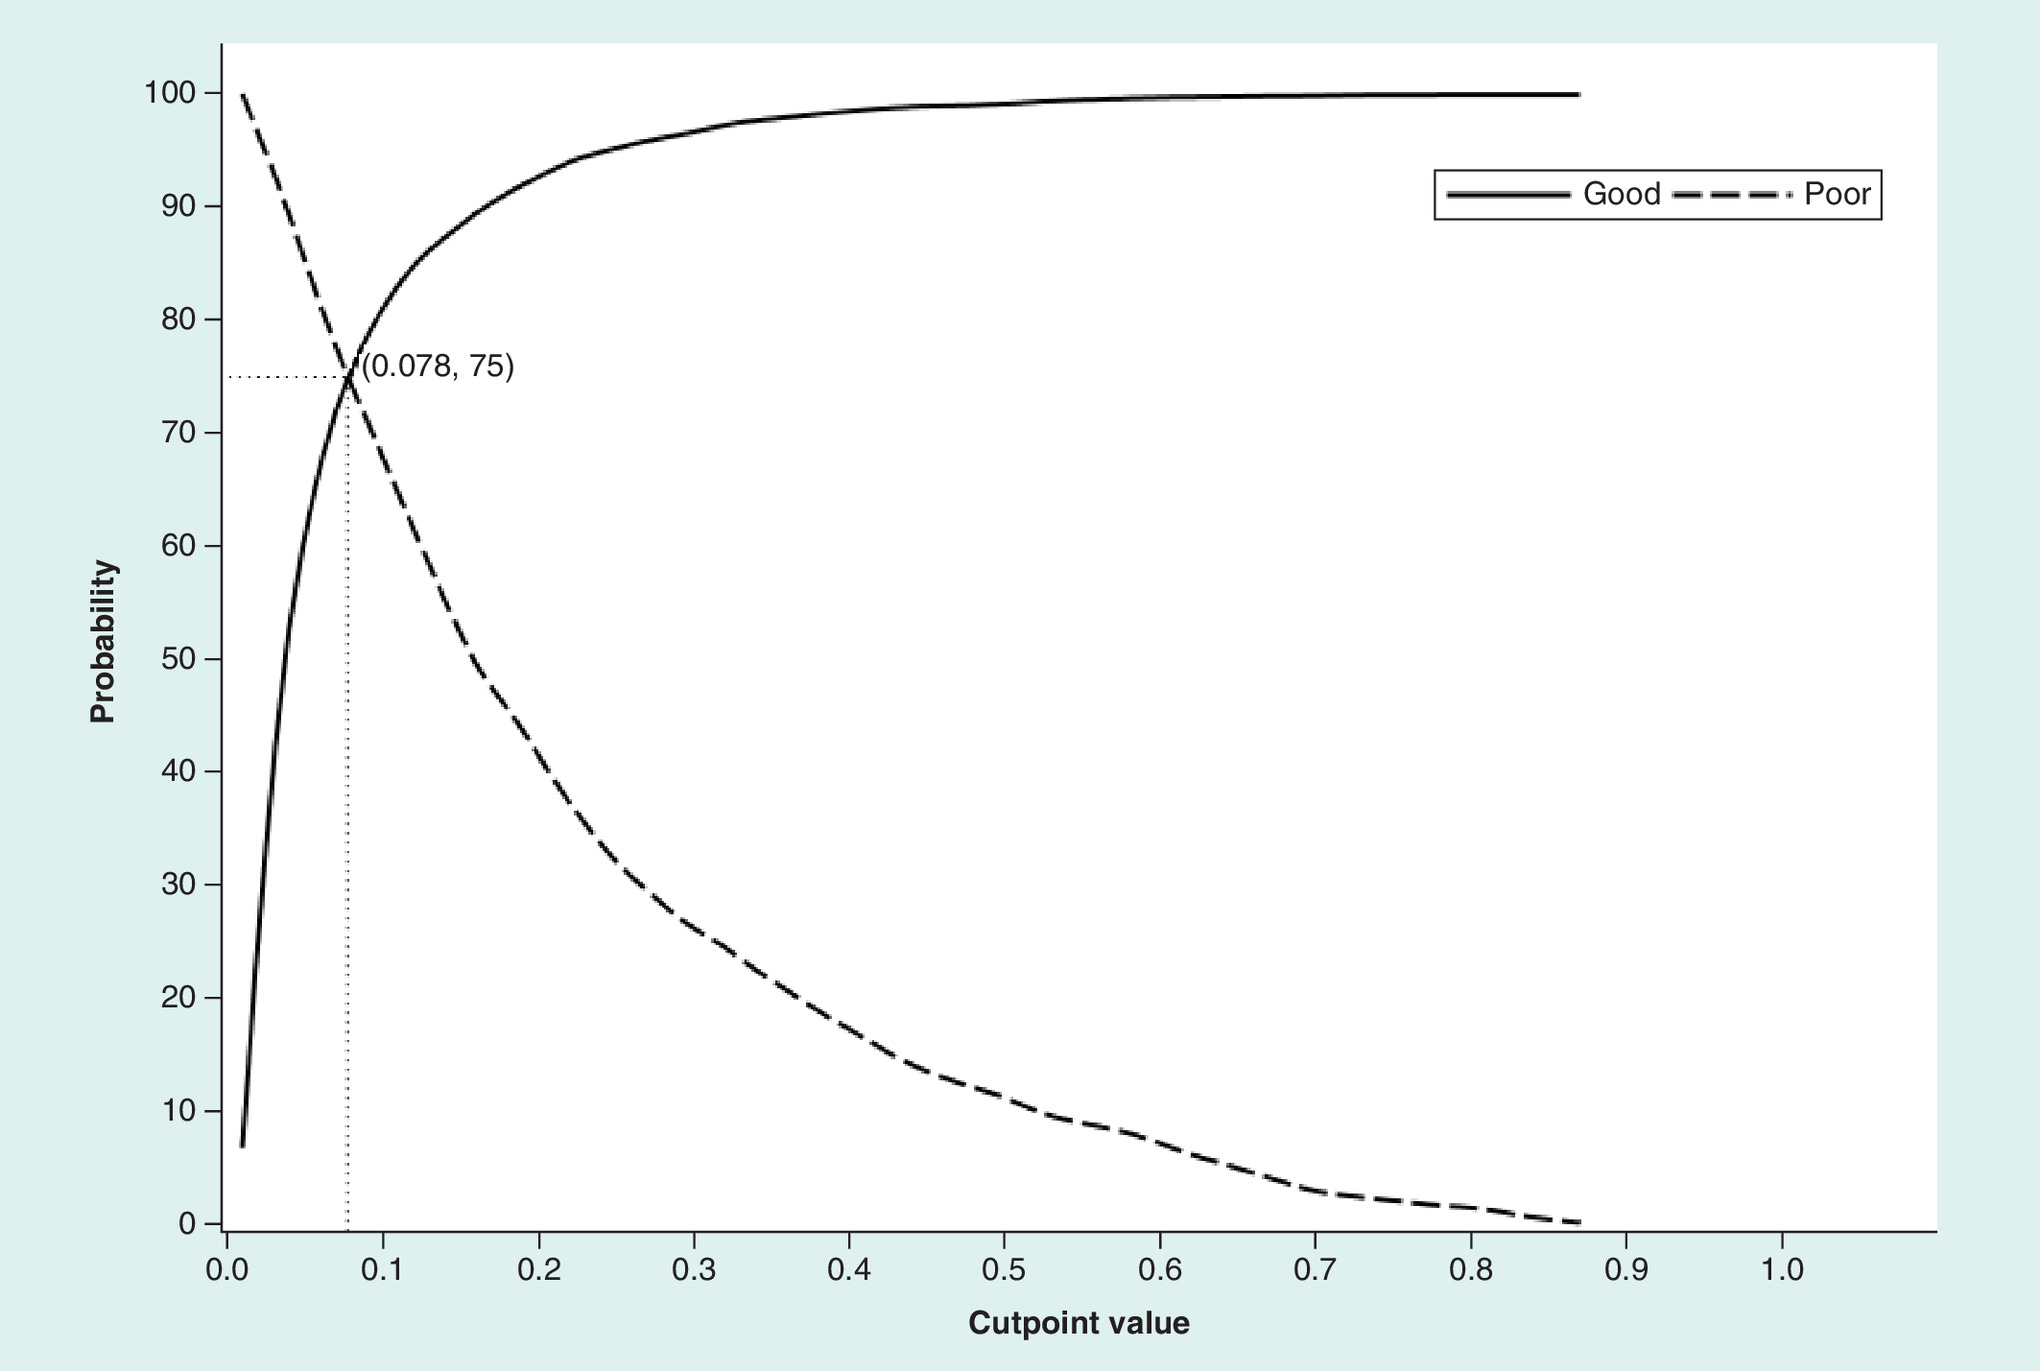
Figure 1. Plot of sensitivity and specificity according to all potential probability cutpoints for the overall cancer sample.
The y-axis represents the probability (%) of correct assignment of patients as having a ‘good’ performance status (specificity, or true negative rate) or a ‘poor’ performance status (sensitivity, or true positive rate).
In subgroup analyses, the cutpoint of 0.078 resulted in different estimates of sensitivity and specificity for different cancer types. For example, this cutpoint produced poor specificity for lung and pancreatic cancers, 54.5 and 43.4%, respectively, which have a higher percentage of patients with poor PS. Conversely, the sensitivity was 60.1% for breast cancer, which has a lower percentage of patients with poor PS. We evaluated alternative probability cutpoints to maximize sensitivity and specificity for breast (cutpoint = 0.052; sensitivity and specificity = 75%; Figure 2A), colorectal (cutpoint = 0.075; sensitivity and specificity = 73.7%; Figure 2B), lung (cutpoint = 0.115; sensitivity and specificity = 67.5%; Figure 2C) and pancreatic cancers (cutpoint = 0.152; sensitivity and specificity = 72.2%; Figure 2D).
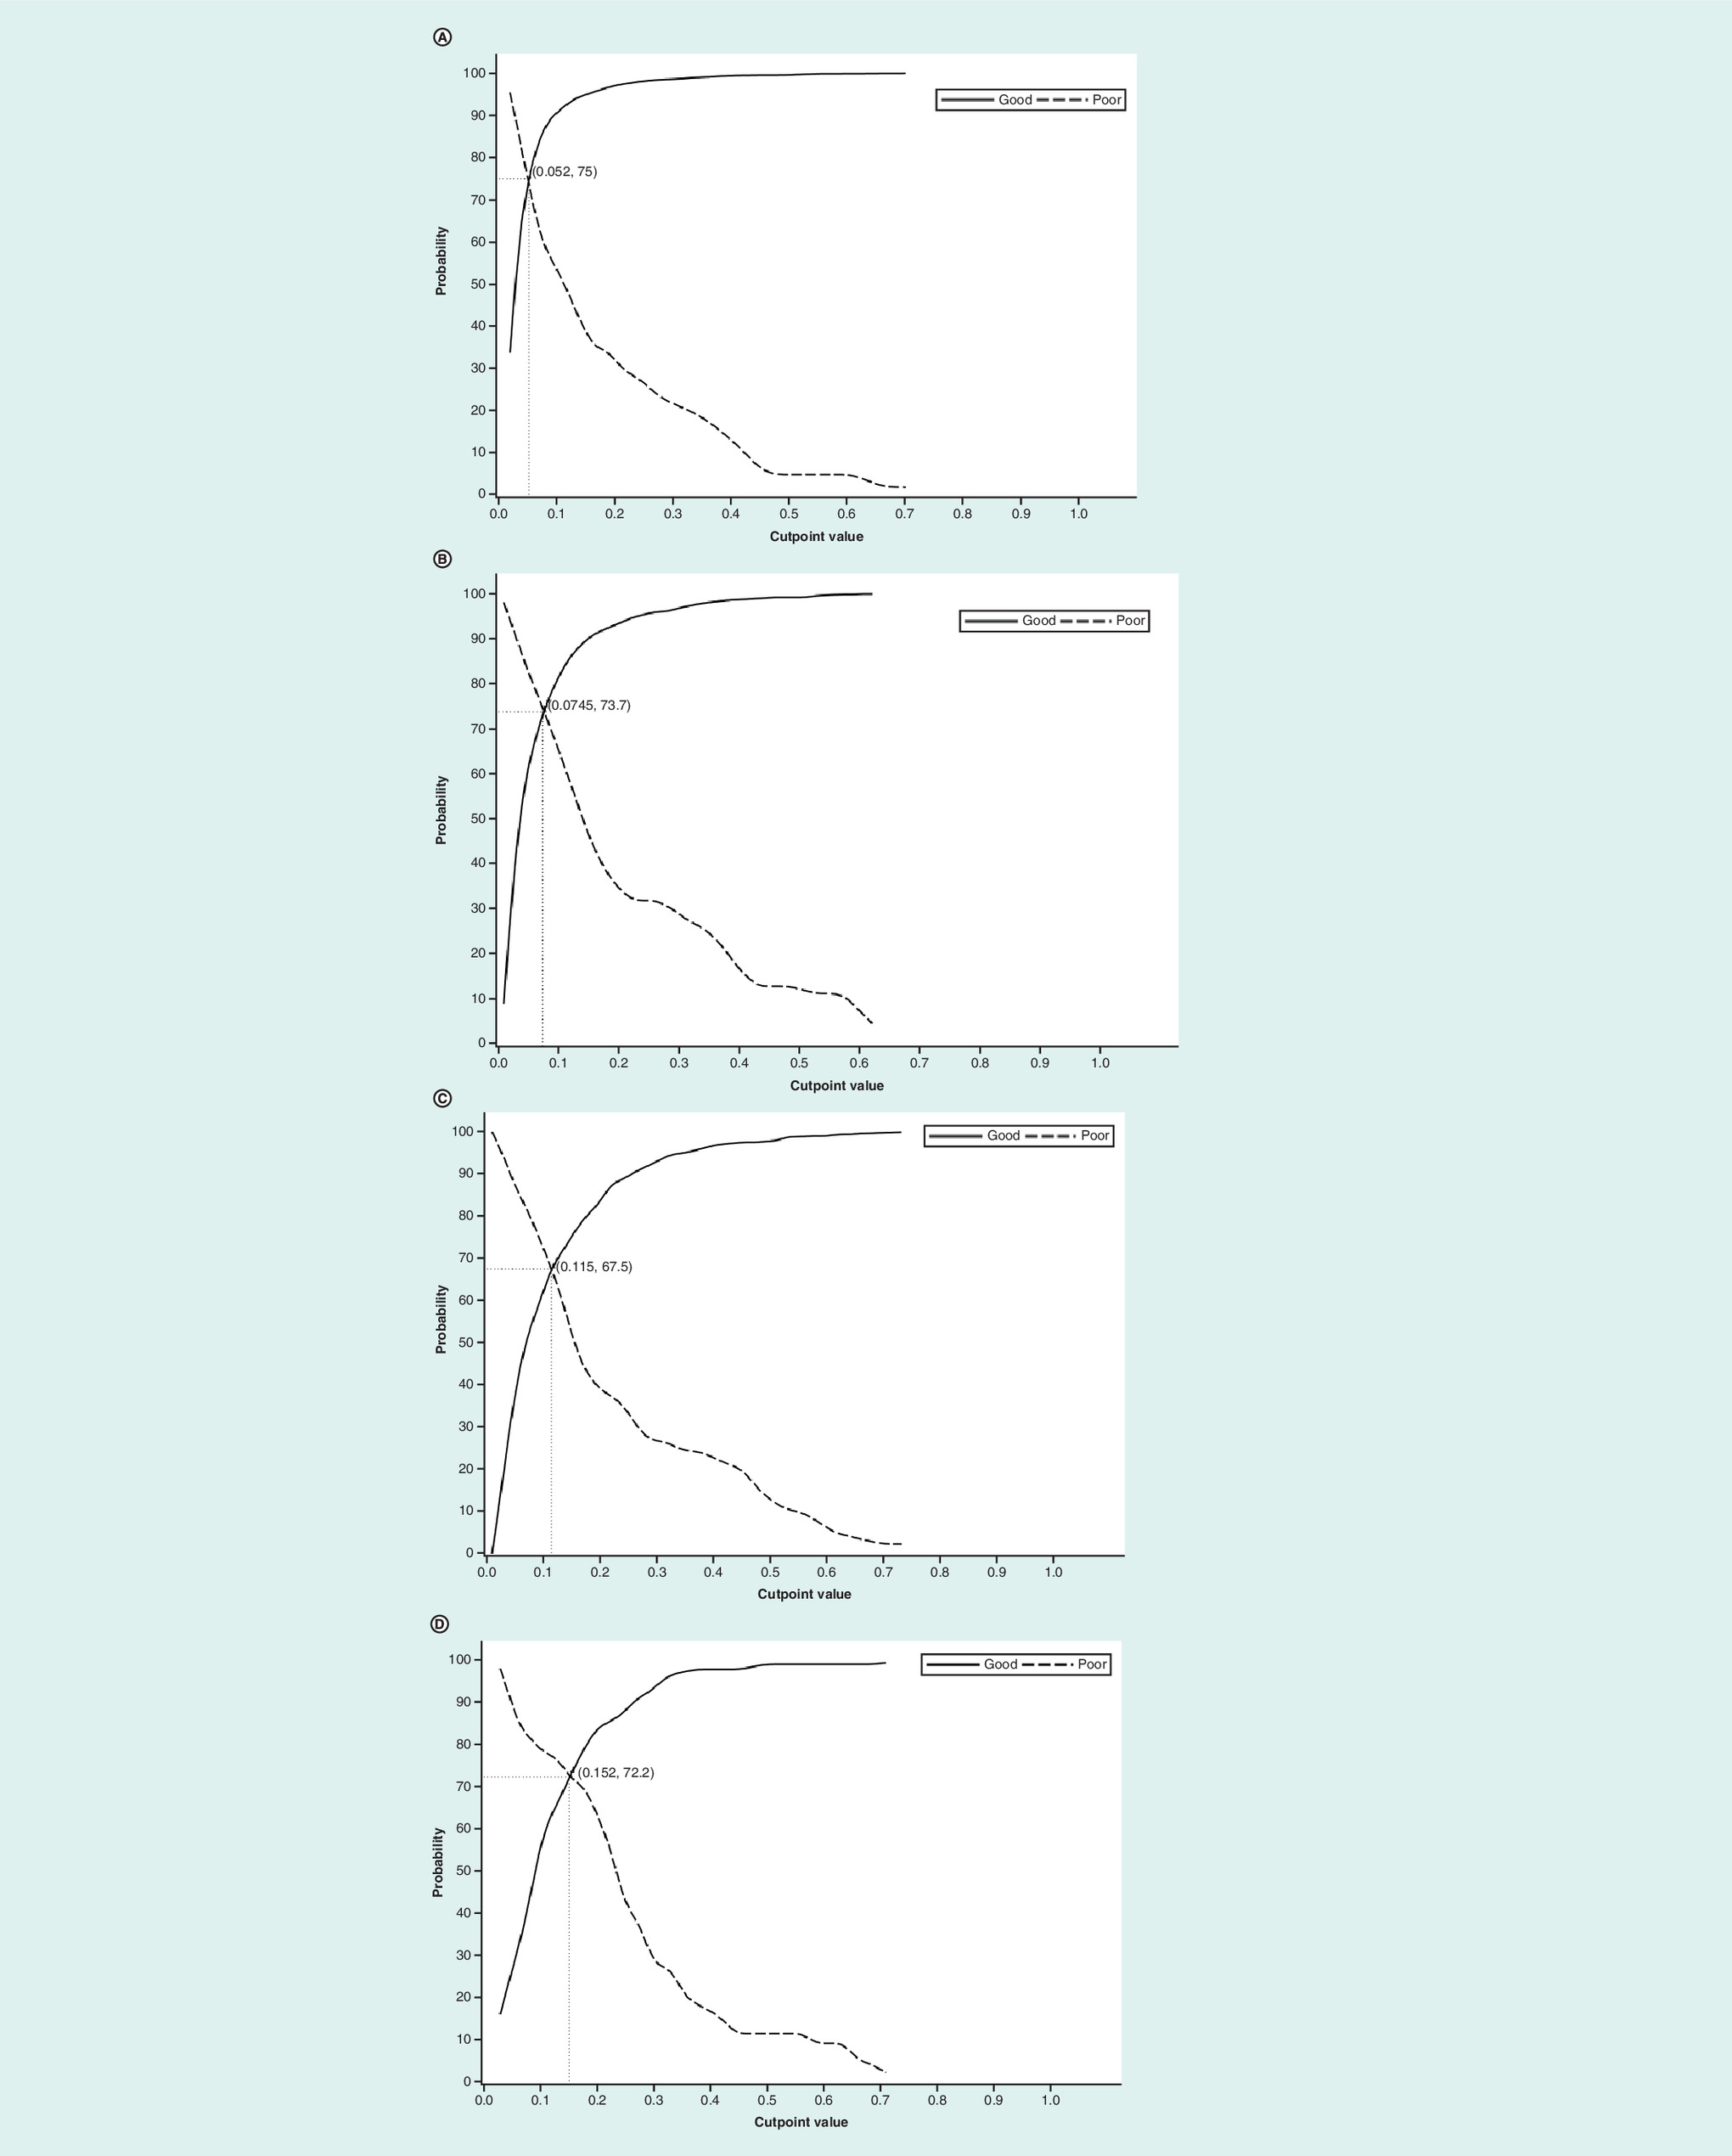
Figure 2. Plots of sensitivity and specificity according to all potential probability cutpoints for four cancer types.
(A–D) Plots of sensitivity and specificity according to all potential probability cutpoints for patients with: (A) breast cancer, (B) colorectal cancer, (C) lung cancer and (D) pancreatic cancer. The y-axis represents the probability (%) of correct assignment of patients as having ‘good’ performance status (specificity, or true negative rate) or ‘poor’ performance status (sensitivity, or true positive rate).
The results of the final multivariate logistic regression model in Table 4 are given as logit coefficients to enable calculation of the predicted probability of a PS value ≥2. To illustrate these calculations, consider a patient who is aged ≥75 years and only has nonreference levels of 1 or ‘yes’ (with the reference level being 0 or ‘no’) for ambulance and vertigo. The coefficients of the intercept, age 75+ years, ambulance and vertigo are added together (-4.3599 + 1.5879 + 0.4414 + -0.4097), giving a value of -2.7403 for the log odds. To convert the log odds to the predicted probability of a PS value ≥2, the expression exp(-2.7403)/(1 + exp(-2.7403)), where exp( ) means exponential, is then calculated. The resulting probability value is 0.0606, which being less than 0.078 means that the predicted PS value is greater than 2.
Discussion
The results of this study indicate that cancer patients with an ECOG PS ≥2, as documented in the EMR in an outpatient community oncology setting, can be identified reasonably well using healthcare services indicators and age- and frailty-related diagnoses from commercial and Medicare supplemental insurance claims data. The diagnoses and healthcare service indicators evaluated in this study were identified in previous studies as clinically relevant and significantly predictive of functional dependence in older adults [7,24]. The final predictive model included both positive and negative predictors of PS and demonstrated good discrimination in a general cancer population across a wide age range and in multiple tumor types.
This study sought to extend the work done in two recent studies that developed claims-based models to predict poor functional status in Medicare beneficiaries and in a study that used tumor registry variables and claims-based measures to predict PS in patients with advanced-stage lung cancer. Davidoff et al. [7] and Faurot et al. [24] used the MCBS to identify indicators of dependence in activities of daily living in fee-for-service Medicare beneficiaries. The predictive models showed good calibration, and poor claims-based functional status was significantly associated with increased hazard of death. However, these studies developed their algorithm using functional status as a proxy for PS and evaluated a general older adult population rather than cancer patients. Salloum et al. [11] used claims-based service use measures and an indicator of stage IV disease from a tumor registry to predict physician-reported good PS in patients with lung cancer with Health Maintenance Organization coverage within an integrated health system in Michigan. Our study evaluated patients with cancer using a broader population with commercial or Medicare supplemental insurance coverage who presented to outpatient community oncology practices across the USA. A potential advantage of using this combined commercial and Medicare population is that results may be useful across a broader population of insurance types, tumors and age groups. In addition, this analysis not only provides the algorithm but also estimates for cutpoints specific to common tumors likely subject to future study.
Despite differences in patient populations, data sources and analytic approaches, studies evaluating claims-based measures of PS have identified a number of consistent predictors in their models. For example, the models from Davidoff et al. [7], Faurot et al. [24] and the current study identified the use of wheelchairs, ambulance services and nursing home visits as positive predictors of poor PS and preventive screenings as a negative predictor. The models from Davidoff et al. [7] and the current study also identified other DME, endoscopy of the upper gastrointestinal tract and neurology visits as positive predictors of poor PS and dermatology visits, electrocardiography and sigmoidoscopy or colonoscopy as negative predictors. Both Faurot et al. [24] and Davidoff et al. [7] identified the use of a home hospital bed as a predictor. In terms of diagnostic indicators, Faurot et al. [24] and the current study identified age, stroke/brain injury, weakness, difficulty walking and sepsis as positive predictors, and lipid abnormalities as a negative predictor of poor PS. Previous studies have demonstrated that several of these indicators are associated with lower likelihood of aggressive therapy in patients with breast [31], colon [32] and lung cancers [33,34]. Given the consistency across studies, these diagnoses and healthcare service indicators may be stable predictors of poor PS. However, these indicators are not typically included in multivariable models for studies of comparative clinical or economic outcomes in cancer patients.
Previous cancer outcome studies have provided evidence for confounding due to lack of information on patients’ underlying health and PS. In a SEER-Medicare study, active therapy for localized prostate cancer was strongly associated with reduced risk of death from noncancer causes such as pneumonia and cardiovascular disease compared with observation, even after adjusting for age, race, urban residence, marital status, income, education, tumor size, tumor grade and comorbidity [6]. Because it is not plausible that prostate cancer therapy improves survival from causes other than prostate cancer, the authors concluded that these results are an indication that selection biases related to underlying health status of the active therapy and observation groups are responsible for the observed associations. A study using California Cancer Registry data found that breast-conserving therapy plus radiation (compared with mastectomy) was more strongly associated with reduced 3-year mortality rates from heart disease, cerebrovascular disease and respiratory disease than with mortality from breast cancer. The authors believed that these results indicate that women who had mastectomy had a higher burden of comorbidities at presentation that may have influenced surgical decision-making [35]. A similar study using SEER-Medicare data evaluated survival in women who received mastectomy versus breast-conserving therapy with radiation [36]. The authors performed sensitivity analyses to determine the potential impact of unmeasured confounding related to PS, and found that adjusting for potential differences in PS between treatment groups decreased the observed hazard ratio from 1.19 to 1.08. PS is frequently acknowledged as an unmeasured confounder in studies using tumor registry and administrative claims data to evaluate comparative effectiveness or costs of cancer therapies. The use of a claims-based measure of PS may enable partial control for confounding by PS or the ability to restrict or stratify a study population based on PS.
In this study, poor PS was defined as an ECOG score of 2 or greater, and approximately 8% of patients had poor PS according to this definition in our sample of patients from outpatient community oncology practices. Only 1.7% of patients had an ECOG PS score of 3 or 4. For most patients with solid tumors, the standard for chemotherapy use in American Society for Clinical Oncology and National Comprehensive Cancer Network guidelines includes the consideration of use in patients with an ECOG PS of 2 but call for a switch to palliative care in patients with a very poor ECOG PS of 3 or 4, as evidence indicates a less favorable risk–benefit ratio in these patients [37–39]. However, improvements in median overall survival associated with platinum-based combination therapy in patients with an ECOG PS of 2 are variable, ranging from 0.2 to 4 months in a recent meta-analysis [40]. In a recent prospective cohort study of patients with progressive metastatic disease, chemotherapy use was not associated with quality of life improvement near death in those with an ECOG PS of 2 or 3 at study entry [37]. In their claims-based prediction models, Salloum et al. [11] evaluated a definition of poor PS that included or excluded an ECOG PS of 2 and found that ‘poor’ PS can be predicted reasonably well regardless of whether an ECOG PS of 2 is considered ‘poor’.
To maximize sensitivity and specificity, the probability cutpoint of 0.078 was selected for the overall study sample. However, the preferred probability cutpoint ultimately depends on research objectives and may be adjusted accordingly in future studies. When applying this algorithm and wishing to maximize sensitivity and specificity in future applications of this predictive model, it will be important to consider the specific cancer type as compared with the broader inclusion in our study. The different probability cutpoints considered in this study reflected different frequencies of poor ECOG PS across cancer types while simultaneously maximizing both sensitivity and specificity. The specificity associated with a cutpoint of 0.078 was better for tumors that were historically screened (breast, colorectal) than those that were not (lung, pancreas), which might relate to the influence of the patients’ stage of disease at diagnosis. When evaluating specific tumors, there will be better algorithm performance if the tumor-specific cutpoints are used for determining which patients are likely PS ≥2. Finally, one might consider a higher probability cutpoint for studies where it is important to identify patients with poor ECOG PS with high specificity, such as those evaluating chemotherapy use in patients for whom it may offer less benefit and more risk [11]. However, in such a case, this study provides no specific guidance for cutpoint determination beyond that for the broad tumor group and the specific tumors analyzed here.
The results of this study should be interpreted in light of the following limitations. The ECOG PS measures are usually physician reported and as such are documented in the EMR. PS scoring by healthcare professionals is subjective in nature, and physicians may overestimate PS [41], either unintentionally or to obtain approval for a specific treatment or clinical trial participation. The study captured patients at the point of presentation to their outpatient oncology practice rather than at the point of initial diagnosis, and as a result, patients may be at different points in the disease trajectory. Patients who were undergoing diagnosis and treatment prior to the PS measurement in the EMR may have different patterns of healthcare services use. Approximately 30% of patients in the study had claims with a cancer diagnosis in the 3–12 months prior to appearance in the EMR. Patients with a prior diagnosis of cancer were not excluded from the study sample. Therefore, the sample may contain patients with a history of cancer as well as a small percentage of patients with another concurrent primary cancer. Only structured documentation of PS was available in the EMR database, and 27% of patients had a PS measurement recorded within 30 days of their earliest encounter. It is unclear which patient, physician or practice factors may influence whether or not a PS measurement is recorded in the EMR. It is possible that patients with PS measurements recorded within 30 days of the earliest encounter represent a select group. Access to the unstructured data (e.g., physician notes) may have increased the completeness of PS measurement [11]. Our study used an internal validation approach. Ideally, this prediction model should be validated in an external sample. There are limitations with a claims-based approach to characterizing PS. For example, medical diagnoses are known to be poorly reported in claims data, resulting in poor sensitivity. DME use varies based on personal preferences as well as restrictions on reimbursement [11]. Finally, the patients included in this study were commercial beneficiaries covered by employer-sponsored health plans and Medicare beneficiaries with employer-sponsored supplemental coverage. These beneficiaries may have better health status and different use patterns of healthcare services because they are younger and qualify for employment-related coverage. A study sample with a combination of commercial and public insurance may produce a more generalizable prediction model.
Future research is needed to evaluate additional subgroups of interest, such as age, gender and cancer stage, because patterns of service use and the associations between diagnoses, health services use and PS may differ across these subgroups. In addition, future research is needed to develop individual models for specific cancer types as well as the other subgroups of interest to determine if predictors are consistent and to identify predictors specific to particular subgroups. Further validation should also be performed to evaluate the ability of this claims-based indicator of poor PS to predict mortality, not available in our dataset. In addition, future work should establish the positive and negative predictive value of this algorithm in populations that have higher prevalence of poor PS.
Conclusion
Administrative claims data are increasingly used in oncology to evaluate treatment patterns and costs, guide insurer decisions and evaluate effectiveness and safety outcomes in many different tumors. To best use these data, health service researchers, policy makers and insurers must understand the potential for selection bias and confounding in treatment comparisons. The ability to approximate PS in these studies will enhance the use of Truven MarketScan databases, for health economics and outcomes research in oncology.
Administrative claims data are increasingly used to evaluate patient outcomes and costs of care in oncology.
These studies are susceptible to confounding due to missing variables, such as performance status (PS), a measure of functional capacity used in oncology practice.
In this retrospective study, we developed a claims-based prediction model of poor PS in commercially insured and Medicare supplemental beneficiaries.
Electronic medical records (EMR) data from community oncology practices linked to MarketScan commercial claims and Medicare supplemental databases were analyzed for patients with PS scores recorded in the EMR.
Multivariable logistic regression was used to predict EMR-based PS from diagnostic and procedure codes in the claims data, with split-sampling and bootstrapping performed for internal validation.
In the overall cohort, 8.1% of patients had Eastern Cooperative Oncology Group PS ≥2, but the percentage ranged from 3.3% for breast to 20.1% for pancreatic cancer.
Bootstrapping results on the final model showed sensitivity and specificity of approximately 75% with a predicted probability cutpoint of 0.078, c-statistic = 0.821, and pseudo-R2 = 0.25.
Patients with poor PS can be identified using diagnostic and procedure codes from claims data, which may enable partial control for confounding by PS or stratification or restriction of the patient sample in future comparative studies.
Supplementary data
To view the supplementary data that accompany this paper please visit the journal website at: Supplementary Material
Financial & competing interests disclosure
Research was funded by Eli Lilly and Company. Eli Lilly and Company provided funding to Truven Health Analytics to conduct the analysis. KM Sheffield, L Bowman, L Li are employees of Eli Lilly and Company employee and own Lilly stock. D Smith, LB Montejano and T Willson are employees of Truven Health Analytics, an IBM Company. LM Hess is an employee of Eli Lilly and Company. AJ Davidoff's spouse has received consulting and research funding from Celgene, and consulting funding from Boehringer-Ingelheim. The authors have no other relevant affiliations or financial involvement with any organization or entity with a financial interest in or financial conflict with the subject matter or materials discussed in the manuscript apart from those disclosed.
No writing assistance was utilized in the production of this manuscript.
Ethical conduct of research
This study used only de-identified, pre-existing patient records and did not involve the collection, use or transmittal of individually identifiable data, so Institutional Review Board (IRB) approval was not necessary. The exemption from IRB approval, per US Department of Health and Human Services regulations, for studies that use existing information that cannot be used to identify individual patients is contained in 45 CFR [Code of Federal Regulations] 46.101(b)(4).
Supplementary Material
File (suppl_materials.docx)
- Download
- 104.98 KB
References
Papers of special note have been highlighted as: • of interest
1.
Goulart BH. Value: the next frontier in cancer care. Oncologist 21(6), 651–653 (2016).
2.
Lyman GH, Levine M. Comparative effectiveness research in oncology: an overview. J. Clin. Oncol. 30(34), 4181–4184 (2012).
3.
Meyer AM, Carpenter WR, Abernethy AP, Stürmer T, Kosorok MR. Data for cancer comparative effectiveness research: past, present, and future potential. Cancer 118(21), 5186–5197 (2012).
4.
Garrison LP Jr, Neumann PJ, Erickson P, Marshall D, Mullins CD. Using real-world data for coverage and payment decisions: the ISPOR Real-World Data Task Force report. Value Health 10(5), 326–335 (2007).
5.
Cox E, Martin BC, Van Staa T, Garbe E, Siebert U, Johnson ML. Good research practices for comparative effectiveness research: approaches to mitigate bias and confounding in the design of nonrandomized studies of treatment effects using secondary data sources: the International Society for Pharmacoeconomics and Outcomes Research Good Research Practices for Retrospective Database Analysis Task Force Report – Part II. Value Health 12(8), 1053–1061 (2009).
6.
Giordano SH, Kuo YF, Duan Z et al. Limits of observational data in determining outcomes from cancer therapy. Cancer 112, 2456–2466 (2008).
7.
Davidoff AJ, Zuckerman IH, Pandya N et al. A novel approach to improve health status measurement in observational claims-based studies of cancer treatment and outcomes. J. Geriatr. Oncol. 4(2), 157–165 (2013).
• Identifies claims-based predictors of self-reported functional status in older adults using data from the Medicare current beneficiary survey and evaluated the association between the claims-based measure of functional status and survival.
8.
Lilenbaum RC, Herndon JE 2nd, List MA et al. Single-agent versus combination chemotherapy in advanced non-small-cell lung cancer: the cancer and leukemia group B (study 9730). J. Clin. Oncol. 23(1), 190–196 (2005).
9.
Stanley KE. Prognostic factors for survival in patients with inoperable lung cancer. J. Natl Cancer Inst. 65(1), 25–32 (1980).
10.
Pater JL, Loeb M. Nonanatomic prognostic factors in carcinoma of the lung: a multivariate analysis. Cancer 50(2), 326–331 (1982).
11.
Salloum RG, Smith TJ, Jensen GA, Lafata JE. Using claims-based measures to predict performance status score in patients with lung cancer. Cancer 117(5), 1038–1048 (2011).
• Explores the ability to estimate performance status (PS) in lung cancer patients using data from tumor registry and medical pharmaceutical claims from a medical group practice in southeast Michigan for patients enrolled in an affiliated health plan (Health Maintenance Organization).
12.
Klabunde CN, Warren JL, Legler JM. Assessing comorbidity using claims data: an overview. Med. Care 40(8 Suppl.), IV-26–IV-35 (2002).
13.
Extermann M, Overcash J, Lyman GH, Parr J, Balducci L. Comorbidity and functional status are independent in older cancer patients. J. Clin. Oncol. 16(4), 1582–1587 (1998).
14.
Davidoff AJ, Gardner LD, Zuckerman IH, Hendrick F, Ke X, Edelman MJ. Validation of disability status, a claims-based measure of functional status for cancer treatment and outcomes studies. Med. Care 52(5), 500–510 (2014).
• Uses Surveillance, Epidemiology, and End Results Program-Medicare data to determine the association between claims-based disability status and receipt of cancer-directed treatments in older adults with early non-small-cell lung cancer, advanced non-small-cell lung cancer, stage IV breast cancer and myelodysplastic syndromes. The disability status measure significantly predicts cancer-directed treatments.
15.
Kesselheim AS, Huybrechts KF, Choudry NK et al. Prescription drug insurance coverage and patient health outcomes: a systematic review. Am. J. Public Health 105(2), e17–e30 (2015).
16.
Oken MM, Creech RH, Tormey DC et al. Toxicity and response criteria of the Eastern Cooperative Oncology Group. Am. J. Clin. Oncol. 5(6), 649–655 (1982).
17.
Schag CC, Heinrich RL, Ganz PA. Karnofsky performance status revisited: reliability, validity, and guidelines. J. Clin. Oncol. 2(3), 187–193 (1984).
18.
Ma C, Bandukwala S, Burman D et al. Interconversion of three measures of performance status: an empirical analysis. Eur. J. Cancer 46(18), 3175–3183 (2010).
19.
Kohne CH, Cunningham D, Di Costanzo et al. Clinical determinants of survival in patients with 5-fluorouracil-based treatment for metastatic colorectal cancer: results of a multivariate analysis of 3825 patients. Ann. Oncol. 13(2), 308–317 (2002).
20.
Schiller JH, Harrington D, Belani CP et al. Comparison of four chemotherapy regimens for advanced non-small-cell lung cancer. N. Engl. J. Med. 346(2), 92–98 (2002).
21.
Sargent DJ, Kohne CH, Sanoff HK et al. Pooled safety and efficacy analysis examining the effect of performance status on outcomes in nine first-line treatment trials using individual data from patients with metastatic colorectal cancer. J. Clin. Oncol. 27(12), 1948–1955 (2009).
22.
Centers for Medicare and Medicaid Services. Berenson-Eggers Type of Service codes (BETOS). www.cms.gov/Research-Statistics-Data-and-Systems/Statistics-Trends-and-Reports/MedicareFeeforSvcPartsAB/Downloads/BETOSDescCodes.pdf.
23.
Kim DH, Schneeweiss S. Measuring frailty using claims data for pharmacoepidemiologic studies of mortality in older adults: evidence and recommendations. Pharmacoepidemiol. Drug Saf. 23(9), 891–901 (2014).
24.
Faurot KR, Jonsson Funk M, Pate V et al. Using claims data to predict dependency in activities of daily living as a proxy for frailty. Pharmacoepidemiol. Drug Saf. 24(1), 59–66 (2015).
• Identifies demographic, diagnosis and procedure codes that predict dependency in activities of daily living in older adults using the Medicare current beneficiary survey.
25.
Klabunde CN, Potosky AL, Legler JM, Warren JL. Development of a comorbidity index using physician claims data. J. Clin. Epidemiol. 53(12), 1258–1267 (2000).
26.
Deyo RA, Cherkin DC, Ciol MA. Adapting a clinical comorbidity index for use with ICD-9-CM administrative databases. J. Clin. Epidemiol. 45(6), 613–619 (1992).
27.
National Cancer Institute. SEER-Medicare: calculation of comorbidity weights. https://healthcaredelivery.cancer.gov/seermedicare/considerations/calculation.html.
28.
Steyerberg EW, Harrell FE Jr, Borsboom GJ, Eijkemans MJ, Vergouwe Y, Habbema JD. Internal validation of predictive models: efficiency of some procedures for logistic regression analysis. J. Clin. Epidemiol. 54(8), 774–781 (2001).
29.
Whiting P, Rutjes AWS, Reitsma JB et al. Sources of variation and bias in studies of diagnostic accuracy: a systematic review. Ann. Intern. Med. 140(3), 189–202 (2004).
30.
van Stralen KJ, Stel VS, Reitsma JB et al. Diagnostic methods I: sensitivity, specificity, and other measures of accuracy. Kidney Int. 75(12), 1257–1263 (2009).
31.
Schneider M, Zuckerman IH, Onukwugha E et al. Chemotherapy treatment and survival in older women with estrogen receptor-negative metastatic breast cancer: a population-based analysis. J. Am. Geriatr. Soc. 59(4), 637–646 (2011).
32.
Zuckerman IH, Rapp T, Onukwugha E et al. Effect of age on survival benefit of adjuvant chemotherapy in elderly patients with Stage III colon cancer. J. Am. Geriatr. Soc. 57(8), 1403–1410 (2009).
33.
Davidoff AJ, Tang M, Seal B, Edelman MJ. Chemotherapy and survival benefit in elderly patients with advanced non-small-cell lung cancer. J. Clin. Oncol. 28(13), 2191–2197 (2010).
34.
Davidoff AJ, Gardner JF, Seal B, Edelman MJ. Population-based estimates of survival benefit associated with combined modality therapy in elderly patients with locally advanced non-small cell lung cancer. J. Thorac. Oncol. 6(5), 934–941 (2011).
35.
Hwang ES, Lichtensztajn DY, Gomez SL, Fowble B, Clarke C. Survival after lumpectomy and mastectomy for early stage invasive breast cancer: the effect of age and hormone receptor status. Cancer 119(7), 1402–1411 (2013).
36.
Keating NL, Landrum MB, Brooks JM et al. Outcomes following local therapy for early-stage breast cancer in non-trial populations. Breast Cancer Res. Treat. 125(3), 803–813 (2011).
37.
Prigerson HG, Bao Y, Shah MA et al. Chemotherapy use, performance status, and quality of life at the end of life. JAMA Oncol. 1(6), 778–784 (2015).
• Multi-institutional, longitudinal cohort study that demonstrates that palliative chemotherapy use did not improve quality of life near death for patients with moderate or poor PS.
38.
Schnipper LE, Smith TJ, Raghavan D et al. American Society of Clinical Oncology identifies five key opportunities to improve care and reduce costs: the top five list for oncology. J. Clin. Oncol. 30(14), 1715–1724 (2012).
39.
Schnipper LE. IOM Workshop: achieving value in cancer care: ASCO's top 5 and beyond. www.nationalacademies.org/hmd/∼/media/6BAD2635C5B14D3D9A8F99A192630142.ashx.
40.
Bronte G, Rolfo C, Passiglia F et al. What can platinum offer yet in the treatment of PS2 NSCLC patients? A systematic review and meta-analysis. Crit. Rev. Oncol. Hematol. 95(3), 306–317 (2015).
• Meta-analysis that indicates that platinum-based doublets provide superior survival to single-agent therapy in PS-2 patients, but lead to an increase in severe hematological toxicities. The authors caution that PS-2 patients should be stratified according to comorbidity to help identify those who could tolerate platinum-based doublets.
41.
Lilenbaum RC, Cashy J, Hensing TA, Young S, Cella D. Prevalence of poor performance status in lung cancer patients: implications for research. J. Thorac. Oncol. 3(2), 125–129 (2008).
Information & Authors
Information
Published In
Copyright
© 2018 Future Medicine Ltd.
History
Received: 12 June 2017
Accepted: 24 August 2017
Published online: 13 March 2018
Keywords:
Topics
Authors
Metrics & Citations
Metrics
Article Usage
Article usage data only available from February 2023. Historical article usage data, showing the number of article downloads, is available upon request.
Citations
How to Cite
Development and validation of a claims-based approach to proxy ECOG performance status across ten tumor groups. (2018) Journal of Comparative Effectiveness Research. DOI: 10.2217/cer-2017-0040
Export citation
Select the citation format you wish to export for this article or chapter.
Citing Literature
- Po-Huang Chen, Wei-Cheng Chang, Hong-Jie Jhou, Hsin-Yu Chen, Li-Ting Kao, Tina Yi-Jin Hsieh, Ming-Shen Dai, Cho-Hao Lee, COVID-19 mRNA vaccination and immune-related adverse events in patients with cancer receiving immune checkpoint inhibitors: a target trial emulation study, Journal for ImmunoTherapy of Cancer, 10.1136/jitc-2025-014726, 14, 6, (e014726), (2026).
- Michael Johnson, Peining Tao, Mehmet Burcu, John Kang, Richard Baumgartner, Junshui Ma, Vladimir Svetnik, Creating a Proxy for Baseline Eastern Cooperative Oncology Group Performance Status in Electronic Health Records for Comparative Effectiveness Research in Advanced Non–Small Cell Lung Cancer, JCO Clinical Cancer Informatics, 10.1200/CCI-24-00185, 9, (2025).
- Emanuel Krebs, Deirdre Weymann, Cheryl Ho, Alison Weppler, Ian Bosdet, Aly Karsan, Timothy P. Hanna, Samantha Pollard, Dean A. Regier, Clinical Effectiveness and Cost-Effectiveness of Multigene Panel Sequencing in Advanced Melanoma: A Population-Level Real-World Target Trial Emulation, JCO Precision Oncology, 10.1200/PO-24-00631, 9, (2025).
- Emanuel Krebs, Deirdre Weymann, Cheryl Ho, Ian Bosdet, Janessa Laskin, Howard J. Lim, Stephen Yip, Aly Karsan, Timothy P. Hanna, Samantha Pollard, Dean A. Regier, Real-world cost-effectiveness of multi-gene panel sequencing to inform therapeutic decisions for advanced non-small cell lung cancer: a population-based study, The Lancet Regional Health - Americas, 10.1016/j.lana.2024.100936, 40, (100936), (2024).
- Charis A. Spears, Sarah E. Hodges, Beiyu Liu, Vishal Venkatraman, Ryan M. Edwards, Khoi D. Than, Muhammad M. Abd-El-Barr, Beth Parente, Hui-Jie Lee, Shivanand P. Lad, Nationwide Analysis of Risk Factors Related to Opioid Weaning Following Lumbar Decompression Surgery – A Retrospective Database Study, World Neurosurgery, 10.1016/j.wneu.2023.12.025, 186, (e20-e34), (2024).
- Hung Viet Nguyen, Haewon Byeon, Prediction of ECOG Performance Status of Lung Cancer Patients Using LIME-Based Machine Learning, Mathematics, 10.3390/math11102354, 11, 10, (2354), (2023).
- Krishna S. Gunturu, Timothy T. Pham, Sonali Shambhu, Michael J. Fisch, John J. Barron, David Debono, Immune checkpoint inhibitors: immune-related adverse events, healthcare utilization, and costs among commercial and Medicare Advantage patients, Supportive Care in Cancer, 10.1007/s00520-022-06826-9, 30, 5, (4019-4026), (2022).
- Na Li, Gang Wang, Guolong Duan, Zongmin Li, Yu Zheng, Zhiwei Wang, Guowen Li, Clinical observation of transcatheter arterial chemoembolization in super-aged patients with advanced gastric cancer, Supportive Care in Cancer, 10.1007/s00520-021-06565-3, 30, 2, (1441-1450), (2021).
- Natalia Sadetsky, Ching‐Yi Chuo, Amy J. Davidoff, Development and evaluation of a proxy for baseline ECOG PS in advanced non‐small cell lung cancer, bladder cancer, and melanoma: An electronic health record study , Pharmacoepidemiology and Drug Safety, 10.1002/pds.5309, 30, 9, (1233-1241), (2021).
- Jacopo Desiderio, Andrea Sagnotta, Irene Terrenato, Bruno Annibale, Stefano Trastulli, Federico Tozzi, Vito D’Andrea, Sergio Bracarda, Eleonora Garofoli, Yuman Fong, Yanghee Woo, Amilcare Parisi, Gastrectomy for stage IV gastric cancer: a comparison of different treatment strategies from the SEER database, Scientific Reports, 10.1038/s41598-021-86352-6, 11, 1, (2021).