Comparison of EQ-5D and SF-36 in untreated patients with symptoms of intermittent claudication
Abstract
Aim: To compare health-related quality of life (HRQoL) descriptions and utility scores in newly diagnosed peripheral arterial disease (PAD) patients, using two most widely used instruments, EuroQol 5D (EQ-5D) and Medical Outcome Study 36-item Short-Form Health Status Survey (SF-36). Methods: Patients’ self-assessment of HRQoL was measured by the Dutch versions of the EQ-5D and SF-36 in the 204 patients. Results: Mean utility scores ranged from 0.675 for Short-Form Six-Dimension, 0.648 for the EQ-5D UK tariff and 0.715 for the Dutch EQ-5D tariff. A moderate correlation between the utility scores was found due to different valuation techniques of these instruments. Conclusion: Both instruments have clinical validity for use in the PAD and can be used alongside each other to provide a holistic assessment of the HRQoL. Before using these two instruments interchangeably for utility score calculations and healthcare resource allocation, a thorough sensitivity analysis is necessary to explore the robustness of the value argument based on these utility scores.
Peripheral arterial disease (PAD) with its most classical manifestation of intermittent claudication (IC) is a sign of widespread atherosclerosis affecting multiple vascular beds simultaneously including coronary, cerebral and renal arteries. It is a relatively common disorder with a prevalence estimated at 16% in those aged over 55 years and up to 29% in high-risk groups [1]. PAD patients have a significant reduction in health-related quality of life (HRQoL) caused by impaired mobility and by cardiovascular morbidity [2]. There is increasing acknowledgement of the clinical and economic benefits of (early) identification of PAD and its treatment. The Prevention of Athero-thrombotic Disease Network, an international, multidisciplinary network, has recommended a multipronged strategy to increase awareness, detection and treatment rates of PAD and have emphasized the need for greater resource allocation for PAD [3].
In order to make recommendations for public funding of treatments across different technologies and disease areas, comparability of the HRQoL measure across indications is important [4]. The quality-adjusted life year (QALY) is a common measure to compare interventions across disease areas. The QALY integrates life expectancy and a utility value, representing the HRQoL adjusted expectancy [5]. The cost per QALY of competing treatments can be a useful input into medical decision making and priority setting [6]. For instance, the National Health Care Institute (Zorginstituut Nederland) in the Netherlands and NICE in the UK recommend the use of QALYs as a measure of health benefit to enable a standardized approach for comparing economic evaluations across different healthcare areas [4,7].
Several instruments exist to determine utility values for health states and two most widely used instruments are EuroQol 5D (EQ-5D) and Medical Outcome Study 36-item Short-Form Health Status Survey (SF-36)-derived Short-Form Six-Dimension (SF-6D) [8,9]. These instruments differ in their conceptualization of HRQoL, the detail of their descriptive systems, their valuation techniques and the degree to which they invoke the assumptions of multi-attribute utility theory. Utility scores obtained from these instruments may vary due to these differences [10]. Moreover, the acceptability of the cost-utility ratios based on utility scores from these two instruments differs as well [11].
Both the EQ-5D and the SF-36 have been used to assess QoL in patients with PAD [12–15]. A large nationwide American study used SF-36 and was conducted in 25 cities at 350 primary care practices demonstrated that patients with PAD had a similarly low HRQoL as patients with other cardio vascular diseases [16]. Other QoL studies in PAD patients using SF-36 have drawn similar conclusions [17,18]. Despite cost utility evaluations being required by different authorities, data on health state preferences or utilities of IC patients are scarce in the Netherlands. There are two Dutch HRQoL studies in PAD patients that were conducted alongside the Dutch Bypass Oral Anticoagulant trial and Dutch Iliac Stent trial [19,20]. These studies have a patient population with severe functional impairment requiring immediate revascularization. The Dutch Bypass Oral Anticoagulant trial used both EQ-5D and SF-36 but did not compare the results. Therefore to the best of our knowledge, the utility scores for newly diagnosed PAD patients in the Dutch population are not reported in the literature. Our study was motivated by a need to compare HRQoL descriptions and utility scores in newly diagnosed and untreated PAD patients with leg symptoms of IC obtained by the EQ-5D and SF-6D. Additional research questions for this research were:
What are the differences between health states descriptions obtained with the EQ-5D and the SF-6D?
What are the differences and relation between utility scores obtained with the EQ-5D and the SF-6D?
Do utility scores obtained with EQ-5D and SF-6D reflect functional and clinical severity of PAD (clinical validity)?
Materials & methods
Patients
Study subjects were consecutive patients with newly diagnosed PAD from three hospitals (Atrium Medical Center Heerlen, Orbis Medical Centre Sittard and the Maastricht University Medical Centre) in Limburg, the Netherlands. Patients were included between January 2009 and November 2013 after written informed consent of the patients was obtained. Medical Ethics Committee approval was granted for the study. The diagnosis of PAD was based on an in-hospital performed ankle brachial index of ≤0.9. After initial clinical assessment with history taking, a physical examination was performed by the treating physician. Exclusion criteria for participation were the use of medication known to affect coagulation (e.g., cumarins, direct factor Xa-inhibitors and factor II-inhibitors, heparin), known coagulation disorders, age under 18 years and the presence of active malignancy or chronic inflammatory diseases. The patients who underwent a cardiovascular intervention/arterial (peripheral) surgery within the past 6 months and patients with an episode of (unstable) angina pectoris, myocardial infarction, stroke or heart failure within the past 3 months were excluded as well.
Data collection
Patients were asked to participate in the study and subsequently included within 3 months after the initial diagnosis of PAD. On entry of the study, patients were seen by a study physician or research nurse and were questioned about their personal and medical history. In order to assess the patients’ clinical and functional status, they were asked about rest pain, night pain and pain-free walking distance.
Patients were classified using Fontaine classification reflecting the clinical and functional severity of the disease covering the entire spectrum of symptoms in PAD. There are five Fontaine stages: Stage I – Asymptomatic, Stage II – IC (patients usually have a very constant distance at which they have pain and this stage is subdivided into Stage IIa and IIb) Stage IIa – IC after more than 200 meters of pain free walking and Stage IIb – IC after less than 200 meters of walking, Stage III – Rest pain and Stage IV – Ischemic ulcers or gangrene [21].
Quality of life assessment
Patients’ self-assessment of HRQoL was measured by the Dutch versions of the EQ-5D and SF-36.
The EQ-5D is a five-dimensional instrument, the dimensions being mobility, self-care, usual activities, pain/discomfort and depression/anxiety. Each of these dimensions can be rated as 1 (no problem), 2 (some problem) or 3 (severe problem). There are 243 distinct health states described by the EQ-5D, and a sample of these has been valued by community samples from different countries using the time trade-off method. Country-specific algorithms have been developed based on societal preferences for health states. We have used the UK and the Dutch population-specific scoring functions to derive the utility values based on the EQ-5D questions [9,22–24]. Utility scores calculated by the UK scoring function range from -0.59 (health state worse than death, severe problems in all dimensions, through 0 (health state equal to death) to 1 (full health, no problems in all dimensions). For the Dutch scoring function this range was -0.329–1. The EQ-5D instrument also includes a visual analog scale (VAS), which records the respondent’s self-rated health status on a graduated (0–100) scale ranging from best to worst imaginable health. The EQ-5D-3L was used to determine the utility values, because the newer EQ-5D-5L was unavailable at the time of patient enrollment. The 3-level version includes three answer possibilities for each dimension (no problem, some or moderate problems, severe problems).
The SF-36 includes 36 items that can be classified into the following eight health-status subscales: physical functioning, physical role limitations, bodily pain, general health perception, vitality, social functioning, emotional role limitations and mental health [25,26]. The SF-36 is a generic multidimensional instrument, which was reduced to six items by Brazier et al. to develop the SF-6D. The six items (each with 4–6 levels) in the SF-6D are physical functioning, role limitations, social functioning, pain, mental health and vitality [8]. The SF-6D algorithm reduces the eight dimensions of the SF-36 to six by combining role limitations due to physical and emotional problems and omitting general health perceptions. The SF-6D describes 18,000 health states in all and 249 states were valued by a sample from the UK general public using the standard gamble method. The SF-6D utility scores range from 0.29 to 1.00. Regression models were used to estimate utility scores for all health states [8].
Statistical methods
Open Clinica software was used to store the data. This is an open source clinical trial software for electronic data capture and clinical data management. All statistical analyses were performed with IBM SPSS statistics version 20.0 software (SPSS Inc., IL, USA). As recommended to handle missing HRQoL data, missing data on the EQ-5D and SF-6D were replaced using multiple imputation [27] to improve the validity of medical research results and to reduce the waste of resources caused by missing data [28].
For this purpose, five data were created using the ‘Markov Chain Monte Carlo’ algorithm. This method assumes normality and linearity. Variables were transformed before the imputation process and then back-transformed to create imputed values [29]. Demographic, risk factors, family history, medicine history and PAD-related functional limitation data were summarized as number and percentage in each category.
Utility scores from SF-36 (UK) and EQ-5D (UK and the Netherlands [NL]) were derived using the published algorithms [8,22,27]. Summary of basic descriptive statistics including means, medians and ranges of utility scores were computed. Utility score distribution across instruments was charted. The differences between the mean and median utility scores obtained with the EQ-5D and SF-6D were tested using the paired samples t-tests and Wilcoxon signed rank test. The association between the EQ-5D and SF-6D utility scores was examined by Spearman rank correlation for nonparametric measures. The degree of agreement between the SF-6D and the EQ-5D UK utility scores was assessed by the Bland–Altman plot.
The empirical validity of the EQ-5D and SF-6D utility scores was assessed by hypothetically constructed preference rule that utility scores should differ significantly between self-reported functional status groups and should decrease monotonically with severity of symptoms [30]. Mean values and 95% confidence intervals of the utility scores from the EQ-5D (UK and Dutch tariffs) and SF-6D were compared for functional (rest pain, night pain, limitation of activities of daily life, pain-free walking distance) and clinical (Fontaine classification) subgroups of patients.
Results
Out of 250 patients included, 204 (81.6%) returned the survey instrument containing the SF-36 and EQ-5D. The participants who responded to the survey ranged in age from 46 to 86 years old, with an average age of 66.5 years. More than half of them were males, current alcohol and tobacco users and had limitations in the activities of daily life. Demographic and functional characteristics of 204 patients included in the study are shown in Table 1.
| Characteristic(s) | Value | % |
|---|---|---|
| Age (years) | – | – |
| Mean | 66.5 | – |
| SD | 7.99 | – |
| Min | 46 | – |
| Max | 86 | – |
| Percentiles: | ||
| – 25 | 61 | – |
| – 50 (Median) | 66 | – |
| – 75 | 71.75 | – |
| Male | 134 | 65.7 |
| Current smokers | 111 | 54.4 |
| Current alcohol users | 153 | 75 |
| Diabetes mellitus | 199 | 97.5 |
| Hypercholestrolemia | 100 | 49 |
| Hypertension | 111 | 54.4 |
| Family history of CV diseases | 87 | 42.6 |
| On anti-platelet medication | 172 | 84.3 |
| On cholesterol-lowering medicines | 163 | 79.9 |
| Fontaine stage: | ||
| – Fontaine I | 8 | 3.9 |
| – Fontaine IIa | 127 | 62.2 |
| – Fontaine IIb | 63 | 30.8 |
| – Fontaine III | 4 | 1.9 |
| – Fontaine IV | 2 | 0.9 |
| Rest pain | 35 | 17.1 |
| Night pain | 55 | 27 |
| Limitations in ADL | 116 | 56.8 |
| Pain free walking distance < 100 meters | 55 | 27 |
ADL: Activities of daily life; CV: Cardiovascular disease; SD: Standard deviation.
From the instruments received, 75% SF-36 and 94% EQ-5D descriptive parts were completely filled in order to calculate the utility values, whereas 91% EQ VAS instruments were completely filled to obtain the VAS score. Using multiple imputation, utility scores and VAS scores could be obtained for all 204 patients. All results below are based on the imputed datasets. To follow the research questions posed in this article, the results are shown below in the following order: differences between health states descriptions obtained with the EQ-5D and the SF-6D, differences and relation between utility scores obtained with the EQ-5D and the SF-6D and clinical validity of EQ-5D and SF-6D in PAD patients.
Mean utility scores ranged from 0.675 for SF-6D, 0.648 for the EQ-5D UK tariff and 0.715 for the Dutch EQ-5D tariff. The mean EQ VAS score was 66. Detailed descriptive statistics of these values is presented in Table 2.
| Measure | SF-6D | EQ-5D UK | EQ-5D NL | VAS |
|---|---|---|---|---|
| Mean | 0.675 | 0.648 | 0.715 | 66 |
| SD | 0.11 | 0.22 | 0.21 | 19 |
| Median | 0.662 | 0.691 | 0.775 | 70 |
| Minimum | 0.33 | -0.24 | -0.13 | 0 |
| Maximum | 0.91 | 1 | 1 | 99 |
| Percentile: | ||||
| – 25 | 0.601 | 0.620 | 0.651 | 55 |
| – 50 | 0.672 | 0.691 | 0.775 | 70 |
| – 75 | 0.753 | 0.727 | 0.807 | 80 |
EQ-5D: EuroQol 5D; NL: Netherlands; SF-6D: Short-Form Six-Dimension; UK: United Kingdom; VAS: Visual analog score.
Patients’ response distribution across severity levels of the EQ-5D and SF-6D dimensions are shown in the Figure 1A & B.
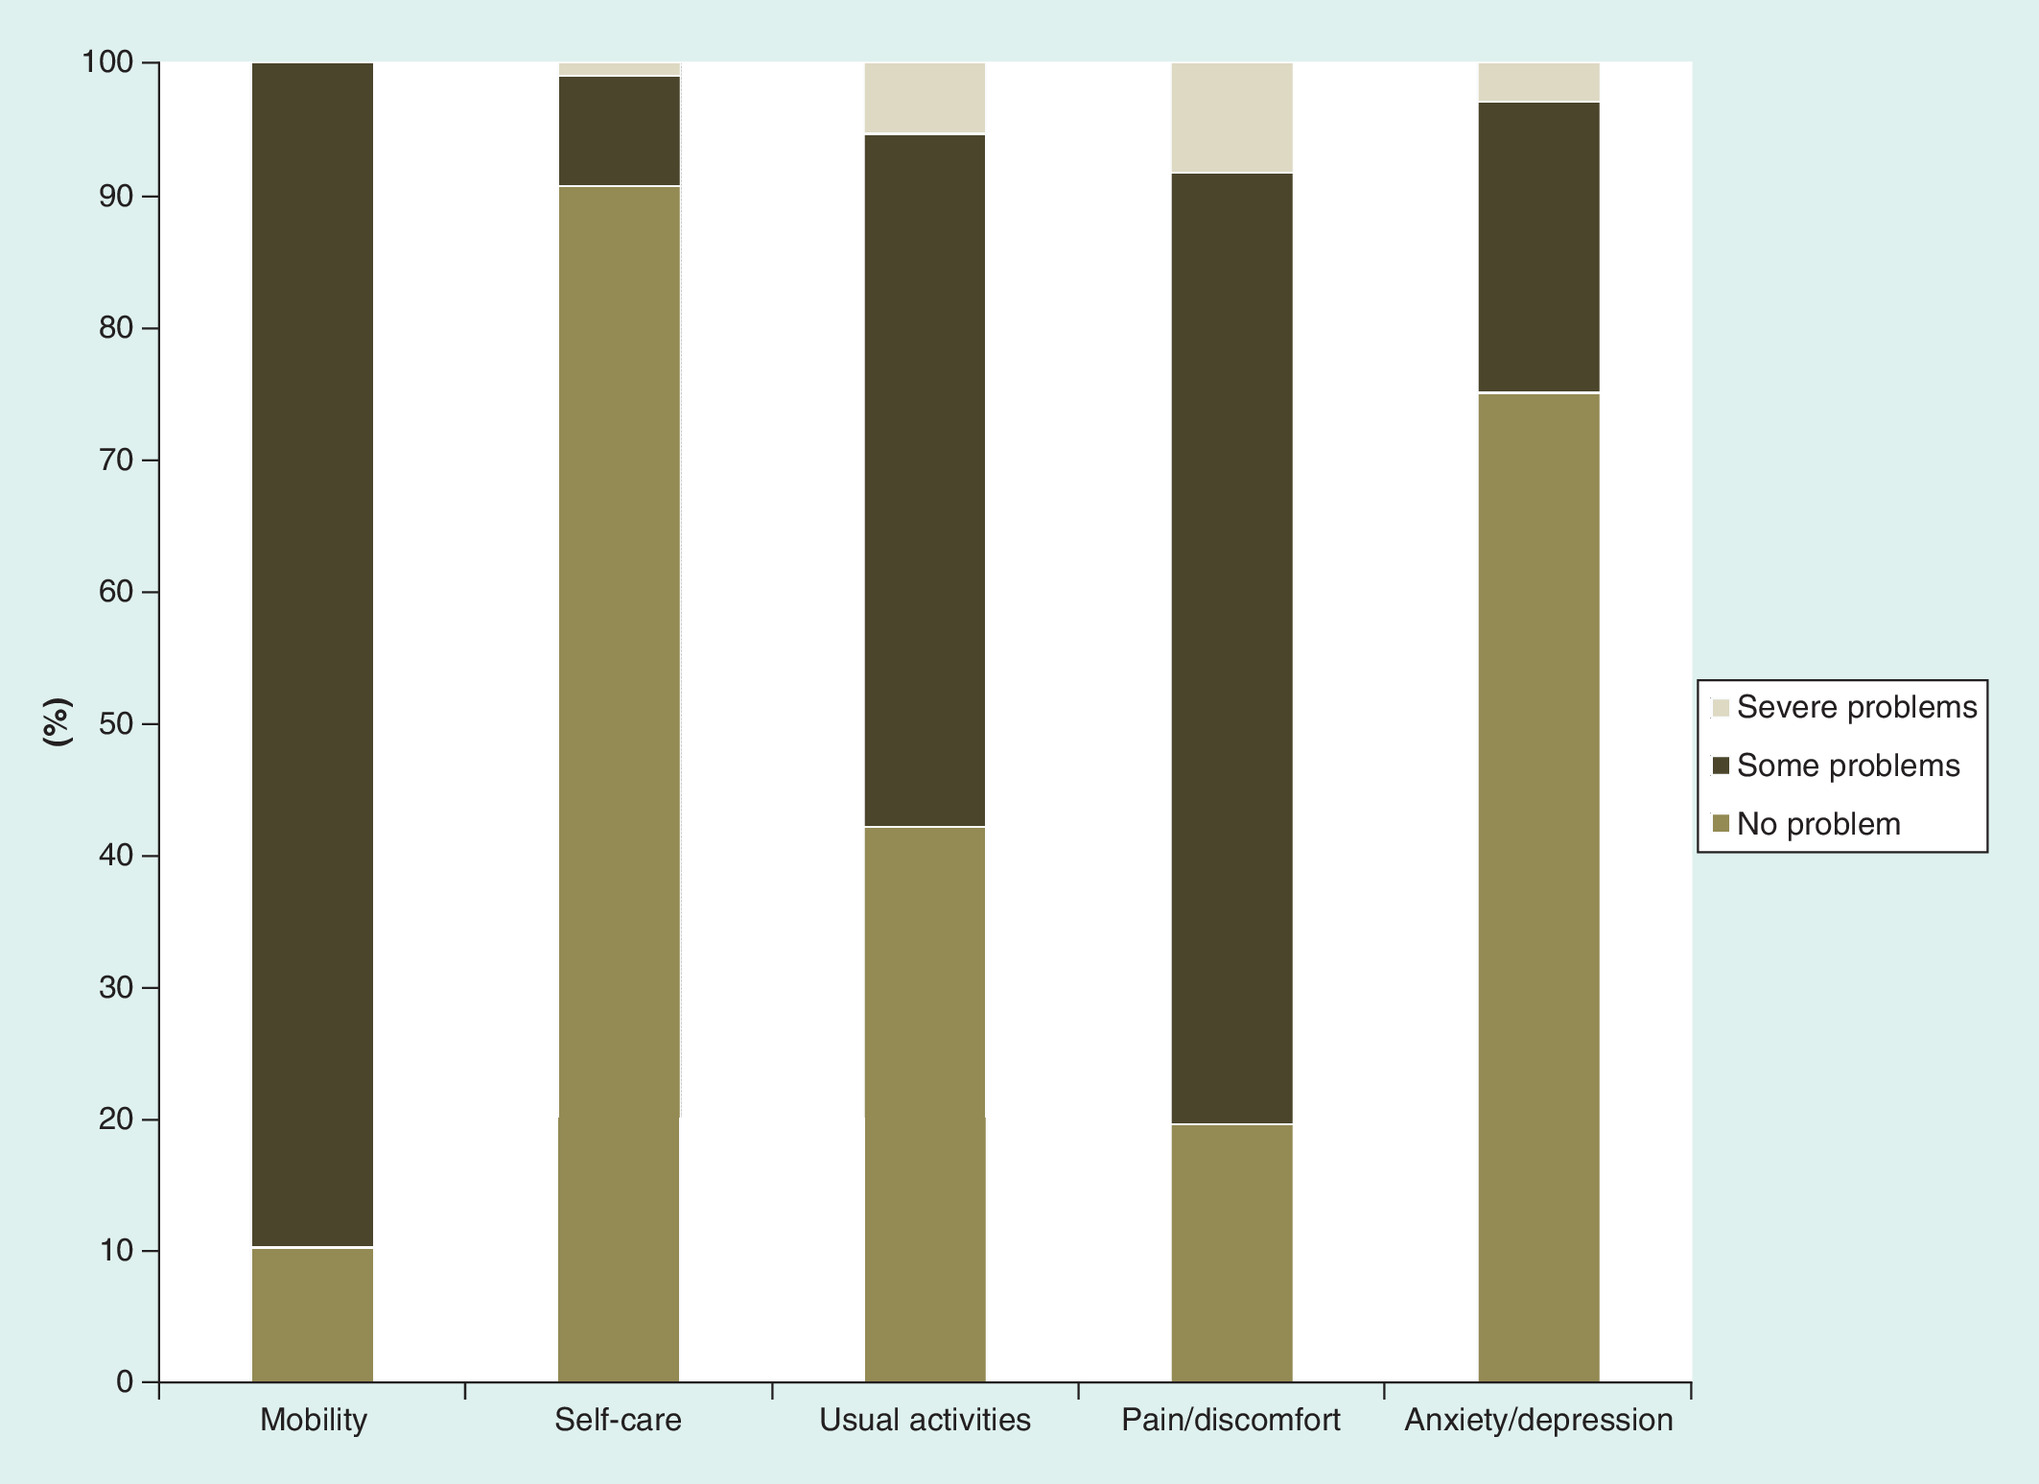
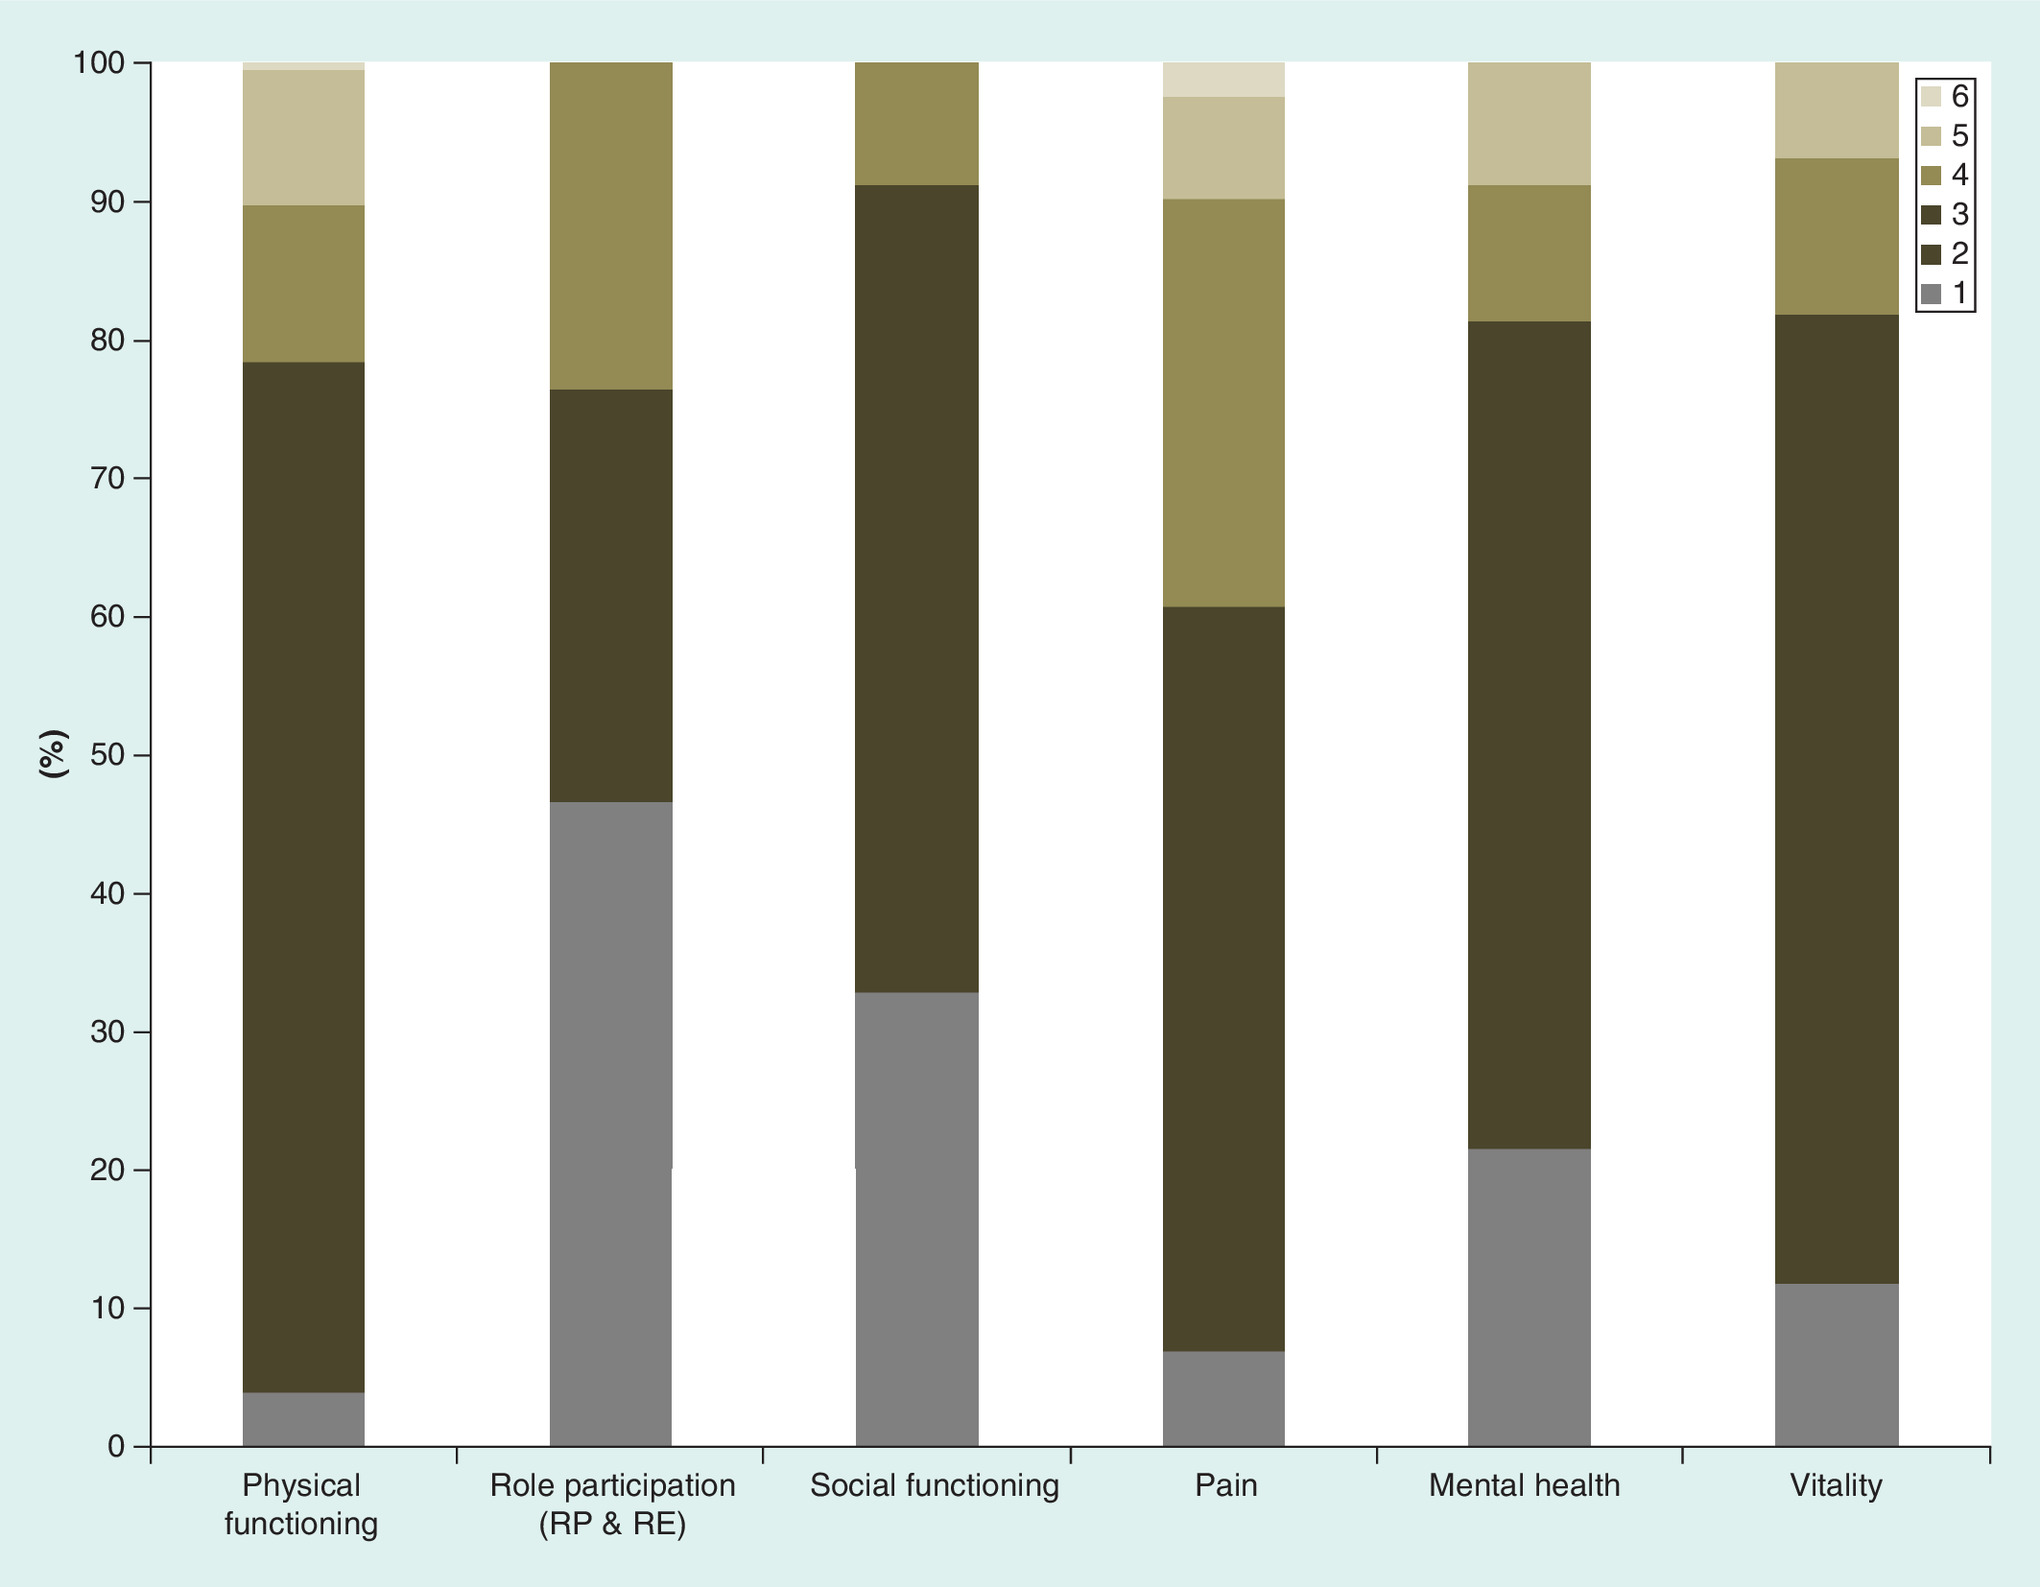
Figure 2. Distribution across severity levels of the SF-6D dimensions graded between 1 and 6; with 1 being the least active and 6 being most severe.
RE: Role emotional; RP: Role phiscal; SF-6D: Short-Form Six-Dimension.

Figure 3. Histogram showing utility frequency distribution across the measuring instruments.
EQ-5D: EuroQol 5D; NL: Netherlands; SF-6D: Short-Form Six-Dimension; UK: United Kingdom; VAS: Visual analog score.
The relationship between the SF-6D, EQ-5D and EQ VAS scores is shown in Figure 4. SF-6D and EQ-5D UK showed the highest level of association. This was confirmed by Spearman coefficient, which was 0.63 for the association between SF-6D and EQ-5D (UK and NL), 0.45 for SF-6D and VAS and 0.44 for EQ-5D and VAS.

Figure 4. Relationship between measuring instruments scores (each dot representing a patient’s utility value across two instruments).
EQ-5D: EuroQol 5D; NL: Netherlands; SF-6D: Short-Form Six-Dimension; UK: United Kingdom.
Agreement between the measures was investigated using Bland–Altman plots [31]. These charts plot the mean of a pair of scores on the x-axis, and the difference between the pair of scores on the y-axis. This allows agreement in terms of the difference between the scores to be assessed across the full severity range, which is done by adding upper and lower boundaries plus or minus two standard deviations (SDs) away from the mean difference in score on the y-axis. Outliers are defined as points outside of these boundaries. Bland–Altman analysis indicated that the 95% limits of agreement between EQ-5D and SF-6D ranged from -0.365 to 0.412, and over 95% points lies within limits with a mean difference in scale scores (SD) of 0.023 (0.019) (Figure 5).

Figure 5. Bland–Altman plot of EQ-5D (UK) and SF-6D (each dot representing an average of EQ-5D, UK and SF-6D and delta for a patient).
EQ-5D: EuroQol 5D; SD: Standard deviation; SF-6D: Short-Form Six-Dimension; UK: United Kingdom.
Mean utility scores were related to symptom, demographic characteristics and clinical classification (Fontaine). These subgroup analyses showed that the impact of PAD could be captured by SF-6D, EQ-5D and VAS (Figure 2). Both utility instruments differentiated between functional and clinical severity levels; the mean utility values from SF-6D, EQ-5D and VAS decreased with increased symptom severity. Utility distribution as per the measuring instrument is shown in Figure 3. Severity of symptoms and increasing difficulty with activities impacted on HRQoL scores. Figure 6A–D shows pain, pain-related functioning and QoL. Pain symptoms and decreased mobility were associated with utility scores getting worse. Older age and female gender were associated with lower HRQoL (Figure 6E–F).
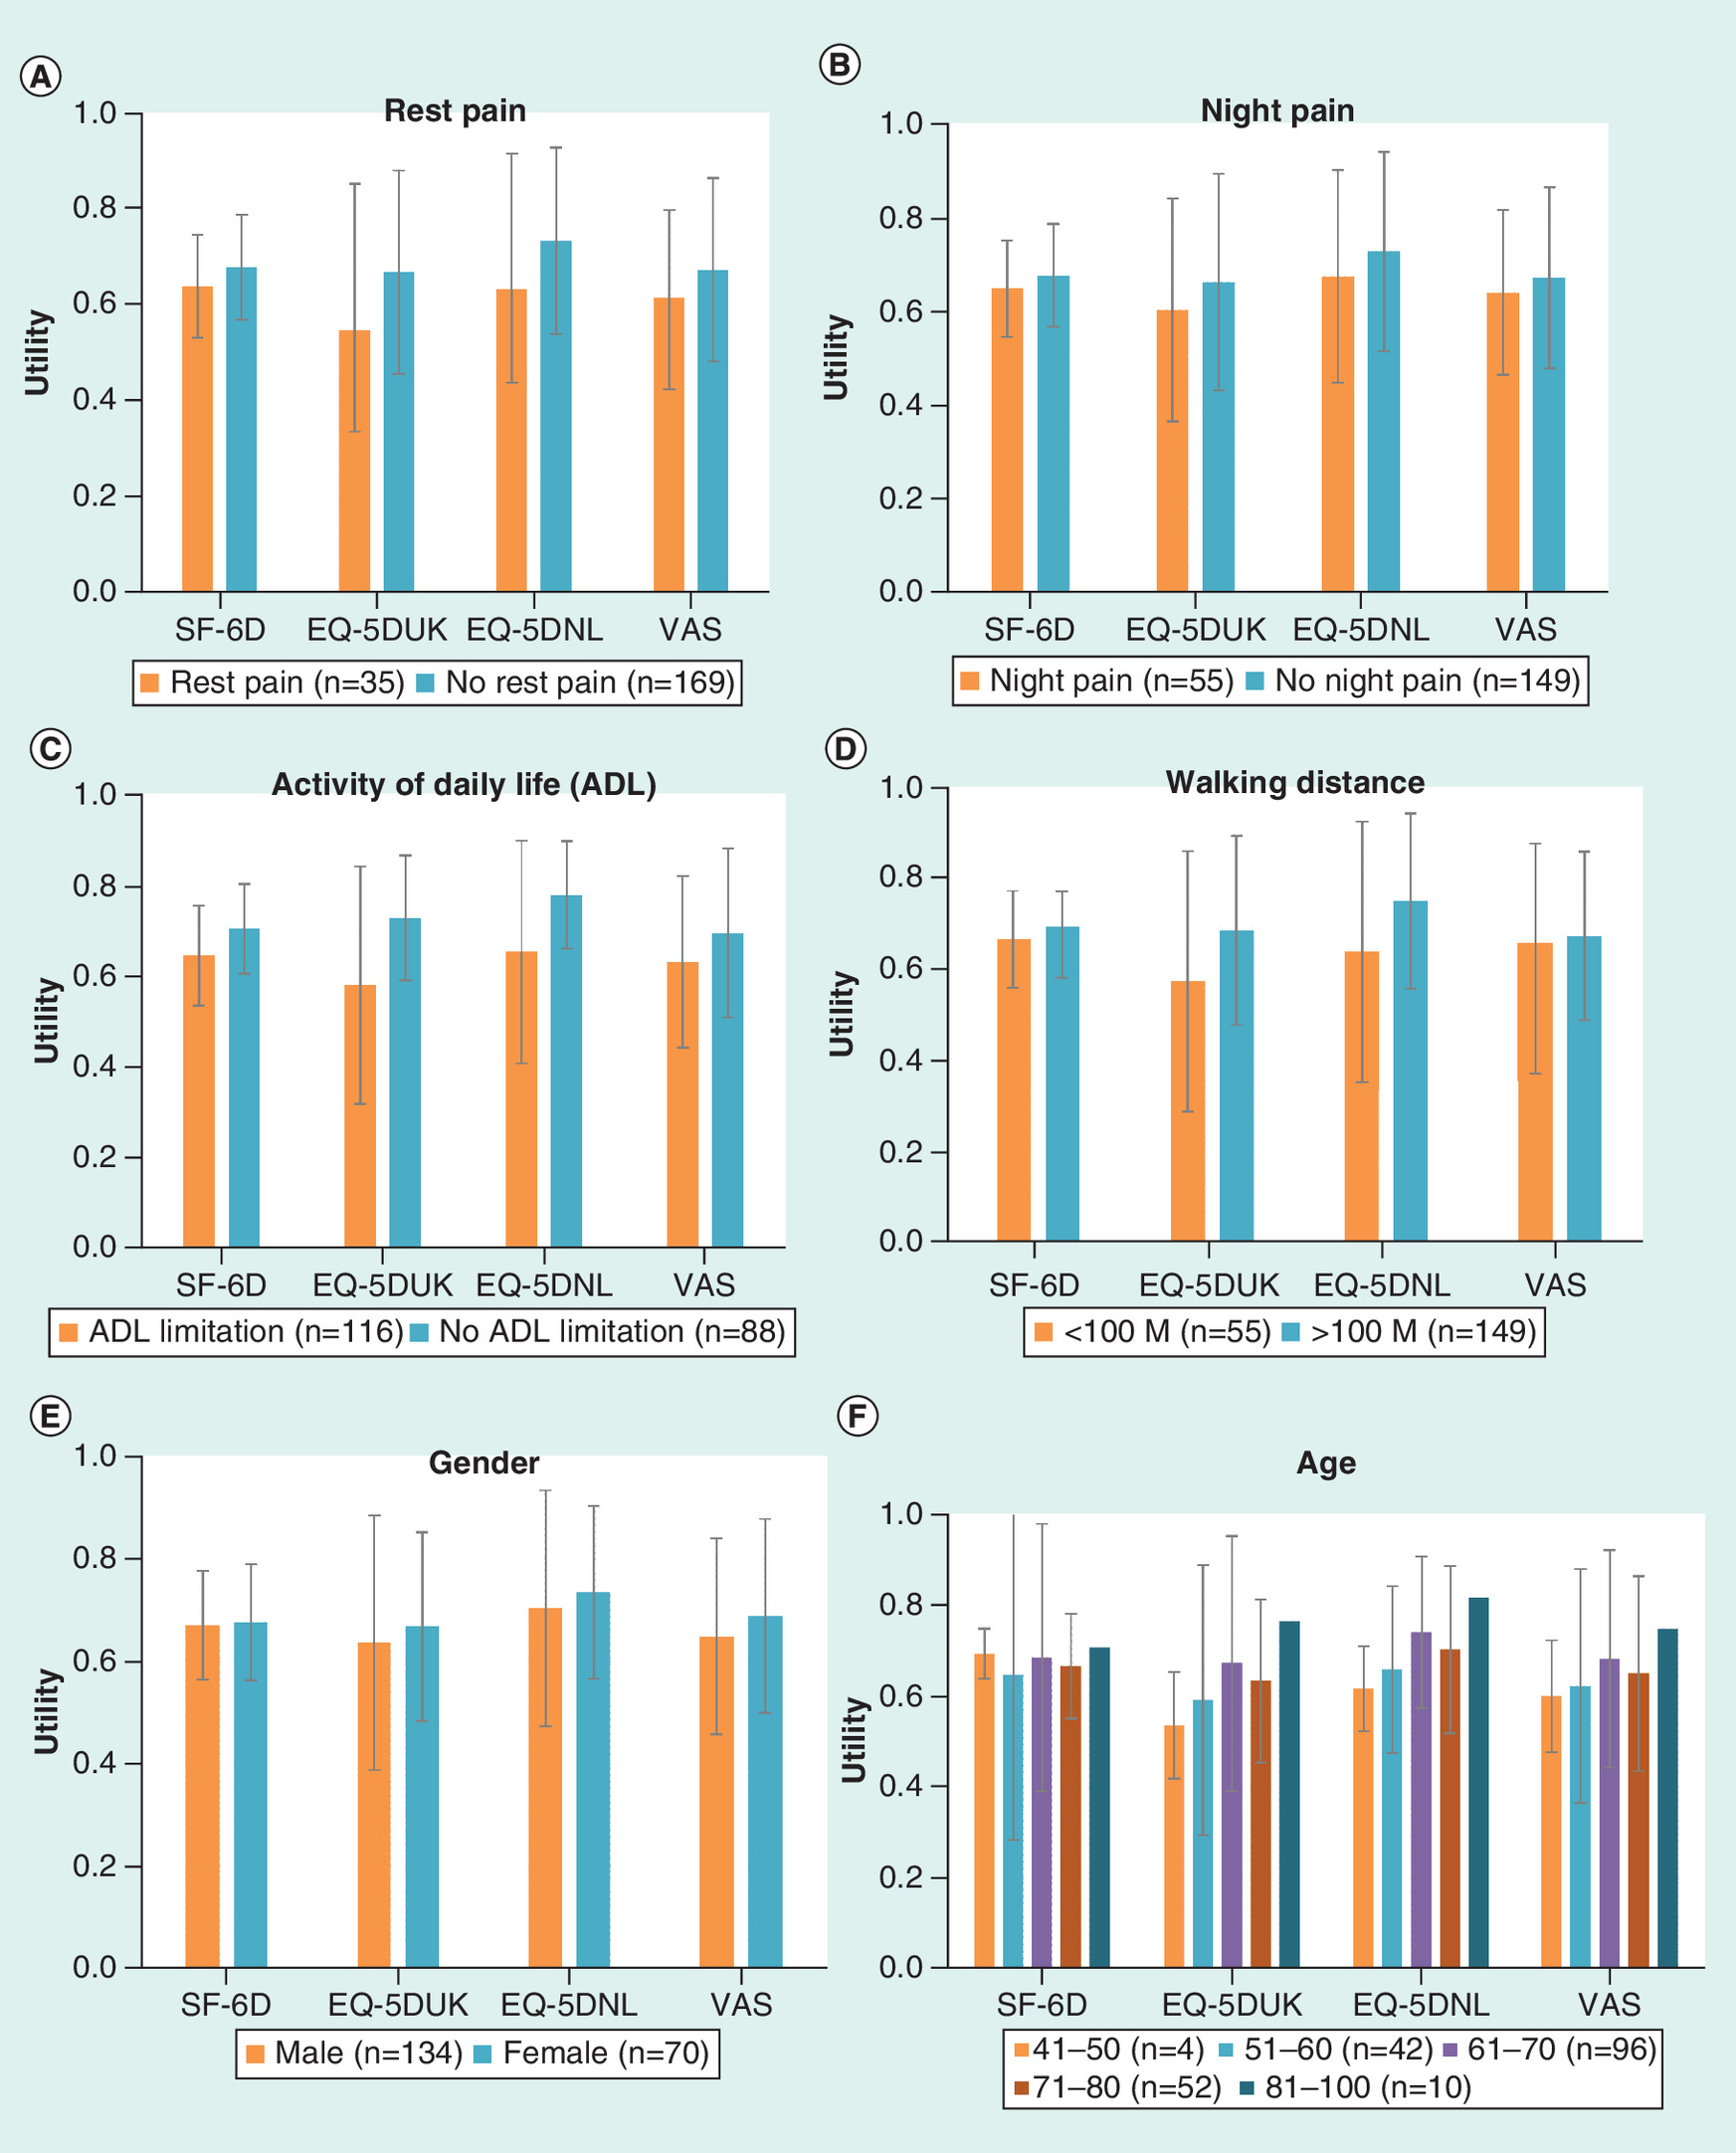
Figure 6. Subgroup analyses based on functional, clinical and demographic characteristics, bars in figure are mean utility values and whiskers are 95% CI.
ADL: Activities of daily life; EQ-5D: EuroQol 5D; NL: Netherlands; SF-6D: Short-Form Six-Dimension; UK: United Kingdom; VAS: Visual analog score.
Discussion
Generic HRQoL instruments currently have an important role in healthcare technology decision making in the Netherlands and in most of the developed world. However, HRQoL utility value measurement methodologies can make a substantial difference to the results of decision analytic modeling and the differences in the methodologies will lead to inconsistent policy decision making. This study assessed the equivalency of the SF-36 and the EQ-5D cross-sectionally, in domain content and in scoring distribution in the PAD patients. In this study, we made a detailed analysis of the relation between HRQoL, assessed with the generic preference-based HRQoL instruments EQ-5D and SF-36, the severity of PAD and objective functional variables. Our results highlighted the negative impact that PAD has on HRQoL, which is consistent with the findings of other studies [16,32]. In our comparative study, we found a moderate correlation between the utility scores obtained from these instruments. The wide 95% limits of agreement in Bland–Altman plot signify this level of agreement between the instruments [12,29]. The moderate agreement between the two instruments, mirroring the widely reported finding that differences exist between the conventional EQ-5D and SF-36 index scores that are based on Time Trade Off and standard gamble techniques, respectively [30].
Although EQ-5D and SF-36 intend to measure similar constructs, these instruments are quite different from each other in the assessment of HRQoL. Our research explored the likely association between the utility values generated by the SF-36 using algorithms developed by Brazier et al. and the utility value that would have been obtained from the EQ-5D. To the best of our knowledge, this is the first comparison of preference-based instruments in PAD population. Other studies have reported health state values derived from these HRQoL instruments [16,32–34]; however, ours included both of these instruments in diagnosed and symptomatic PAD patients. The ability to make reliable comparisons of health state utilities values measured by two most frequently used instruments would be of interest to health economists, researchers working in the field of PAD and decision makers, given the increasing importance of the quality-adjusted life year as the standard metric of outcome in economic evaluation.
Utility scores were calculated and measurement properties were compared for two widely used HRQoL instruments, EQ-5D and SF-6D in PAD patients with complaints of IC. These two instruments show different utility score ranges and distributions. With vitality domain, SF-6D has six domains against five in EQ-5D; however, other domains of both instruments represent similar dimensions of health. The reference time frame used in the descriptive system varies for both the instruments. While answering EQ-5D patients describe their health status at that point of time while SF-6D has information on health status in last 4 weeks. The emphasis of EQ-5D is on physical functioning while social functioning has more weightage in SF-6D. However, the results of this study generally reinforced the construct validity of the EQ-5D and the SF-6D.
In summary, EQ-5D and SF-36 are demonstrated to be valid and sensitive preference-based HRQoL measures in the Dutch PAD patients. Both instruments measure HRQoL in PAD patients but selection of one instrument over other is a difficult task as both instrument address physical limitation in PAD patients. It is important to consider the relative merits of each instrument when choosing measures of QoL as there are advantages and disadvantages to both. EQ-5D is short and easy to complete, and is accepted by NICE for use in the economic evaluation of interventions. The SF-6D is derived from the SF-36 provides detailed information about the HRQL of patient samples. This research and published literature [35,36] has shown the relationship between the EQ-5D and SF-36, suggesting that the measures can be used alongside each other to provide a holistic assessment of the HRQoL.
Keeping in view the limited patient contact time available, collection of HRQoL information imposes an opportunity cost of reduction of time for other information. SF-36 is claimed to be completed in 5–10 min by the developers [37]. However, in elderly PAD patients it may take on average 15 min to administer [38]. On the other hand, EQ-5D could have an administration time less than 5 min with greater chances of completing the instrument [39]. We received a significantly higher number of responses for EQ-5D (94%) than for SF-36 (75%) minimizing the need of imputation for missing data.
SF-6D has been reported to have a theoretical advantage over EQ-5D due to its larger SF-36-based descriptive system. However, SF-6D development team have suggested that future research should assess whether item selection for SF-6D caused limitations to its descriptive ability and indicates that SF-6D may not benefit from the descriptive richness of the original SF-36 [8]. The EQ-5D presents health status as a simple five-dimensional structure. This simplicity is one of its strengths, but would also be a limitation if it were used as a single measure of health status. Profile measures such as the SF-36-derived SF-6D may be better suited than the EQ-5D to capture certain facets of health status. With the use of algorithm developed by Brazier and colleagues, this instrument does provide an overall index score for respondents’ health, which can subsequently be incorporated into QALYs and cost-utility analysis [8]. However, revision of both these instruments is recommended to overcome their weaknesses, particularly in their descriptive systems [33]. Convergent validity of EQ-5D and SF-6D could be measured by correlation but there is no consensus on the interpretation of various levels of correlations for this application. Since each instrument measures somewhat different concepts of health, modest correlation between them is not surprising. None of the instruments excelled uniformly, and the authors concluded that selection of the most suitable instrument for health status assessment should be guided by careful consideration of the special features of every study. In our study, the relationship and agreement between the SF-6D and EQ-5D utilities was not perfect. An observation in this study that the SF-6D scores were generally higher than the EQ-5D was also consistent with published literature and may reflect floor effects associated with SF-36 [30].
The differences in utility measures need further confirmation by future research in patients with different levels of PAD severity and more research is needed to determine the relationship between the SF-36 and EQ-5D.
The EQ-5D-5L was not available at the time of data collection for this research. Due to better measurement properties, with lower ceiling effect and better discriminatory power than the 3L version, it would be prudent to use the 5L version for all future research. Results of this research are not expected to be change much using EQ-5D-5L as the association between overall morbidity and index scores is reported to be comparable using both versions of the EQ-5D [40].
Since QALY (derived from utility score) provide the means to compare different types of interventions for allocation of resources in healthcare systems. The implications of this study are potentially profound. The utilities were higher for SF-6D utilities than for EQ-5D UK utilities. Thus, using SF-6D utilities in cost–effectiveness analyses would result in lower cost–effectiveness ratios than using EQ-5D utilities. It has been demonstrated that the choice of one of these instruments could significantly change the results of economic evaluations [41]. We recommend use of composite endpoint outcome measures, incorporating clinical indicators along with QoL indices for estimation of health benefit gain in these situations. There is also a need of raising awareness among policy makers of these methodological challenges when interpreting economic evaluations.
The comparison of both instruments to inform an important debate on the choice of instrument is strength of this study. This allow us to investigate agreement between instruments without the potential confounding effects of intersubjective variations such as cultural differences in tendencies to report health problems [42]. The present study has some methodological considerations that should be considered in interpreting the results. First, we have used cross-sectional data to assess the difference between instruments. As differences in change scores are likely to have a greater impact on pharmacoeconomic evaluations than changes in absolute scores, longitudinal studies should be conducted to quantify the magnitude of differences in change scores. Second, the study population consists of a convenience sample of patients diagnosed at hospital with PAD. Thus, it remains unknown whether these data are applicable for patients with all other asymptomatic or symptomatic PAD patients. Third, we delivered both instruments to each of our patients in the same order. It is unclear that if random order delivery would influence the results. Fourth, although patients’ responses were collected over almost 5-year period at a tertiary care institution in the Netherlands, authors recognize the impact of relatively smaller sample size and its impact on the generalizability of results. In this case, physical limitation is a prominent feature and was well represented in both instruments, EQ-5D and SF-6D. However, generalizability of the included instruments (EQ-5D and SF-36) to other diseases is unclear where a health dimension is not directly reflected by one of these instruments.
Conclusion
The impact of PAD on HRQoL can be evaluated using generic standardized instruments SF-36 and EQ-5D. The clinical validity of both instruments in the Dutch PAD patient sample was supported by the results of this investigation. Measurements by both instruments behaved in consistent manner. However, EQ-5D and SF-6D measure different aspects of HRQoL. The difference in psychometric properties between them are significant. Before using these two instruments interchangeably for utility score calculations and healthcare resource allocation, a thorough sensitivity analysis is necessary to explore the robustness of the value argument based on these utility scores. Whenever possible, combination of these instruments could provide a broad coverage of health dimensions and QoL scores for a variety of applications.
Peripheral arterial disease (PAD) patients have a significant reduction in health-related quality of life (HRQoL) caused by impaired mobility and by cardiovascular morbidity.
HRQoL assessments using generic instruments provide unique information about the impact of the disease as perceived by the patients and they can be used for evaluating QoL for many types of diseases and for calculating utility values in cost–effectiveness analysis.
This study demonstrated good clinical validity of the two most widely used generic HRQoL instruments, EuroQol 5D and Medical Outcome Study 36-item Short-Form Health Status Survey, with traditional clinical indices of PAD severity.
Both instruments measure HRQoL in PAD patients but selection of one instrument over other is a difficult task as both instrument address physical limitation in PAD patients as a moderate correlation between the utility scores obtained from these instruments was found.
Before using these two instruments interchangeably for quality-adjusted life year calculations and for healthcare resource allocation, a thorough sensitivity analysis is necessary to explore the robustness of the value argument based on these utility scores. Combining the two instruments would provide a broad holistic coverage of health dimensions for a variety of applications.
Acknowledgements
The authors would like to acknowledge the generous contributions of the PAD surgeons who offered their insights and support as part of this project. In particular, we would like to thank: RJTJ Welten and CJJM Sikkink from Atrium-Orbis Medical Centre, Heerlen, the Netherlands and JWHC Daemen from Maastricht University Medical Centre, Maastricht, the Netherlands.
Financial & competing interests disclosure
This research was performed within the framework of CTMM, the Centre for Translational Molecular Medicine (www.ctmm.nl), project INCOAG (Innovative Coagulation Diagnostics) and supported by the Dutch Heart Foundation. The authors have no other relevant affiliations or financial involvement with any organization or entity with a financial interest in or financial conflict with the subject matter or materials discussed in the manuscript apart from those disclosed.
No writing assistance was utilized in the production of this manuscript.
Ethical conduct of research
The authors state that they have obtained appropriate institutional review board approval or have followed the principles outlined in the Declaration of Helsinki for all human or animal experimental investigations. In addition, for investigations involving human subjects, informed consent has been obtained from the participants involved.
References
1.
Hirsch AT, Criqui MH, Treat-Jacobson D et al. Peripheral arterial disease detection, awareness, and treatment in primary care. JAMA 286(11), 1317–1324 (2001).
2.
McDermott MM, Liu K, Greenland P et al. Functional decline in peripheral arterial disease: associations with the ankle brachial index and leg symptoms. JAMA 292(4), 453–461 (2004).
3.
Belch JJ, Topol EJ, Agnelli G et al. Critical issues in peripheral arterial disease detection and management: a call to action. Arch. Intern. Med. 163(8), 884–892 (2003).
4.
NICE. Guide to the methods of technology appraisal. National Institute for Health and Clinical Excellence, London, UK, 1–93 (2013).
5.
Whitehead SJ, Ali S. Health outcomes in economic evaluation: the QALY and utilities. Brit. Med. Bull. 96(1), 5–21 (2010).
6.
Drummond MF, Sculpher M, Torrance GW, O’Brien B, Stoddart GL. Methods for the Economic Evaluation of Health Care Programmes. Oxford University Press, NY, USA (2005).
7.
College voor zorgverzekeringen D, the Netherlands. Guidelines for pharmacoeconomic research, updated version (2006). www.ispor.org/peguidelines/source/HTAGuidelinesNLupdated2006.pdf
8.
Brazier J, Roberts J, Deverill M. The estimation of a preference-based measure of health from the SF-36. J. Health Econ. 21(2), 271–292 (2002).
9.
Brooks R. EuroQol: the current state of play. Health Pol. 37(1), 53–72 (1996).
10.
Whitehurst DGT, Bryan S, Lewis M. Systematic review and empirical comparison of contemporaneous EQ-5D and SF-6D group mean scores. Med. Decis. Making 31(6), E34–E44 (2011).
11.
Joore M, Brunenberg D, Nelemans P et al. The impact of differences in EQ-5D and SF-6D utility scores on the acceptability of cost-utility ratios: results across five trial-based cost-utility studies. Value Health 13(2), 222–229 (2010).
12.
Mazari FAK, Carradice D, Rahman MNAA et al. An analysis of relationship between quality of life indices and clinical improvement following intervention in patients with intermittent claudication due to femoropopliteal disease. J. Vasc. Surg. 52(1), 77–84 (2010).
13.
Mehta T, Venkata Subramaniam A, Chetter I, McCollum P. Assessing the validity and responsiveness of disease-specific quality of life instruments in intermittent claudication. Eur. J. Vasc. Endovasc. Surg. 31(1), 46–52 (2006).
14.
Hicken GJ, Lossing AG, Ameli FM. Assessment of generic health-related quality of life in patients with intermittent claudication. Eur. J. Vasc. Endovasc. Surg. 20(4), 336–341 (2000).
15.
Nicolaï SPA, Teijink JAW, Prins MH. Multicenter randomized clinical trial of supervised exercise therapy with or without feedback versus walking advice for intermittent claudication. J. Vasc. Surg. 52(2), 348–355 (2010).
16.
Regensteiner JG, Hiatt WR, Coll JR et al. The impact of peripheral arterial disease on health-related quality of life in the Peripheral Arterial Disease Awareness, Risk, and Treatment: New Resources for Survival (PARTNERS) program. Vasc. Med. 13(1), 15–24 (2008).
17.
Dumville JC, Lee AJ, Smith FB, Fowkes FGR. The health-related quality of life of people with peripheral arterial disease in the community: the Edinburgh artery study. Br. J. Gen. Pract. 54(508), 826–831 (2004).
18.
Maksimovic M, Vlajinac H, Marinkovic J, Kocev N, Voskresenski T, Radak D. Health-related quality of life among patients with peripheral arterial disease. Angiology 65(6), 501–506 (2013).
19.
Tangelder MJ, McDonnel J, Van Busschbach JJ et al. Quality of life after infrainguinal bypass grafting surgery. Dutch Bypass Oral Anticoagulants or Aspirin (BOA) study group. J. Vasc. Surg. 29(5), 913–919 (1999).
20.
Klein WM, van der Graaf Y, Seegers J et al. Dutch iliac stent trial: long-term results in patients randomized for primary or selective stent placement. Radiology 238(2), 734–744 (2006).
21.
Gardner AW, Afaq A. Management of lower extremity peripheral arterial disease. J. Cardiopulm. Rehabil. Prev. 28(6), 349–357 (2008).
22.
Dolan P. Modeling valuations for EuroQol health states. Med. Care 35(11), 1095–1108 (1997).
23.
Dolan P, Roberts J. Modelling valuations for EQ-5D health states: an alternative model using differences in valuations. Med. Care 40(5), 442–446 (2002).
24.
Rabin R, de Charro F. EQ-5D: a measure of health status from the EuroQol group. Ann. Med. 33(5), 337–343 (2001).
25.
Ware JE Jr, Sherbourne CD. The MOS 36-item short-form health survey (SF-36). I. Conceptual framework and item selection. Med. Care 30(6), 473–483 (1992).
26.
Aaronson NK, Muller M, Cohen PD et al. Translation, validation, and norming of the Dutch language version of the SF-36 health survey in community and chronic disease populations. J. Clin. Epidemiol. 51(11), 1055–1068 (1998).
27.
Fielding S, Fayers P, Ramsay C. Predicting missing quality of life data that were later recovered: an empirical comparison of approaches. Clin. Trials 7(4), 333–342 (2010).
28.
Sterne JA, White IR, Carlin JB et al. Multiple imputation for missing data in epidemiological and clinical research: potential and pitfalls. BMJ 338, b2393 (2009).
29.
Allison PD. Missing Data. SAGE (2001). https://pdfs.semanticscholar.org/58de/eac621923189c28cae06066652c218e126e4.pdf
30.
Brazier J, Roberts J, Tsuchiya A, Busschbach J. A comparison of the EQ-5D and SF-6D across seven patient groups. Health Econ. 13(9), 873–884 (2004).
31.
Bland JM, Altman DG. Statistical methods for assessing agreement between two methods of clinical measurement. Lancet 1(8476), 307–310 (1986).
32.
Liles DR, Kallen MA, Petersen LA, Bush RL. Quality of life and peripheral arterial disease. J. Surg. Res. 136(2), 294–301 (2006).
33.
Aquarius AE, Denollet J, Hamming JF, Van Berge Henegouwen DP, De Vries J. Type-D personality and ankle brachial index as predictors of impaired quality of life and depressive symptoms in peripheral arterial disease. Arch. Surg. 142(7), 662–667 (2007).
34.
Issa SM, Hoeks SE, Scholte op Reimer WJ et al. Health-related quality of life predicts long-term survival in patients with peripheral artery disease. Vasc. Med. 15(3), 163–169 (2010).
35.
Myers C, Wilks D. Comparison of EuroQol EQ-5D and SF-36 in patients with chronic fatigue syndrome. Qual. Life Res. 8(1), 9–16 (1999).
36.
Chen J, Wong CK, McGhee SM, Pang PK, Yu WC. A comparison between the EQ-5D and the SF-6D in patients with chronic obstructive pulmonary disease (COPD). PLoS ONE 9(11), e112389 (2014).
37.
Ware JE, Snow KK, Kosinski M, Gandek B. Institute NEMCHH. SF-36 Health Survey: Manual and Interpretation Guide. The Health Institute, New England Medical Center, MA, USA (1993).
38.
Weinberger M, Samsa GP, Hanlon JT et al. An evaluation of a brief health status measure in elderly veterans. J. Am. Geriatr. Soc. 39(7), 691–694 (1991).
39.
Gerard K, Nicholson T, Mullee M, Mehta R, Roderick P. EQ-5D versus SF-6D in an older, chronically ill patient group. Appl. Health Econ. Health Pol. 3(2), 91–102 (2004).
40.
Agborsangaya CB, Lahtinen M, Cooke T, Johnson JA. Comparing the EQ-5D 3L and 5L: measurement properties and association with chronic conditions and multimorbidity in the general population. Health Qual. Life Outcomes 12(1), 74 (2014).
41.
Sach TH, Barton GR, Jenkinson C, Doherty M, Avery AJ, Muir KR. Comparing cost-utility estimates: does the choice of EQ-5D or SF-6D matter? Med. Care 47(8), 889–894 (2009).
42.
Kopec JA, Williams JI, To T, Austin PC. Cross-cultural comparisons of health status in Canada using the Health Utilities Index. Ethn. Health 6(1), 41–50 (2001).
Information & Authors
Information
Published In
Copyright
© 2018 Future Medicine Ltd.
History
Received: 25 April 2017
Accepted: 9 January 2018
Published online: 1 June 2018
Keywords:
Topics
Authors
Metrics & Citations
Metrics
Article Usage
Article usage data only available from February 2023. Historical article usage data, showing the number of article downloads, is available upon request.
Citations
How to Cite
Comparison of EQ-5D and SF-36 in untreated patients with symptoms of intermittent claudication. (2018) Journal of Comparative Effectiveness Research. DOI: 10.2217/cer-2017-0029
Export citation
Select the citation format you wish to export for this article or chapter.
Citing Literature
- Areerut Leelathanalerk, Nuttakunlaya Piankarnka, Pornchanok Srimongkon, Suratchada Chanasopon, Panumart Phumart, Pawich Paktipat, Kritsanee Saramunee, Wiraphol Phimarn, Quality of life and utility of patients with peripheral artery disease (PAD): a systematic review and meta-analysis, Scientific Reports, 10.1038/s41598-024-80387-1, 14, 1, (2024).
- Emma Alicia MacLean, Ethan Joel Fogarty, Benjamin James Peterson, Shirley Xu, Nicholas Blair Giacomantonio, Peripheral Arterial Disease in Nova Scotia: Increased Prevalence, Low Public Awareness, and Poor Edinburgh Claudication Questionnaire Sensitivity, CJC Open, 10.1016/j.cjco.2024.07.003, 6, 10, (1210-1219), (2024).
- Jacquelyn B. Kercheval, Dennis I. Narcisse, Maggie Nguyen, Sunil V. Rao, J. Antonio Gutierrez, Nicholas J. Leeper, David J. Maron, Fatima Rodriguez, Adrian F. Hernandez, Kenneth W. Mahaffey, Svati H. Shah, Rajesh V. Swaminathan, Characterization of peripheral artery disease and associations with traditional risk factors, mobility, and biomarkers in the project baseline health study, American Heart Journal, 10.1016/j.ahj.2024.06.010, 275, (183-190), (2024).
- Raza Alikhan, May Nour, Masahiro Yasaka, Richard Ofori-Asenso, Stina Axelsson-Chéramy, Hungta Chen, Vinay Seghal, Shoji Yokobori, Bruce Koch, Andreas Tiede, Brooks D. Cash, Marc Maegele, Adam J. Singer, Design and rationale for REVERXaL: A real-world study of patients with factor Xa inhibitor–associated major bleeds, Thrombosis Research, 10.1016/j.thromres.2024.109046, 240, (109046), (2024).
- Emilien C.J. Wegerif, Çağdaş Ünlü, Manon I. Generaal, Rutger M. van den Bor, Peter M. van de Ven, Michiel L. Bots, Gert J. de Borst, Rationale and design for the randomized placebo-controlled double-blind trial studying the effect of single antiplatelet therapy (clopidogrel) versus dual antiplatelet therapy (clopidogrel/acetylsalicylic acid) on the occurrence of atherothrombotic events following lower extremity peripheral transluminal angioplasty (CLEAR-PATH), American Heart Journal, 10.1016/j.ahj.2024.04.001, 273, (121-129), (2024).
- Oleh Yakovenko, Serhii Soloviov, Mykhailo Smetiukh, Oleksandr Khanin, Eduard Khodosh, Yaroslav Dziublyk, Nataliia Surtaieva, Development and Approval of a Multidimensional Model of the Clinical Effectiveness of Treatment Technologies for Patients With a Mild COVID-19 Associated With Comorbidities, Innovative Biosystems and Bioengineering, 10.20535/ibb.2024.8.1.299055, 8, 1, (19-36), (2024).
- Bruce Guthrie, Gabriel Rogers, Shona Livingstone, Daniel R Morales, Peter Donnan, Sarah Davis, Ji Hee Youn, Rob Hainsworth, Alexander Thompson, Katherine Payne, The implications of competing risks and direct treatment disutility in cardiovascular disease and osteoporotic fracture: risk prediction and cost effectiveness analysis, Health and Social Care Delivery Research, 10.3310/KLTR7714, (1-275), (2024).
- Rob Hainsworth, Alexander J. Thompson, Bruce Guthrie, Katherine Payne, Gabriel Rogers, International Systematic Review of Utility Values Associated with Cardiovascular Disease and Reflections on Selecting Evidence for a UK Decision-Analytic Model, Medical Decision Making, 10.1177/0272989X231214782, 44, 2, (217-234), (2024).
- R. Trybulski, G. Biolik, W. Kuczmik, N. Ivasyk, O. Tyravska, Application of deep oscillation therapy in the treatment of peripheral arterial diseases, Medicni perspektivi, 10.26641/2307-0404.2023.3.289207, 28, 3, (116-127), (2023).
- Vojtěch Kamenský, Vladimír Rogalewicz, Ondřej Gajdoš, Gleb Donin, Discrete Event Simulation Model for Cost-Effectiveness Evaluation of Screening for Asymptomatic Patients with Lower Extremity Arterial Disease, International Journal of Environmental Research and Public Health, 10.3390/ijerph191811792, 19, 18, (11792), (2022).