A new modeling approach allowing prediction and comparison of the long-term outcomes of treatments for hemophilia B
Abstract
Aim: To develop a modeling approach to compare clinical outcomes of nonacog beta pegol to a standard-acting factor IX (FIX) product. Methods: Regression analysis linked FIX activity to bleed rates. Pharmacokinetic parameters were used to estimate FIX activity over time. The probability of bleeds was estimated for both treatment arms. A Markov model estimated the presence of target joints and annualized bleed rates (ABRs). Results: Higher FIX activity showed reduced ABRs (p < 0.001). Target joints resulted in higher bleed rates (p < 0.001). When FIX activity levels and bleed risks were applied to the Markov model, ABRs for nonacog beta pegol and its comparator were 2.40 and 6.36, respectively. Conclusion: This model provides a starting point for assessing the added value of new FIX products.
First draft submitted: 14 April 2016; Accepted for publication: 12 May 2017; Published online: 31 May 2017
Treatment of hemophilia B requires factor replacement therapy with factor IX (FIX) containing concentrates to supplement FIX activity levels, which are reduced in hemophilia B patients. FIX can be administered prophylactically or for treatment of bleeding episodes, depending on individual patient’s needs and/or product availability. In addition, FIX is used during and after surgery in hemophilia patients [1,2]. Until recently, treatment options have been limited to FIX products with similar pharmacokinetic (PK) characteristics. Because these products are similar, assessing the differences in efficacy and cost–effectiveness between them has not been necessary. Furthermore, current hemophilia treatment guidelines do not recommend certain products over others [2–6].
Recently, a wider range of products have become available for the treatment of hemophilia B [7]. These products, especially those with extended half-lives (EHLs), may provide additional value in the treatment of hemophilia B [8–10]. The newly available products with EHL have the potential to decrease the frequency of prophylaxis (PPx) dosing while simultaneously maintaining patients at higher FIX activity levels between doses. This is an important improvement in the treatment of hemophilia B, which is supported by guidance issued by the EMA, stating that appropriate PK data are the most important surrogate end points for the assessment of efficacy of new FIX products. The same guidelines dictate that treatment should aim to maintain high levels of FIX activity. FIX activity levels are directly correlated to percentages of factor level; for example, 1 IU/dl represents 1% and 5 IU/dl represents 5% [1]. FIX activity levels <1 IU/dl are classified as severe hemophilia B; levels of 1–5 IU/dl represent moderate hemophilia B; levels of 5–40 IU/dl represent mild hemophilia B; and levels over 40 IU/dl are seen as normal FIX activity levels [1].
In current developed markets, where products are now available with different properties and thus different expected efficacies, payers may request an assessment of the differences between the alternatives available. However, due to the variability in patient responses and no previous requirement for comparative data in guideline development, these different products have not been compared directly in head-to-head trials. Indeed, to our knowledge, no direct or indirect comparison of the efficacy and long-term outcomes of different FIX products has previously been performed.
Given the lack of comparative evidence, mathematical modeling may be useful for comparing different FIX products. A link between FVIII activity levels and bleed risk has been suggested in patients with mild-to-moderate hemophilia A treated on demand [11–13]. If such a link also exists in hemophilia B, it may be used to predict the efficacy of different products, based on estimating the risk of bleeding at different FIX activities between doses. This risk can be estimated using dosing schedules and PK parameters. This link has previously been hypothesized in hemophilia B but has not yet been established [14]. However, outcomes for the EHL product nonacog beta pegol (N9-GP) indicate such a relationship (Table 1) [8].
Our objective was to develop a method for comparing the relative efficacy of different FIX products to form the basis for a model that meets payers’ demands for comparative evidence. This article describes the developed method, using an example comparing N9-GP (a FIX product with EHL) to a standard-acting FIX product.
Methods
To predict long-term health outcomes of hemophilia B patients via an indirect treatment comparison, three levels of modeling were undertaken: first, pharmacodynamic modeling to estimate the link between FIX activity and bleeding frequencies; second, PK modeling to predict FIX activity levels in patients with regular PPx treatment; and third, Markov modeling to estimate the impact of the above on the cumulative number of bleeds and joint status over time.
Correlating FIX activity levels to bleeding risk for N9-GP
Patient levels of FIX activity over the 1-year time course of Paradigm™2 (the pivotal trial of the Paradigm N9-GP clinical trial program) were not measured continuously but were predicted from patients’ dosing diary records, using published PK parameters observed from single doses in the trial [15]. These profiles of predicted FIX activity over time were superimposed upon the bleeding episode records in the same diaries, thus establishing a correlation between annualized bleed rates and FIX activity levels. No patient-level data for the comparator treatment were used, as these were not available to the authors.
A regression analysis was done using a negative binomial model. Poisson and negative binomial distribution models are the most widely used in the analysis of count data, such as bleeding episodes [16]. However, when the duration of observation is relatively short versus the frequency of events, count data become right-skewed (the mean number of events is typically greater than the median) with a large proportion of zeros, which is relevant to the bleeding data presented here [11]. Thus, the Poisson distribution assumption that the mean and variance of the data are approximately equal is violated, and it is deemed appropriate to account for overdispersed data by employing a negative binomial regression, which was done in this analysis. The negative binomial model structure has previously been used in hemophilia trials for annualizing bleed data [11].
Negative binomial regression models were fit to assess the number of total, joint, spontaneous and traumatic bleeding episodes within FIX activity level categories, adjusted for age and whether patients had target joints (TJs). The FIX activity level categories were chosen based on clinical guidance (>50 IU/dl [normal], 20–50 IU/dl [mild to normal], 10–20 IU/dl [mild], 5–10 IU/dl [mild], 1–5 IU/dl [moderate] and ≤1 IU/dl [severe], representing compromises between clinical traditions and the FIX activity levels most frequently present within our data). Since each patient has multiple records, a random effect for patient ID was used in the model to account for the correlation between observations within a given patient. The fitted regression models based on Paradigm2 patient level data were applied to both arms of the Markov model.
Simulating different PPx regimens
Published PK parameters for N9-GP and for standard-acting FIX products were used to predict FIX levels over time profiles for patients treated with the respective FIX products for the purpose of predicting their bleed rates (Table 2) [15,17]. For simplicity and comparability, it was assumed that both products followed a one-compartmental PK profile. Continuous treatment with a once weekly dose of 40 IU/kg was assumed for patients treated with N9-GP, and a dose of 40 IU/kg every 3.5 days was assumed for patients treated with the comparator treatment [15,18].
From these predicted FIX activity levels, the amount of time spent in each of the six categories of FIX activity levels over the course of a day was estimated. With that, the probability of experiencing a bleed was calculated using the regression analyses discussed above for total, joint, traumatic and spontaneous bleeds, from which the predicted annualized bleed rate could be calculated; see the Supplementary Information for an example calculation of the daily probability of experiencing a bleed.
Correlating bleed rates to TJ status for N9-GP
Curves were fit to estimate the correlation between the probabilities of changes in joint status in Paradigm2, as presented in Table 3, and the predicted joint bleed rates, to model the probability of developing new TJs or joints, no longer being considered TJs for both patients treated with N9-GP and the standard-acting FIX product.
Markov modeling
To predict the long-term outcomes of patients with hemophilia B treated prophylactically with N9-GP compared with a standard-acting FIX product, a Markov model structure was developed that tracked a simulated cohort of patients over time (Figure 1). Disease progression was modeled using the presence of and change in the number of TJs. The Markov model input values are provided in Table 4. A Markov cycle length of 1 month was adopted in which patients can move between the different health states. 1-year and 5-year time horizons of the model were explored.
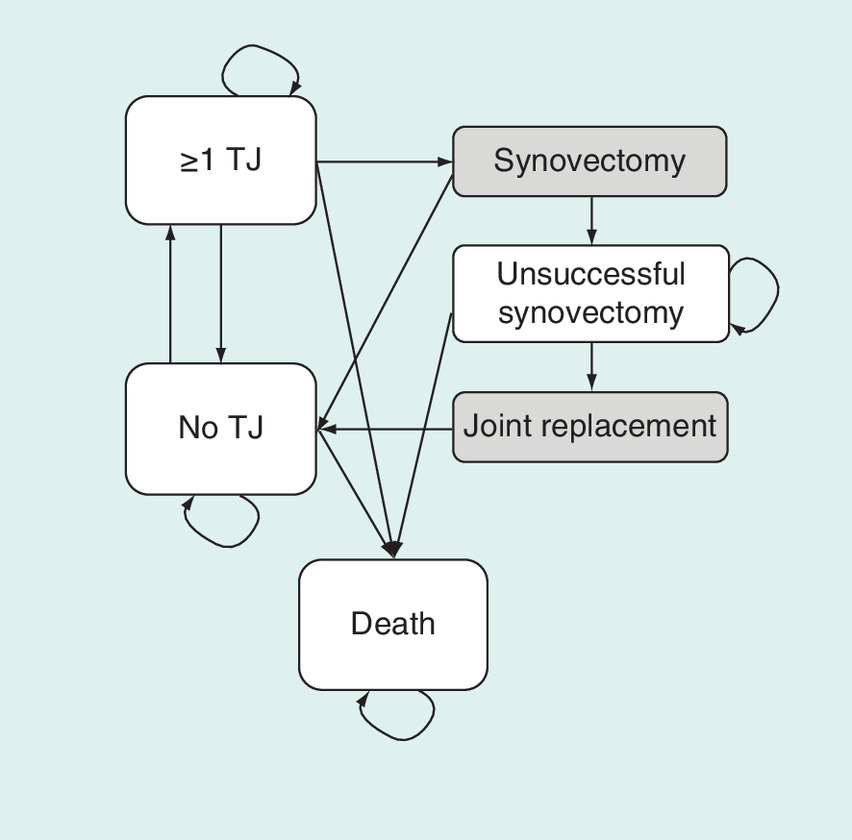
Figure 1. Markov model structure.
TJ: Target joint.
Transitioning between the health state of no TJs and one or more TJs is partly based upon a natural increase and decrease in TJs, and partly upon resolving TJs through surgery. Multiple definitions exist for TJs as well as for the case when a joint is no longer considered a TJ [2,8,22–25]. The definition of a new TJ used in this analysis is three or more bleeds in the same joint within 6 months [2,8]; a joint is no longer considered a TJ if no bleeds have occurred into the joint over a 12-month period [8]. The resolution and development of TJs in the comparator arm were based on an assumption that the number of TJs correlates with the number of joint bleeds (Figure 2 & Table 4). The probabilities of resolving or developing TJs are equal in subsequent years, as only data for 1 year were available.

Figure 2. Probability of change in target joint status by annualized joint bleed rate.
ABR: Annualized bleed rate; TJ: Target joint.
Patients with at least one TJ are considered at risk of undergoing a synovectomy to treat their TJ [21]. If the synovectomy is successful, the patient moves to the ‘no TJ’ health state. If the synovectomy is unsuccessful, the patient moves into the ‘unsuccessful synovectomy’ health state, where they are at risk of joint replacement surgery. After joint replacement surgery, the patients move to the ‘no TJ’ health state. Probabilities used in the model are presented in Table 4.
Results
Associating FIX activity levels & other prognostic factors with bleeding risk for N9-GP
For those patients for whom FIX activity levels were measured in Paradigm2, there was a strong positive correlation (r = 0.88; p < 0.001) between the observed and calculated FIX activity levels (Supplementary Figure A).
The regression analyses linking FIX activity levels to bleed rates show that FIX activity has a statistically significant impact on the rate of bleeding episodes (at a 5% significance level for all FIX activity level categories) compared with FIX activity levels >50 IU/dl, and that patients with at least one TJ have a significantly higher rate of bleeding episodes compared with patients who have none. Age has no statistically significant effect (p = 0.657) on the rate of bleeding episodes. Detailed results of these analyses are presented in Supplementary Table A.
Simulating different PPx regimens: FIX activity levels over time
Calculated FIX activity levels based on published PK information show higher FIX activity levels over time for patients treated with N9-GP 40 IU/kg once weekly compared with 40 IU/kg twice weekly for the standard-acting FIX product (Figure 3). Modeled peak FIX activity levels are 92.6 and 19.6 IU/dl, respectively, and modeled trough levels are 31.8 and 1.5 IU/dl, respectively.
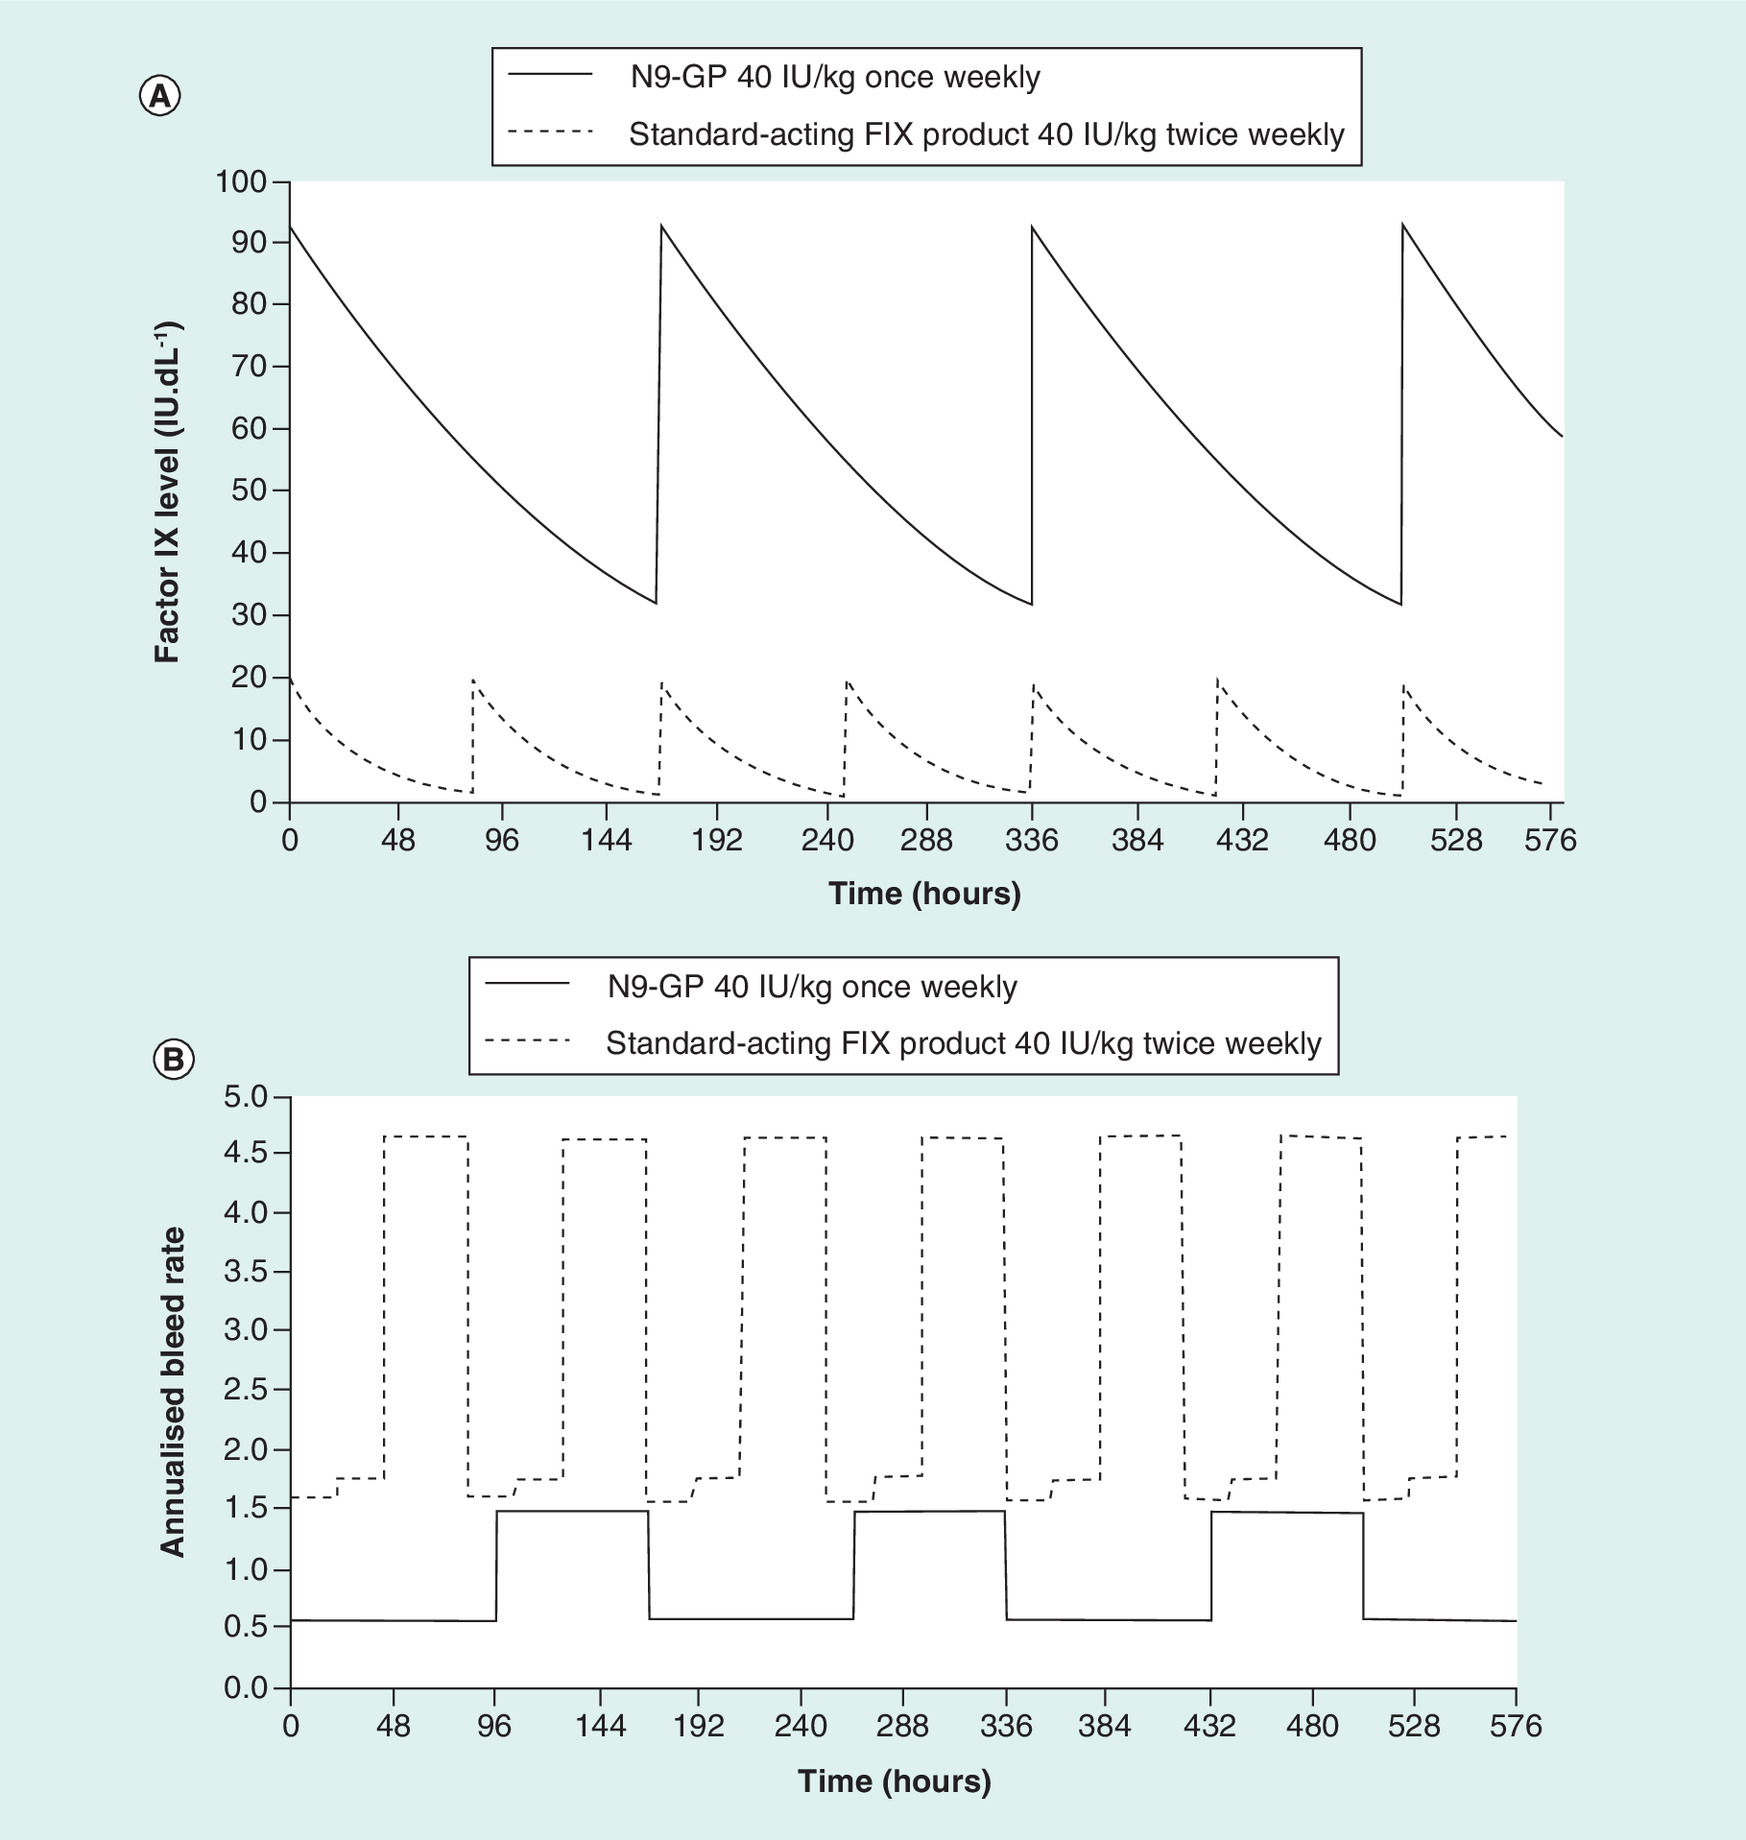
Figure 3. Calculated factor IX activity level and probability of bleed over time.
(A) Calculated FIX activity level over time profiles for N9-GP and a standard-acting FIX product; (B) the probability of bleed over time for a patient without TJs. For N9-GP, a once-weekly dose of 40 IU/kg is assumed; for the standard-acting FIX product a twice weekly dose of 40 IU/kg is assumed [8,18]. This analysis is based on a one-compartmental pharmacokinetic model for both products.
FIX: Factor IX; IU/kg: International unit per kilogram; N9-GP: Nonacog beta pegol; TJ: Target joint.
Simulating different PPx regimens: bleeding risk over time
The pharmacodynamic and PK modeling results were combined in calculating the probability of experiencing a bleed over time (Figure 3). The annual probability of experiencing a bleed ranges between 0.56 and 1.49 for N9-GP and 1.60 and 4.65 for the standard-acting FIX product. Calculated monthly probabilities of experiencing a bleed are presented in Table 5.
Correlating bleeding rates to TJ status for N9-GP
Curves were fit to the data presented in Table 3 and the predicted monthly joint bleed rates (Figure 2). As the number of joint bleeds per year increases, the probability of going from one or more TJs to no TJ decreases, while the probability of going from none to at least one TJ increases. These curves were applied to the calculated joint bleed rates for both model arms to predict the probability of change in joint status.
Simulating different PPx regimens: TJ status over time
Using outcomes from the pharmacodynamic and PK modeling, it was shown that the average number of bleeds at the end of the 1-year time horizon experienced by N9-GP patients was 2.40 bleeding episodes, while patients treated with the comparator product experienced 4.47 bleeding episodes. At the end of the 5-year time horizon, taking into account the change in TJ status, the average total number of bleeds experienced was 7.29 and 21.96 for N9-GP and the standard-acting FIX product, respectively (Table 6). After 5 years, the proportion of patients alive with at least one TJ were 0.4 and 47.5% for the respective model arms (Table 6).
Discussion
The current model serves as a starting point for assessing the added value of new products coming to the market for the treatment of hemophilia B. Lacking a direct comparative trial, the approach assumes that PK data may be less dependent on trial-specific circumstances than efficacy data. Therefore, this approach predicts the efficacy of different FIX products based on the observed link between PK and efficacy for one of them (N9-GP) combined with the PK properties, and labeled dosing regimens for the standard-acting product; this allows an alternative way of indirect comparison between different FIX products for the prophylactic treatment of hemophilia B.
The regression analysis on N9-GP patient-level data implies a statistically significant relationship between FIX activity level and the probability of experiencing bleeds. This exposure–response relationship, assumed to apply equally to the different products uses, causes the number of expected bleeds over time to be higher for the standard-acting FIX product compared with N9-GP. This, in turn, results in better long-term outcomes for N9-GP regarding the proportion of patients with TJs and the number of surgeries required to treat TJs.
While the model reproduces the N9-GP trial bleeding data well [8], the agreement with the reported data for standard-acting FIX products is not so good. However, the model predictions do fall within the 95% CI reported [26]. It was expected that the model would better reproduce the N9-GP than the comparator data, as the regression analysis only included patient-level data for patients treated with this product and not with a standard-acting FIX product. Another reason may be simplification of the model by using a one-compartmental PK model for all products.
Furthermore, the assessment of bleeds is performed by patients and is thus subjective; this, among other things, makes results from different trials less comparable. Many episodes that are reported as a joint bleed might actually be pain from chronic arthropathy that is misinterpreted by the patient [27,28]. This could explain the reporting of spontaneous bleeds in the trial for N9-GP, which occurred despite patients having normal FIX activity levels. Additionally, the relatively high traumatic bleed rates that were reported may be due to patients being more active because they feel better protected due to higher FIX activity levels (which could result in improved health-related quality of life); however, there are no data available to confirm this causality. Such limitations will be difficult to overcome until more objective ways of assessing bleeds are identified.
The big difference in number of bleeds between the two products after 5 years is partly due to the expected difference in the number of TJs in the two populations. A part of the difference may however also be explained by the high level of uncertainty in the current analysis. Apart from the uncertainties already discussed, the Paradigm2 trial had a treatment duration of only 1 year. All estimates made in the model beyond 1 year are based on extrapolation of the available data and the assumption that bleed rates and probabilities of resolving or developing TJs are constant over time.
Patients treated prophylactically with N9-GP only spend a very limited time at low FIX activity levels (<5 IU/dl, no patient in Paradigm2 treated prophylactically with 40 IU/kg once weekly had any FIX activity levels <5 IU/dl). Therefore, the number of observations from PPx patients alone at the lower FIX activity levels is limited, and thus, the rate of bleeding at low FIX activity levels could not be accurately estimated. To provide a more accurate estimate of bleeding rates associated with low FIX activity levels, the patients in the clinical trial that was treated on demand were also included in the analysis, although they were not randomized to be treated in this way. This is an important limitation of the analysis, as the nonrandomization of patients over the arms may have introduced bias.
In this model, a fixed-dosing schedule is used, as described in the label of the products. It has been suggested that this may not represent dosing in clinical practice, which may deviate from that prescribed in the label. However, as there are insufficient data on actual dosing regimens, we assumed that the average dosing schedule is similar to the prescribed schedule [29–31]. Furthermore, some dosing regimens of EHL products focus on sustaining higher FIX levels, while others focus on extending the interval between doses. This can be seen as a trade-off between protection and convenience. Therefore, the efficacy modeled in the current model is largely dependent on the dosing regimen assumed, and could thus be different from the efficacy in clinical practice.
Conclusion
The current model can serve as an example of a tool to assess the potential differences between FIX products in the new era of improved patient choice. It is the first attempt at closing the gaps between the available evidence and the evidence required for potential future payer assessments. The validity of the model can be improved as more data become available to base assumptions on. In particular, quantifying the link between FIX activity levels and bleed risk requires further research. It is also important that there is a continuous focus on the standardization of end points across clinical trial programs in hemophilia, such as the alignment around the assessment of TJs and the method for reporting bleeds. We believe that, once more robust data are available, a model such as the current one could also be used to assess differences between multiple EHL products. This type of model could potentially also be used for hemophilia A, where there is a similar lack of comparative evidence.
| Trial arm | Number of patients | Total patient years | Total bleeds | ABR | TJs at baseline, n | TJs resolved, n (%) | New TJs, n |
|---|---|---|---|---|---|---|---|
| OD | 15 | 7.73 | 143 | 18.5 | 20 | 5 (20%)† | 4 |
| PPx, 10 IU/kg | 30 | 28.97 | 143 | 4.56 | 24 | 7 (29%) | 5 |
| PPx, 40 IU/kg | 29 | 27.91 | 70 | 2.51 | 24 | 16 (67%) | 0 |
† OD patients were followed up for 6 months, while PPx patients were followed up for 12 months.
ABR: Annualized bleed rate; IU/kg: International unit per kilogram; OD: On demand; PPx: Prophylaxis; TJ: Target joint.
Data taken from [8].
| FIX product | Parameter | Value in standard units | Standard units | Ref. |
|---|---|---|---|---|
| N9-GP | MRT | 156.1 | h | [15] |
| Vss | 65.6† | ml/kg | ||
| CL | 0.42 | ml/h/kg | ||
| Standard-acting FIX product | MRT | 32.24 | h | [17] |
| Vss | 220 | ml/kg | ||
| CL | 6.81 | ml/h/kg |
†Not reported, calculated from Vss = MRT × CL.
CL: Clearance rate; FIX: Factor IX; h: Hour; kg: Kilogram; ml: Milliliter; MRT: Mean residence time; N9-GP: Nonacog beta pegol; Vss: Volume at steady state.
| Trial arm | Total patients (N) | At baseline | After 1 year | Probabilities | |||
|---|---|---|---|---|---|---|---|
| n with ≥1 TJ | Total TJs | n from ≥1 to 0 TJ | n from 0 to ≥1 TJ | from ≥1 to 0 TJ | from 0 to ≥1 TJ | ||
| 10 IU/kg | 30 | 13 | 24 | 1 | 1 | 0.08 | 0.06 |
| 40 IU/kg | 29 | 15 | 24 | 9 | 0 | 0.6 | 0 |
IU/kg: International unit per kilogram; n: Number; TJ: Target joint.
Data taken from [19].
| Parameters | Value used in the model | Source |
|---|---|---|
| Baseline patient characteristics | ||
| Age | 31 years | Paradigm™2 |
| Weight | 73.7 kg | Paradigm2 |
| No TJ | 46% | Paradigm2 |
| ≥1 TJ | 54% | Paradigm2 |
| Probabilities | ||
| Probability bleed is severe | 0.005 | Paradigm2 |
| At 12 months, probability of going from ≥1 to 0 TJ – N9-GP 40 IU/kg once weekly | 0.60 | Paradigm2 |
| At 12 months, probability of going from 0 to ≥1 TJ – N9-GP 40 IU/kg once weekly | 0.00 | Paradigm2 |
| At 12 months, probability of going from ≥1 to 0 TJ – standard-acting FIX product 40 IU/kg twice weekly | 0.06 | Calculated |
| At 12 months, probability of going from 0 to ≥1 TJ – standard-acting FIX product 40 IU/kg twice weekly | 0.07 | Calculated |
| Monthly probability of synovectomy | 0.004 | O'Hara [20] |
| Probability synovectomy is successful | 0.75 | Rodrigues-Merchan and Wiedel [21] |
| Monthly probability of joint replacement surgery | 0.011 | O'Hara [20] |
FIX: Factor IX; IU/kg: International unit per kilogram; TJ: Target joint.
| Health state | Total bleeds | Joint bleeds | Traumatic bleeds | Spontaneous bleeds |
|---|---|---|---|---|
| Treated with N9-GP 40 IU/kg once weekly, no TJ | 0.079 | 0.039 | 0.040 | 0.020 |
| Treated with N9-GP 40 IU/kg once weekly, ≥1 TJ | 0.304 | 0.216 | 0.094 | 0.126 |
| Treated with standard-acting FIX product 40 IU/kg twice weekly, no TJ | 0.148 | 0.067 | 0.033 | 0.054 |
| Treated with standard-acting FIX product 40 IU/kg twice weekly, ≥1 TJ | 0.566 | 0.370 | 0.078 | 0.333 |
FIX: Factor IX; IU/kg: International unit per kilogram; N9-GP: Nonacog beta pegol; TJ: Target joint.
| Outcome | Mean ABR reported (95% CI) | Cumulative after 1 year | Cumulative after 5 years | |||
|---|---|---|---|---|---|---|
| N9-GP [8] | Standard-acting FIX product [21] | N9-GP | Standard-acting FIX product | N9-GP | Standard-acting FIX product | |
| ABR total bleeds | 2.51 (1.42–4.43) | 2.6 (-0.1 to 5.3) | 2.40 | 4.47 | 7.29 | 21.96 |
| ABR joint bleeds | 1.94 (0.98–3.82) | 1.9 (SD: 4.5) | 1.61 | 2.76 | 4.33 | 13.52 |
| ABR traumatic bleeds | 1.29 (0.76–2.19) | 1.3 (SD: 2.4) | 0.82 | 0.69 | 2.99 | 3.41 |
| ABR spontaneous bleeds | 1.22 (0.48–3.10) | 1.7 (SD: 2.4) | 0.93 | 2.44 | 2.41 | 11.96 |
| Synovectomies | N/A | N/A | 0.03 | 0.03 | 0.04 | 0.13 |
| Joint replacement surgeries | N/A | N/A | 0.00 | 0.00 | 0.01 | 0.03 |
| Proportion of alive patients with ≥1 TJ | N/A | N/A | 20.8% | 52.5% | 0.4% | 47.5% |
There are a lack of head-to-head comparisons between factor IX (FIX) products used for the prophylactic treatment of hemophilia B to prevent bleeding episodes, and therefore, payers struggle to assess the relative clinical value of new products.
We aimed to develop a modeling approach to compare the clinical outcomes of nonacog beta pegol (N9-GP) with a standard-acting FIX product.
Patient-level data for N9-GP were used to link FIX activity levels to bleed rates, and published PK parameters were used to estimate FIX activity over time for patients treated with either N9-GP or the comparator.
From these, the probability of experiencing a bleed was estimated for both treatment arm, which was used as an input for a Markov model, estimating the presence of target joints (TJs), and annualized bleed rates (ABRs) over a 5-year time horizon.
Higher FIX activity levels showed statistically significantly reduced ABRs (p < 0.001).
Patients with ≥1 target joints showed significantly higher bleed rates compared with patients with none (p < 0.001).
When FIX activity levels and bleed risks were applied to the Markov model, estimated mean ABRs for N9-GP and its comparator were 2.40 and 6.36, respectively.
Despite the absence of direct comparative data, modeling can be used to compare the long-term effectiveness of FIX products.
The current model provides a good starting point for assessing the added value of new products coming to the market, and can be improved as more data become available.
Financial & competing interests disclosure
Financial support for this study was provided entirely by a contract with Novo Nordisk A/S. The funding agreement ensured the authors’ independence in designing the study, interpreting the data, writing, and publishing the report. CS Hoxer and AV Groth are employees of Novo Nordisk A/S. M van Keep and M Hemstock are, and C Knight was, employees of BresMed, which was paid by Novo Nordisk A/S to conduct this research. The authors have no other relevant affiliations or financial involvement with any organization or entity with a financial interest in or financial conflict with the subject matter or materials discussed in the manuscript apart from those disclosed.
No writing assistance was utilized in the production of this manuscript.
Ethical conduct of research
Study Paradigm™2 was conducted in accordance with the Declaration of Helsinki and ICH Good Clinical practice. For trial sites in the USA, the 21 Code of Federal Regulations parts 312, 50 and 56 were followed. The study protocol and amendments were reviewed and approved according to local regulations by appropriate health authorities, and by independent ethics committees/Institutional Review Boards.
Subjects or their legally acceptable representatives provided their written consent to participate in the study after having been informed about the nature and purpose of the study, participation/termination conditions, and risks and benefits of treatment. Informed consent was obtained after the study was fully explained and before the performance of any study-related activity.
Supplementary Material
File (suppl_info.docx)
- Download
- 67.67 KB
References
Papers of special note have been highlighted as: • of interest; •• of considerable interest
1.
European Medicines Agency (EMA). Guideline on clinical investigation of recombinant and human plasma-derived factor IX products (2015). www.ema.europa.eu/docs/en_GB/document_library/Scientific_guideline/2015/06/WC500187413.pdf
• Shows that comparison with other factor IX products is not required following the EMA guidelines for clinical trials in this disease area.
2.
Srivastava A, Brewer A, Mauser-Bunschoten E et al. Guidelines for the management of hemophilia. Haemophilia 19(1), e1–e47 (2013).
3.
Guidelines for the Management of Haemophilia in Australia. Australian Haemophilia Centre Directors’ Organisation, National Blood Authority Australia (2016). www.blood.gov.au/haemophilia-guidelines
4.
Keeling D, Tait C, Makris M. Guideline on the selection and use of therapeutic products to treat haemophilia and other hereditary bleeding disorders. Haemophilia 9(1), 1–23 (2008).
5.
Nordic Hemophilia Guidelines. Nordic Hemophilia Council Guideline Working Group (2015). http://nordhemophilia.org/library/Files/PDF-skjol/NordicGuidelinesCongenitalHemophilia2015.pdf
6.
Manucci PM, Mancuso ME, Santagostino E. How we choose factor VIII to treat hemophilia. Blood 119(18), 4108–4114 (2012).
7.
Berntorp E, Andersson N. Prophylaxis for hemophilia in the era of extended half-life factor VIII/factor IX products. Semin. Thromb. Hemost. 42(5), 518–525 (2016).
8.
Clinical trials database: NCT01333111. https://clinicaltrials.gov/ct2/show/NCT01333111
9.
Powell JS, Pasi KJ, Ragni MV et al. Phase III study of recombinant factor IX Fc fusion protein in hemophilia B. N. Engl. J. Med. 369(24), 2313–2323 (2013).
10.
Santagostino E, Martinowitz U, Lissitchkov T et al. Long acting recombinant coagulation factor IX albumin fusion protein (rIX-FP) in hemophilia B: results of a Phase III trial. Blood 127(14), 1761–1769 (2016).
11.
Den Uijl I, Fischer K, Van Der Bom J, Grobbee D, Rosendaal F, Plug I. Analysis of low frequency bleeding data: the association of joint bleeds according to baseline FVIII activity levels. Haemophilia 17(1), 41–44 (2011).
•• Publication showing the link between factor activity levels and joint bleed rates, which has been the basis for the key assumption for our model.
12.
Oldenburg J. Optimal treatment strategies for hemophilia: achievements and limitations of current prophylactic regimens. Blood 12513 2038–2044, (2015).
13.
Manco-Johnson MJ, Abshire TC, Shapiro AD et al. Prophylaxis versus episodic treatment to prevent joint disease in boys with severe hemophilia. N. Engl. J. Med. 357(6), 535–544 (2007).
14.
Soucie M, Monahan PE, Mazepa M, Kulkarnni R, Konkle BA. Relations between factor level activity and joint bleeding in a large cohort of males with mild and moderate hemophilia in the United States. Presented at: 2015 ISTH Congress. Toronto, Canada, 20–25 June 2015.
•• Hypothesis for the link between factor activity levels and joint bleed rates in hemophilia B.
15.
Collins PW, Young G, Knobe K et al. Recombinant long-acting glycoPEGylated factor IX in hemophilia B: a multinational randomised Phase III trial. Blood 124(26), 3880–3886 (2014).
16.
Zeileis A, Kleiber C, Jackman S. Regression models for count data in R. J. Stat. Softw. 27(8), 1–25 (2008).
17.
Windyga J, Lissitchkov T, Stasyshyn O et al. Pharmacokinetics, efficacy and safety of BAX326, a novel recombinant factor IX: a prospective, controlled, multicentre Phase I/III study in previously treated patients with severe (FIX level <1%) or moderately severe (FIX level </=2%) haemophilia B. Haemophilia 20(1), 15–24 (2014).
18.
Pfizer Limited. BeneFIX summary of product characteristics (SPC) (2016). www.ema.europa.eu/ema/index.jsp?curl=pages/medicines/human/medicines/000139/human_med_000671.jsp&mid=WC0b01ac058001d124
19.
Negrier C, Young G, Abdul Karim F et al. Recombinant long-acting glycoPEGylated factor IX (nonacog beta pegol) in haemophilia B: assessment of target joints in multinational Phase III clinical trials. Haemophilia 22(4), 507–513 (2016).
20.
Mazza G, O'hara J, Carroll L, Camp C, Hoxer C, Wilkinson L. The relationship between target joints and direct resource use in severe haemophilia. Presented at: ISPOR 19th Annual European Congress (PSY53), Vienna, Austria, 29 October–2 November 2016.
21.
Rodriguez-Merchan E, Wiedel J. General principles and indications of synoviorthesis (medical synovectomy) in haemophilis. Haemophilia 7(Suppl. 2), 6–10 (2001).
22.
Blanchette V, Key N, Ljung L, Manco-Johnson M, Van Den Berg H, Srivastava A. Definitions in hemophilia: communication from the SSC of the ISTH. J. Thromb. Haemost. 12(11), 1935–1939 (2014).
23.
Blanchette V, Mccready M, Achnu C, Abdolell M, Rivard G, Manco-Johnson M. A survey of factor prophylaxis in boys with haemophilia followed in North American haemophilia treatment centres. Haemophilia 9(Suppl. 1), 19–26 (2003).
24.
Ota S, Mclinont M, Carcao M et al. Definitions for haemophilia prophylaxis and its outcomes: the Canadian consensus study. Haemophilia 13(1), 12–20 (2007).
25.
Gupta S, Siddiqi A, Soucie J et al. The effect of secondary prophylaxis versus episodic treatment on the range of motion of target joints in patients with haemophilia. Br. J. Haematol. 161(3), 424–433 (2013).
26.
Valentino LA, Rusen L, Elezovic I, Smith LM, Korth-Bradley JM, Rendo P. Multicentre, randomized, open-label study of on-demand treatment with two prophylaxis regimens of recombinant coagulation factor IX in haemophilia B subjects. Haemophilia 20(3), 398–406 (2014).
27.
Amby LK, Seremetis S, Obergfell A, Bjerre J. Challenges of defining reliable clinical surrogate end points in haemophilia trials: a critical review. Blood Coagul. Fibrinolysis 20(7), 488–493 (2009).
• Discusses that it is difficult to define good surrogate clinical end points for trials in hemophilia.
28.
Nugent D, Kalnins W, Querol F et al. Haemophilia Experiences, Results and Opportunities (HERO) study: treatment-related characteristics of the population. Haemophilia 21(1), e26–e38 (2015).
29.
Croteau SE, Neufeld EJ. Transition considerations for extended half-life products. Haemophilia 21(3), 285–288 (2015).
30.
Croteau SE, Saxenna K, Neufeld EJ. Correlation between dispensed and prescribed doses of factor products for bleeding disorder: can a small, centre-based pharmacy hit the mark? Haemophilia 21(2), 190–195 (2015).
31.
Krishnan S, Buckley B, Brennan A, Wong WY. Response to Croteau and Neufeld Editorial: ‘transition considerations for extended half-life factor products’. Haemophilia 21(5), e41–e453 (2015).
Information & Authors
Information
Published In
Copyright
© 2017 Future Medicine Ltd.
History
Published online: 30 May 2017
Keywords:
Topics
Authors
Metrics & Citations
Metrics
Article Usage
Article usage data only available from February 2023. Historical article usage data, showing the number of article downloads, is available upon request.
Citations
How to Cite
A new modeling approach allowing prediction and comparison of the long-term outcomes of treatments for hemophilia B. (2017) Journal of Comparative Effectiveness Research. DOI: 10.2217/cer-2017-0028
Export citation
Select the citation format you wish to export for this article or chapter.
Citing Literature
- Aleksey V. Belyaev, Anass Bouchnita, Vitaly Volpert, Emerging mathematical approaches to blood coagulation and clot formation under flow: From constitutive biophysical laws to integrative multiscale models, Biophysics Reviews, 10.1063/5.0285157, 7, 2, (2026).
- Gary Benson, Tim Morton, Huw Thomas, Xin Ying Lee, Long-Term Outcomes of Previously Treated Adult and Adolescent Patients with Severe Hemophilia A Receiving Prophylaxis with Extended Half-Life FVIII Treatments: An Economic Analysis from a United Kingdom Perspective, ClinicoEconomics and Outcomes Research, 10.2147/CEOR.S280574, Volume 13, (39-51), (2021).
- Ash Bullement, Samuel Thomas McMordie, Anthony James Hatswell, Nanxin Li, Koo Wilson, Cost-Effectiveness Analysis of Recombinant Factor VIII Fc-Fusion Protein (rFVIIIFc) for the Treatment of Severe Hemophilia A in Italy Incorporating Real-World Dosing and Joint Health Data, PharmacoEconomics - Open, 10.1007/s41669-019-0158-8, 4, 1, (133-142), (2019).
- Laura Dormer, Introducing Volume 7 of the Journal of Comparative Effectiveness Research , Journal of Comparative Effectiveness Research, 10.2217/cer-2017-0087, 7, 1, (1-4), (2018).